|
||||||||||||||||||||||||||||||||||||||||||||||||||||||||||||||||||||||||||||||||||||||||||||||||||||||||||||||||||||||||||||||||||||||||||||||||||||||||||||||||||||||||||||||||||||||||||||||||||||||||||||||||||||||||||||||||||||||||||||||||||||||||||||||||||||||||||||||||||||||||||||||||||||||||||||||||||||||||||
| |
| Phenotypic Information (metabolism pathway, cancer, disease, phenome) |
| |
| |
| Gene-Gene Network Information: Co-Expression Network, Interacting Genes & KEGG |
| |
|


| Gene Summary for TEAD2 |
| Top |
| Phenotypic Information for TEAD2(metabolism pathway, cancer, disease, phenome) |
| Cancer | CGAP: TEAD2 |
| Familial Cancer Database: TEAD2 | |
| * This gene is included in those cancer gene databases. |
|
|
|
|
|
| . | ||||||||||||||||||||||||||||||||||||||||||||||||||||||||||||||||||||||||||||||||||||||||||||||||||||||||||||||||||||||||||||||||||||||||||||||||||||||||||||||||||||||||||||||||||||||||||||||||||||||||||||||||||||||||||||||||||||||||||||||||||||||||||||||||||||||||||||||||||||||||||||||||||||||||||||||||||||
Oncogene 1 | Significant driver gene in | |||||||||||||||||||||||||||||||||||||||||||||||||||||||||||||||||||||||||||||||||||||||||||||||||||||||||||||||||||||||||||||||||||||||||||||||||||||||||||||||||||||||||||||||||||||||||||||||||||||||||||||||||||||||||||||||||||||||||||||||||||||||||||||||||||||||||||||||||||||||||||||||||||||||||||||||||||||||||
| cf) number; DB name 1 Oncogene; http://nar.oxfordjournals.org/content/35/suppl_1/D721.long, 2 Tumor Suppressor gene; https://bioinfo.uth.edu/TSGene/, 3 Cancer Gene Census; http://www.nature.com/nrc/journal/v4/n3/abs/nrc1299.html, 4 CancerGenes; http://nar.oxfordjournals.org/content/35/suppl_1/D721.long, 5 Network of Cancer Gene; http://ncg.kcl.ac.uk/index.php, 1Therapeutic Vulnerabilities in Cancer; http://cbio.mskcc.org/cancergenomics/statius/ |
| REACTOME_METABOLISM_OF_LIPIDS_AND_LIPOPROTEINS | |
| OMIM | |
| Orphanet | |
| Disease | KEGG Disease: TEAD2 |
| MedGen: TEAD2 (Human Medical Genetics with Condition) | |
| ClinVar: TEAD2 | |
| Phenotype | MGI: TEAD2 (International Mouse Phenotyping Consortium) |
| PhenomicDB: TEAD2 | |
| Mutations for TEAD2 |
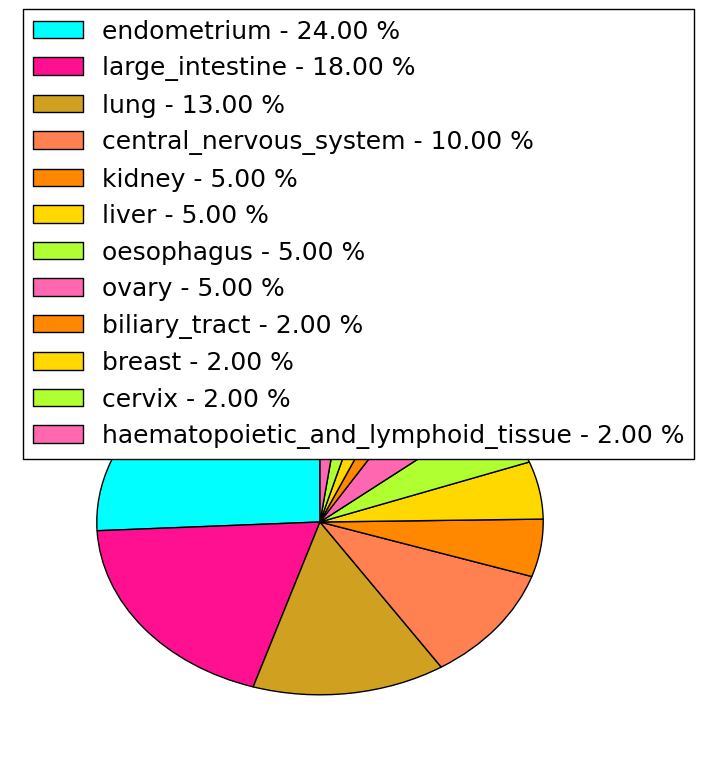
| * Under tables are showing count per each tissue to give us broad intuition about tissue specific mutation patterns.You can go to the detailed page for each mutation database's web site. |
| There's no structural variation information in COSMIC data for this gene. |
| * From mRNA Sanger sequences, Chitars2.0 arranged chimeric transcripts. This table shows TEAD2 related fusion information. |
| ID | Head Gene | Tail Gene | Accession | Gene_a | qStart_a | qEnd_a | Chromosome_a | tStart_a | tEnd_a | Gene_a | qStart_a | qEnd_a | Chromosome_a | tStart_a | tEnd_a |
| BP394212 | TEAD2 | 1 | 127 | 19 | 49844310 | 49844436 | PPY | 128 | 331 | 17 | 42018173 | 42018566 | |
| BG983176 | PHLDB1 | 1 | 143 | 11 | 118498068 | 118498210 | TEAD2 | 129 | 586 | 19 | 49845951 | 49846684 | |
| Top |
| Mutation type/ Tissue ID | brca | cns | cerv | endome | haematopo | kidn | Lintest | liver | lung | ns | ovary | pancre | prost | skin | stoma | thyro | urina | |||
| Total # sample | 2 | 1 | ||||||||||||||||||
| GAIN (# sample) | 2 | 1 | ||||||||||||||||||
| LOSS (# sample) |
| cf) Tissue ID; Tissue type (1; Breast, 2; Central_nervous_system, 3; Cervix, 4; Endometrium, 5; Haematopoietic_and_lymphoid_tissue, 6; Kidney, 7; Large_intestine, 8; Liver, 9; Lung, 10; NS, 11; Ovary, 12; Pancreas, 13; Prostate, 14; Skin, 15; Stomach, 16; Thyroid, 17; Urinary_tract) |
| Top |
|
 |
| Top |
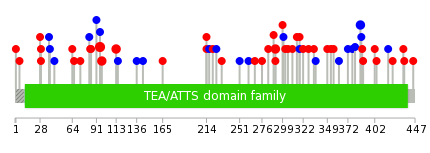
| Stat. for Non-Synonymous SNVs (# total SNVs=37) | (# total SNVs=12) |
 |  |
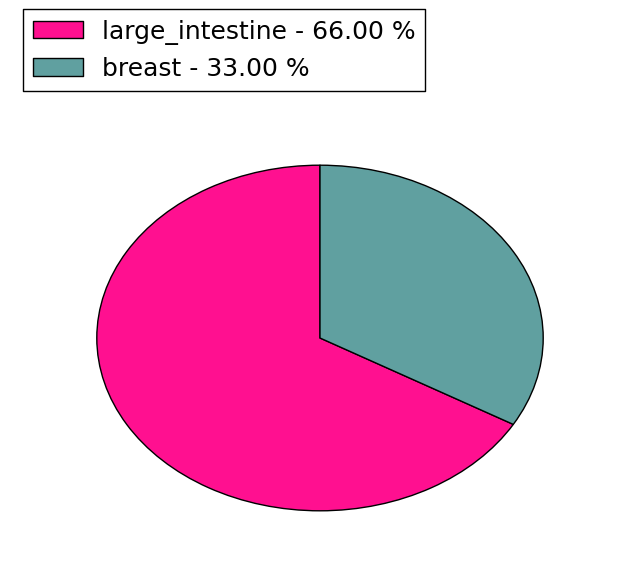
(# total SNVs=24) | (# total SNVs=3) |
 |  |
| Top |
| * When you move the cursor on each content, you can see more deailed mutation information on the Tooltip. Those are primary_site,primary_histology,mutation(aa),pubmedID. |
| GRCh37 position | Mutation(aa) | Unique sampleID count |
| chr19:49850473-49850473 | p.H295fs*12 | 18 |
| chr19:49850472-49850473 | p.H295fs*19 | 3 |
| chr19:49862705-49862705 | p.R95Q | 3 |
| chr19:49858607-49858608 | p.P144fs*15 | 3 |
| chr19:49845767-49845767 | p.F386F | 2 |
| chr19:49850484-49850484 | p.R291H | 2 |
| chr19:49860531-49860531 | p.R113K | 2 |
| chr19:49852054-49852054 | p.S214W | 2 |
| chr19:49862699-49862699 | p.R97Q | 2 |
| chr19:49862706-49862706 | p.R95R | 2 |
| Top |
|
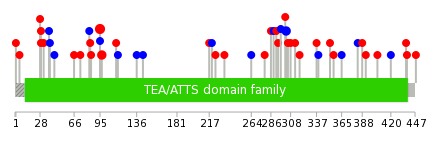 |
| Point Mutation/ Tissue ID | 1 | 2 | 3 | 4 | 5 | 6 | 7 | 8 | 9 | 10 | 11 | 12 | 13 | 14 | 15 | 16 | 17 | 18 | 19 | 20 |
| # sample | 3 | 1 | 1 | 5 | 2 | 1 | 1 | 4 | 6 | 3 | 4 | 9 | 11 | |||||||
| # mutation | 3 | 1 | 1 | 6 | 2 | 1 | 1 | 5 | 6 | 3 | 5 | 9 | 11 | |||||||
| nonsynonymous SNV | 2 | 1 | 1 | 5 | 1 | 1 | 1 | 4 | 2 | 4 | 5 | 9 | ||||||||
| synonymous SNV | 1 | 1 | 1 | 1 | 4 | 2 | 1 | 1 | 4 | 2 |
| cf) Tissue ID; Tissue type (1; BLCA[Bladder Urothelial Carcinoma], 2; BRCA[Breast invasive carcinoma], 3; CESC[Cervical squamous cell carcinoma and endocervical adenocarcinoma], 4; COAD[Colon adenocarcinoma], 5; GBM[Glioblastoma multiforme], 6; Glioma Low Grade, 7; HNSC[Head and Neck squamous cell carcinoma], 8; KICH[Kidney Chromophobe], 9; KIRC[Kidney renal clear cell carcinoma], 10; KIRP[Kidney renal papillary cell carcinoma], 11; LAML[Acute Myeloid Leukemia], 12; LUAD[Lung adenocarcinoma], 13; LUSC[Lung squamous cell carcinoma], 14; OV[Ovarian serous cystadenocarcinoma ], 15; PAAD[Pancreatic adenocarcinoma], 16; PRAD[Prostate adenocarcinoma], 17; SKCM[Skin Cutaneous Melanoma], 18:STAD[Stomach adenocarcinoma], 19:THCA[Thyroid carcinoma], 20:UCEC[Uterine Corpus Endometrial Carcinoma]) |
| Top |
| * We represented just top 10 SNVs. When you move the cursor on each content, you can see more deailed mutation information on the Tooltip. Those are primary_site, primary_histology, mutation(aa), pubmedID. |
| Genomic Position | Mutation(aa) | Unique sampleID count |
| chr19:49862705 | p.R95Q,TEAD2 | 3 |
| chr19:49862699 | p.V303V,TEAD2 | 2 |
| chr19:49850456 | p.R97Q,TEAD2 | 2 |
| chr19:49845839 | p.L339L,TEAD2 | 1 |
| chr19:49863116 | p.R224W,TEAD2 | 1 |
| chr19:49850474 | p.P39P,TEAD2 | 1 |
| chr19:49858608 | p.E337K,TEAD2 | 1 |
| chr19:49846506 | p.A220A,TEAD2 | 1 |
| chr19:49863137 | p.G38G,TEAD2 | 1 |
| chr19:49850485 | p.A318V,TEAD2 | 1 |
| * Copy number data were extracted from TCGA using R package TCGA-Assembler. The URLs of all public data files on TCGA DCC data server were gathered on Jan-05-2015. Function ProcessCNAData in TCGA-Assembler package was used to obtain gene-level copy number value which is calculated as the average copy number of the genomic region of a gene. |
 |
| cf) Tissue ID[Tissue type]: BLCA[Bladder Urothelial Carcinoma], BRCA[Breast invasive carcinoma], CESC[Cervical squamous cell carcinoma and endocervical adenocarcinoma], COAD[Colon adenocarcinoma], GBM[Glioblastoma multiforme], Glioma Low Grade, HNSC[Head and Neck squamous cell carcinoma], KICH[Kidney Chromophobe], KIRC[Kidney renal clear cell carcinoma], KIRP[Kidney renal papillary cell carcinoma], LAML[Acute Myeloid Leukemia], LUAD[Lung adenocarcinoma], LUSC[Lung squamous cell carcinoma], OV[Ovarian serous cystadenocarcinoma ], PAAD[Pancreatic adenocarcinoma], PRAD[Prostate adenocarcinoma], SKCM[Skin Cutaneous Melanoma], STAD[Stomach adenocarcinoma], THCA[Thyroid carcinoma], UCEC[Uterine Corpus Endometrial Carcinoma] |
| Top |
| Gene Expression for TEAD2 |
| * CCLE gene expression data were extracted from CCLE_Expression_Entrez_2012-10-18.res: Gene-centric RMA-normalized mRNA expression data. |
 |
| * Normalized gene expression data of RNASeqV2 was extracted from TCGA using R package TCGA-Assembler. The URLs of all public data files on TCGA DCC data server were gathered at Jan-05-2015. Only eight cancer types have enough normal control samples for differential expression analysis. (t test, adjusted p<0.05 (using Benjamini-Hochberg FDR)) |
 |
| Top |
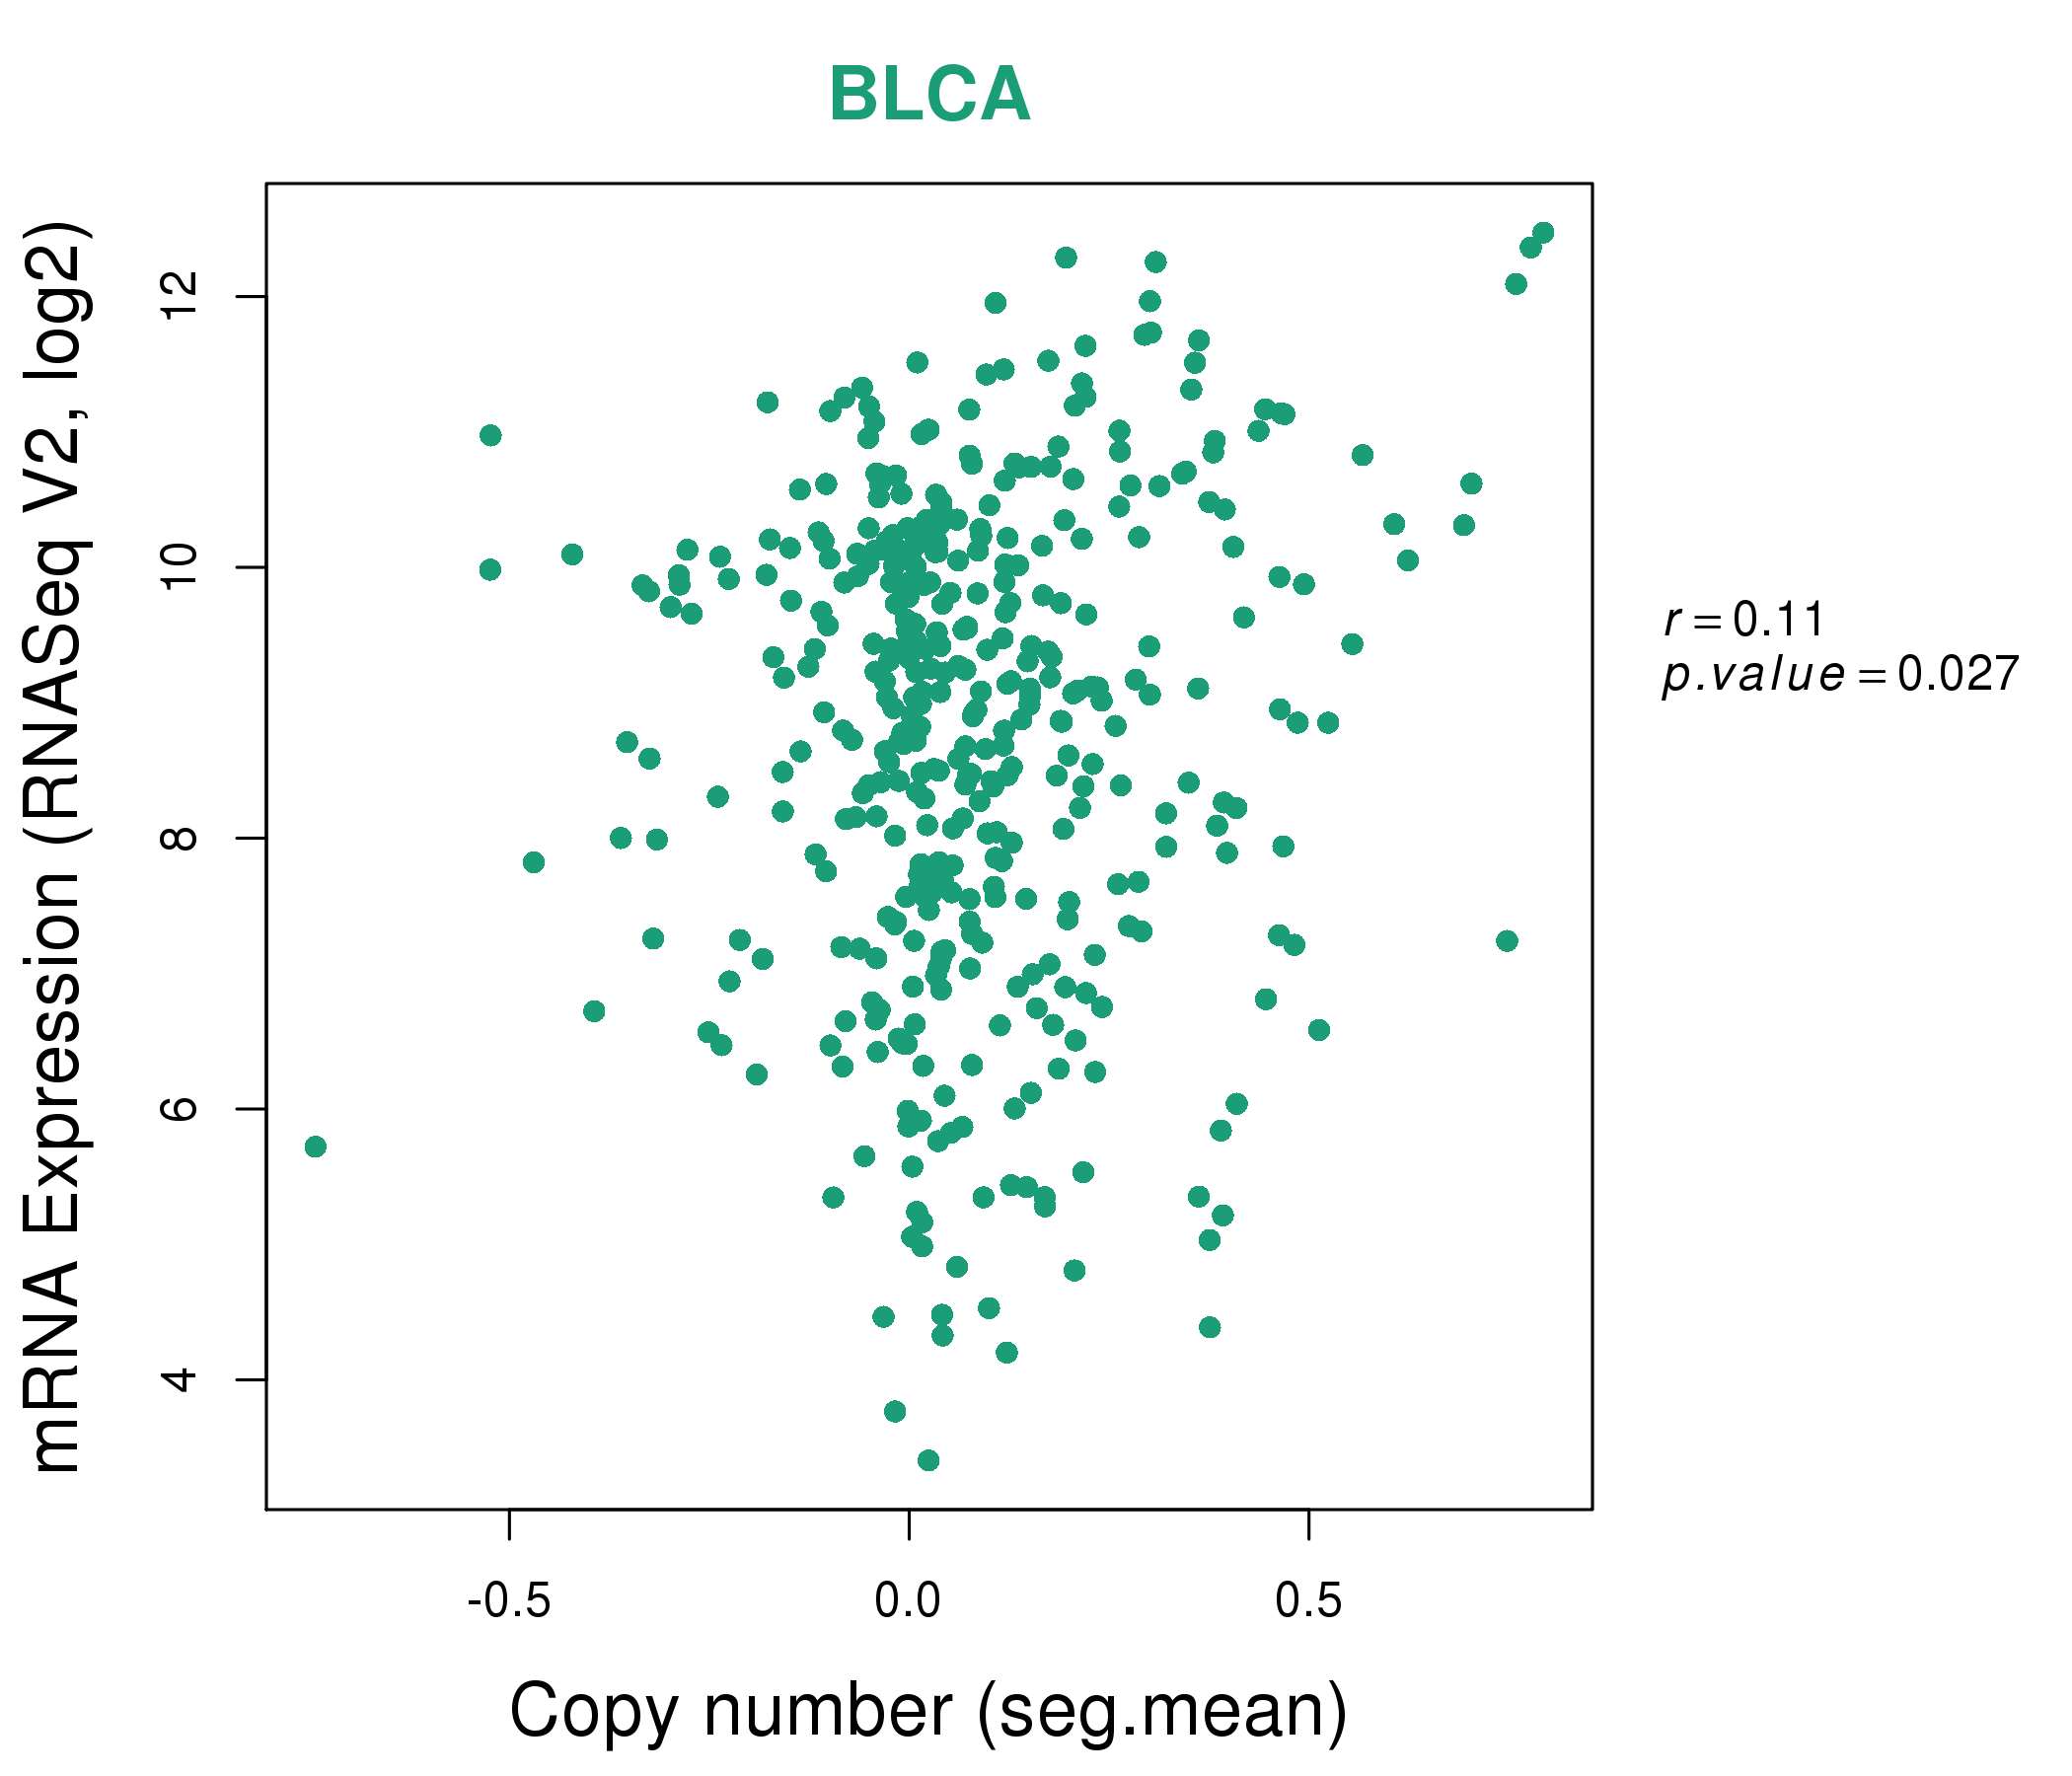
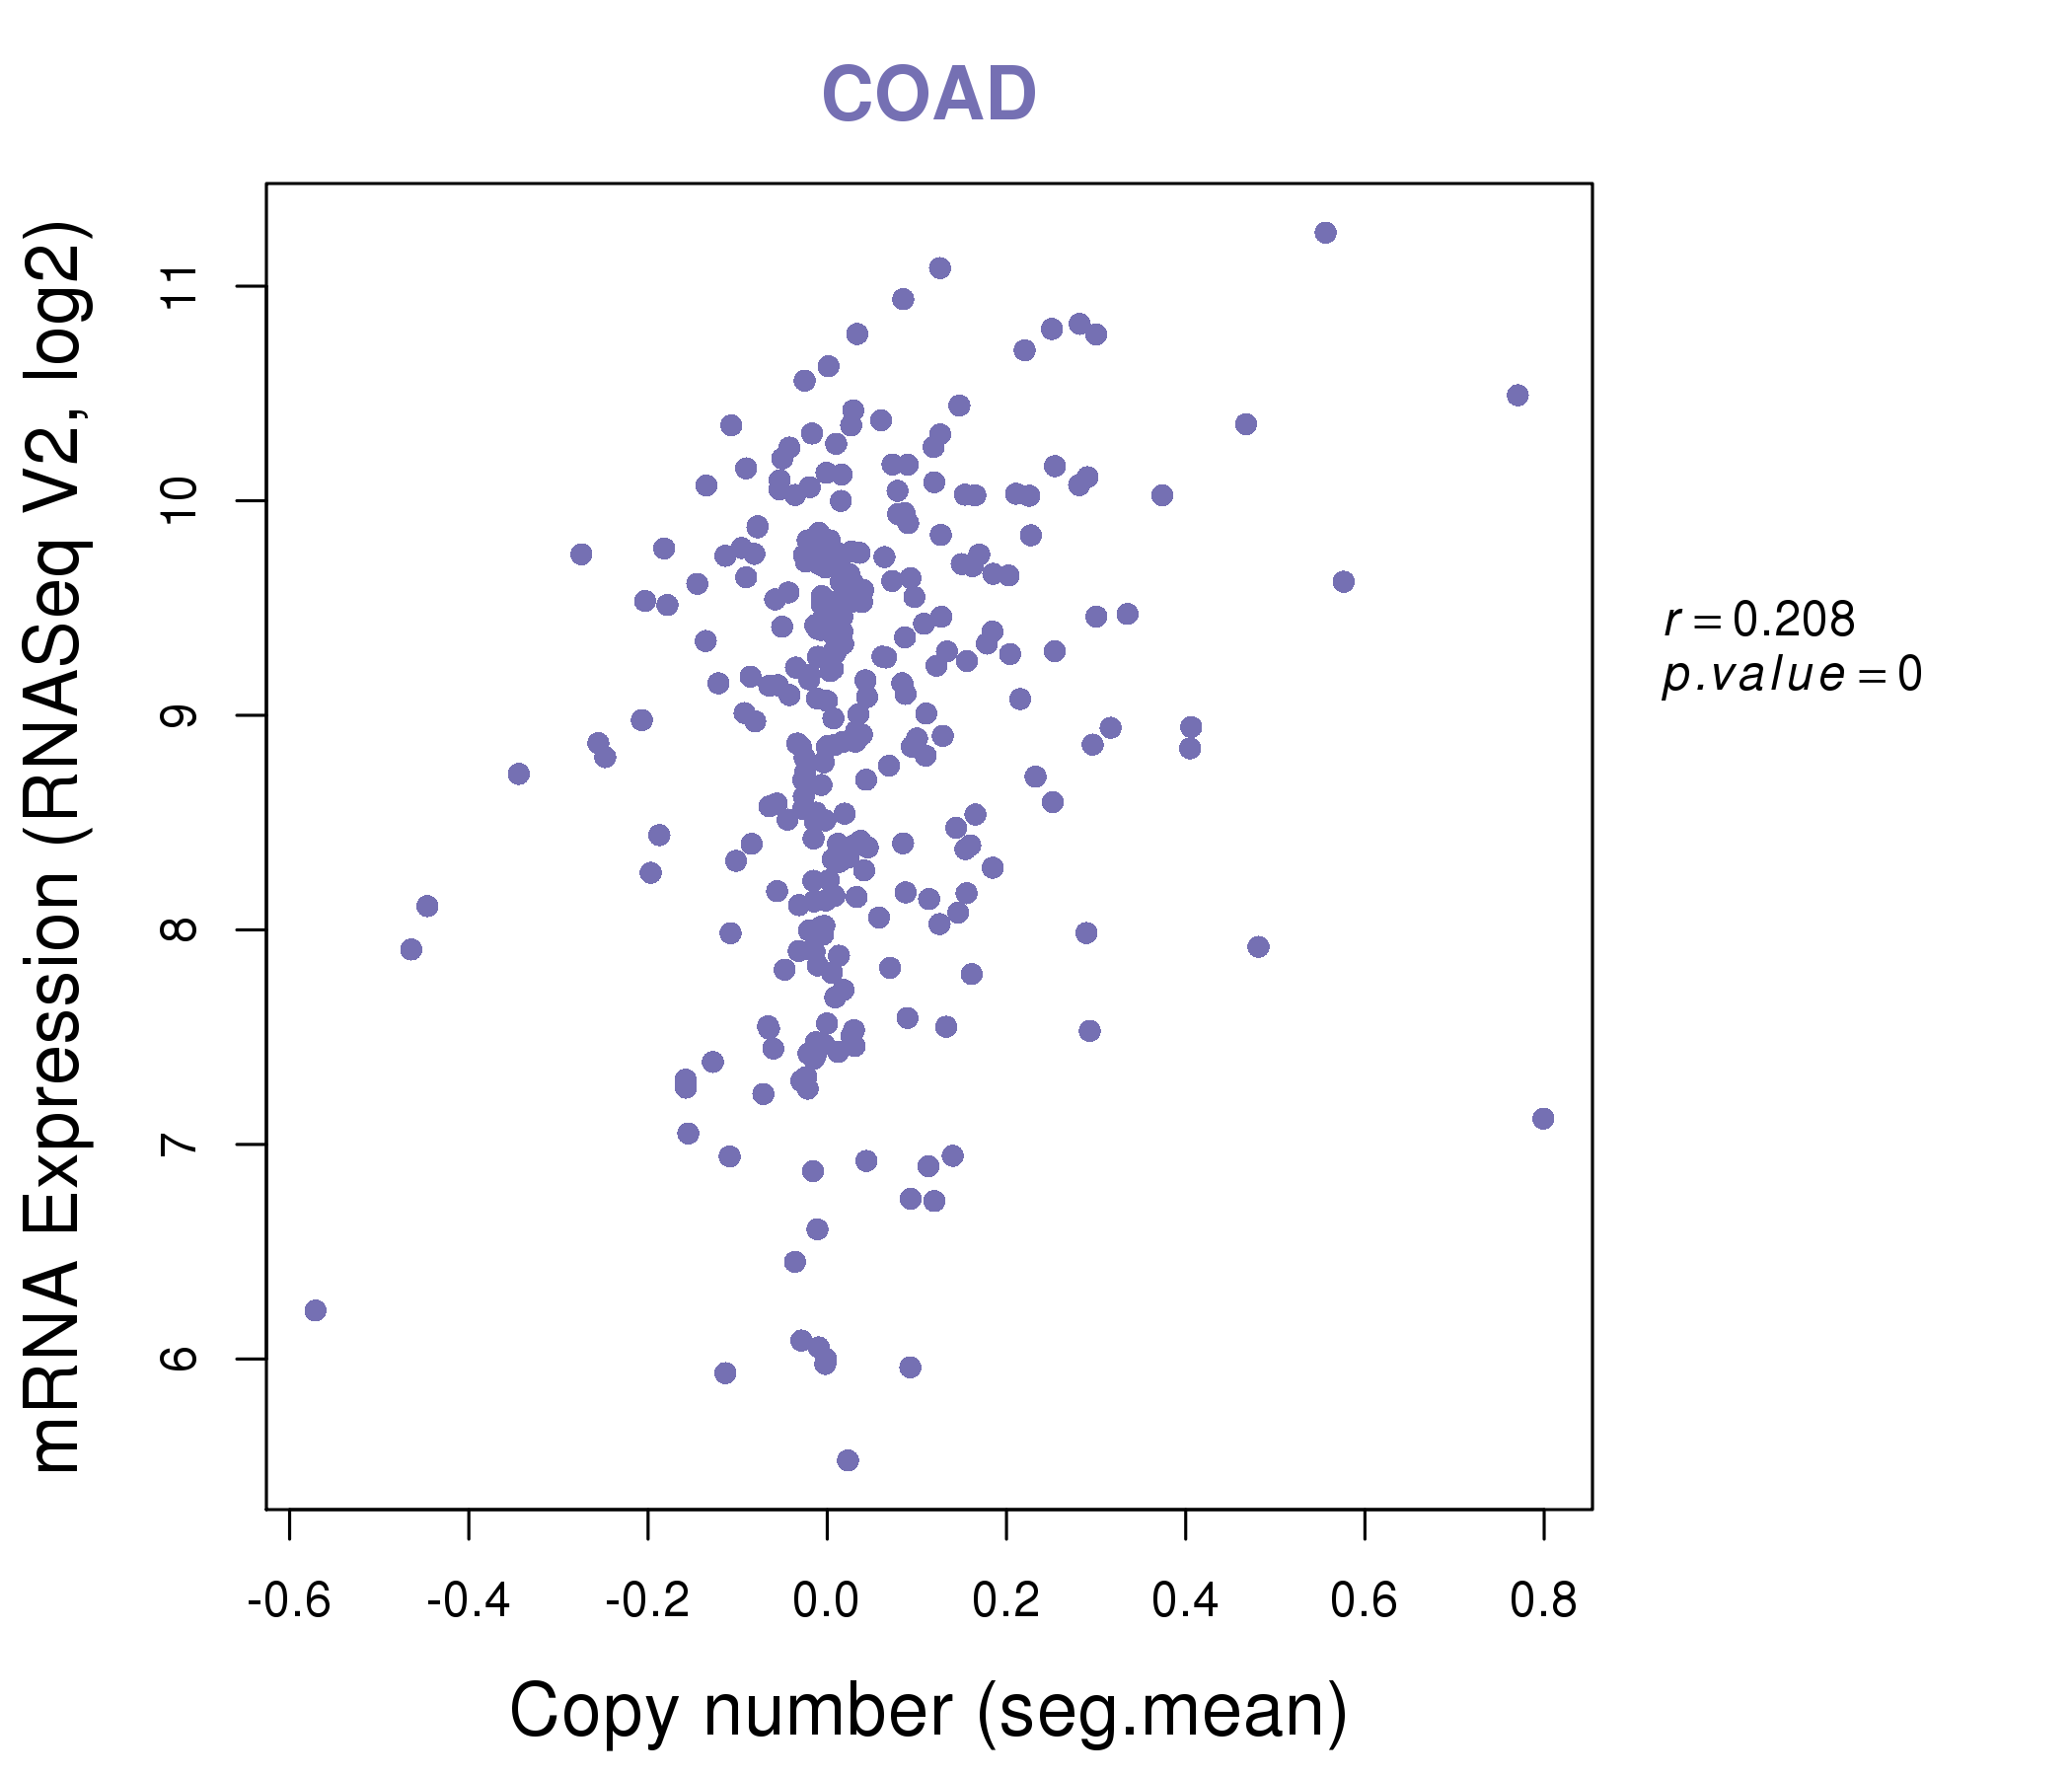
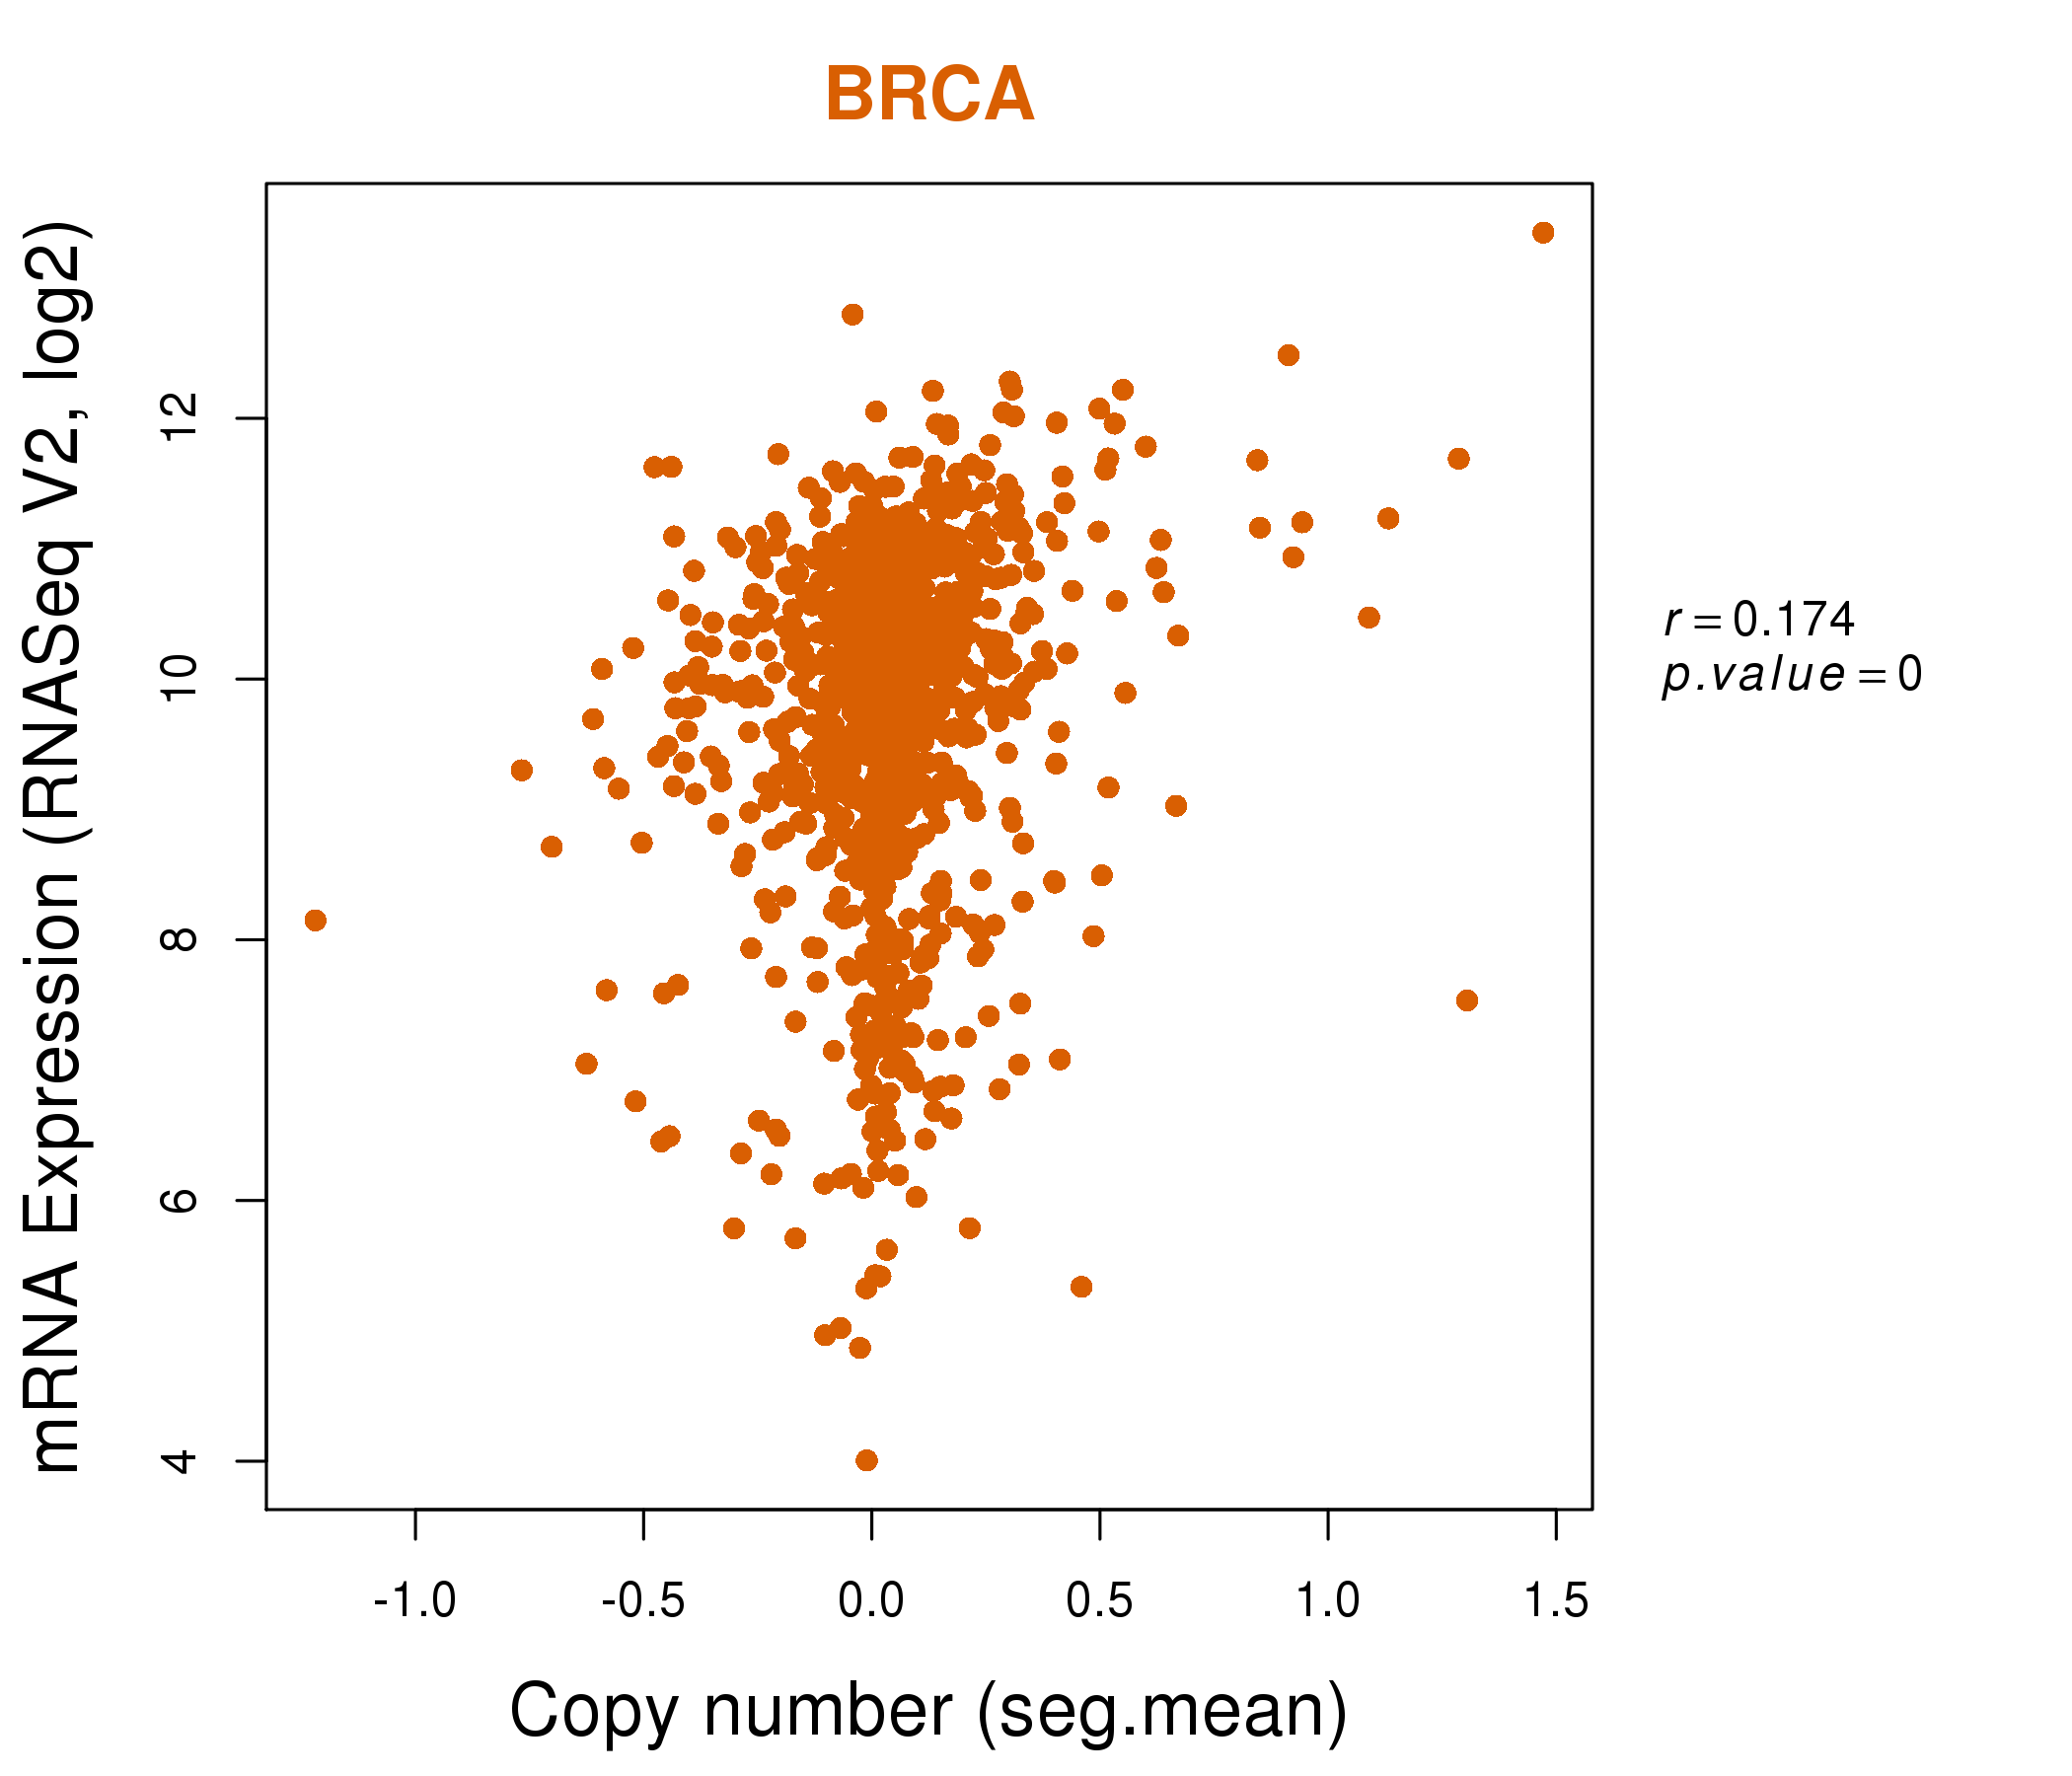
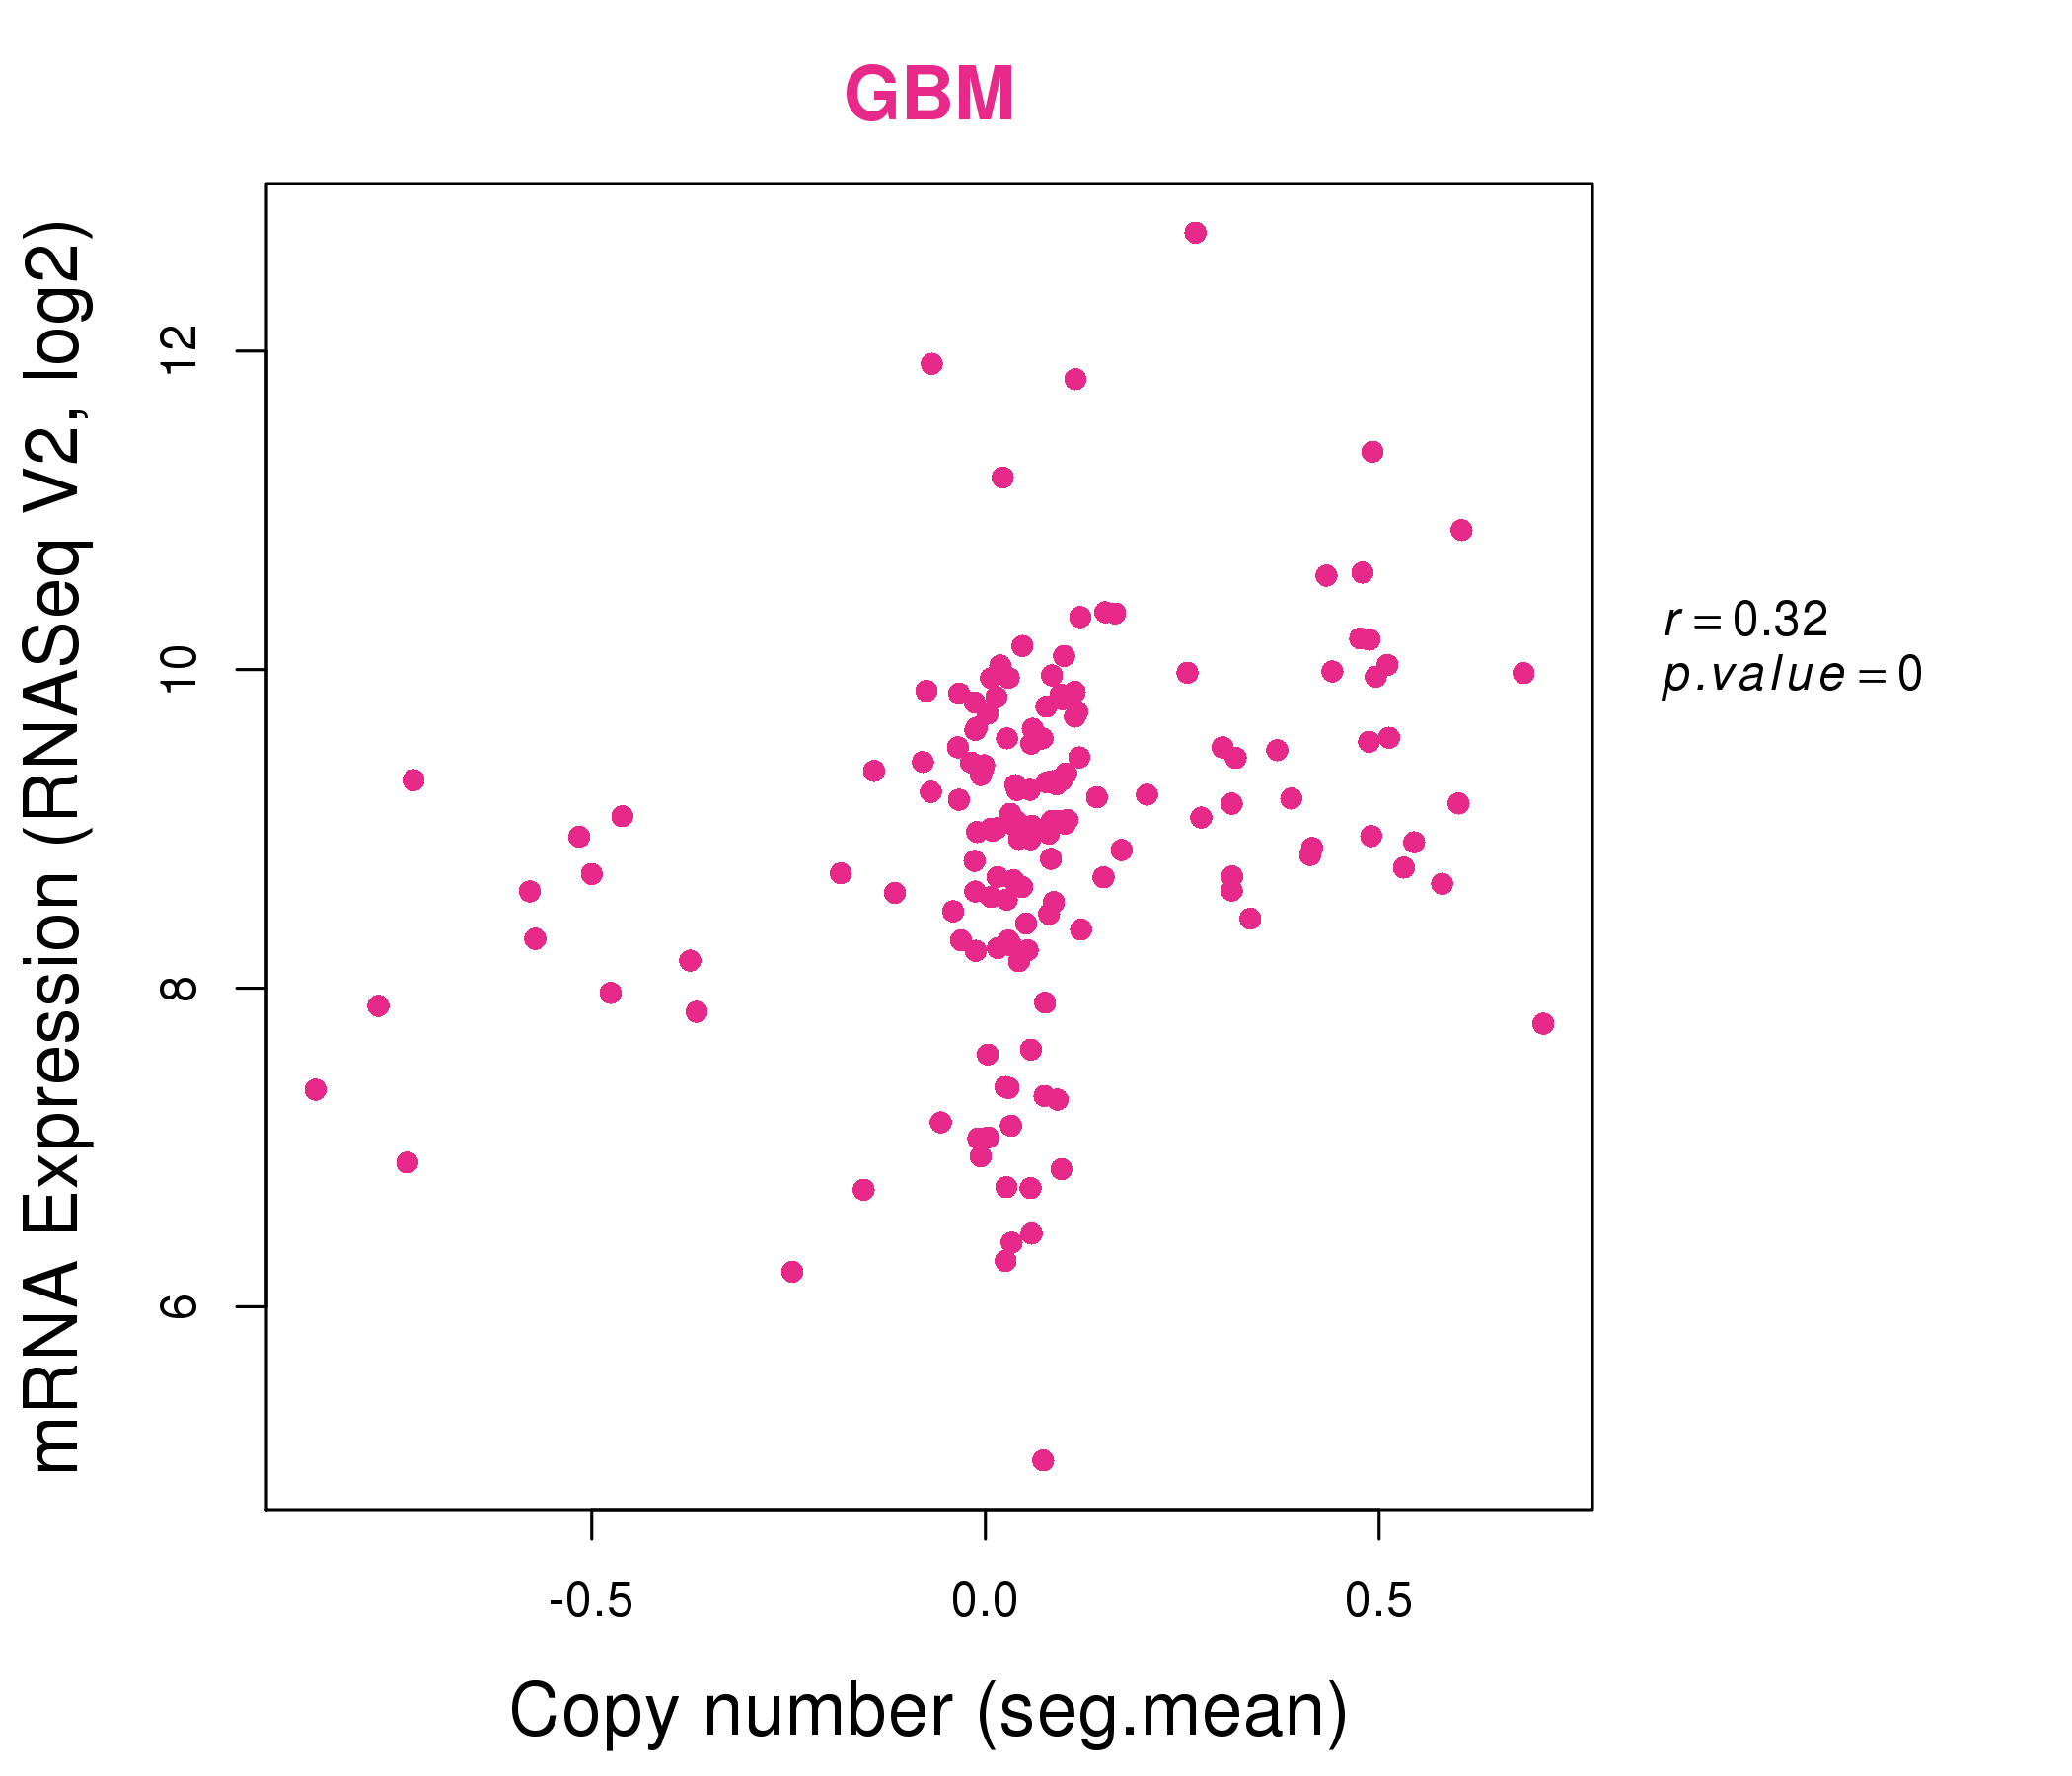
| * This plots show the correlation between CNV and gene expression. |
: Open all plots for all cancer types
 |
|
 |
|
| Top |
| Gene-Gene Network Information |
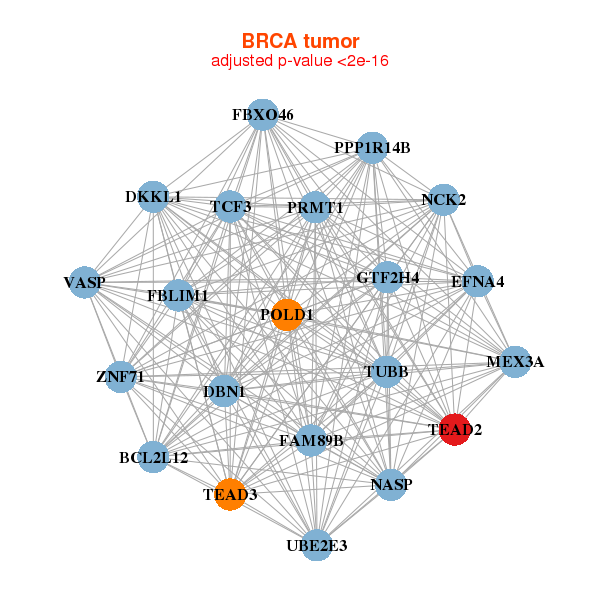
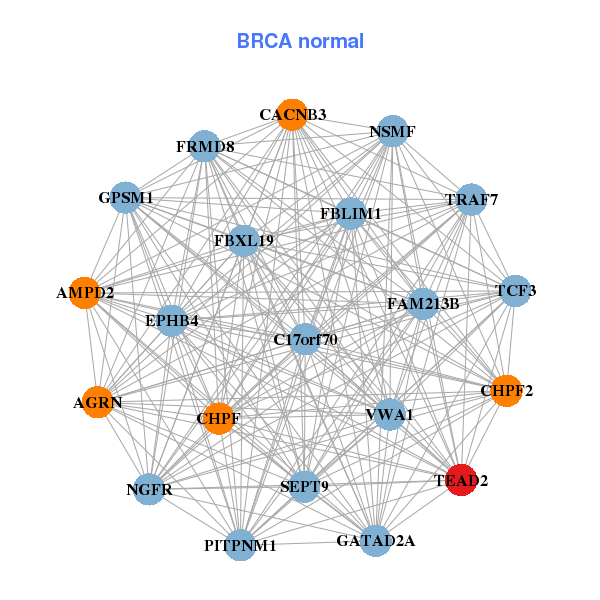
| * Co-Expression network figures were drawn using R package igraph. Only the top 20 genes with the highest correlations were shown. Red circle: input gene, orange circle: cell metabolism gene, sky circle: other gene |
: Open all plots for all cancer types
 |
|
| BCL2L12,DBN1,DKKL1,EFNA4,FAM89B,FBLIM1,FBXO46, GTF2H4,MEX3A,NASP,NCK2,POLD1,PPP1R14B,PRMT1, TCF3,TEAD2,TEAD3,TUBB,UBE2E3,VASP,ZNF71 | AGRN,AMPD2,C17orf70,FAM213B,CACNB3,CHPF2,CHPF, EPHB4,FBLIM1,FBXL19,FRMD8,GATAD2A,GPSM1,NSMF, NGFR,PITPNM1,SEPT9,TCF3,TEAD2,TRAF7,VWA1 |
 |
|
| ZNF503-AS2,NREP,CD46,CNN3,CPA6,DKKL1,ENPP3, GYLTL1B,LGR5,MEX3A,OXGR1,SEMA4C,SETMAR,SH3BP4, SOX4,TEAD2,TET1,THAP2,TLR4,VASH2,ZNF124 | BAG2,CCDC69,CETN2,CFL2,FEZ1,MORN5,MXRA7, PEA15,PLEKHO1,PLN,PSD,PTBP2,PTPLA,RAB23, RAB34,RHOQ,SMARCD3,ST3GAL3,TEAD2,TMEM55A,ZNF25 |
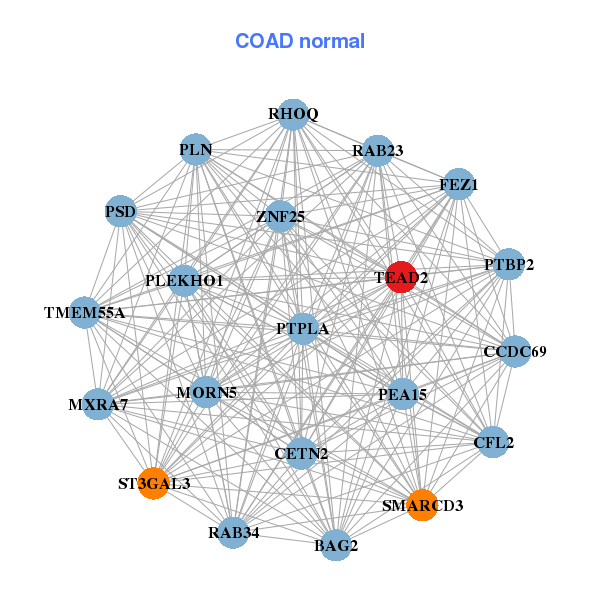
| * Co-Expression network figures were drawn using R package igraph. Only the top 20 genes with the highest correlations were shown. Red circle: input gene, orange circle: cell metabolism gene, sky circle: other gene |
: Open all plots for all cancer types
| Top |
: Open all interacting genes' information including KEGG pathway for all interacting genes from DAVID
| Top |
| Pharmacological Information for TEAD2 |
| There's no related Drug. |
| Top |
| Cross referenced IDs for TEAD2 |
| * We obtained these cross-references from Uniprot database. It covers 150 different DBs, 18 categories. http://www.uniprot.org/help/cross_references_section |
: Open all cross reference information
|
Copyright © 2016-Present - The Univsersity of Texas Health Science Center at Houston @ |