|
||||||||||||||||||||||||||||||||||||||||||||||||||||||||||||||||||||||||||||||||||||||||||||||||||||||||||||||||||||||||||||||||||||||||||||||||||||||||||||||||||||||||||||||||||||||||||||||||||||||||||||||||||||||||||||||||||||||||||||||||||||||||||||||||||||||||||||||||||||||||||||||||||||||||||||||||||||||||||
| |
| Phenotypic Information (metabolism pathway, cancer, disease, phenome) |
| |
| |
| Gene-Gene Network Information: Co-Expression Network, Interacting Genes & KEGG |
| |
|


| Gene Summary for CNDP1 |
| Basic gene info. | Gene symbol | CNDP1 |
| Gene name | carnosine dipeptidase 1 (metallopeptidase M20 family) | |
| Synonyms | CN1|CPGL2|HsT2308 | |
| Cytomap | UCSC genome browser: 18q22.3 | |
| Genomic location | chr18 :72201691-72252261 | |
| Type of gene | protein-coding | |
| RefGenes | NM_032649.5, | |
| Ensembl id | ENSG00000150656 | |
| Description | CNDP dipeptidase 1beta-Ala-His dipeptidasecarnosinase 1glutamate carboxypeptidase-like protein 2serum carnosinase | |
| Modification date | 20141207 | |
| dbXrefs | MIM : 609064 | |
| HGNC : HGNC | ||
| Ensembl : ENSG00000150656 | ||
| HPRD : 09883 | ||
| HPRD : 09894 | ||
| Vega : OTTHUMG00000132852 | ||
| Protein | UniProt: go to UniProt's Cross Reference DB Table | |
| Expression | CleanEX: HS_CNDP1 | |
| BioGPS: 84735 | ||
| Gene Expression Atlas: ENSG00000150656 | ||
| The Human Protein Atlas: ENSG00000150656 | ||
| Pathway | NCI Pathway Interaction Database: CNDP1 | |
| KEGG: CNDP1 | ||
| REACTOME: CNDP1 | ||
| ConsensusPathDB | ||
| Pathway Commons: CNDP1 | ||
| Metabolism | MetaCyc: CNDP1 | |
| HUMANCyc: CNDP1 | ||
| Regulation | Ensembl's Regulation: ENSG00000150656 | |
| miRBase: chr18 :72,201,691-72,252,261 | ||
| TargetScan: NM_032649 | ||
| cisRED: ENSG00000150656 | ||
| Context | iHOP: CNDP1 | |
| cancer metabolism search in PubMed: CNDP1 | ||
| UCL Cancer Institute: CNDP1 | ||
| Assigned class in ccmGDB | C | |
| Top |
| Phenotypic Information for CNDP1(metabolism pathway, cancer, disease, phenome) |
| Cancer | CGAP: CNDP1 |
| Familial Cancer Database: CNDP1 | |
| * This gene is included in those cancer gene databases. |
|
|
|
|
|
| . | ||||||||||||||||||||||||||||||||||||||||||||||||||||||||||||||||||||||||||||||||||||||||||||||||||||||||||||||||||||||||||||||||||||||||||||||||||||||||||||||||||||||||||||||||||||||||||||||||||||||||||||||||||||||||||||||||||||||||||||||||||||||||||||||||||||||||||||||||||||||||||||||||||||||||||||||||||||
Oncogene 1 | Significant driver gene in | |||||||||||||||||||||||||||||||||||||||||||||||||||||||||||||||||||||||||||||||||||||||||||||||||||||||||||||||||||||||||||||||||||||||||||||||||||||||||||||||||||||||||||||||||||||||||||||||||||||||||||||||||||||||||||||||||||||||||||||||||||||||||||||||||||||||||||||||||||||||||||||||||||||||||||||||||||||||||
| cf) number; DB name 1 Oncogene; http://nar.oxfordjournals.org/content/35/suppl_1/D721.long, 2 Tumor Suppressor gene; https://bioinfo.uth.edu/TSGene/, 3 Cancer Gene Census; http://www.nature.com/nrc/journal/v4/n3/abs/nrc1299.html, 4 CancerGenes; http://nar.oxfordjournals.org/content/35/suppl_1/D721.long, 5 Network of Cancer Gene; http://ncg.kcl.ac.uk/index.php, 1Therapeutic Vulnerabilities in Cancer; http://cbio.mskcc.org/cancergenomics/statius/ |
| KEGG_HISTIDINE_METABOLISM KEGG_BETA_ALANINE_METABOLISM | |
| OMIM | |
| Orphanet | |
| Disease | KEGG Disease: CNDP1 |
| MedGen: CNDP1 (Human Medical Genetics with Condition) | |
| ClinVar: CNDP1 | |
| Phenotype | MGI: CNDP1 (International Mouse Phenotyping Consortium) |
| PhenomicDB: CNDP1 | |
| Mutations for CNDP1 |
| * Under tables are showing count per each tissue to give us broad intuition about tissue specific mutation patterns.You can go to the detailed page for each mutation database's web site. |
| - Statistics for Tissue and Mutation type | Top |
 |
| - For Inter-chromosomal Variations |
| * Inter-chromosomal variantions includes 'interchromosomal amplicon to amplicon', 'interchromosomal amplicon to non-amplified dna', 'interchromosomal insertion', 'Interchromosomal unknown type'. |
 |
| - For Intra-chromosomal Variations |
| There's no intra-chromosomal structural variation. |
| Sample | Symbol_a | Chr_a | Start_a | End_a | Symbol_b | Chr_b | Start_b | End_b |
| haematopoietic_and_lymphoid_tissue | CNDP1 | chr18 | 72230125 | 72230125 | chr9 | 81860353 | 81860353 |
| cf) Tissue number; Tissue name (1;Breast, 2;Central_nervous_system, 3;Haematopoietic_and_lymphoid_tissue, 4;Large_intestine, 5;Liver, 6;Lung, 7;Ovary, 8;Pancreas, 9;Prostate, 10;Skin, 11;Soft_tissue, 12;Upper_aerodigestive_tract) |
| * From mRNA Sanger sequences, Chitars2.0 arranged chimeric transcripts. This table shows CNDP1 related fusion information. |
| ID | Head Gene | Tail Gene | Accession | Gene_a | qStart_a | qEnd_a | Chromosome_a | tStart_a | tEnd_a | Gene_a | qStart_a | qEnd_a | Chromosome_a | tStart_a | tEnd_a |
| Top |
| Mutation type/ Tissue ID | brca | cns | cerv | endome | haematopo | kidn | Lintest | liver | lung | ns | ovary | pancre | prost | skin | stoma | thyro | urina | |||
| Total # sample | 1 | |||||||||||||||||||
| GAIN (# sample) | 1 | |||||||||||||||||||
| LOSS (# sample) |
| cf) Tissue ID; Tissue type (1; Breast, 2; Central_nervous_system, 3; Cervix, 4; Endometrium, 5; Haematopoietic_and_lymphoid_tissue, 6; Kidney, 7; Large_intestine, 8; Liver, 9; Lung, 10; NS, 11; Ovary, 12; Pancreas, 13; Prostate, 14; Skin, 15; Stomach, 16; Thyroid, 17; Urinary_tract) |
| Top |
|
 |
| Top |
| Stat. for Non-Synonymous SNVs (# total SNVs=56) | (# total SNVs=13) |
 |  |
(# total SNVs=2) | (# total SNVs=35) |
 |  |
| Top |
| * When you move the cursor on each content, you can see more deailed mutation information on the Tooltip. Those are primary_site,primary_histology,mutation(aa),pubmedID. |
| GRCh37 position | Mutation(aa) | Unique sampleID count |
| chr18:72223608-72223609 | p.L20_E21insL | 33 |
| chr18:72250892-72250892 | p.P469S | 3 |
| chr18:72234460-72234460 | p.? | 2 |
| chr18:72244255-72244255 | p.F331F | 2 |
| chr18:72234643-72234643 | p.R244Q | 2 |
| chr18:72250894-72250894 | p.P469P | 2 |
| chr18:72234659-72234659 | p.F249F | 2 |
| chr18:72228205-72228205 | p.R140W | 2 |
| chr18:72223637-72223637 | p.P30L | 2 |
| chr18:72247400-72247400 | p.R401I | 2 |
| Top |
|
 |
| Point Mutation/ Tissue ID | 1 | 2 | 3 | 4 | 5 | 6 | 7 | 8 | 9 | 10 | 11 | 12 | 13 | 14 | 15 | 16 | 17 | 18 | 19 | 20 |
| # sample | 1 | 3 | 7 | 2 | 3 | 1 | 2 | 12 | 2 | 1 | 13 | 3 | 5 | |||||||
| # mutation | 1 | 3 | 8 | 2 | 3 | 1 | 2 | 12 | 2 | 1 | 13 | 3 | 6 | |||||||
| nonsynonymous SNV | 1 | 3 | 4 | 2 | 3 | 1 | 2 | 8 | 2 | 1 | 8 | 2 | 5 | |||||||
| synonymous SNV | 4 | 4 | 5 | 1 | 1 |
| cf) Tissue ID; Tissue type (1; BLCA[Bladder Urothelial Carcinoma], 2; BRCA[Breast invasive carcinoma], 3; CESC[Cervical squamous cell carcinoma and endocervical adenocarcinoma], 4; COAD[Colon adenocarcinoma], 5; GBM[Glioblastoma multiforme], 6; Glioma Low Grade, 7; HNSC[Head and Neck squamous cell carcinoma], 8; KICH[Kidney Chromophobe], 9; KIRC[Kidney renal clear cell carcinoma], 10; KIRP[Kidney renal papillary cell carcinoma], 11; LAML[Acute Myeloid Leukemia], 12; LUAD[Lung adenocarcinoma], 13; LUSC[Lung squamous cell carcinoma], 14; OV[Ovarian serous cystadenocarcinoma ], 15; PAAD[Pancreatic adenocarcinoma], 16; PRAD[Prostate adenocarcinoma], 17; SKCM[Skin Cutaneous Melanoma], 18:STAD[Stomach adenocarcinoma], 19:THCA[Thyroid carcinoma], 20:UCEC[Uterine Corpus Endometrial Carcinoma]) |
| Top |
| * We represented just top 10 SNVs. When you move the cursor on each content, you can see more deailed mutation information on the Tooltip. Those are primary_site, primary_histology, mutation(aa), pubmedID. |
| Genomic Position | Mutation(aa) | Unique sampleID count |
| chr18:72234659 | p.F249F | 2 |
| chr18:72247448 | p.P417R | 2 |
| chr18:72244205 | p.T363I | 1 |
| chr18:72226583 | p.P469P | 1 |
| chr18:72247436 | p.D62Y | 1 |
| chr18:72228156 | p.E199G | 1 |
| chr18:72234643 | p.I370M | 1 |
| chr18:72244255 | p.L501F | 1 |
| chr18:72226584 | p.V67V | 1 |
| chr18:72247446 | p.A205T | 1 |
| * Copy number data were extracted from TCGA using R package TCGA-Assembler. The URLs of all public data files on TCGA DCC data server were gathered on Jan-05-2015. Function ProcessCNAData in TCGA-Assembler package was used to obtain gene-level copy number value which is calculated as the average copy number of the genomic region of a gene. |
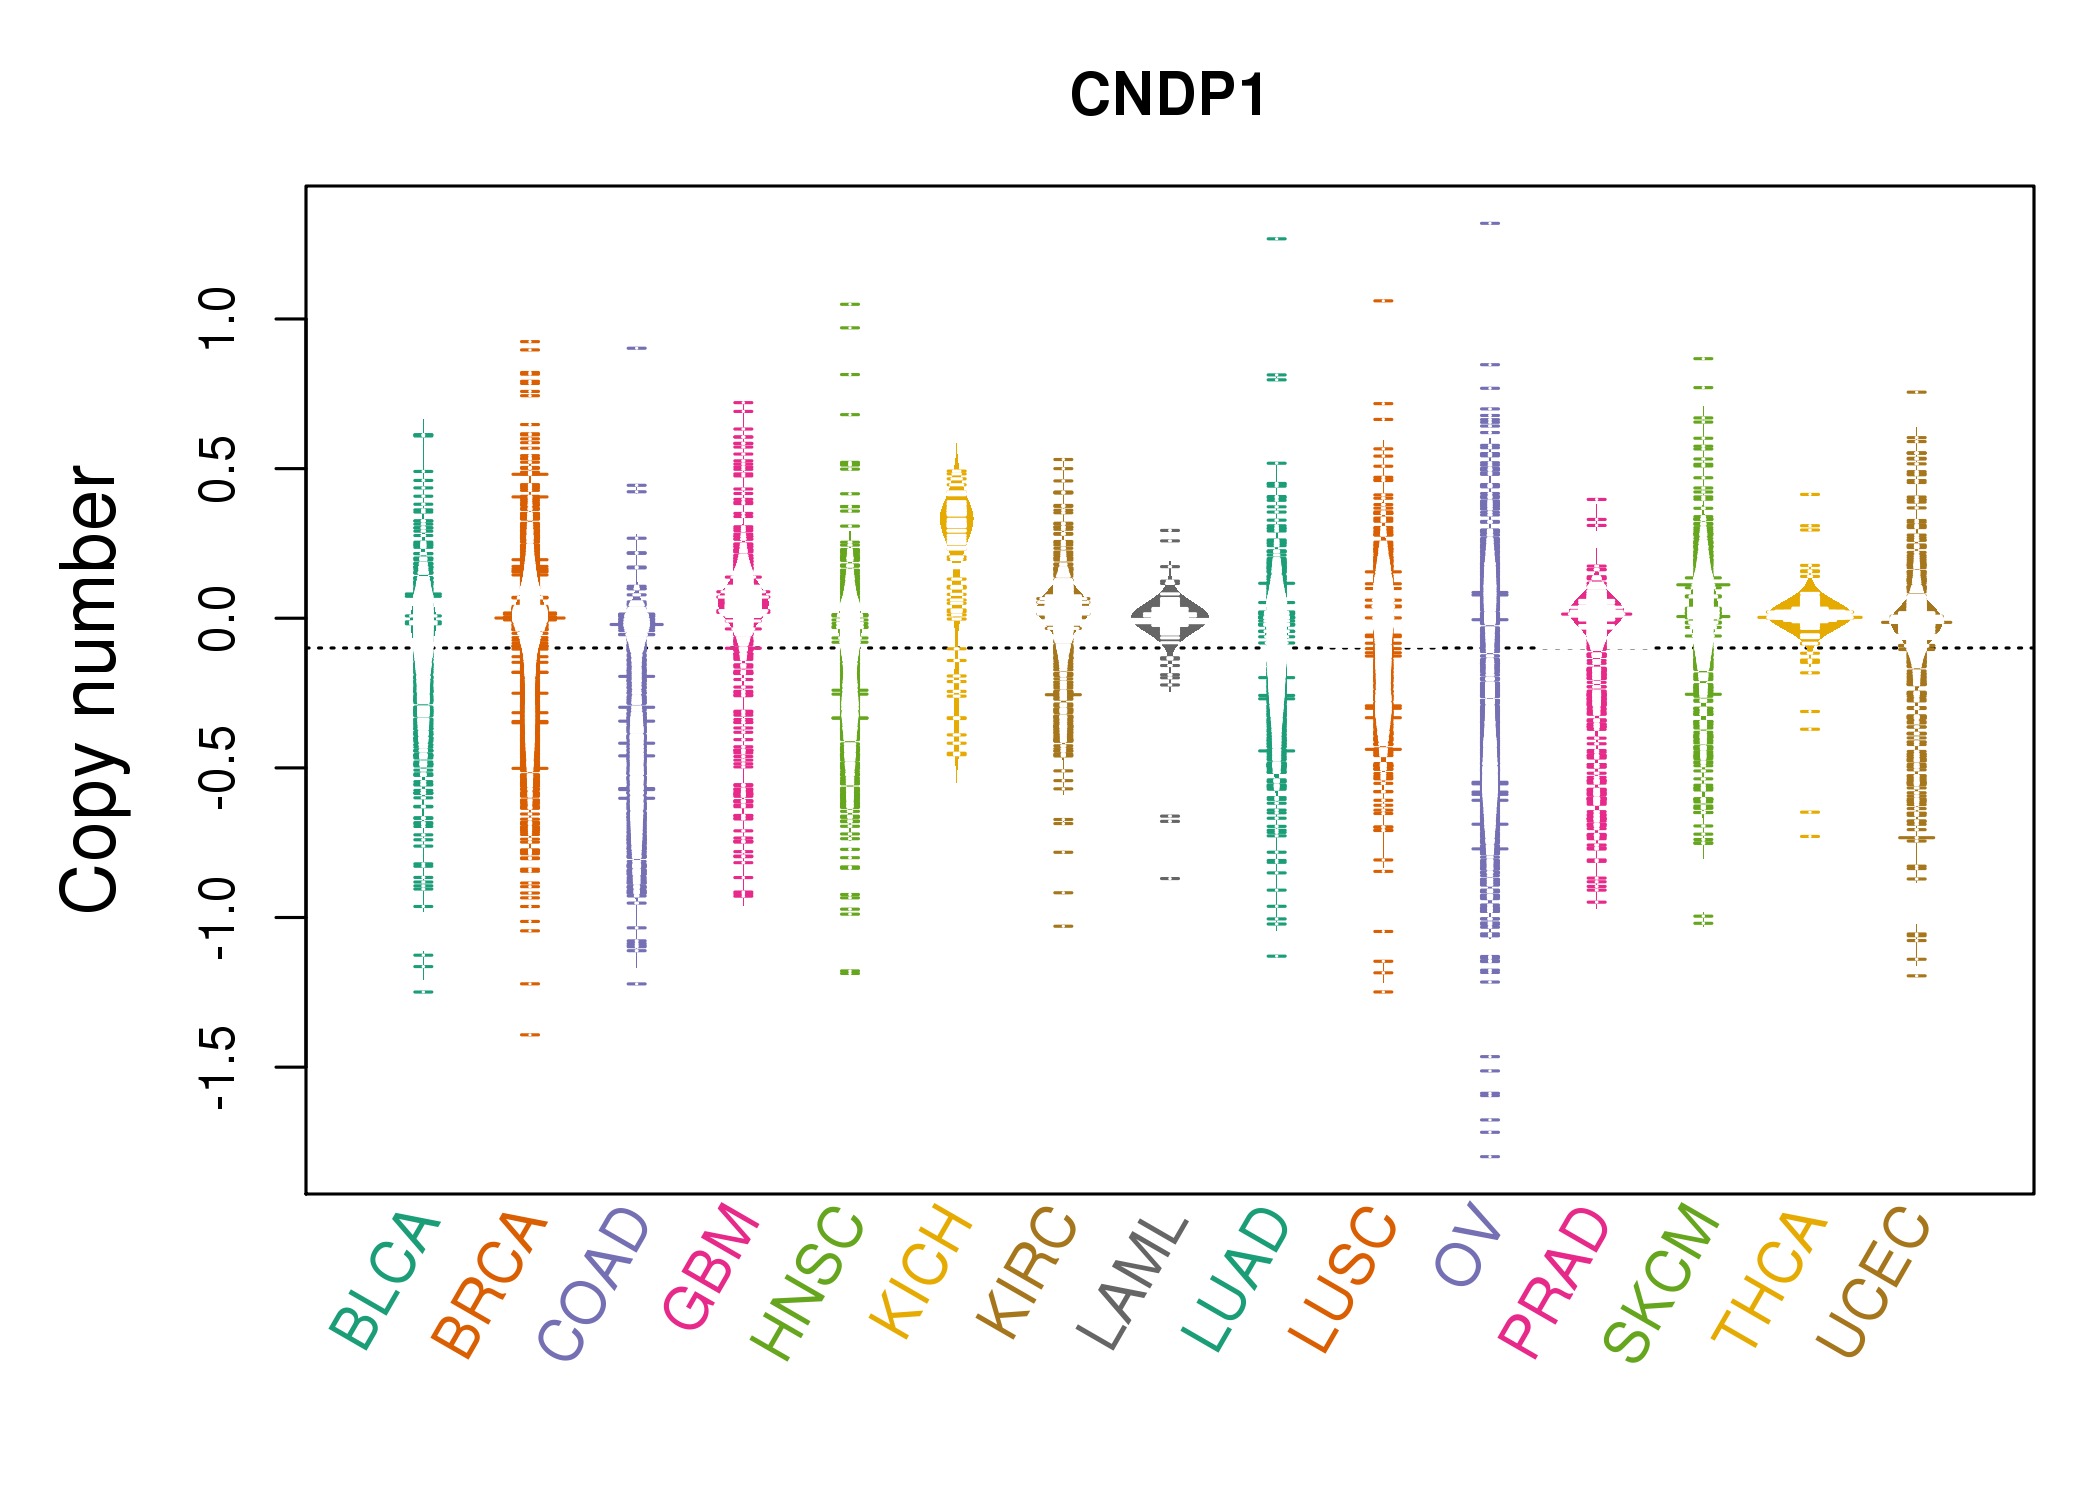 |
| cf) Tissue ID[Tissue type]: BLCA[Bladder Urothelial Carcinoma], BRCA[Breast invasive carcinoma], CESC[Cervical squamous cell carcinoma and endocervical adenocarcinoma], COAD[Colon adenocarcinoma], GBM[Glioblastoma multiforme], Glioma Low Grade, HNSC[Head and Neck squamous cell carcinoma], KICH[Kidney Chromophobe], KIRC[Kidney renal clear cell carcinoma], KIRP[Kidney renal papillary cell carcinoma], LAML[Acute Myeloid Leukemia], LUAD[Lung adenocarcinoma], LUSC[Lung squamous cell carcinoma], OV[Ovarian serous cystadenocarcinoma ], PAAD[Pancreatic adenocarcinoma], PRAD[Prostate adenocarcinoma], SKCM[Skin Cutaneous Melanoma], STAD[Stomach adenocarcinoma], THCA[Thyroid carcinoma], UCEC[Uterine Corpus Endometrial Carcinoma] |
| Top |
| Gene Expression for CNDP1 |
| * CCLE gene expression data were extracted from CCLE_Expression_Entrez_2012-10-18.res: Gene-centric RMA-normalized mRNA expression data. |
 |
| * Normalized gene expression data of RNASeqV2 was extracted from TCGA using R package TCGA-Assembler. The URLs of all public data files on TCGA DCC data server were gathered at Jan-05-2015. Only eight cancer types have enough normal control samples for differential expression analysis. (t test, adjusted p<0.05 (using Benjamini-Hochberg FDR)) |
 |
| Top |
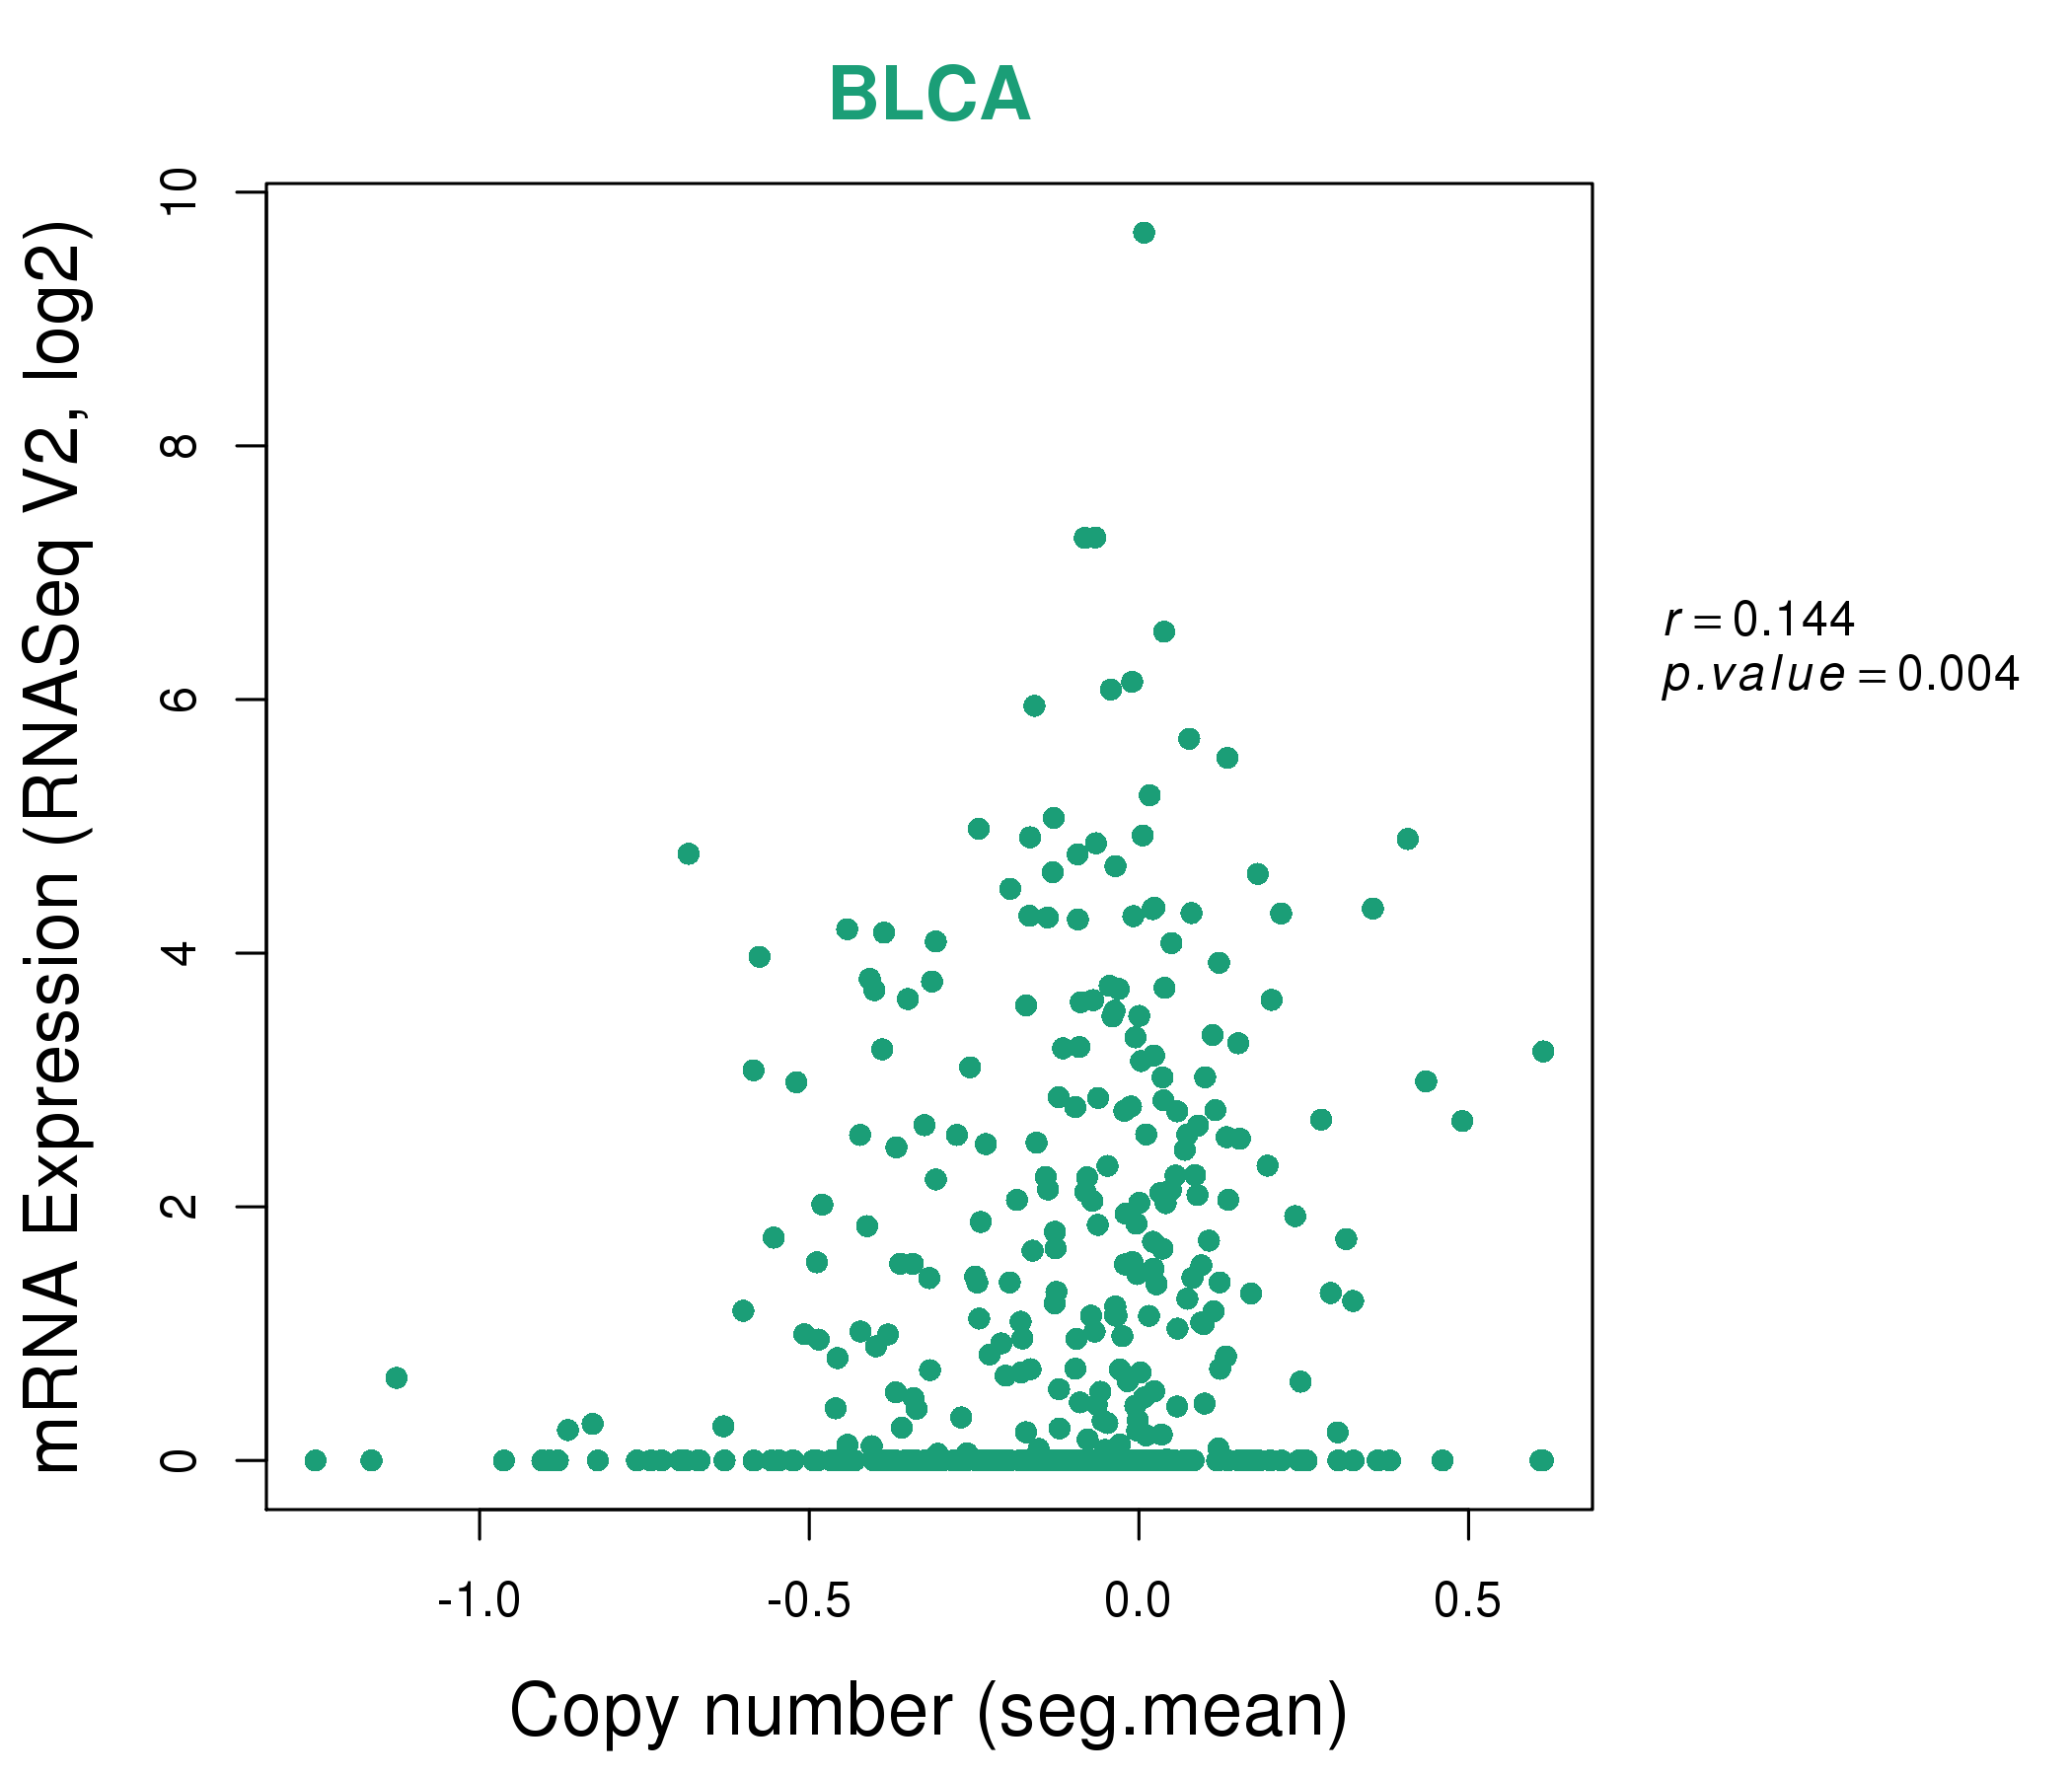
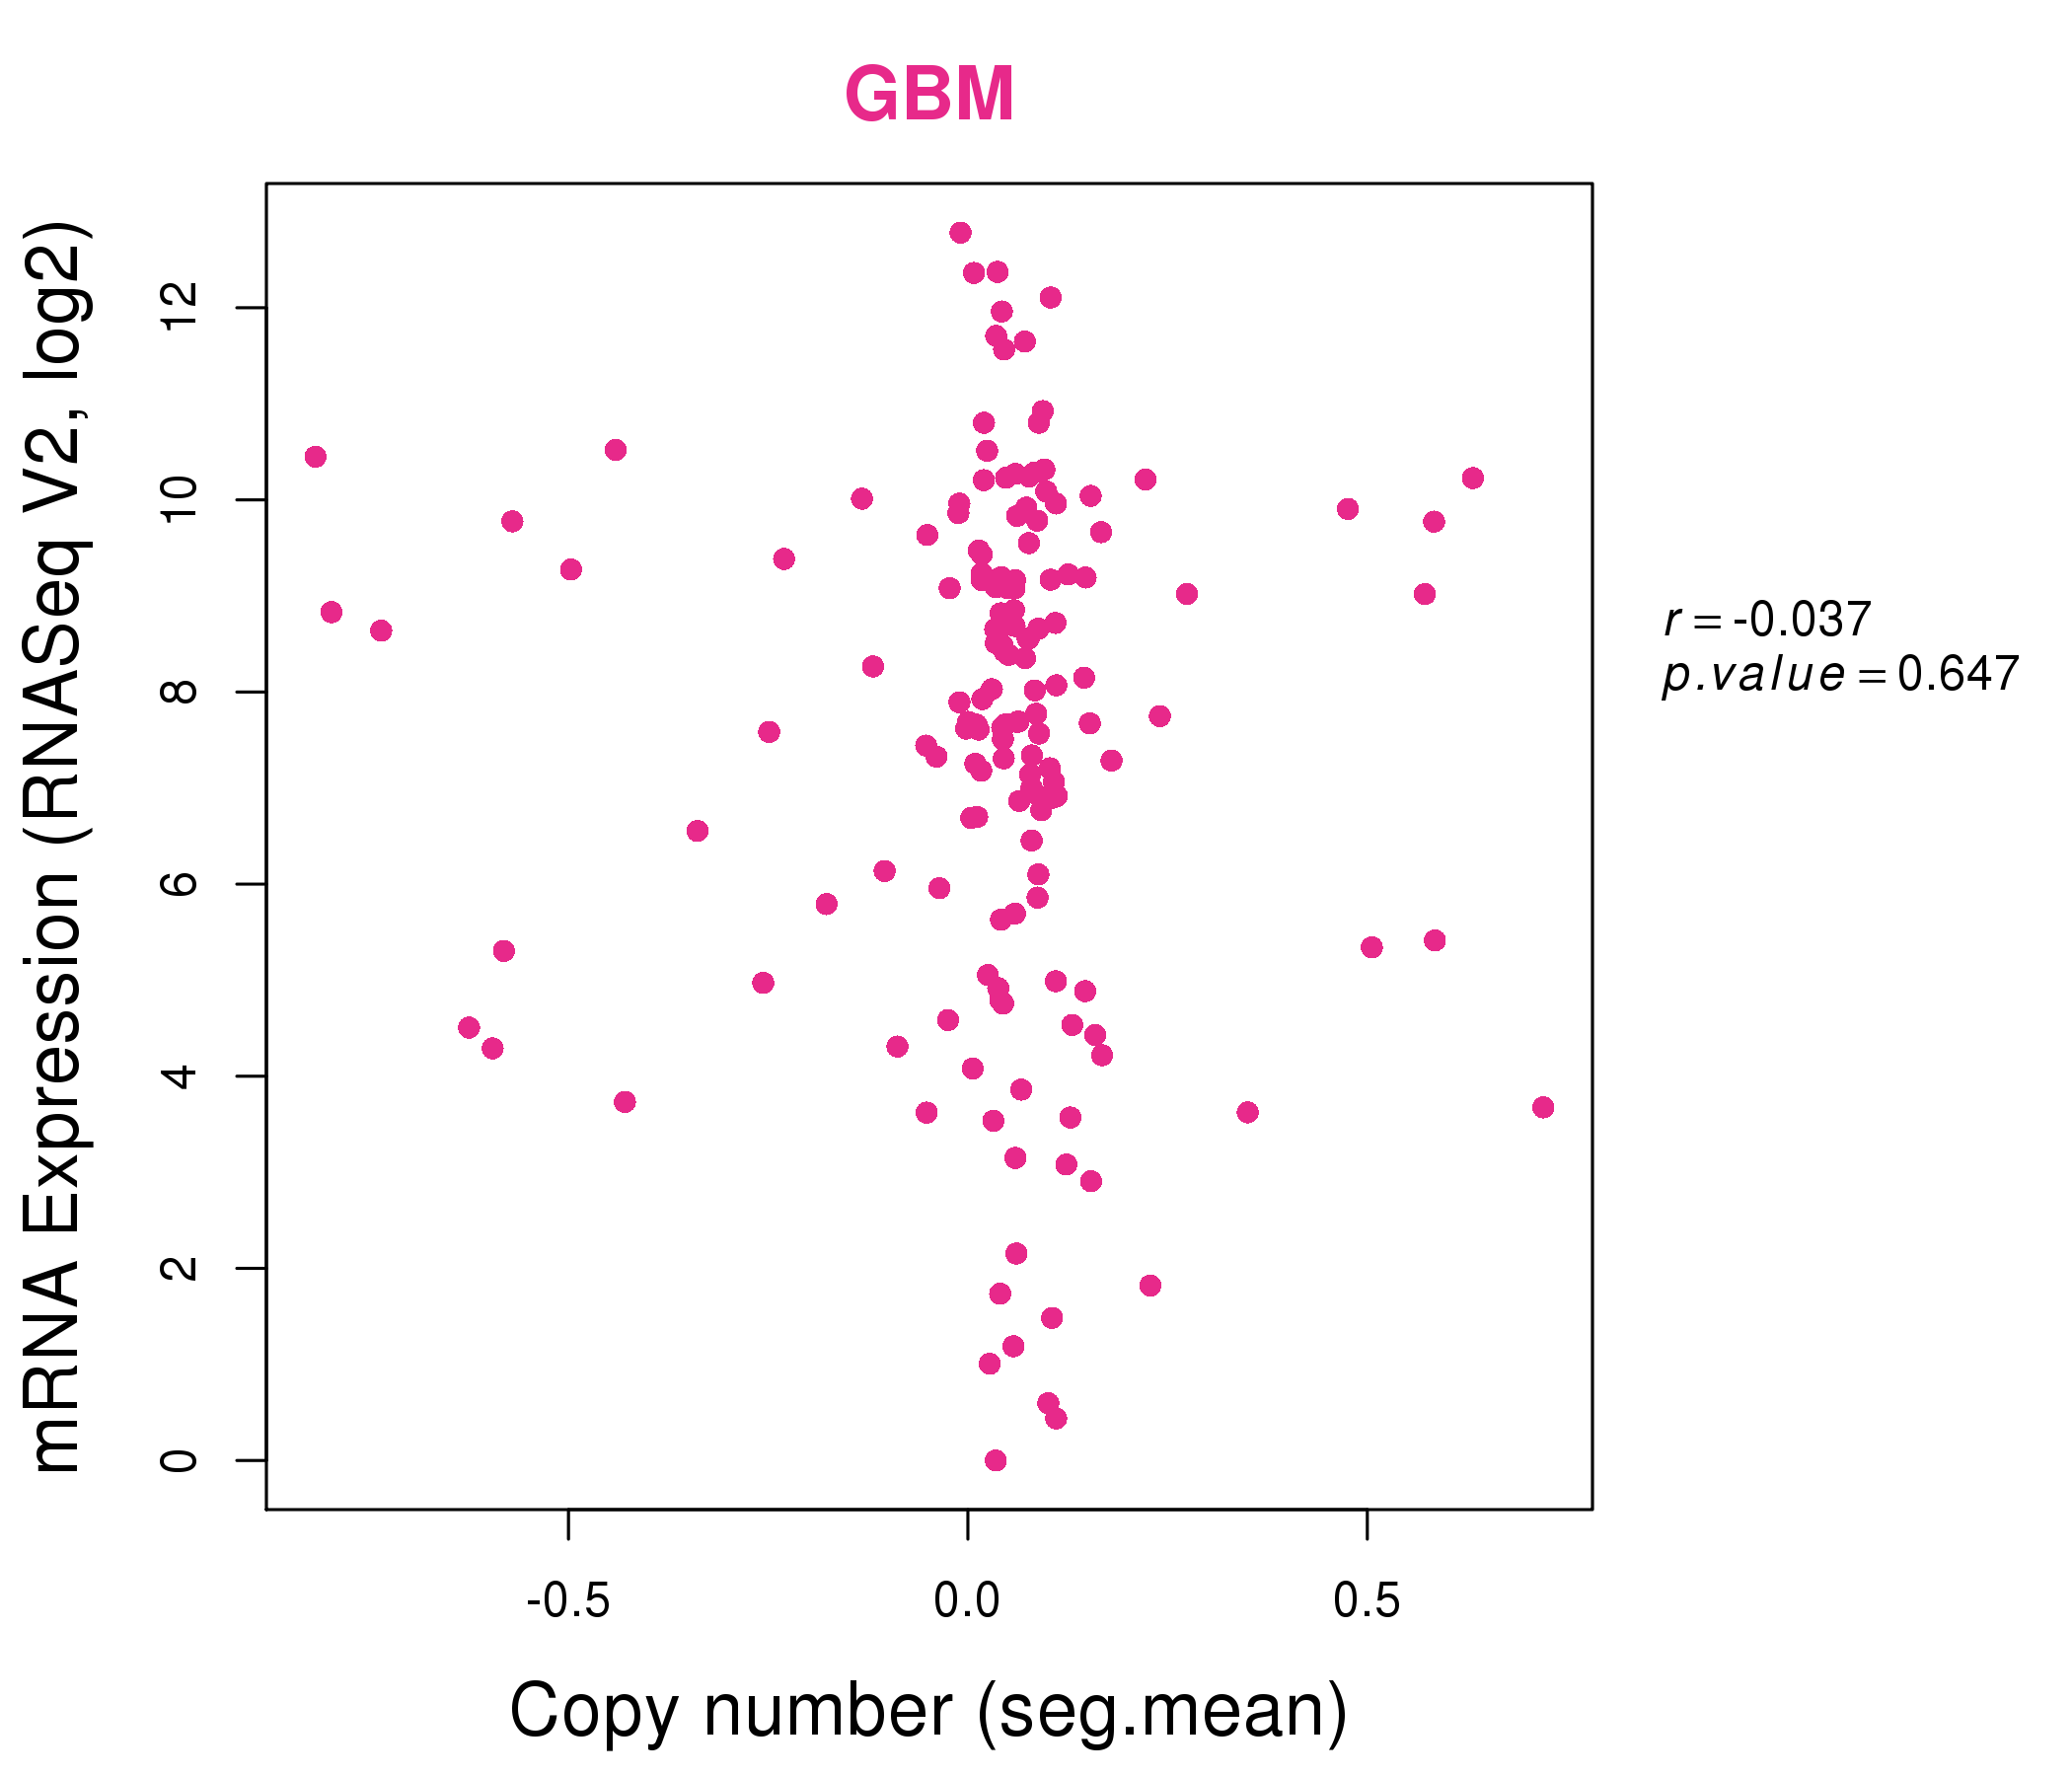
| * This plots show the correlation between CNV and gene expression. |
: Open all plots for all cancer types
 |
|
 |
|

| Top |
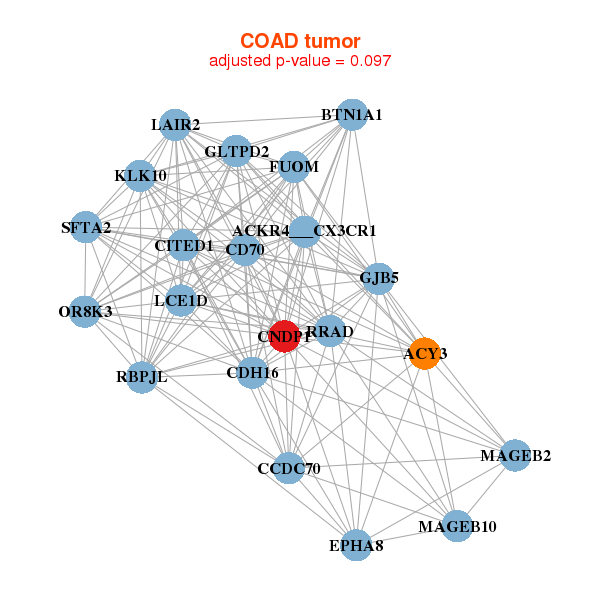
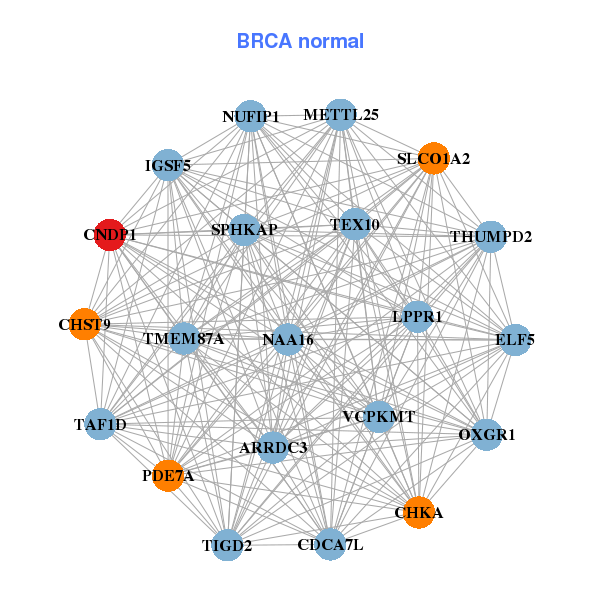
| Gene-Gene Network Information |
| * Co-Expression network figures were drawn using R package igraph. Only the top 20 genes with the highest correlations were shown. Red circle: input gene, orange circle: cell metabolism gene, sky circle: other gene |
: Open all plots for all cancer types
 |
|
| C2orf78,CNDP1,CT47A2,FAM9B,FOXR2,FTSJ1,HBE1, LOC643955,MRGPRE,NXF2B,OR1E1,OTUD5,PAGE4,PPP1R2P9, SEPT14,SLC35A2,SUV39H1,TBC1D25,TEX11,TFE3,TRIM60 | ARRDC3,METTL25,VCPKMT,CDCA7L,CHKA,CHST9,CNDP1, ELF5,IGSF5,LPPR1,NAA16,NUFIP1,OXGR1,PDE7A, SLCO1A2,SPHKAP,TAF1D,TEX10,THUMPD2,TIGD2,TMEM87A |
 |
|
| ACY3,BTN1A1,FUOM,CCDC70,ACKR4___CX3CR1,CD70,CDH16, CITED1,CNDP1,EPHA8,GJB5,GLTPD2,KLK10,LAIR2, LCE1D,MAGEB10,MAGEB2,OR8K3,RBPJL,RRAD,SFTA2 | C1orf168,CDKN2A,CNDP1,CRH,CYP2W1,GABRA6,GCG, GSG1,INSL5,LOC286002,MYBPC1,NEUROD1,PCSK1N,PDILT, PLLP,RFX6,SST,TNNC1,TPH1,TTR,UPK3A |

| * Co-Expression network figures were drawn using R package igraph. Only the top 20 genes with the highest correlations were shown. Red circle: input gene, orange circle: cell metabolism gene, sky circle: other gene |
: Open all plots for all cancer types
| Top |
: Open all interacting genes' information including KEGG pathway for all interacting genes from DAVID
| Top |
| Pharmacological Information for CNDP1 |
| There's no related Drug. |
| Top |
| Cross referenced IDs for CNDP1 |
| * We obtained these cross-references from Uniprot database. It covers 150 different DBs, 18 categories. http://www.uniprot.org/help/cross_references_section |
: Open all cross reference information
|
Copyright © 2016-Present - The Univsersity of Texas Health Science Center at Houston @ |