|
||||||||||||||||||||||||||||||||||||||||||||||||||||||||||||||||||||||||||||||||||||||||||||||||||||||||||||||||||||||||||||||||||||||||||||||||||||||||||||||||||||||||||||||||||||||||||||||||||||||||||||||||||||||||||||||||||||||||||||||||||||||||||||||||||||||||||||||||||||||||||||||||||||||||||||||||||||||||||
| |
| Phenotypic Information (metabolism pathway, cancer, disease, phenome) |
| |
| |
| Gene-Gene Network Information: Co-Expression Network, Interacting Genes & KEGG |
| |
|


| Gene Summary for DGAT1 |
| Basic gene info. | Gene symbol | DGAT1 |
| Gene name | diacylglycerol O-acyltransferase 1 | |
| Synonyms | ARAT|ARGP1|DGAT|DIAR7 | |
| Cytomap | UCSC genome browser: 8q24.3 | |
| Genomic location | chr8 :145538246-145550567 | |
| Type of gene | protein-coding | |
| RefGenes | NM_012079.5, | |
| Ensembl id | ENSG00000261698 | |
| Description | ACAT related gene product 1acyl coenzyme A:cholesterol acyltransferase related gene 1acyl-CoA retinol O-fatty-acyltransferaseacyl-CoA:diacylglycerol acyltransferasediglyceride acyltransferase | |
| Modification date | 20141212 | |
| dbXrefs | MIM : 604900 | |
| HGNC : HGNC | ||
| Ensembl : ENSG00000185000 | ||
| HPRD : 05360 | ||
| Vega : OTTHUMG00000174606 | ||
| Protein | UniProt: go to UniProt's Cross Reference DB Table | |
| Expression | CleanEX: HS_DGAT1 | |
| BioGPS: 8694 | ||
| Gene Expression Atlas: ENSG00000261698 | ||
| The Human Protein Atlas: ENSG00000261698 | ||
| Pathway | NCI Pathway Interaction Database: DGAT1 | |
| KEGG: DGAT1 | ||
| REACTOME: DGAT1 | ||
| ConsensusPathDB | ||
| Pathway Commons: DGAT1 | ||
| Metabolism | MetaCyc: DGAT1 | |
| HUMANCyc: DGAT1 | ||
| Regulation | Ensembl's Regulation: ENSG00000261698 | |
| miRBase: chr8 :145,538,246-145,550,567 | ||
| TargetScan: NM_012079 | ||
| cisRED: ENSG00000261698 | ||
| Context | iHOP: DGAT1 | |
| cancer metabolism search in PubMed: DGAT1 | ||
| UCL Cancer Institute: DGAT1 | ||
| Assigned class in ccmGDB | C | |
| Top |
| Phenotypic Information for DGAT1(metabolism pathway, cancer, disease, phenome) |
| Cancer | CGAP: DGAT1 |
| Familial Cancer Database: DGAT1 | |
| * This gene is included in those cancer gene databases. |
|
|
|
|
|
|
| ||||||||||||||||||||||||||||||||||||||||||||||||||||||||||||||||||||||||||||||||||||||||||||||||||||||||||||||||||||||||||||||||||||||||||||||||||||||||||||||||||||||||||||||||||||||||||||||||||||||||||||||||||||||||||||||||||||||||||||||||||||||||||||||||||||||||||||||||||||||||||||||||||||||||||||||||||||
Oncogene 1 | Significant driver gene in | |||||||||||||||||||||||||||||||||||||||||||||||||||||||||||||||||||||||||||||||||||||||||||||||||||||||||||||||||||||||||||||||||||||||||||||||||||||||||||||||||||||||||||||||||||||||||||||||||||||||||||||||||||||||||||||||||||||||||||||||||||||||||||||||||||||||||||||||||||||||||||||||||||||||||||||||||||||||||
| cf) number; DB name 1 Oncogene; http://nar.oxfordjournals.org/content/35/suppl_1/D721.long, 2 Tumor Suppressor gene; https://bioinfo.uth.edu/TSGene/, 3 Cancer Gene Census; http://www.nature.com/nrc/journal/v4/n3/abs/nrc1299.html, 4 CancerGenes; http://nar.oxfordjournals.org/content/35/suppl_1/D721.long, 5 Network of Cancer Gene; http://ncg.kcl.ac.uk/index.php, 1Therapeutic Vulnerabilities in Cancer; http://cbio.mskcc.org/cancergenomics/statius/ |
| KEGG_GLYCEROLIPID_METABOLISM KEGG_RETINOL_METABOLISM REACTOME_PHOSPHOLIPID_METABOLISM REACTOME_METABOLISM_OF_LIPIDS_AND_LIPOPROTEINS | |
| OMIM | |
| Orphanet | |
| Disease | KEGG Disease: DGAT1 |
| MedGen: DGAT1 (Human Medical Genetics with Condition) | |
| ClinVar: DGAT1 | |
| Phenotype | MGI: DGAT1 (International Mouse Phenotyping Consortium) |
| PhenomicDB: DGAT1 | |
| Mutations for DGAT1 |
| * Under tables are showing count per each tissue to give us broad intuition about tissue specific mutation patterns.You can go to the detailed page for each mutation database's web site. |
| - Statistics for Tissue and Mutation type | Top |
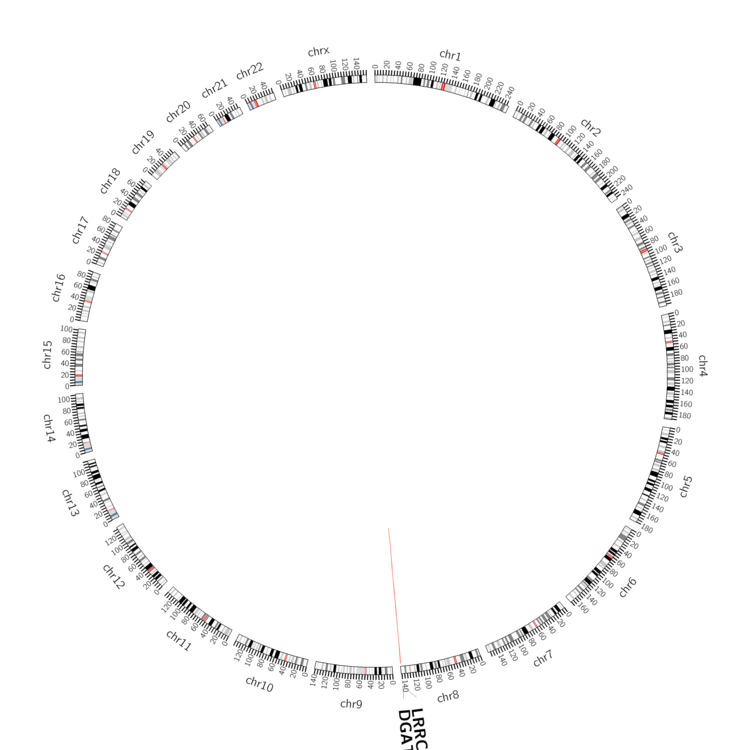 |
| - For Inter-chromosomal Variations |
| There's no inter-chromosomal structural variation. |
| - For Intra-chromosomal Variations |
| * Intra-chromosomal variantions includes 'intrachromosomal amplicon to amplicon', 'intrachromosomal amplicon to non-amplified dna', 'intrachromosomal deletion', 'intrachromosomal fold-back inversion', 'intrachromosomal inversion', 'intrachromosomal tandem duplication', 'Intrachromosomal unknown type', 'intrachromosomal with inverted orientation', 'intrachromosomal with non-inverted orientation'. |
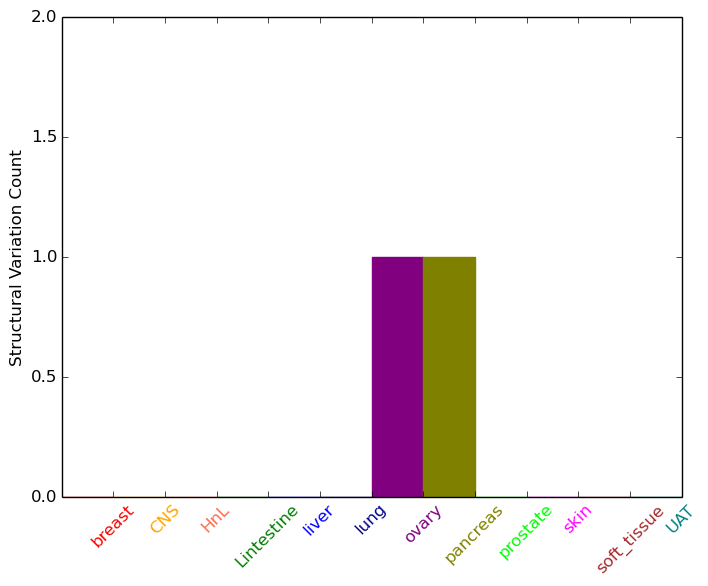 |
| Sample | Symbol_a | Chr_a | Start_a | End_a | Symbol_b | Chr_b | Start_b | End_b |
| ovary | DGAT1 | chr8 | 145546557 | 145546577 | LRRC14 | chr8 | 145743628 | 145743648 |
| pancreas | DGAT1 | chr8 | 145540410 | 145540430 | chr8 | 145572109 | 145572129 |
| cf) Tissue number; Tissue name (1;Breast, 2;Central_nervous_system, 3;Haematopoietic_and_lymphoid_tissue, 4;Large_intestine, 5;Liver, 6;Lung, 7;Ovary, 8;Pancreas, 9;Prostate, 10;Skin, 11;Soft_tissue, 12;Upper_aerodigestive_tract) |
| * From mRNA Sanger sequences, Chitars2.0 arranged chimeric transcripts. This table shows DGAT1 related fusion information. |
| ID | Head Gene | Tail Gene | Accession | Gene_a | qStart_a | qEnd_a | Chromosome_a | tStart_a | tEnd_a | Gene_a | qStart_a | qEnd_a | Chromosome_a | tStart_a | tEnd_a |
| AJ571972 | DGAT1 | 12 | 153 | 8 | 145540164 | 145540305 | GLTSCR2 | 150 | 377 | 19 | 48259043 | 48260312 | |
| AK026450 | ZSWIM1 | 1 | 1492 | 20 | 44509873 | 44512944 | DGAT1 | 1491 | 2203 | 8 | 145539954 | 145540916 | |
| BE734547 | DGAT1 | 35 | 416 | 8 | 145540746 | 145541627 | TCEB1 | 417 | 876 | 8 | 74858969 | 74884487 | |
| Top |
| Mutation type/ Tissue ID | brca | cns | cerv | endome | haematopo | kidn | Lintest | liver | lung | ns | ovary | pancre | prost | skin | stoma | thyro | urina | |||
| Total # sample | 1 | 1 | 1 | |||||||||||||||||
| GAIN (# sample) | 1 | 1 | ||||||||||||||||||
| LOSS (# sample) | 1 |
| cf) Tissue ID; Tissue type (1; Breast, 2; Central_nervous_system, 3; Cervix, 4; Endometrium, 5; Haematopoietic_and_lymphoid_tissue, 6; Kidney, 7; Large_intestine, 8; Liver, 9; Lung, 10; NS, 11; Ovary, 12; Pancreas, 13; Prostate, 14; Skin, 15; Stomach, 16; Thyroid, 17; Urinary_tract) |
| Top |
|
 |
| Top |
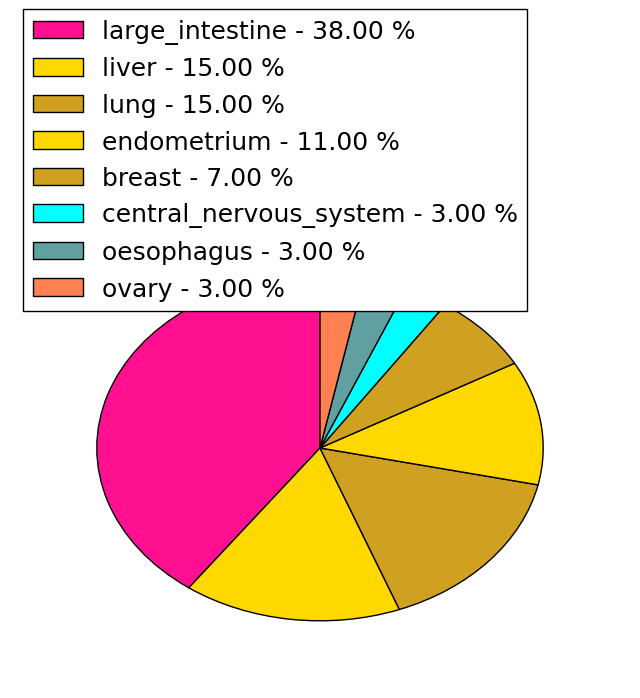
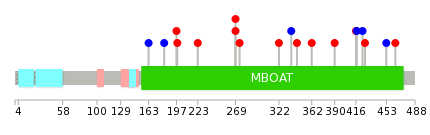
| Stat. for Non-Synonymous SNVs (# total SNVs=26) | (# total SNVs=5) |
 | 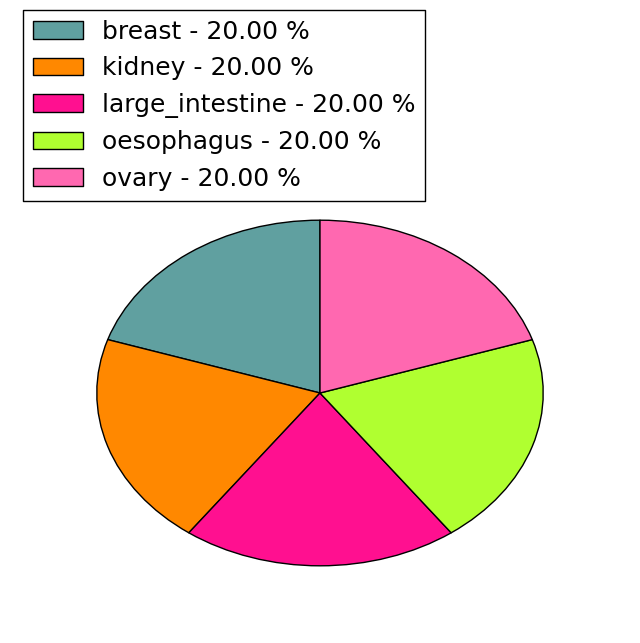 |
(# total SNVs=2) | (# total SNVs=0) |
 |
| Top |
| * When you move the cursor on each content, you can see more deailed mutation information on the Tooltip. Those are primary_site,primary_histology,mutation(aa),pubmedID. |
| GRCh37 position | Mutation(aa) | Unique sampleID count |
| chr8:145541626-145541626 | p.R269H | 3 |
| chr8:145550132-145550132 | p.D56E | 2 |
| chr8:145540294-145540294 | p.G464R | 2 |
| chr8:145545005-145545005 | p.L89L | 1 |
| chr8:145540555-145540555 | p.R424R | 1 |
| chr8:145541594-145541594 | p.R280* | 1 |
| chr8:145542006-145542006 | p.L198L | 1 |
| chr8:145545022-145545024 | p.S83delS | 1 |
| chr8:145540566-145540566 | p.V421I | 1 |
| chr8:145541611-145541611 | p.R274Q | 1 |
| Top |
|
 |
| Point Mutation/ Tissue ID | 1 | 2 | 3 | 4 | 5 | 6 | 7 | 8 | 9 | 10 | 11 | 12 | 13 | 14 | 15 | 16 | 17 | 18 | 19 | 20 |
| # sample | 1 | 4 | 1 | 3 | 1 | 1 | 2 | 2 | 3 | |||||||||||
| # mutation | 1 | 4 | 1 | 3 | 1 | 1 | 2 | 2 | 3 | |||||||||||
| nonsynonymous SNV | 1 | 3 | 2 | 1 | 1 | 1 | 1 | 3 | ||||||||||||
| synonymous SNV | 1 | 1 | 1 | 1 | 1 |
| cf) Tissue ID; Tissue type (1; BLCA[Bladder Urothelial Carcinoma], 2; BRCA[Breast invasive carcinoma], 3; CESC[Cervical squamous cell carcinoma and endocervical adenocarcinoma], 4; COAD[Colon adenocarcinoma], 5; GBM[Glioblastoma multiforme], 6; Glioma Low Grade, 7; HNSC[Head and Neck squamous cell carcinoma], 8; KICH[Kidney Chromophobe], 9; KIRC[Kidney renal clear cell carcinoma], 10; KIRP[Kidney renal papillary cell carcinoma], 11; LAML[Acute Myeloid Leukemia], 12; LUAD[Lung adenocarcinoma], 13; LUSC[Lung squamous cell carcinoma], 14; OV[Ovarian serous cystadenocarcinoma ], 15; PAAD[Pancreatic adenocarcinoma], 16; PRAD[Prostate adenocarcinoma], 17; SKCM[Skin Cutaneous Melanoma], 18:STAD[Stomach adenocarcinoma], 19:THCA[Thyroid carcinoma], 20:UCEC[Uterine Corpus Endometrial Carcinoma]) |
| Top |
| * We represented just top 10 SNVs. When you move the cursor on each content, you can see more deailed mutation information on the Tooltip. Those are primary_site, primary_histology, mutation(aa), pubmedID. |
| Genomic Position | Mutation(aa) | Unique sampleID count |
| chr8:145541059 | p.R274Q | 1 |
| chr8:145541079 | p.R269L | 1 |
| chr8:145541223 | p.R269S | 1 |
| chr8:145540294 | p.A223T | 1 |
| chr8:145541611 | p.L198P | 1 |
| chr8:145540325 | p.A197T | 1 |
| chr8:145541626 | p.G464R | 1 |
| chr8:145540547 | p.V182V | 1 |
| chr8:145541627 | p.G453G | 1 |
| chr8:145540555 | p.A163A | 1 |
| * Copy number data were extracted from TCGA using R package TCGA-Assembler. The URLs of all public data files on TCGA DCC data server were gathered on Jan-05-2015. Function ProcessCNAData in TCGA-Assembler package was used to obtain gene-level copy number value which is calculated as the average copy number of the genomic region of a gene. |
 |
| cf) Tissue ID[Tissue type]: BLCA[Bladder Urothelial Carcinoma], BRCA[Breast invasive carcinoma], CESC[Cervical squamous cell carcinoma and endocervical adenocarcinoma], COAD[Colon adenocarcinoma], GBM[Glioblastoma multiforme], Glioma Low Grade, HNSC[Head and Neck squamous cell carcinoma], KICH[Kidney Chromophobe], KIRC[Kidney renal clear cell carcinoma], KIRP[Kidney renal papillary cell carcinoma], LAML[Acute Myeloid Leukemia], LUAD[Lung adenocarcinoma], LUSC[Lung squamous cell carcinoma], OV[Ovarian serous cystadenocarcinoma ], PAAD[Pancreatic adenocarcinoma], PRAD[Prostate adenocarcinoma], SKCM[Skin Cutaneous Melanoma], STAD[Stomach adenocarcinoma], THCA[Thyroid carcinoma], UCEC[Uterine Corpus Endometrial Carcinoma] |
| Top |
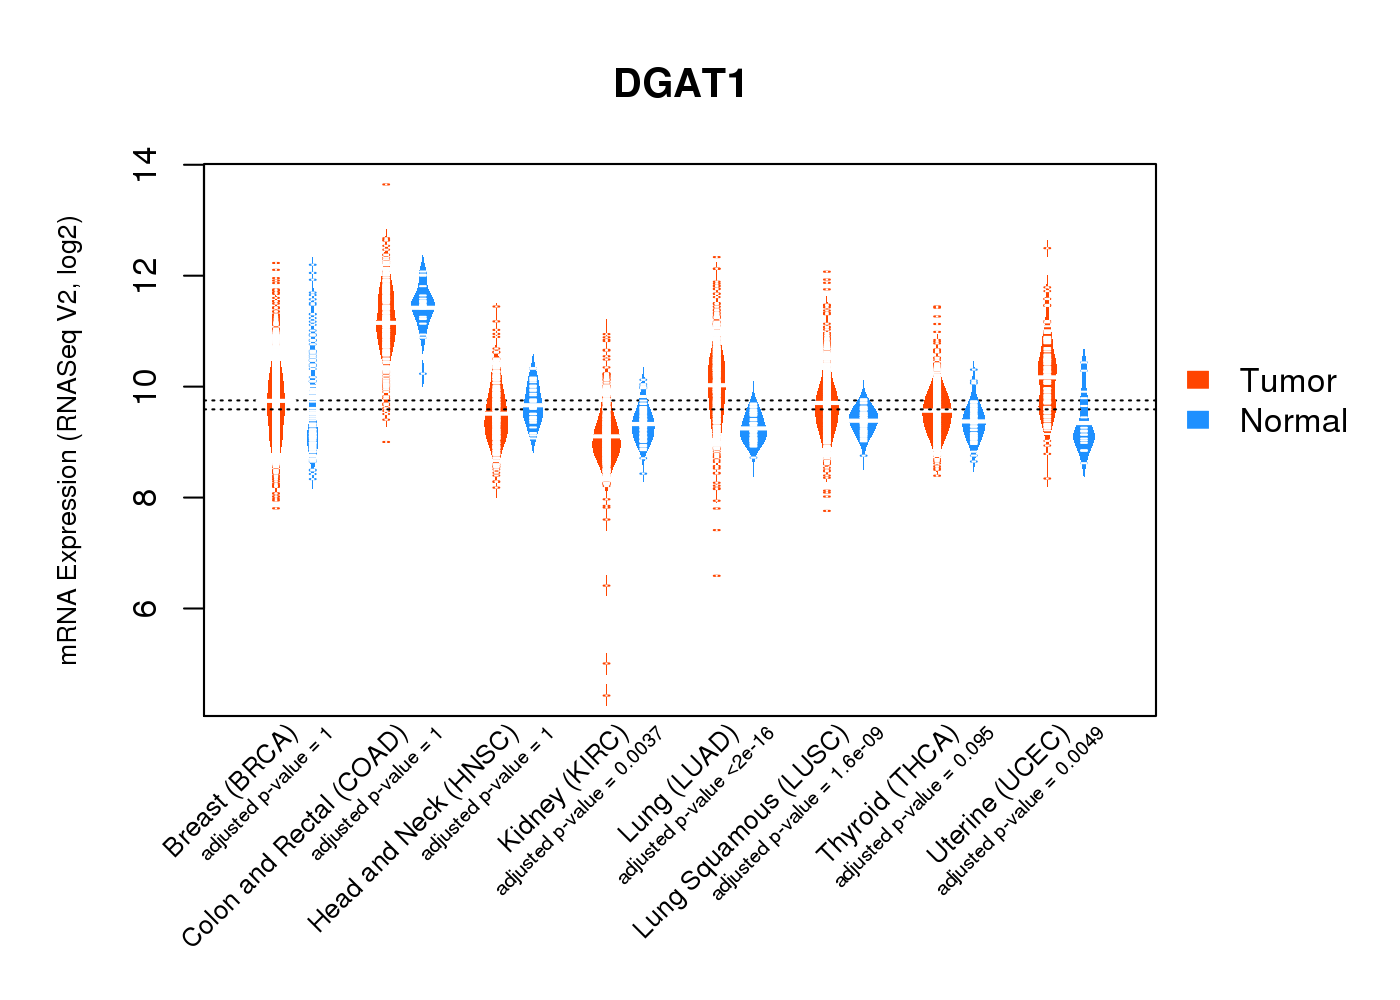
| Gene Expression for DGAT1 |
| * CCLE gene expression data were extracted from CCLE_Expression_Entrez_2012-10-18.res: Gene-centric RMA-normalized mRNA expression data. |
 |
| * Normalized gene expression data of RNASeqV2 was extracted from TCGA using R package TCGA-Assembler. The URLs of all public data files on TCGA DCC data server were gathered at Jan-05-2015. Only eight cancer types have enough normal control samples for differential expression analysis. (t test, adjusted p<0.05 (using Benjamini-Hochberg FDR)) |
 |
| Top |
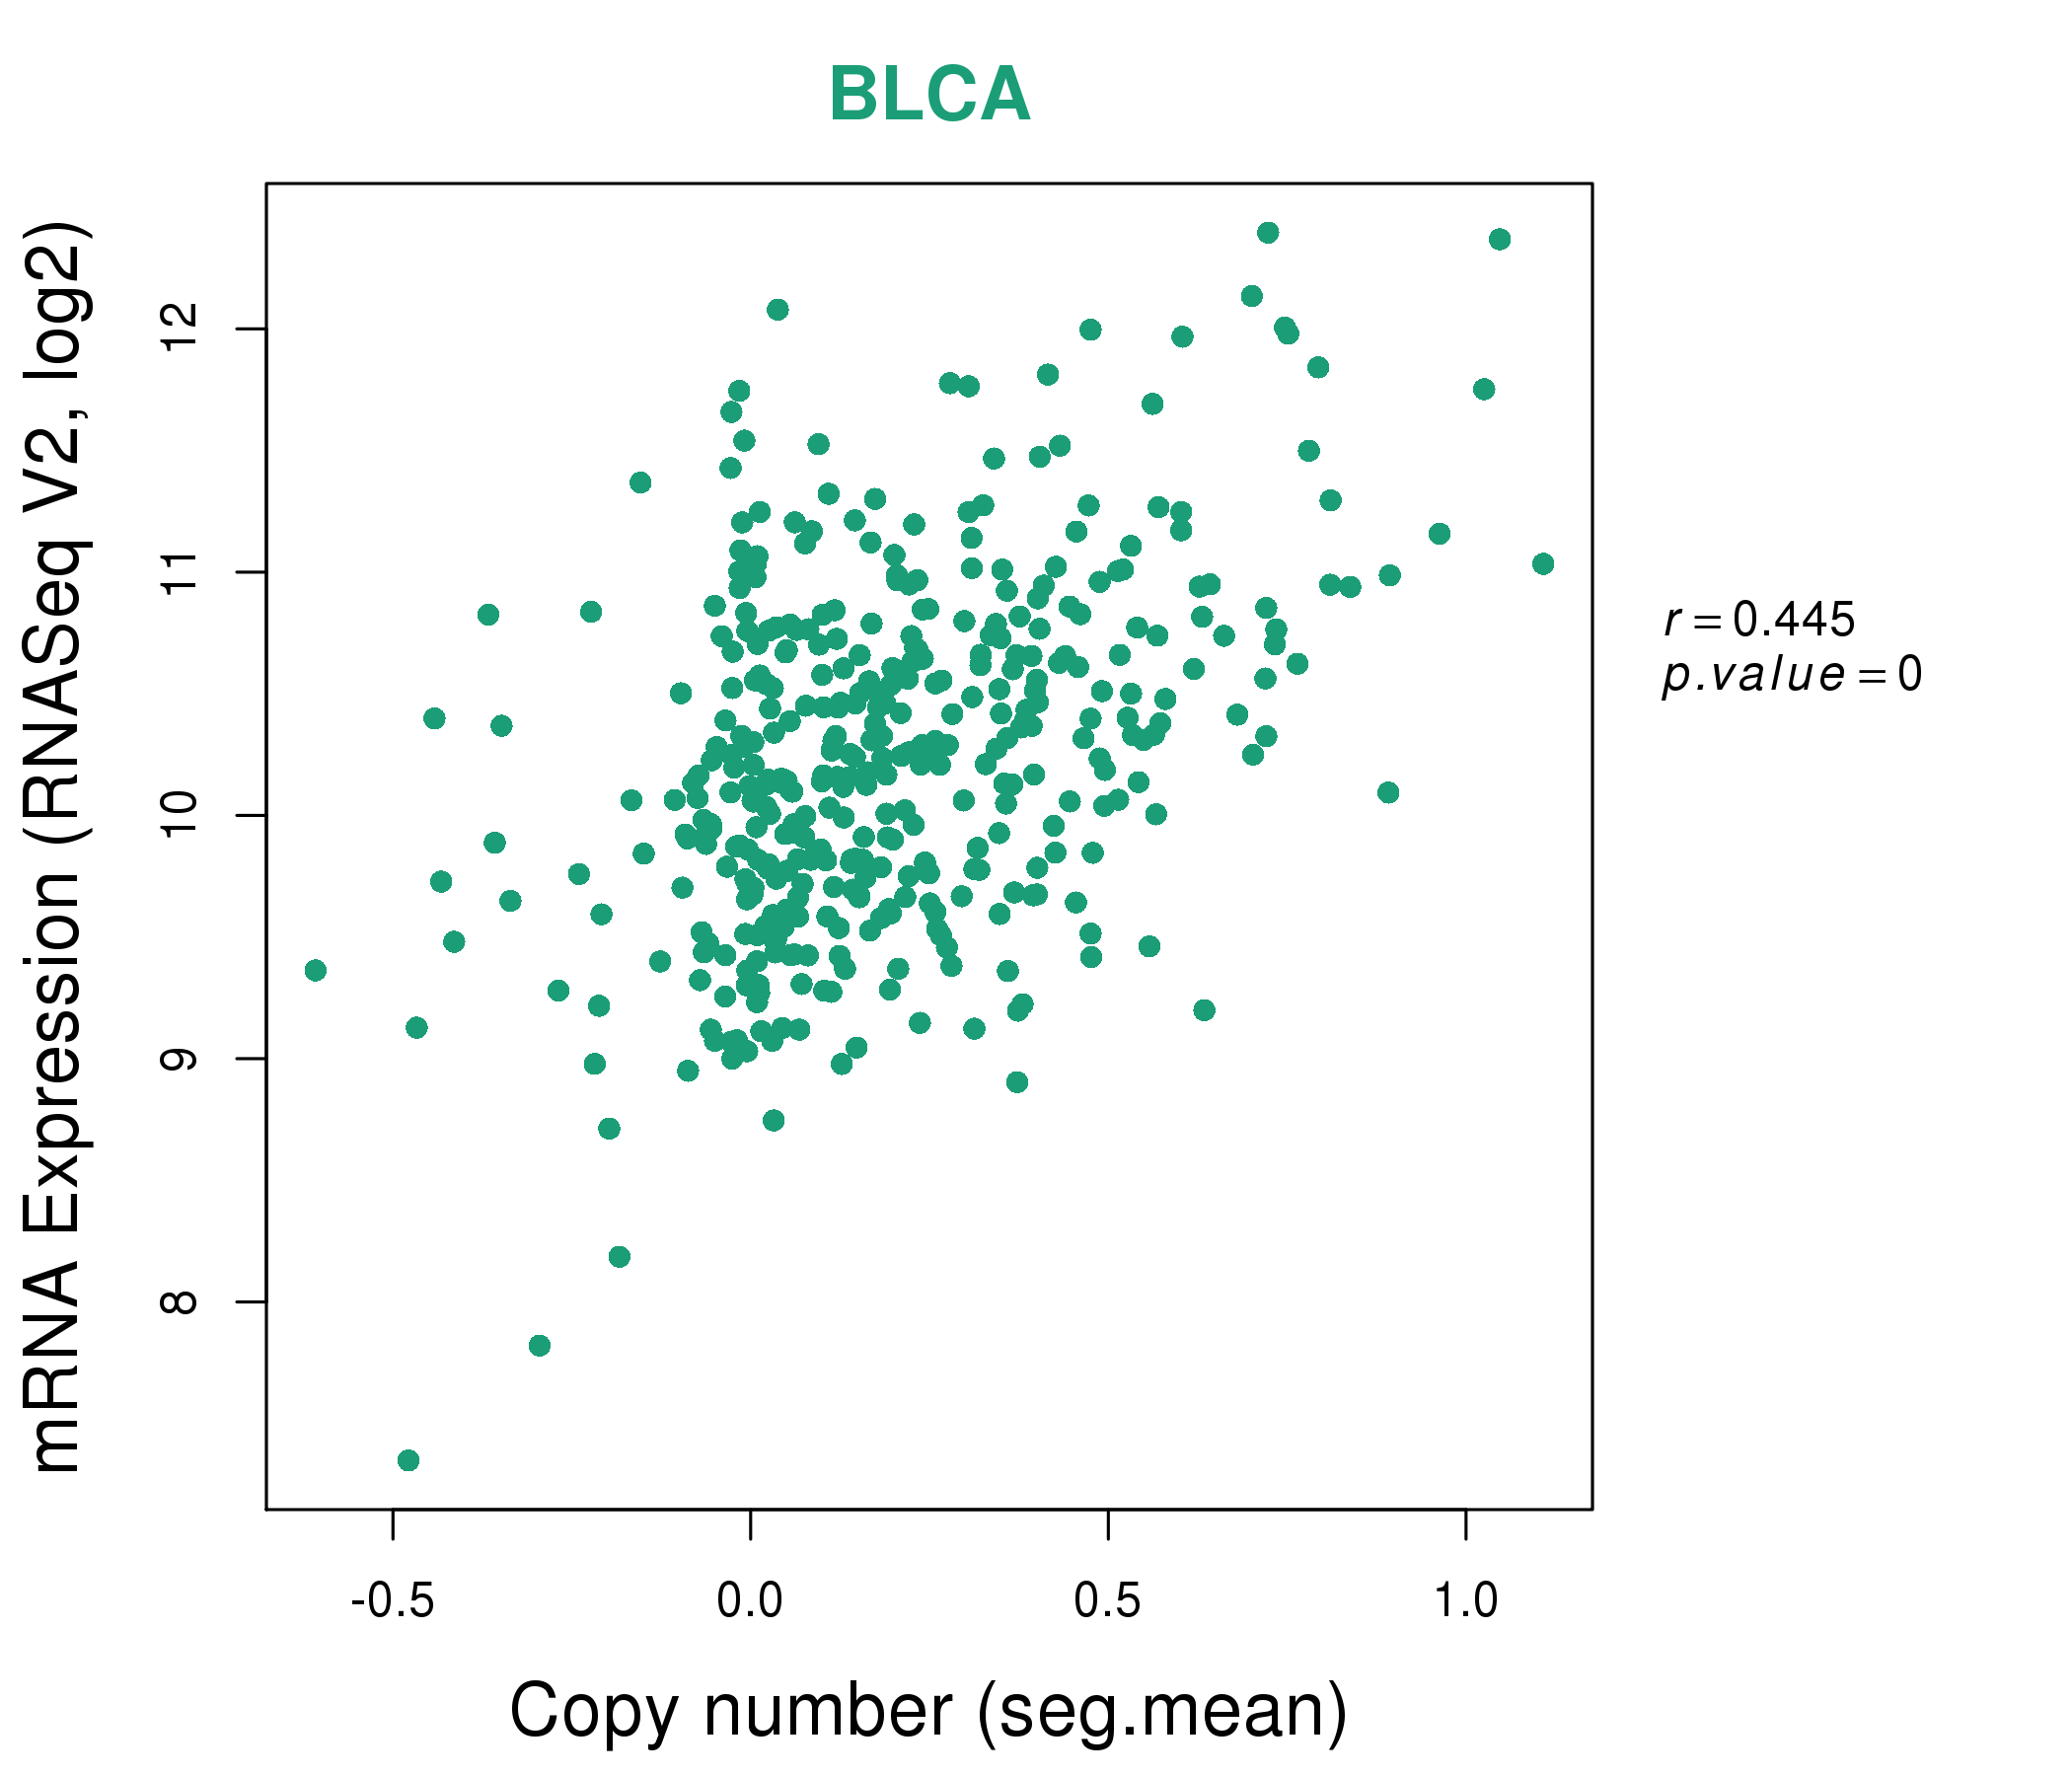
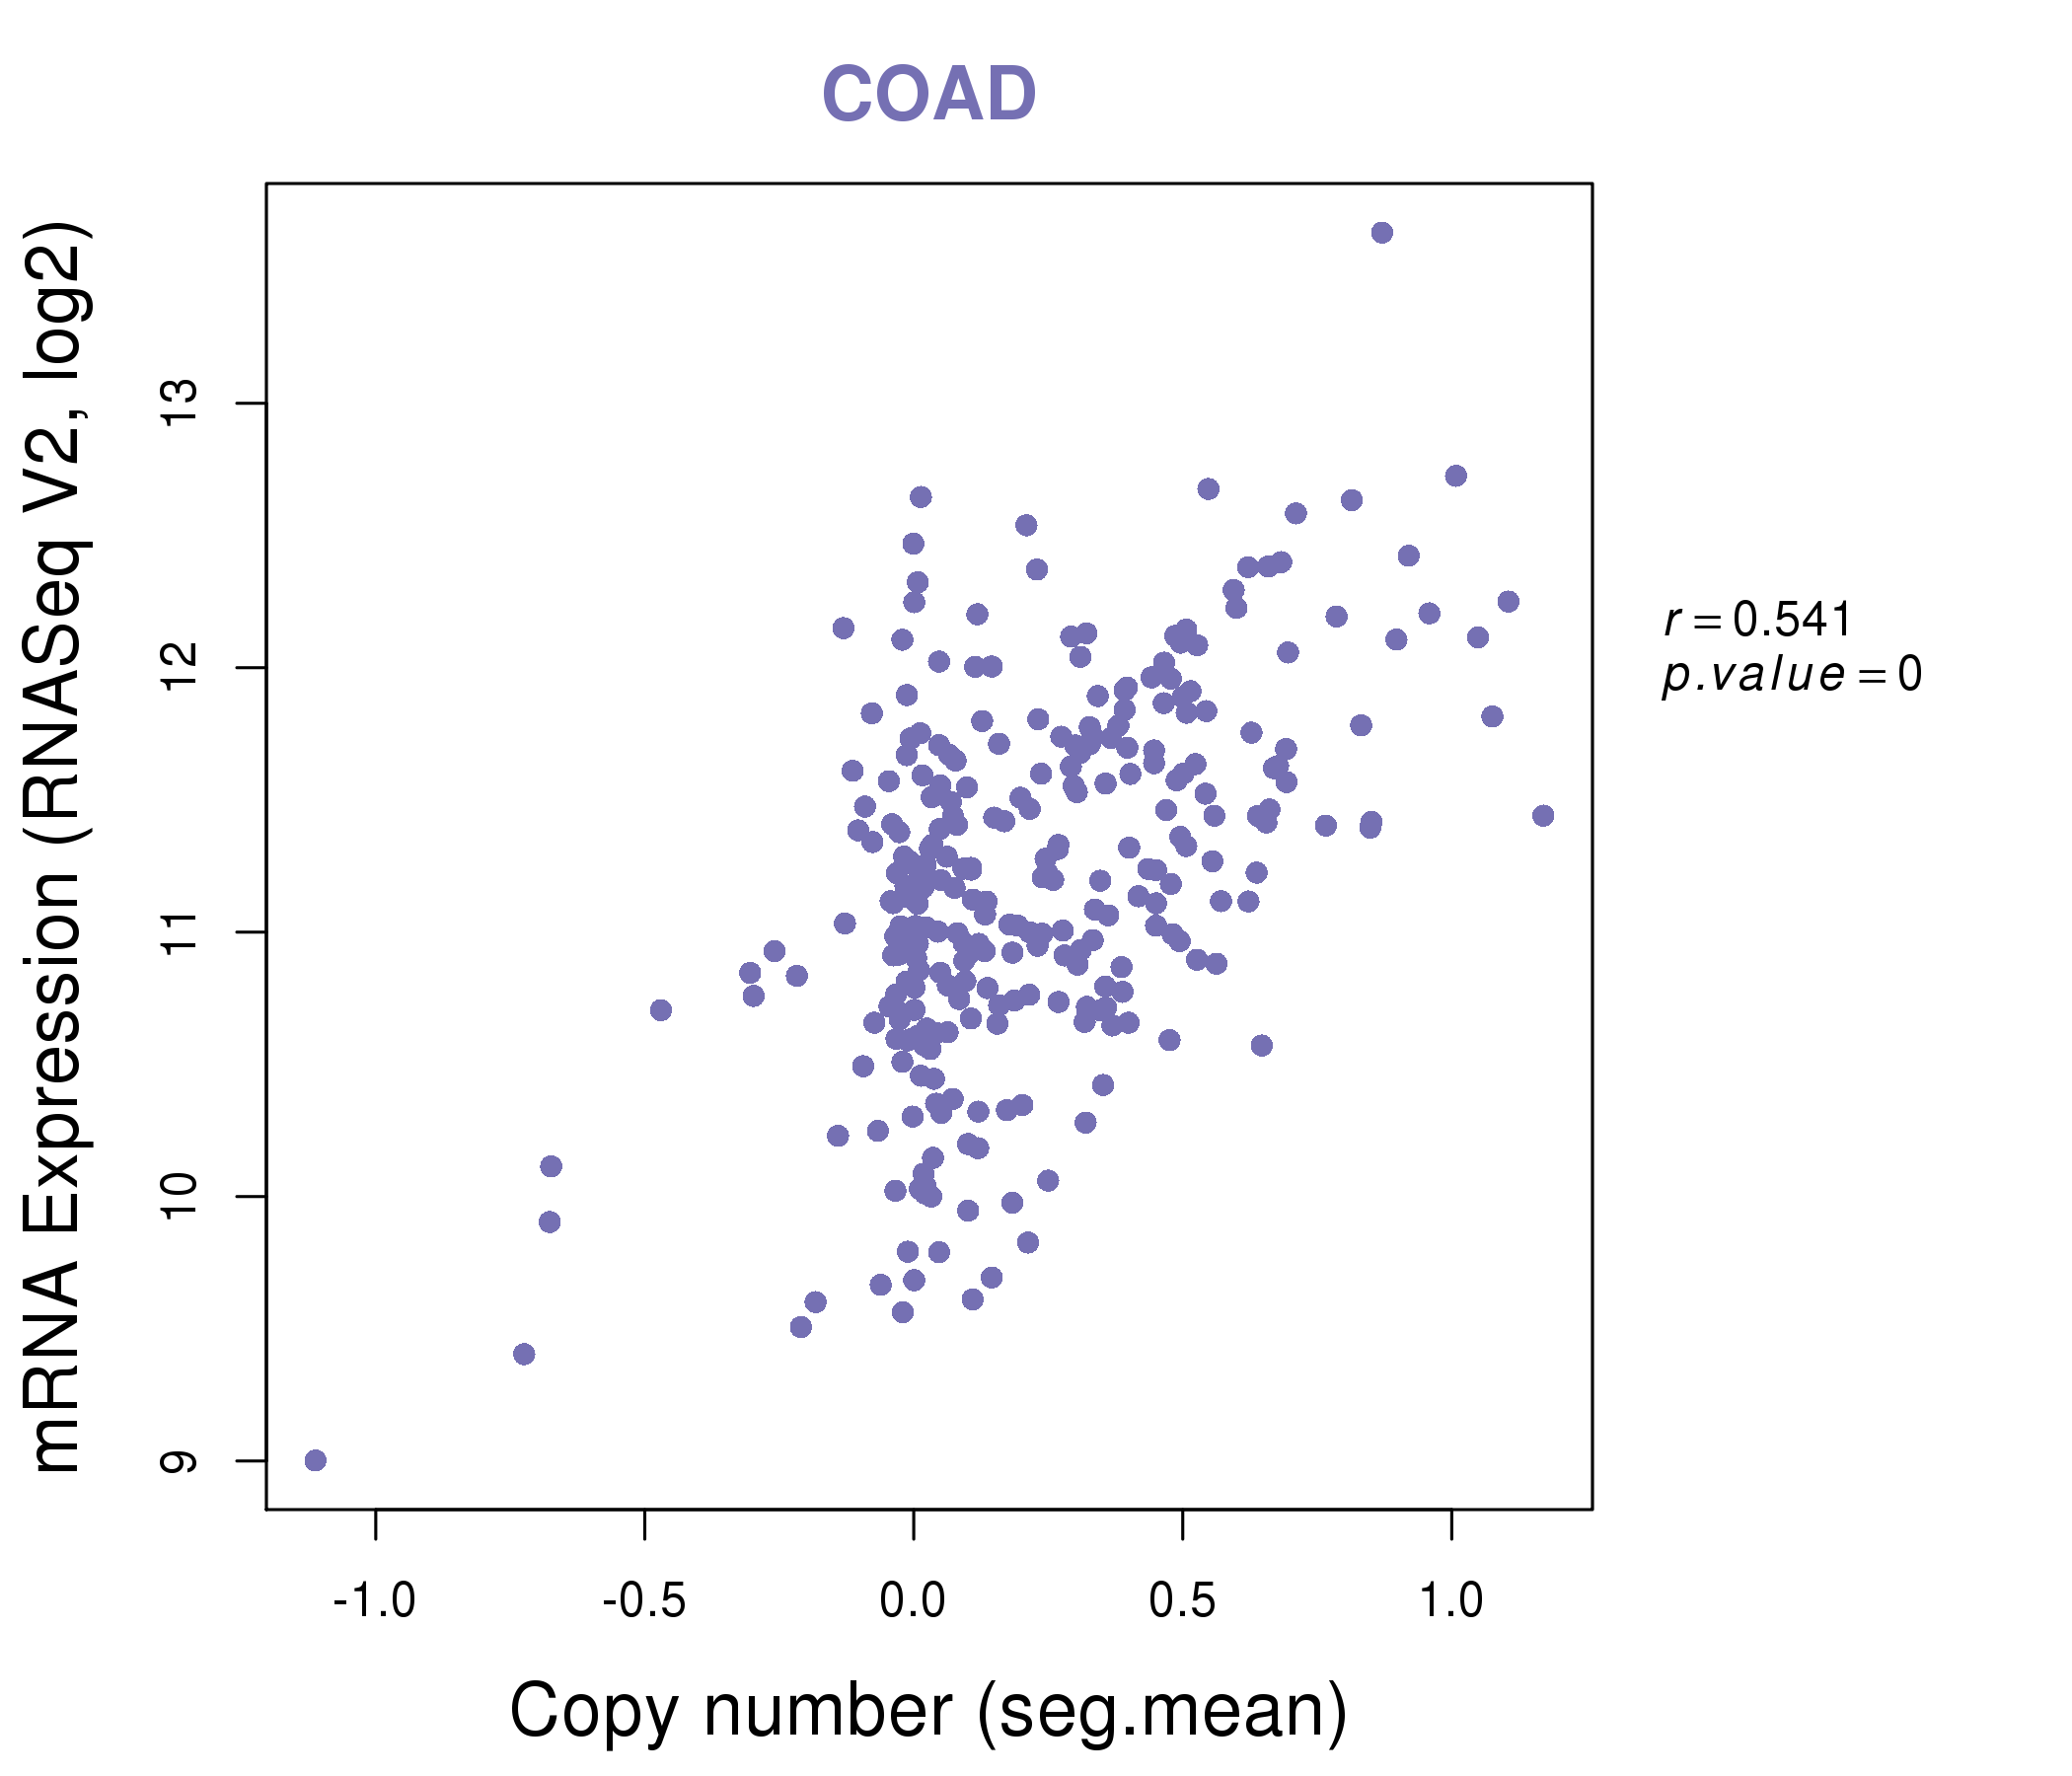
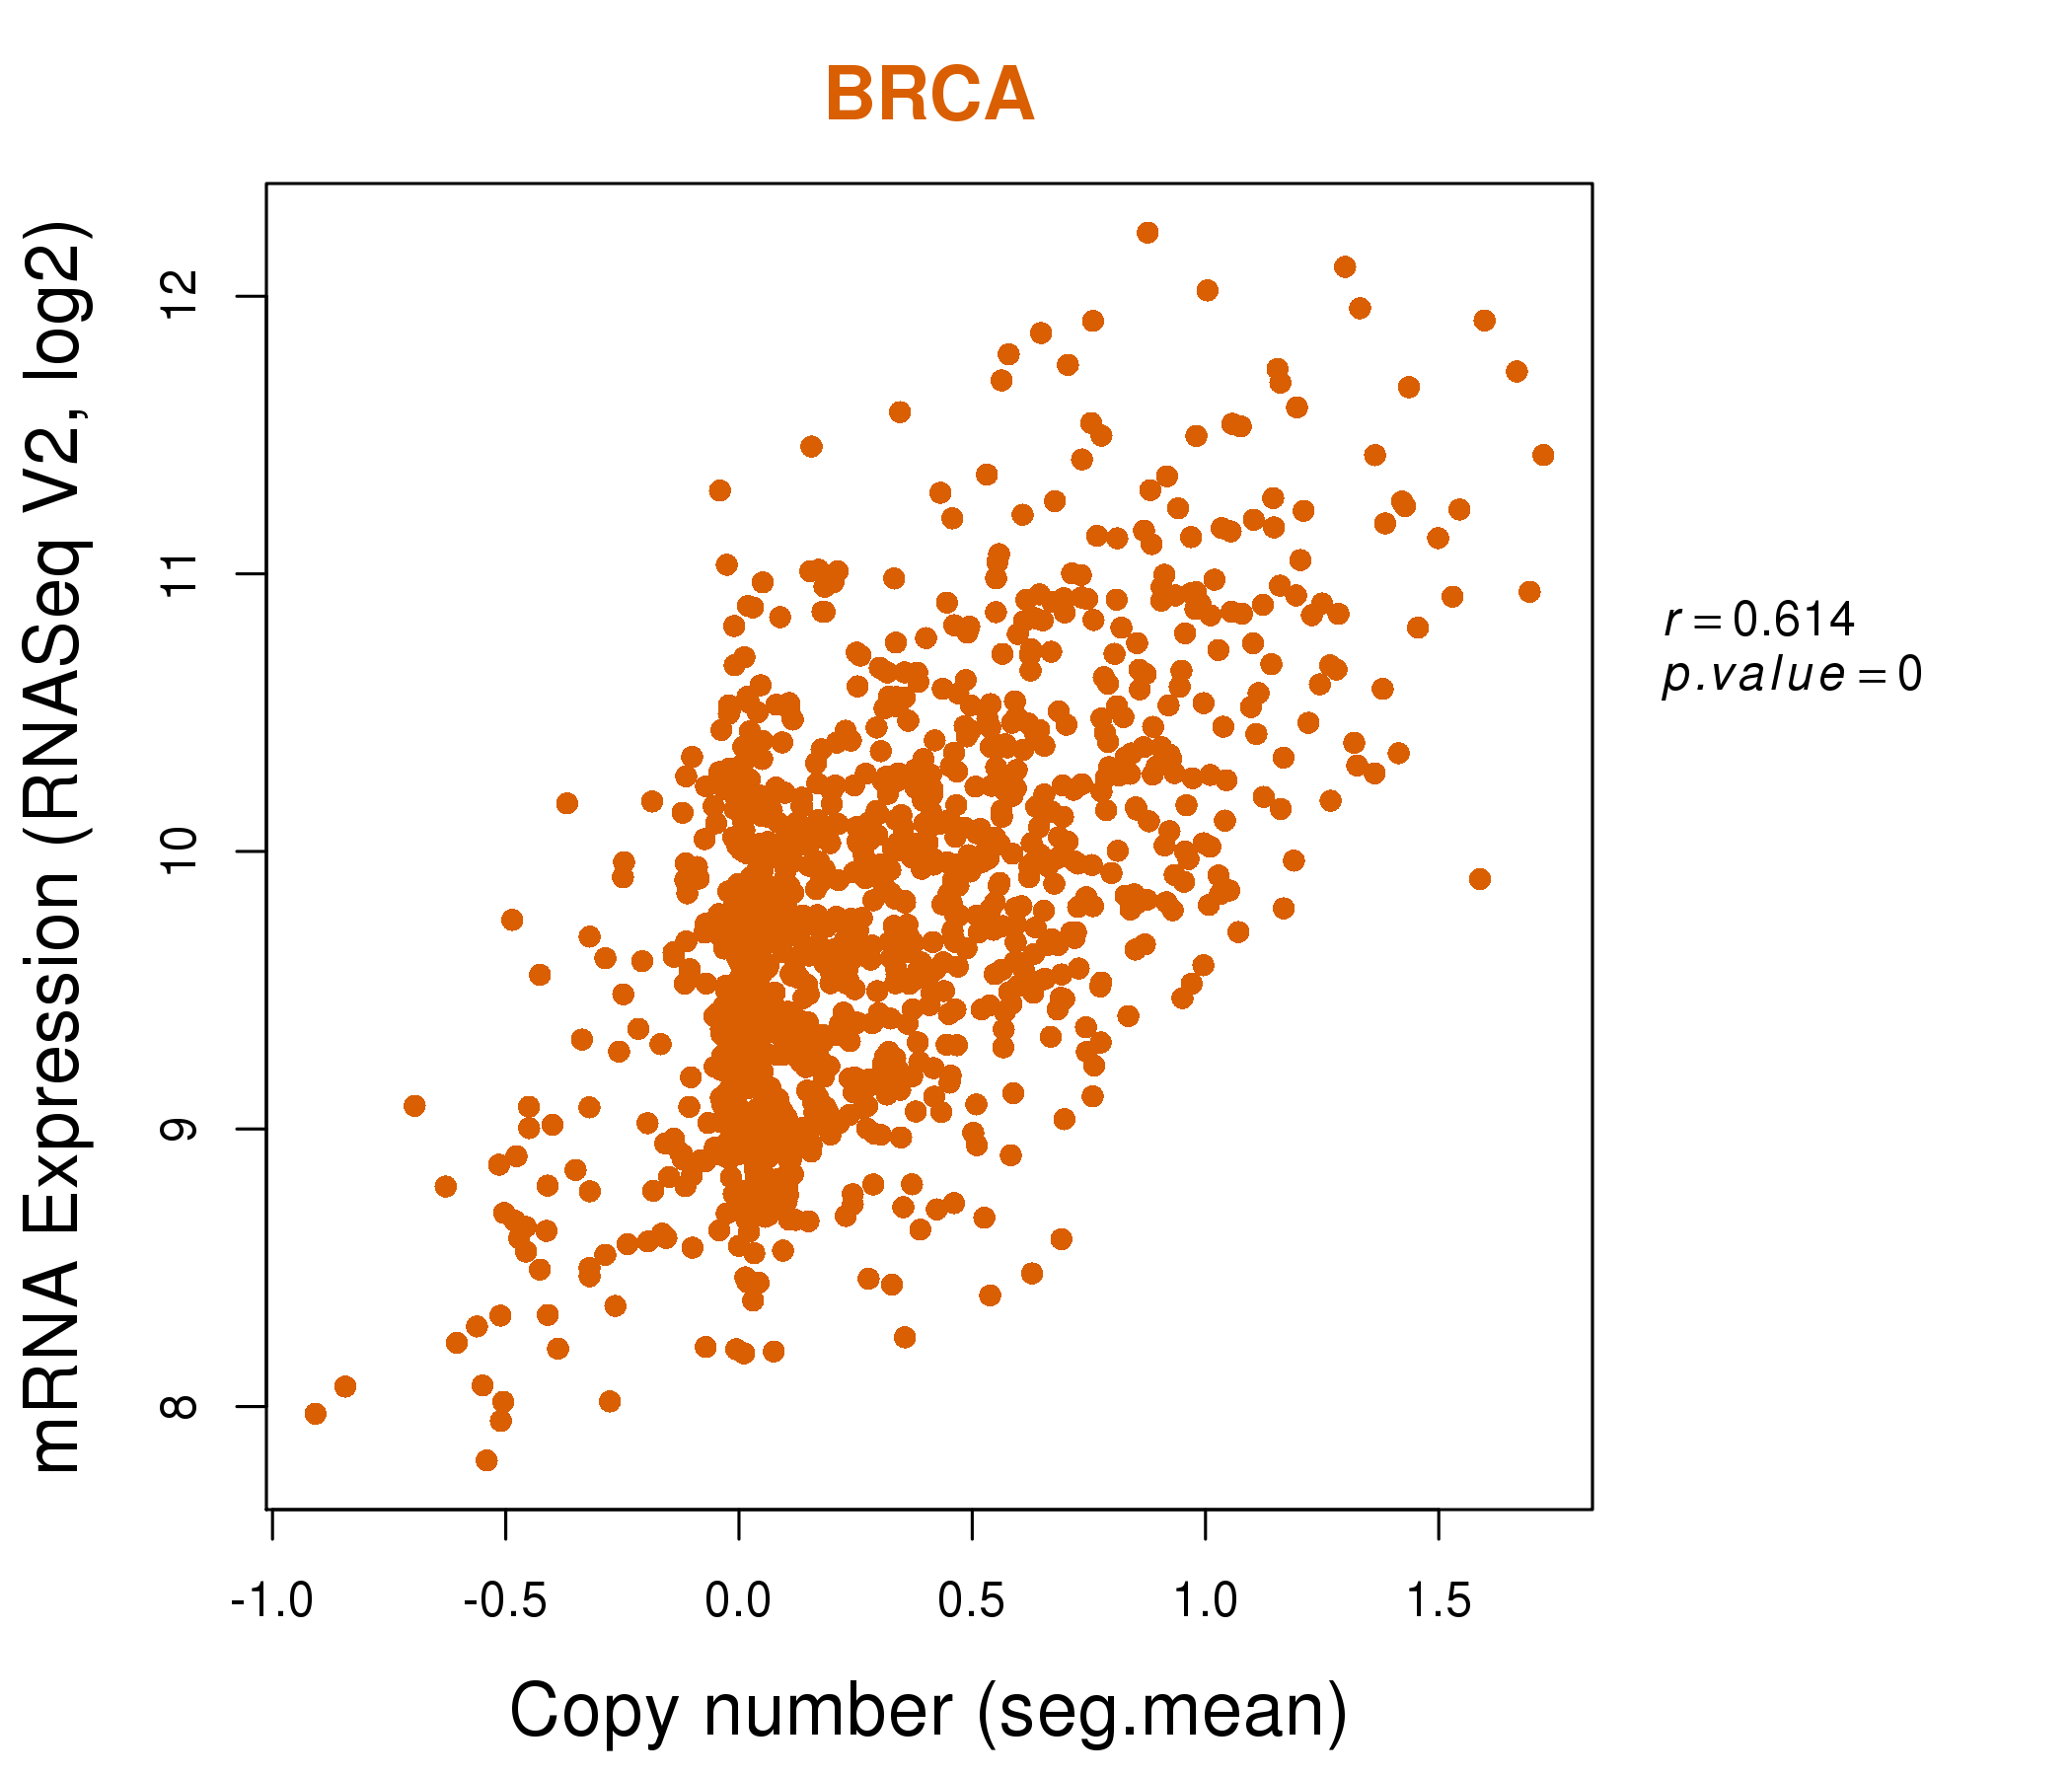
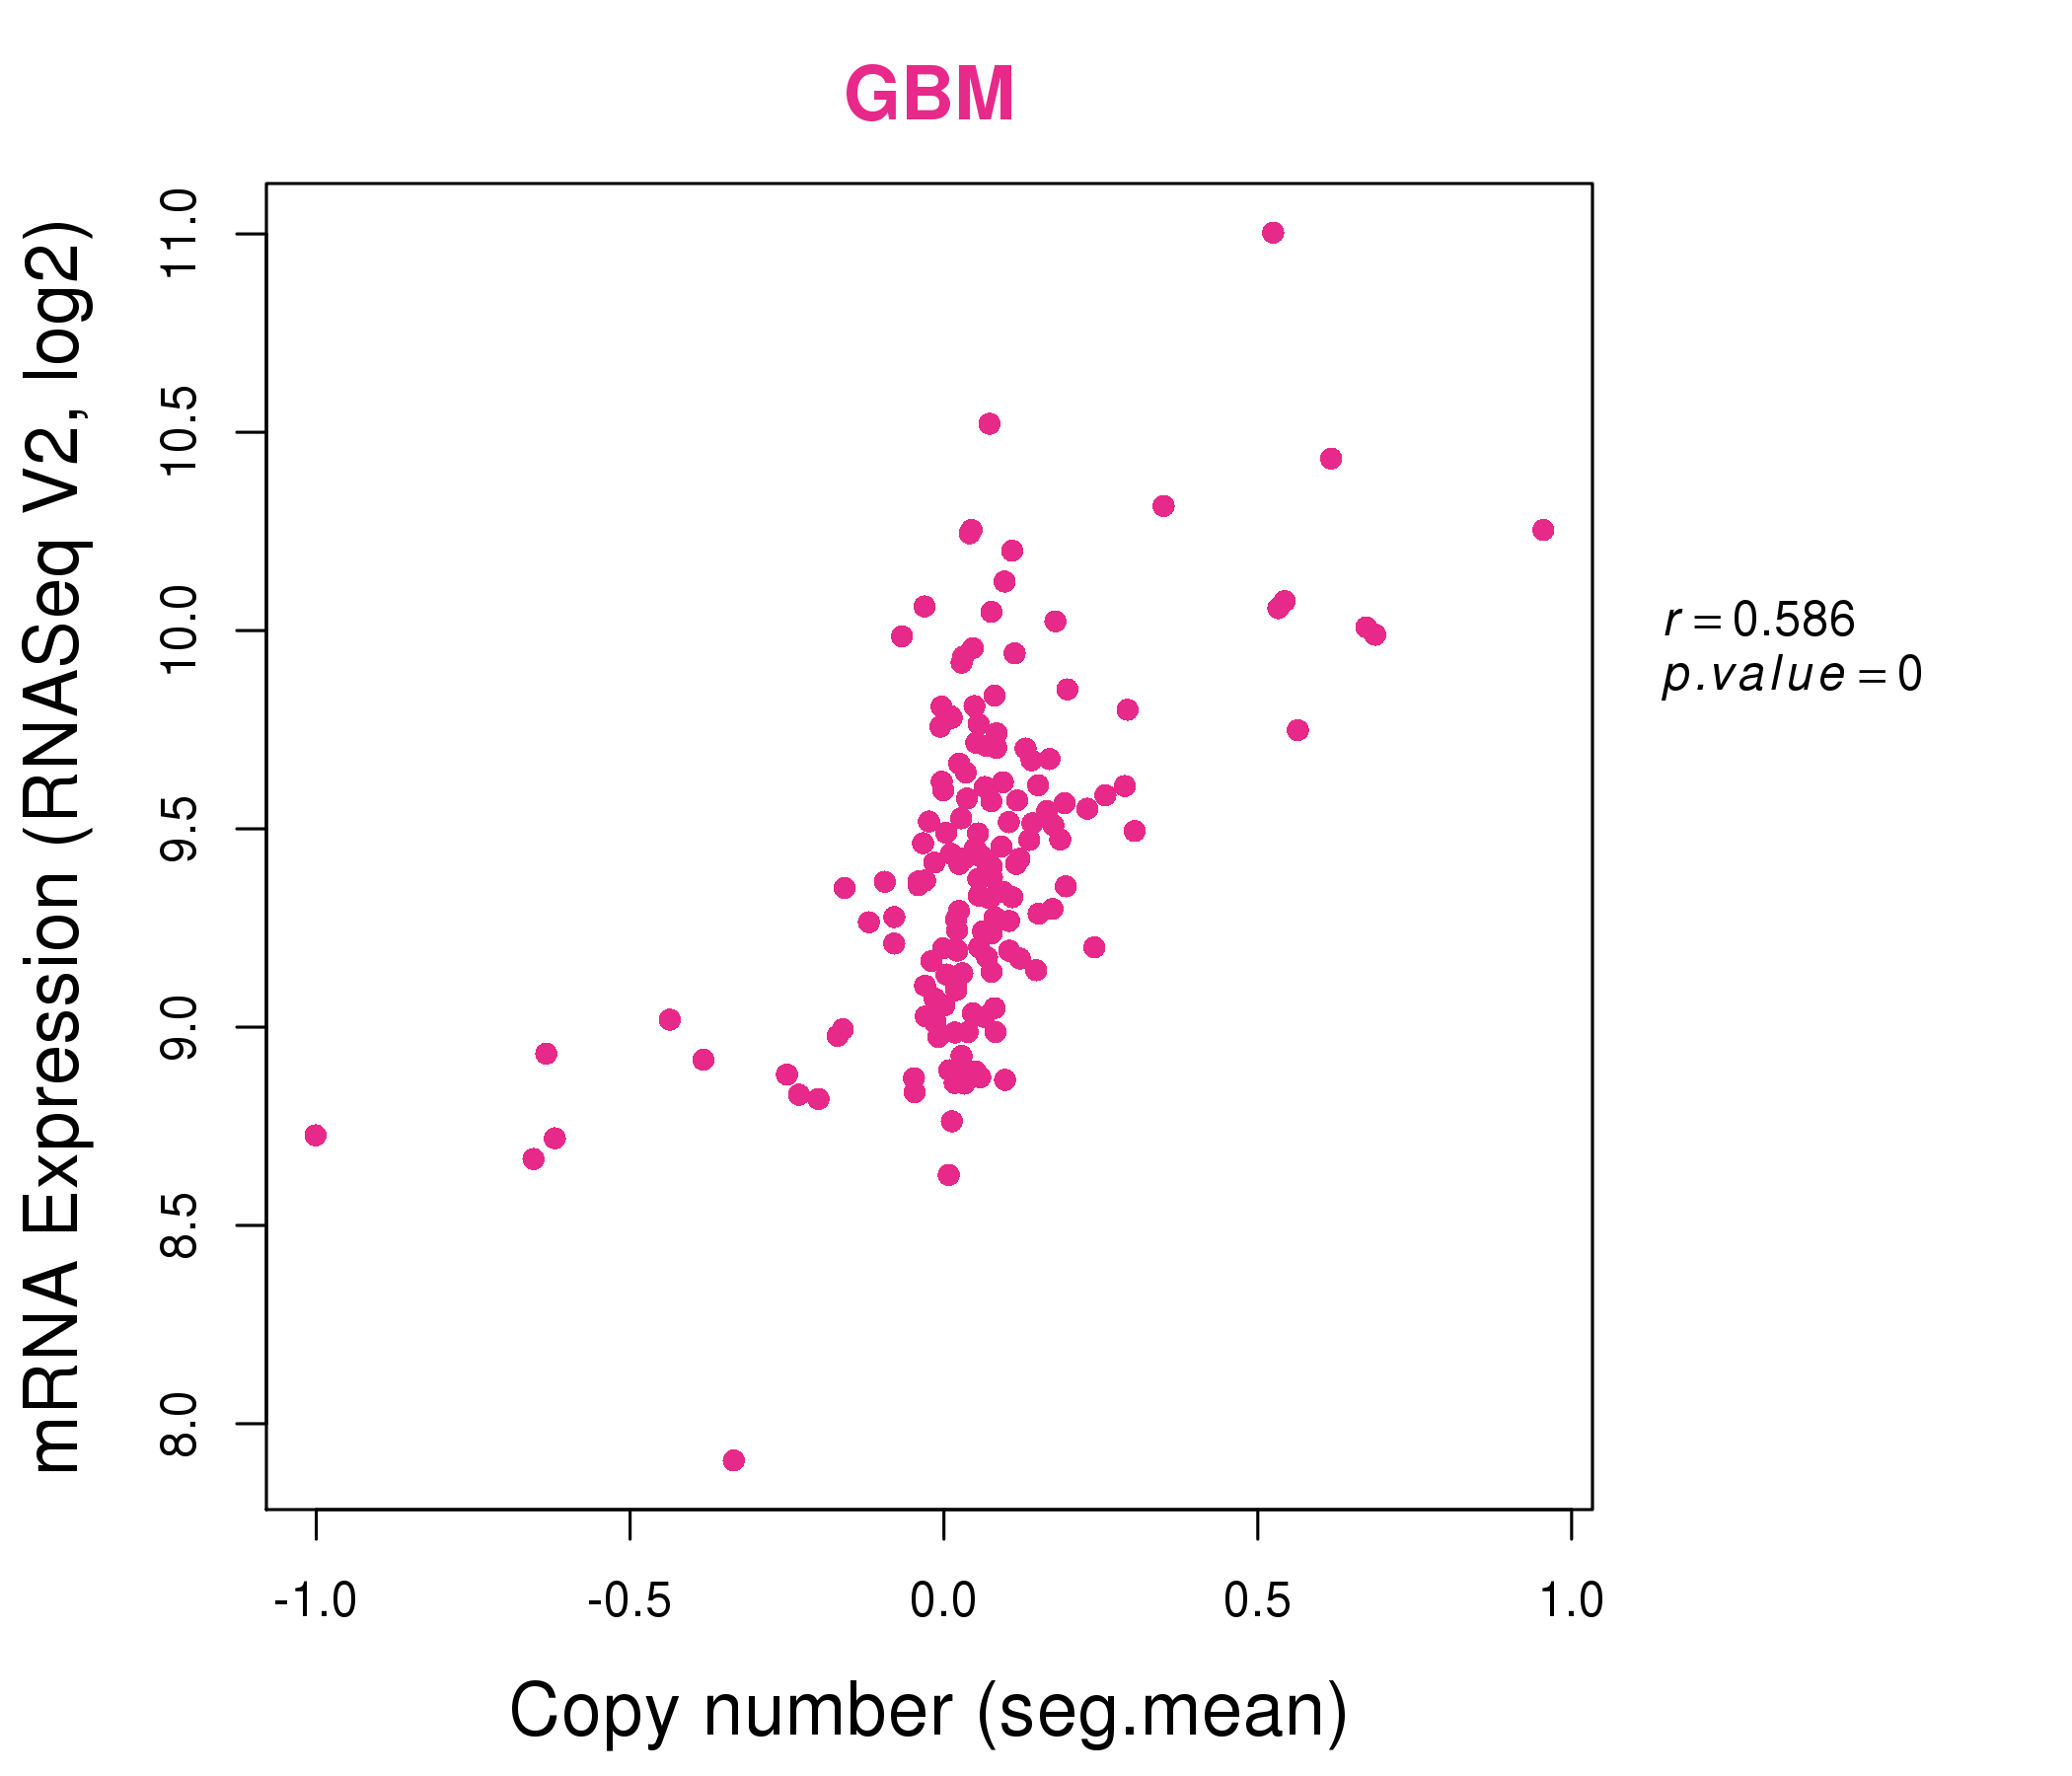
| * This plots show the correlation between CNV and gene expression. |
: Open all plots for all cancer types
 |
|
 |
|
| Top |
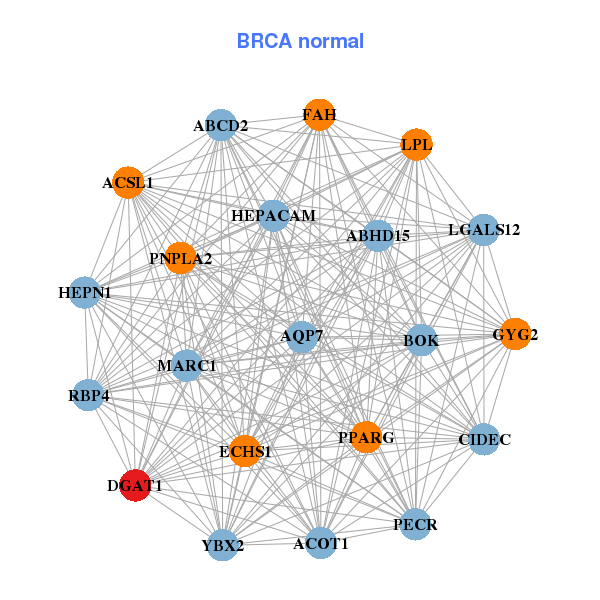
| Gene-Gene Network Information |
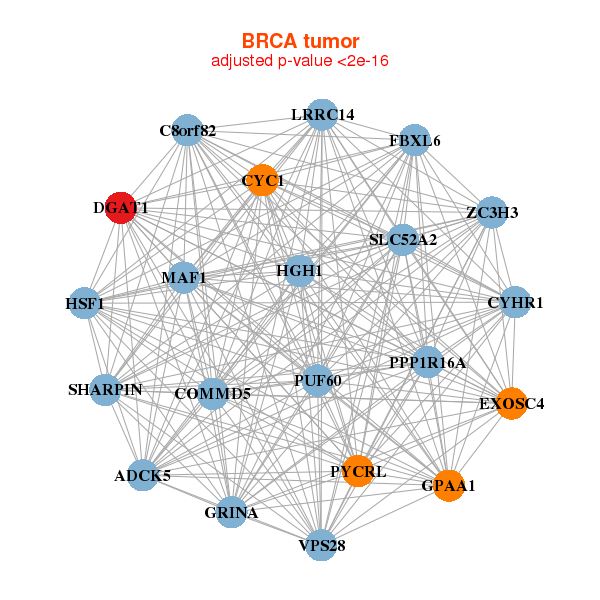
| * Co-Expression network figures were drawn using R package igraph. Only the top 20 genes with the highest correlations were shown. Red circle: input gene, orange circle: cell metabolism gene, sky circle: other gene |
: Open all plots for all cancer types
 |
|
| ADCK5,HGH1,COMMD5,CYC1,CYHR1,DGAT1,EXOSC4, FBXL6,GPAA1,SLC52A2,GRINA,HSF1,LRRC14,MAF1, C8orf82,PPP1R16A,PUF60,PYCRL,SHARPIN,VPS28,ZC3H3 | ABCD2,ABHD15,ACOT1,ACSL1,AQP7,BOK,CIDEC, DGAT1,ECHS1,FAH,GYG2,HEPACAM,HEPN1,LGALS12, LPL,MARC1,PECR,PNPLA2,PPARG,RBP4,YBX2 |
 |
|
| ADCK5,HGH1,COX6C,CYHR1,DGAT1,EXOSC4,FAM83H, FBXL6,GLI4,SLC52A2,GRINA,MROH1,HSF1,MAF1, MFSD3,NAPRT,OPLAH,PPP1R16A,SHARPIN,SLC39A4,VPS28 | ACE2,ALPI,TMEM253,SMIM24,CHN2,CIDEB,CREB3L3, CYP2J2,CYP4F2,DGAT1,FADS6,GLTPD2,HSD3B1,MS4A10, NAALADL1,NAT8B,NLRP6,OIT3,SLC15A1,SLC23A1,TM6SF2 |

| * Co-Expression network figures were drawn using R package igraph. Only the top 20 genes with the highest correlations were shown. Red circle: input gene, orange circle: cell metabolism gene, sky circle: other gene |
: Open all plots for all cancer types
| Top |
: Open all interacting genes' information including KEGG pathway for all interacting genes from DAVID
| Top |
| Pharmacological Information for DGAT1 |
| There's no related Drug. |
| Top |
| Cross referenced IDs for DGAT1 |
| * We obtained these cross-references from Uniprot database. It covers 150 different DBs, 18 categories. http://www.uniprot.org/help/cross_references_section |
: Open all cross reference information
|
Copyright © 2016-Present - The Univsersity of Texas Health Science Center at Houston @ |