|
||||||||||||||||||||||||||||||||||||||||||||||||||||||||||||||||||||||||||||||||||||||||||||||||||||||||||||||||||||||||||||||||||||||||||||||||||||||||||||||||||||||||||||||||||||||||||||||||||||||||||||||||||||||||||||||||||||||||||||||||||||||||||||||||||||||||||||||||||||||||||||||||||||||||||||||||||||||||||
| |
| Phenotypic Information (metabolism pathway, cancer, disease, phenome) |
| |
| |
| Gene-Gene Network Information: Co-Expression Network, Interacting Genes & KEGG |
| |
|


| Gene Summary for CDS2 |
| Basic gene info. | Gene symbol | CDS2 |
| Gene name | CDP-diacylglycerol synthase (phosphatidate cytidylyltransferase) 2 | |
| Synonyms | - | |
| Cytomap | UCSC genome browser: 20p13 | |
| Genomic location | chr20 :5107406-5178533 | |
| Type of gene | protein-coding | |
| RefGenes | NM_003818.3, | |
| Ensembl id | ENSG00000101290 | |
| Description | CDP-DAG synthase 2CDP-DG synthase 2CDP-DG synthetase 2CDP-diacylglycerol synthase 2CDP-diglyceride diphosphorylase 2CDP-diglyceride pyrophosphorylase 2CDP-diglyceride synthase 2CDP-diglyceride synthetase 2CDS 2CTP:phosphatidate cytidylyltransfera | |
| Modification date | 20141207 | |
| dbXrefs | MIM : 603549 | |
| HGNC : HGNC | ||
| Ensembl : ENSG00000101290 | ||
| HPRD : 09150 | ||
| Vega : OTTHUMG00000031801 | ||
| Protein | UniProt: go to UniProt's Cross Reference DB Table | |
| Expression | CleanEX: HS_CDS2 | |
| BioGPS: 8760 | ||
| Gene Expression Atlas: ENSG00000101290 | ||
| The Human Protein Atlas: ENSG00000101290 | ||
| Pathway | NCI Pathway Interaction Database: CDS2 | |
| KEGG: CDS2 | ||
| REACTOME: CDS2 | ||
| ConsensusPathDB | ||
| Pathway Commons: CDS2 | ||
| Metabolism | MetaCyc: CDS2 | |
| HUMANCyc: CDS2 | ||
| Regulation | Ensembl's Regulation: ENSG00000101290 | |
| miRBase: chr20 :5,107,406-5,178,533 | ||
| TargetScan: NM_003818 | ||
| cisRED: ENSG00000101290 | ||
| Context | iHOP: CDS2 | |
| cancer metabolism search in PubMed: CDS2 | ||
| UCL Cancer Institute: CDS2 | ||
| Assigned class in ccmGDB | C | |
| Top |
| Phenotypic Information for CDS2(metabolism pathway, cancer, disease, phenome) |
| Cancer | CGAP: CDS2 |
| Familial Cancer Database: CDS2 | |
| * This gene is included in those cancer gene databases. |
|
|
|
|
|
|
| ||||||||||||||||||||||||||||||||||||||||||||||||||||||||||||||||||||||||||||||||||||||||||||||||||||||||||||||||||||||||||||||||||||||||||||||||||||||||||||||||||||||||||||||||||||||||||||||||||||||||||||||||||||||||||||||||||||||||||||||||||||||||||||||||||||||||||||||||||||||||||||||||||||||||||||||||||||
Oncogene 1 | Significant driver gene in | |||||||||||||||||||||||||||||||||||||||||||||||||||||||||||||||||||||||||||||||||||||||||||||||||||||||||||||||||||||||||||||||||||||||||||||||||||||||||||||||||||||||||||||||||||||||||||||||||||||||||||||||||||||||||||||||||||||||||||||||||||||||||||||||||||||||||||||||||||||||||||||||||||||||||||||||||||||||||
| cf) number; DB name 1 Oncogene; http://nar.oxfordjournals.org/content/35/suppl_1/D721.long, 2 Tumor Suppressor gene; https://bioinfo.uth.edu/TSGene/, 3 Cancer Gene Census; http://www.nature.com/nrc/journal/v4/n3/abs/nrc1299.html, 4 CancerGenes; http://nar.oxfordjournals.org/content/35/suppl_1/D721.long, 5 Network of Cancer Gene; http://ncg.kcl.ac.uk/index.php, 1Therapeutic Vulnerabilities in Cancer; http://cbio.mskcc.org/cancergenomics/statius/ |
| KEGG_GLYCEROPHOSPHOLIPID_METABOLISM REACTOME_PHOSPHOLIPID_METABOLISM REACTOME_METABOLISM_OF_LIPIDS_AND_LIPOPROTEINS | |
| OMIM | |
| Orphanet | |
| Disease | KEGG Disease: CDS2 |
| MedGen: CDS2 (Human Medical Genetics with Condition) | |
| ClinVar: CDS2 | |
| Phenotype | MGI: CDS2 (International Mouse Phenotyping Consortium) |
| PhenomicDB: CDS2 | |
| Mutations for CDS2 |
| * Under tables are showing count per each tissue to give us broad intuition about tissue specific mutation patterns.You can go to the detailed page for each mutation database's web site. |
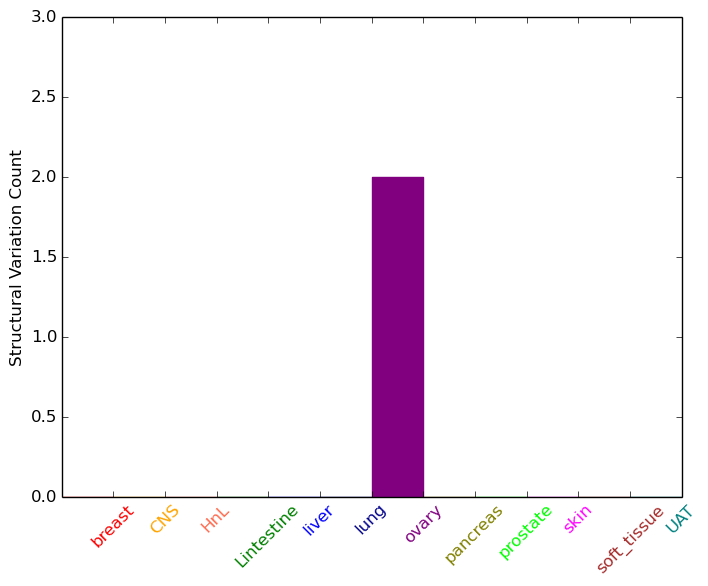
| - Statistics for Tissue and Mutation type | Top |
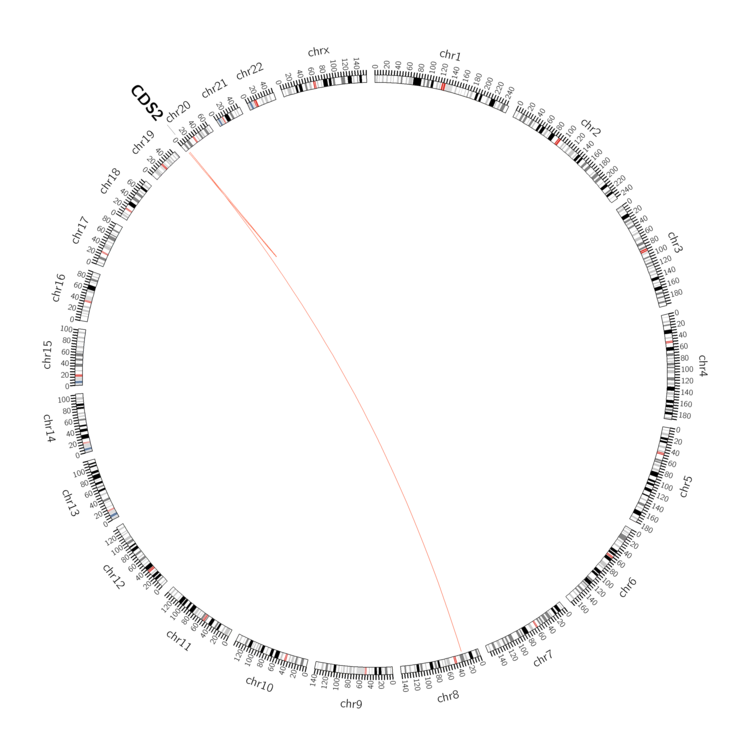 |
| - For Inter-chromosomal Variations |
| * Inter-chromosomal variantions includes 'interchromosomal amplicon to amplicon', 'interchromosomal amplicon to non-amplified dna', 'interchromosomal insertion', 'Interchromosomal unknown type'. |
 |
| - For Intra-chromosomal Variations |
| * Intra-chromosomal variantions includes 'intrachromosomal amplicon to amplicon', 'intrachromosomal amplicon to non-amplified dna', 'intrachromosomal deletion', 'intrachromosomal fold-back inversion', 'intrachromosomal inversion', 'intrachromosomal tandem duplication', 'Intrachromosomal unknown type', 'intrachromosomal with inverted orientation', 'intrachromosomal with non-inverted orientation'. |
 |
| Sample | Symbol_a | Chr_a | Start_a | End_a | Symbol_b | Chr_b | Start_b | End_b |
| ovary | CDS2 | chr20 | 5135500 | 5135520 | chr8 | 30642406 | 30642426 | |
| ovary | CDS2 | chr20 | 5165218 | 5165238 | CDS2 | chr20 | 5165357 | 5165377 |
| ovary | CDS2 | chr20 | 5169003 | 5169023 | chr20 | 3023744 | 3023764 |
| cf) Tissue number; Tissue name (1;Breast, 2;Central_nervous_system, 3;Haematopoietic_and_lymphoid_tissue, 4;Large_intestine, 5;Liver, 6;Lung, 7;Ovary, 8;Pancreas, 9;Prostate, 10;Skin, 11;Soft_tissue, 12;Upper_aerodigestive_tract) |
| * From mRNA Sanger sequences, Chitars2.0 arranged chimeric transcripts. This table shows CDS2 related fusion information. |
| ID | Head Gene | Tail Gene | Accession | Gene_a | qStart_a | qEnd_a | Chromosome_a | tStart_a | tEnd_a | Gene_a | qStart_a | qEnd_a | Chromosome_a | tStart_a | tEnd_a |
| DN999202 | CDS2 | 9 | 493 | 20 | 5175804 | 5176289 | CRK | 487 | 584 | 17 | 1325691 | 1325788 | |
| CB052191 | UBXN11 | 29 | 212 | 1 | 26608773 | 26608980 | CDS2 | 207 | 530 | 20 | 5172014 | 5172338 | |
| BI020398 | PIK3CD | 118 | 141 | 1 | 9784241 | 9784264 | CDS2 | 125 | 423 | 20 | 5173732 | 5174032 | |
| Top |
| Mutation type/ Tissue ID | brca | cns | cerv | endome | haematopo | kidn | Lintest | liver | lung | ns | ovary | pancre | prost | skin | stoma | thyro | urina | |||
| Total # sample | 3 | |||||||||||||||||||
| GAIN (# sample) | 3 | |||||||||||||||||||
| LOSS (# sample) |
| cf) Tissue ID; Tissue type (1; Breast, 2; Central_nervous_system, 3; Cervix, 4; Endometrium, 5; Haematopoietic_and_lymphoid_tissue, 6; Kidney, 7; Large_intestine, 8; Liver, 9; Lung, 10; NS, 11; Ovary, 12; Pancreas, 13; Prostate, 14; Skin, 15; Stomach, 16; Thyroid, 17; Urinary_tract) |
| Top |
|
 |
| Top |
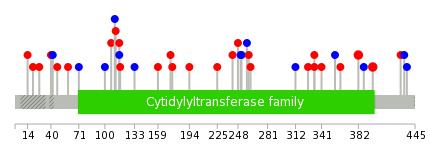
| Stat. for Non-Synonymous SNVs (# total SNVs=22) | (# total SNVs=9) |
 |  |
(# total SNVs=1) | (# total SNVs=0) |
 |
| Top |
| * When you move the cursor on each content, you can see more deailed mutation information on the Tooltip. Those are primary_site,primary_histology,mutation(aa),pubmedID. |
| GRCh37 position | Mutation(aa) | Unique sampleID count |
| chr20:5169729-5169729 | p.Y333F | 2 |
| chr20:5170424-5170424 | p.R382H | 2 |
| chr20:5170471-5170471 | p.A398T | 2 |
| chr20:5159548-5159548 | p.L159V | 1 |
| chr20:5166428-5166428 | p.G262C | 1 |
| chr20:5155926-5155926 | p.? | 1 |
| chr20:5170746-5170746 | p.? | 1 |
| chr20:5159590-5159590 | p.L173V | 1 |
| chr20:5167438-5167438 | p.L312L | 1 |
| chr20:5157302-5157302 | p.C100C | 1 |
| Top |
|
 |
| Point Mutation/ Tissue ID | 1 | 2 | 3 | 4 | 5 | 6 | 7 | 8 | 9 | 10 | 11 | 12 | 13 | 14 | 15 | 16 | 17 | 18 | 19 | 20 |
| # sample | 1 | 3 | 1 | 9 | 2 | 1 | 5 | 1 | 6 | 2 | 1 | 1 | ||||||||
| # mutation | 1 | 3 | 1 | 8 | 2 | 1 | 6 | 1 | 6 | 2 | 1 | 1 | ||||||||
| nonsynonymous SNV | 2 | 1 | 7 | 2 | 1 | 4 | 4 | 2 | 1 | 1 | ||||||||||
| synonymous SNV | 1 | 1 | 1 | 2 | 1 | 2 |
| cf) Tissue ID; Tissue type (1; BLCA[Bladder Urothelial Carcinoma], 2; BRCA[Breast invasive carcinoma], 3; CESC[Cervical squamous cell carcinoma and endocervical adenocarcinoma], 4; COAD[Colon adenocarcinoma], 5; GBM[Glioblastoma multiforme], 6; Glioma Low Grade, 7; HNSC[Head and Neck squamous cell carcinoma], 8; KICH[Kidney Chromophobe], 9; KIRC[Kidney renal clear cell carcinoma], 10; KIRP[Kidney renal papillary cell carcinoma], 11; LAML[Acute Myeloid Leukemia], 12; LUAD[Lung adenocarcinoma], 13; LUSC[Lung squamous cell carcinoma], 14; OV[Ovarian serous cystadenocarcinoma ], 15; PAAD[Pancreatic adenocarcinoma], 16; PRAD[Prostate adenocarcinoma], 17; SKCM[Skin Cutaneous Melanoma], 18:STAD[Stomach adenocarcinoma], 19:THCA[Thyroid carcinoma], 20:UCEC[Uterine Corpus Endometrial Carcinoma]) |
| Top |
| * We represented just top 10 SNVs. When you move the cursor on each content, you can see more deailed mutation information on the Tooltip. Those are primary_site, primary_histology, mutation(aa), pubmedID. |
| Genomic Position | Mutation(aa) | Unique sampleID count |
| chr20:5170424 | p.R382H | 2 |
| chr20:5165556 | p.L159V | 1 |
| chr20:5157335 | p.A341V | 1 |
| chr20:5165585 | p.R160Q | 1 |
| chr20:5170443 | p.K361N | 1 |
| chr20:5157336 | p.T172I | 1 |
| chr20:5165588 | p.L173V | 1 |
| chr20:5170471 | p.L388L | 1 |
| chr20:5157348 | p.L175V | 1 |
| chr20:5166422 | p.A398T | 1 |
| * Copy number data were extracted from TCGA using R package TCGA-Assembler. The URLs of all public data files on TCGA DCC data server were gathered on Jan-05-2015. Function ProcessCNAData in TCGA-Assembler package was used to obtain gene-level copy number value which is calculated as the average copy number of the genomic region of a gene. |
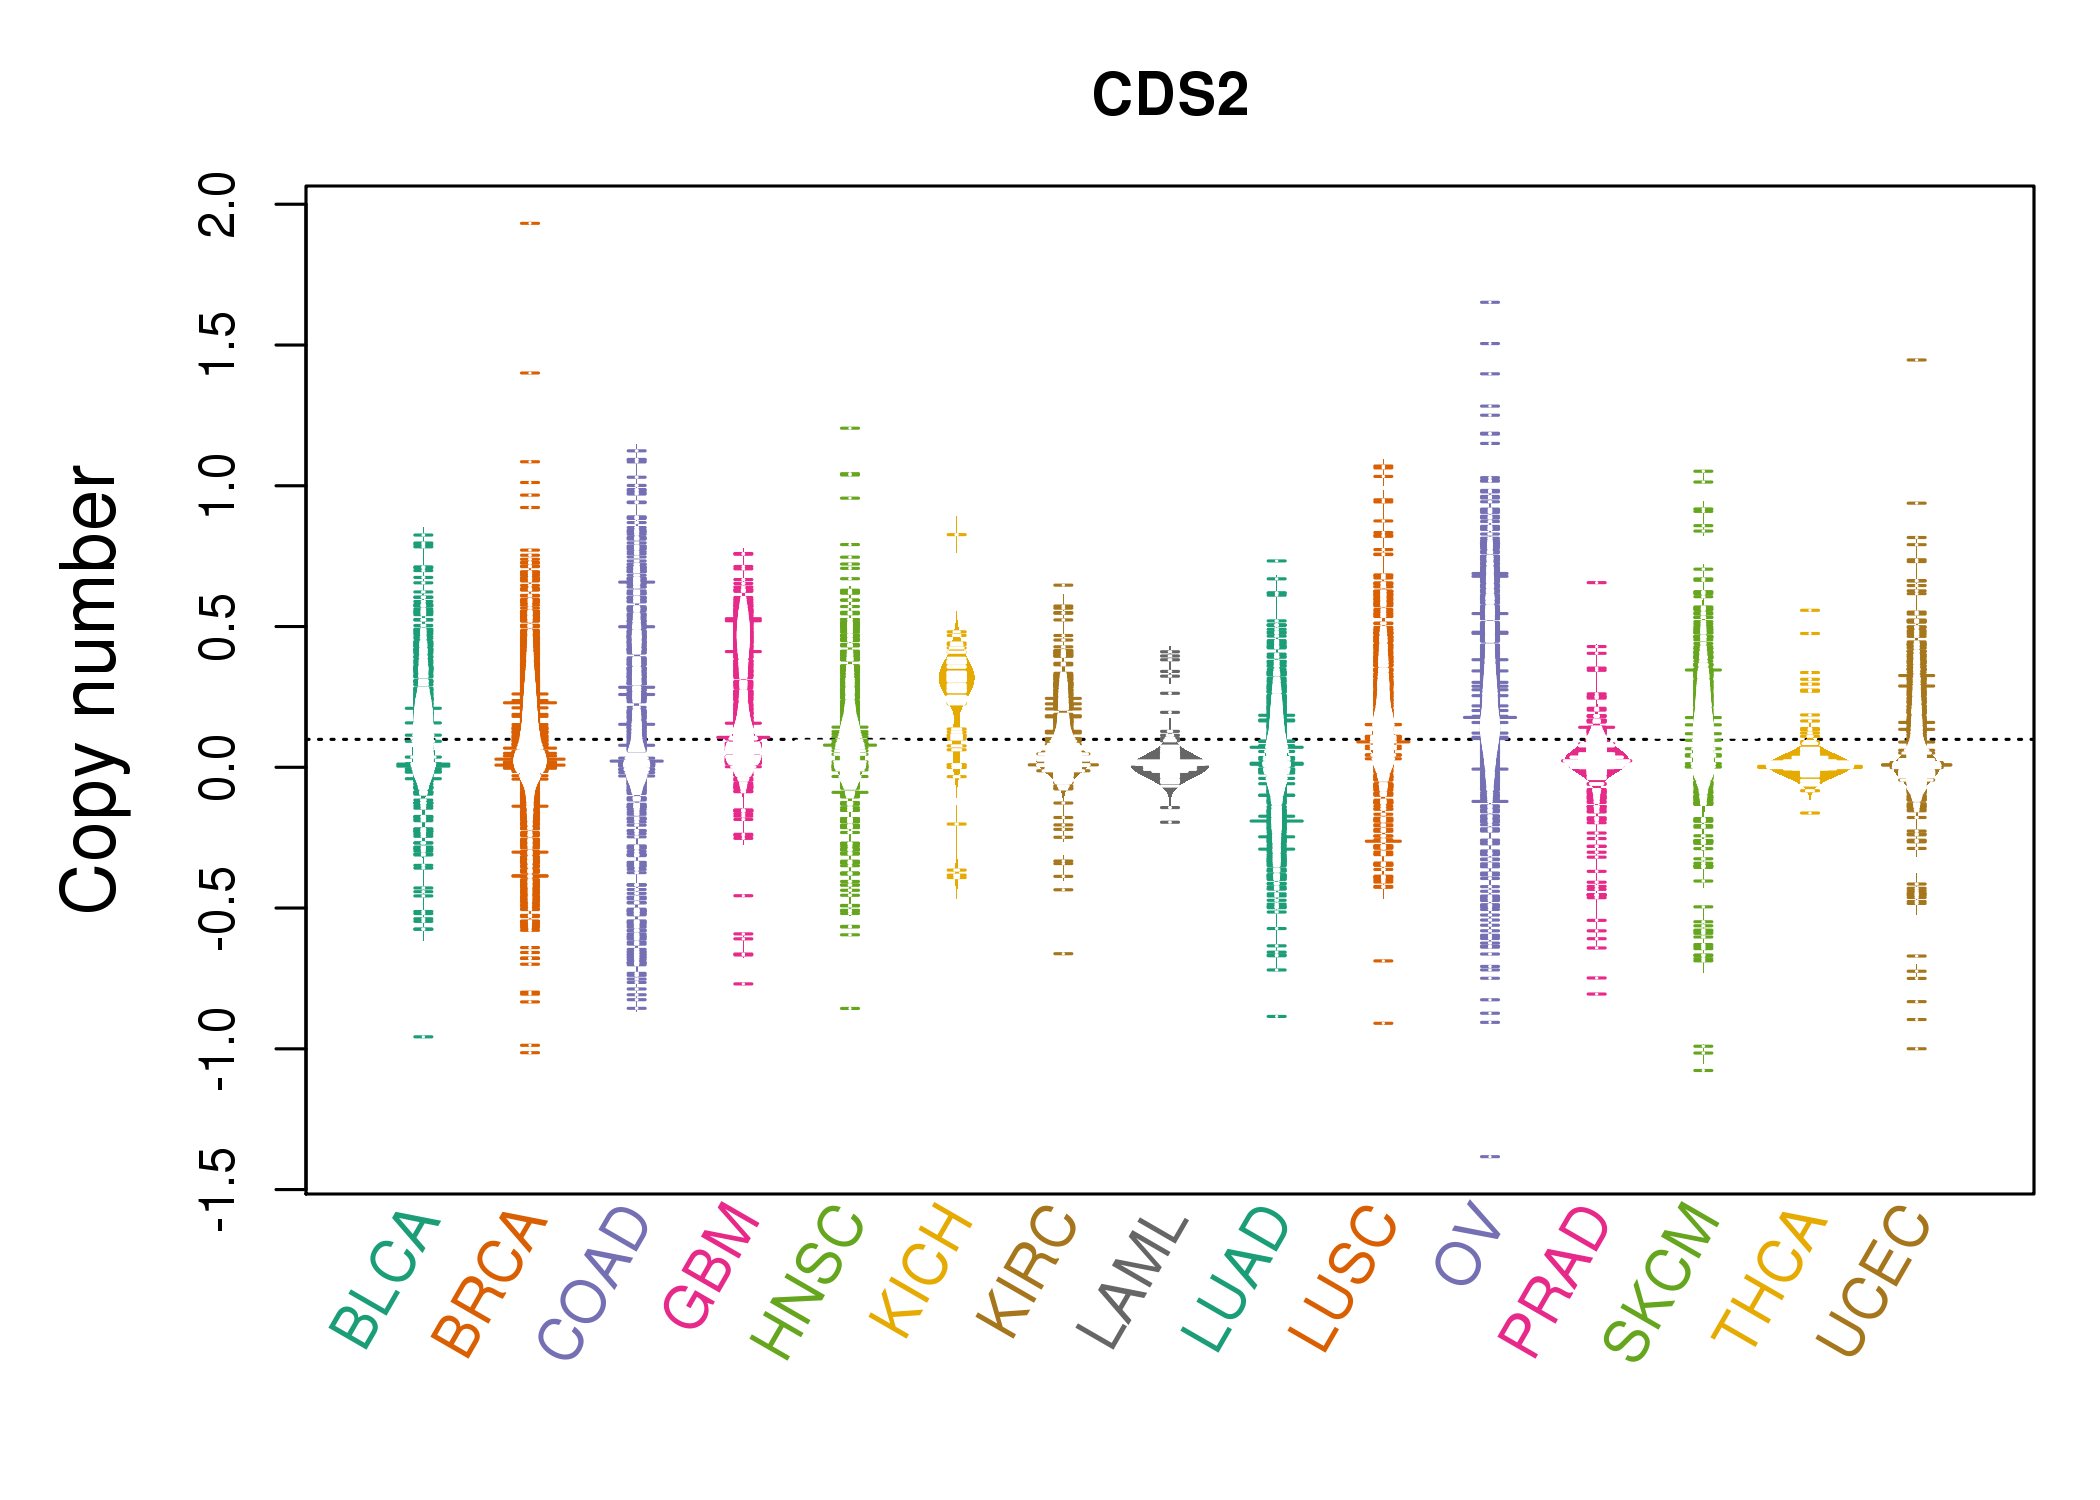 |
| cf) Tissue ID[Tissue type]: BLCA[Bladder Urothelial Carcinoma], BRCA[Breast invasive carcinoma], CESC[Cervical squamous cell carcinoma and endocervical adenocarcinoma], COAD[Colon adenocarcinoma], GBM[Glioblastoma multiforme], Glioma Low Grade, HNSC[Head and Neck squamous cell carcinoma], KICH[Kidney Chromophobe], KIRC[Kidney renal clear cell carcinoma], KIRP[Kidney renal papillary cell carcinoma], LAML[Acute Myeloid Leukemia], LUAD[Lung adenocarcinoma], LUSC[Lung squamous cell carcinoma], OV[Ovarian serous cystadenocarcinoma ], PAAD[Pancreatic adenocarcinoma], PRAD[Prostate adenocarcinoma], SKCM[Skin Cutaneous Melanoma], STAD[Stomach adenocarcinoma], THCA[Thyroid carcinoma], UCEC[Uterine Corpus Endometrial Carcinoma] |
| Top |
| Gene Expression for CDS2 |
| * CCLE gene expression data were extracted from CCLE_Expression_Entrez_2012-10-18.res: Gene-centric RMA-normalized mRNA expression data. |
 |
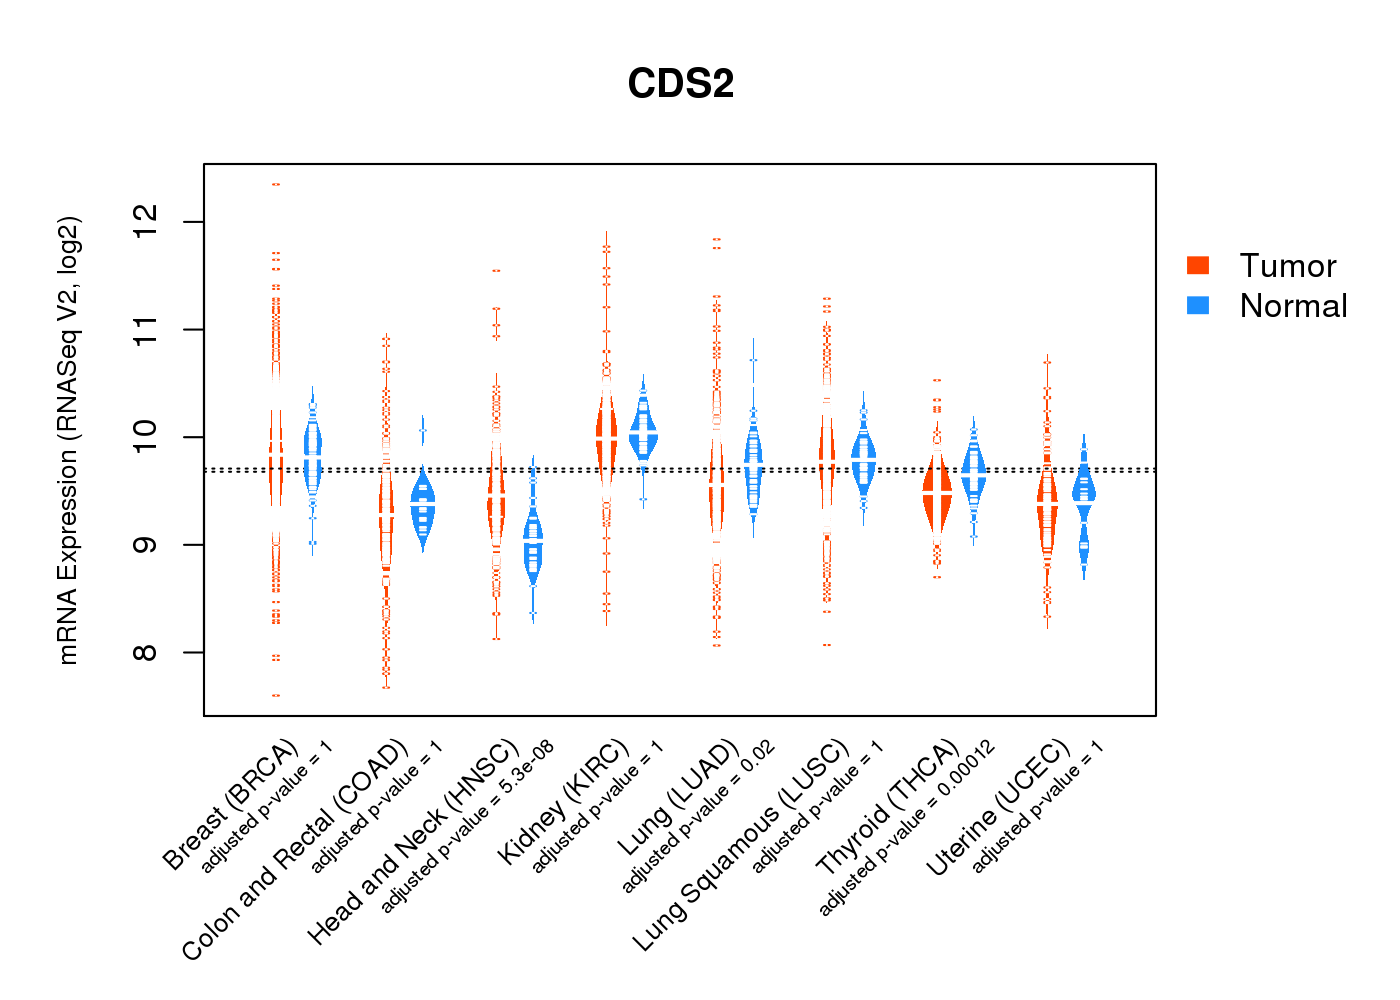
| * Normalized gene expression data of RNASeqV2 was extracted from TCGA using R package TCGA-Assembler. The URLs of all public data files on TCGA DCC data server were gathered at Jan-05-2015. Only eight cancer types have enough normal control samples for differential expression analysis. (t test, adjusted p<0.05 (using Benjamini-Hochberg FDR)) |
 |
| Top |
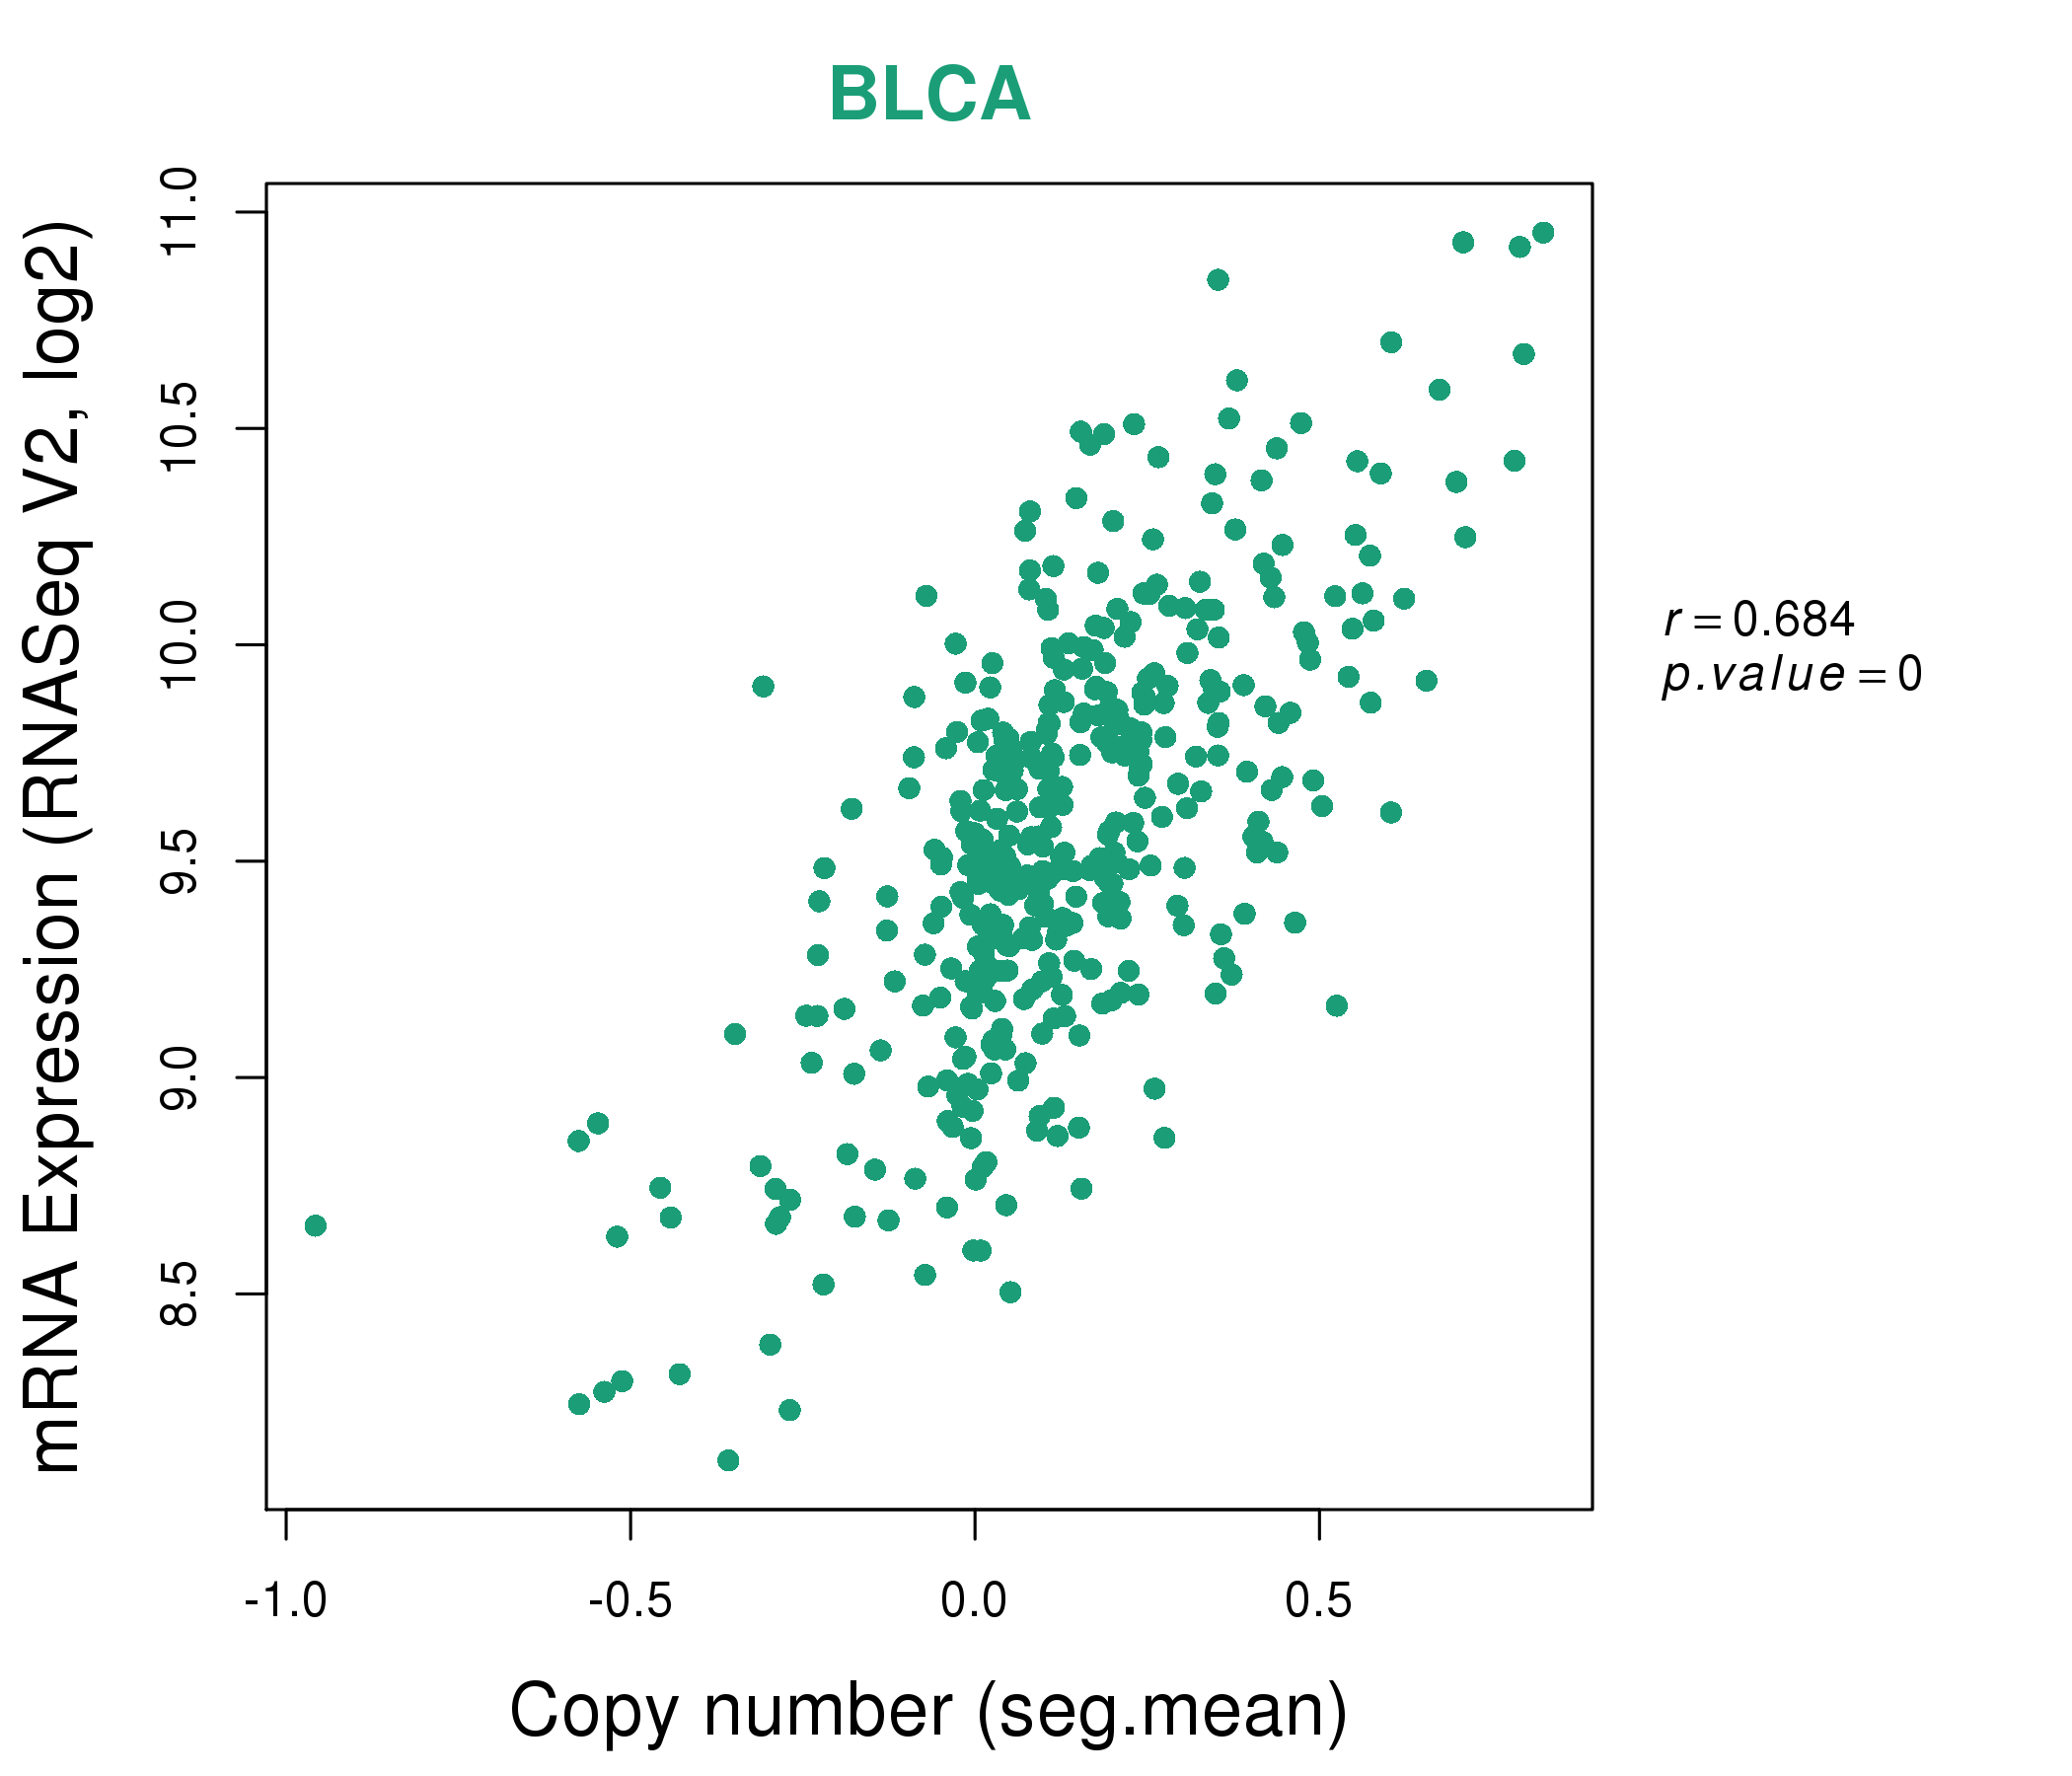
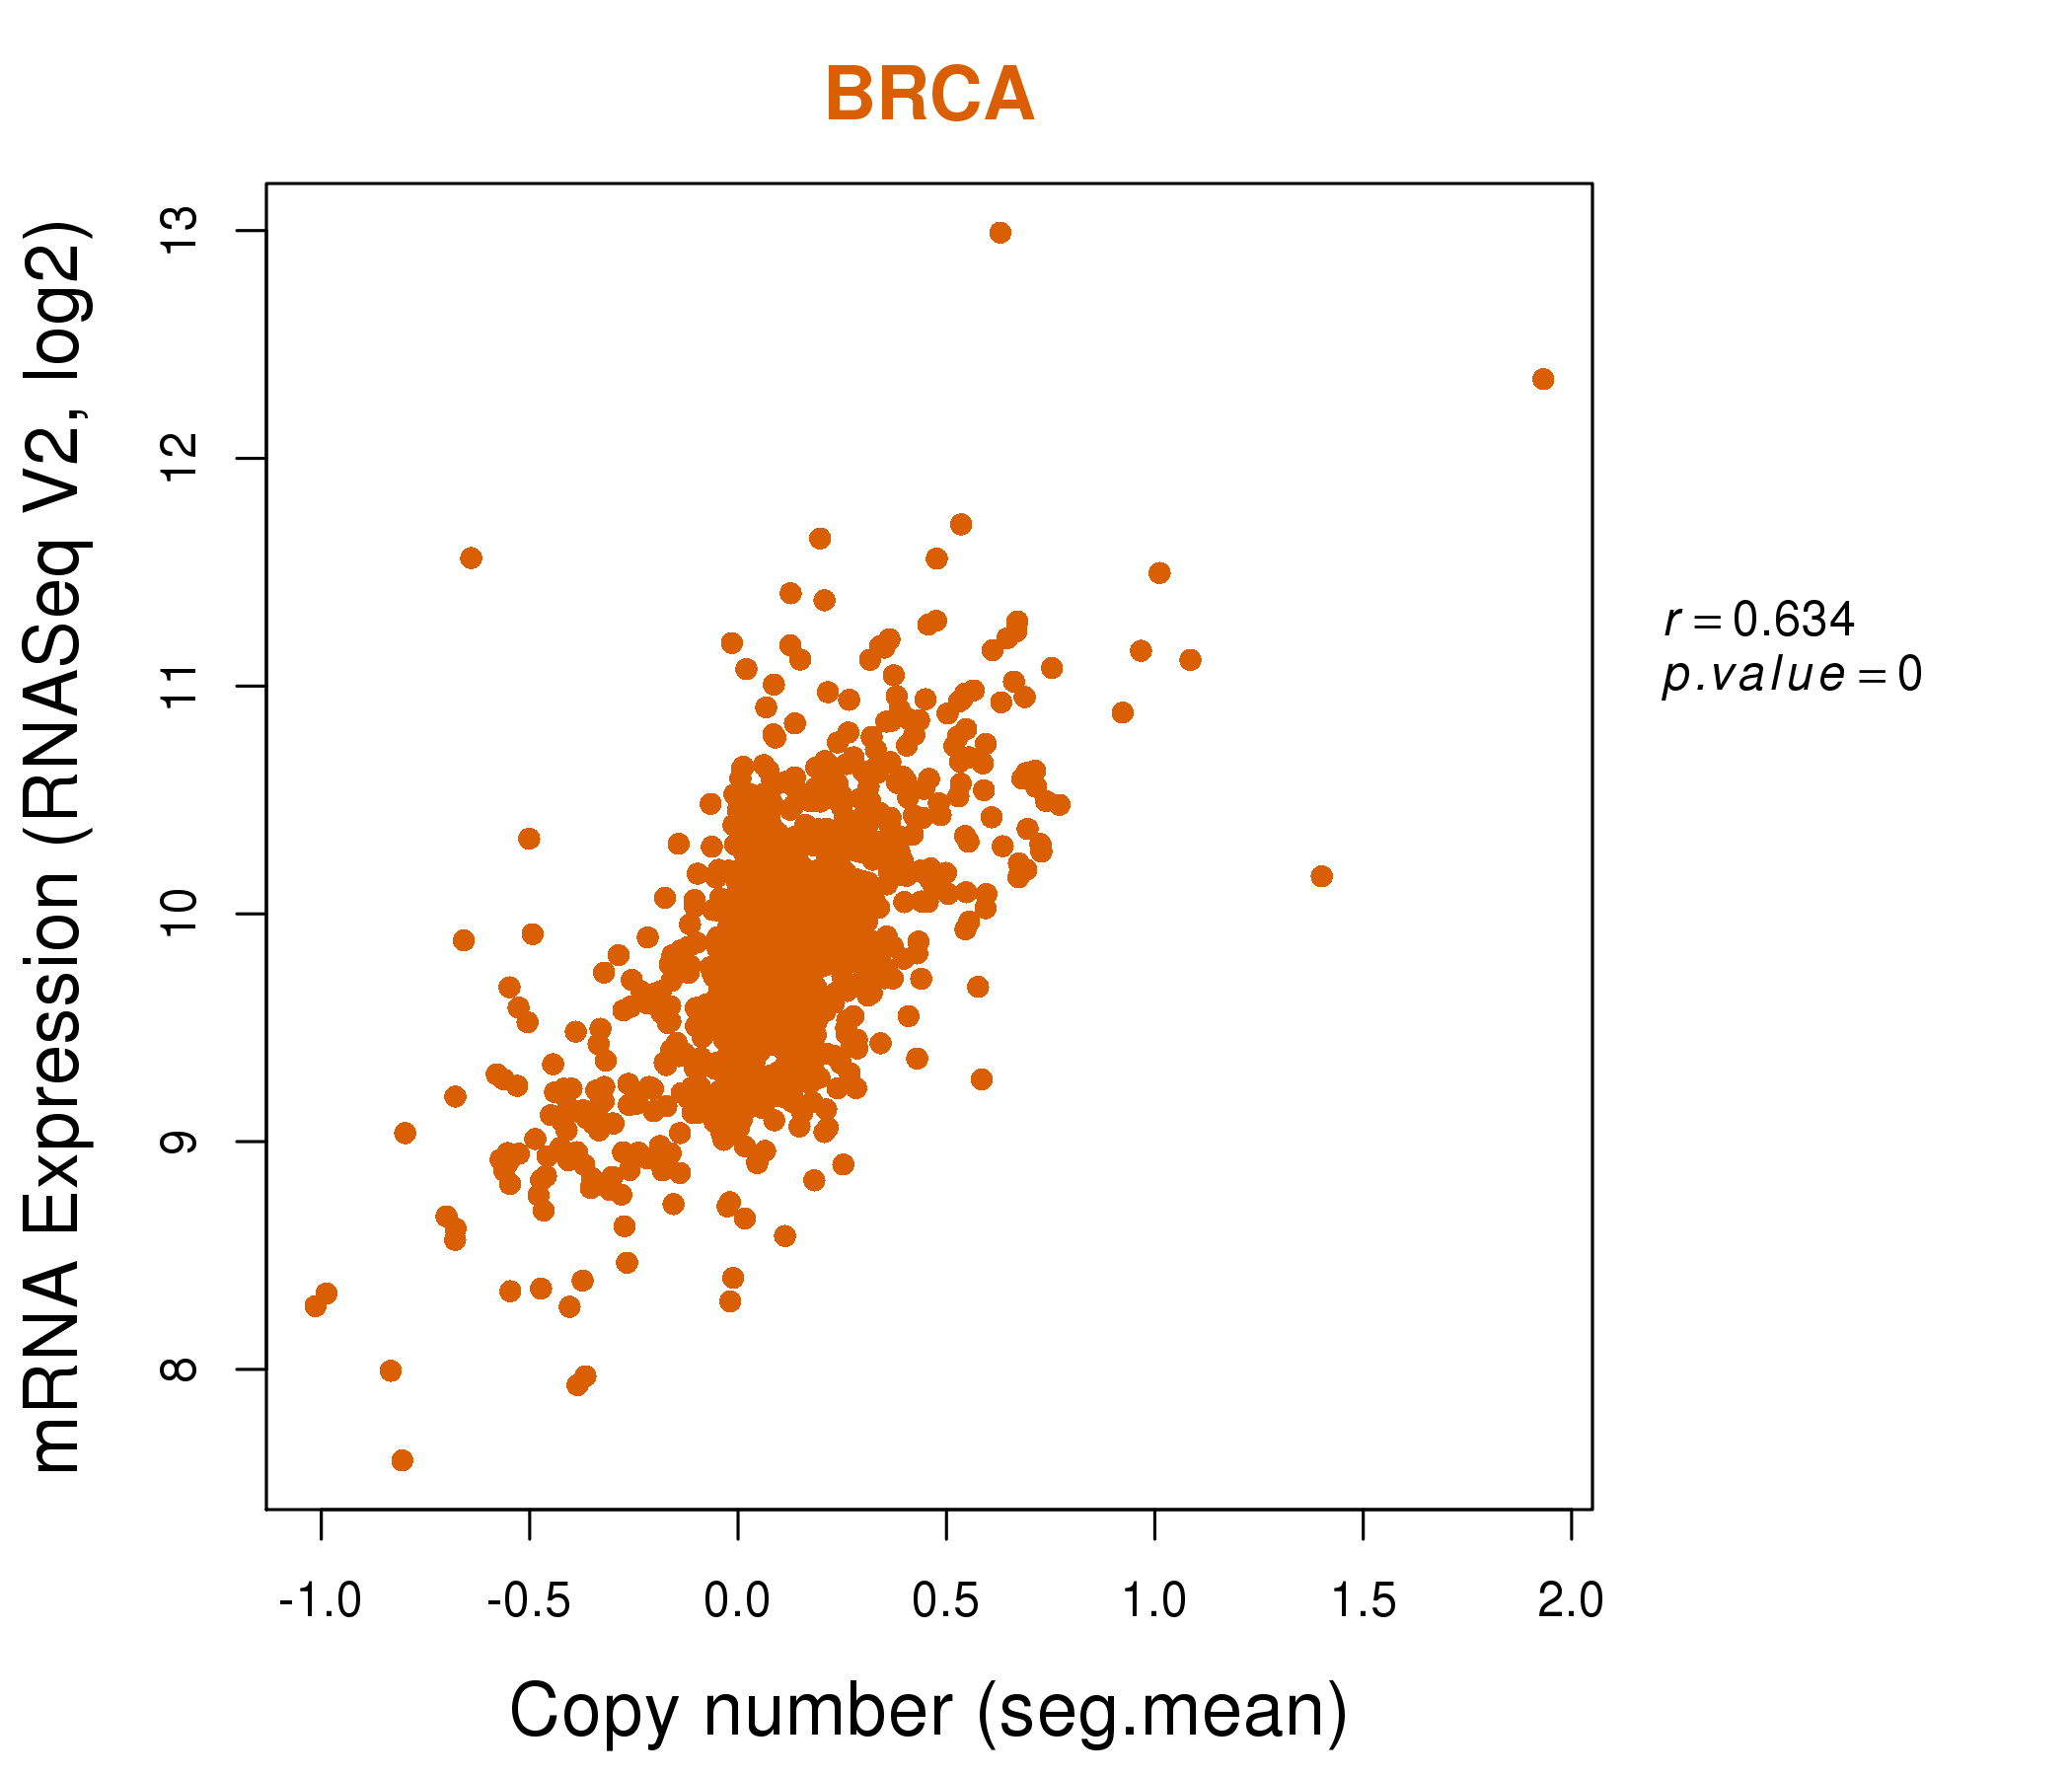
| * This plots show the correlation between CNV and gene expression. |
: Open all plots for all cancer types
 |
|
 |
|

| Top |
| Gene-Gene Network Information |
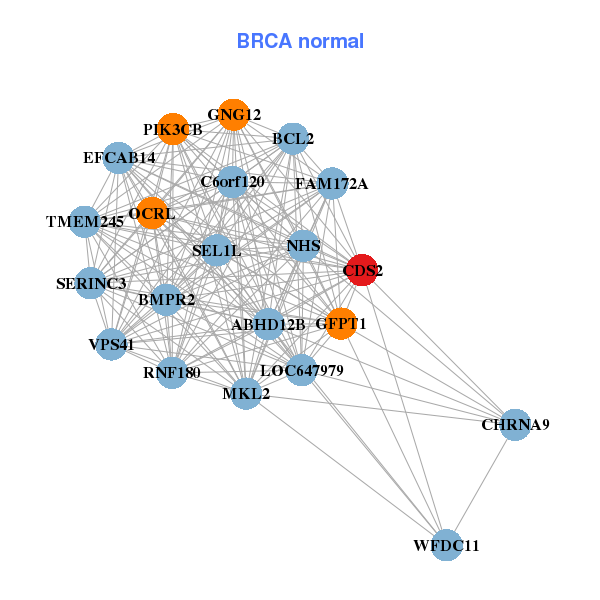
| * Co-Expression network figures were drawn using R package igraph. Only the top 20 genes with the highest correlations were shown. Red circle: input gene, orange circle: cell metabolism gene, sky circle: other gene |
: Open all plots for all cancer types
 |
|
| ACADSB,ATRN,TMEM230,CDS2,CHD6,CRNKL1,CSNK2A1, DMXL1,FASTKD5,LOC647979,MAVS,KAT6B,NRSN2,PANK2, PSMF1,PTPRA,SDC4,SRXN1,SYS1,TBC1D20,ZNF44 | ABHD12B,BCL2,BMPR2,C6orf120,TMEM245,CDS2,CHRNA9, FAM172A,GFPT1,GNG12,EFCAB14,LOC647979,MKL2,NHS, OCRL,PIK3CB,RNF180,SEL1L,SERINC3,VPS41,WFDC11 |
 |
|
| ANKEF1,C20orf196,AP5S1,TMEM230,CDS2,CRLS1,CSNK2A1, CSNK2A3,DSTN,NSFL1C,PANK2,PSMF1,PTPRA,SNRPB2, STK35,TASP1,TBC1D20,TRMT6,UBOX5,VPS16,ZCCHC3 | ADAM11,SKIDA1,CCKBR,CDS2,CNTNAP5,DCAF12L2,FABP3, SUPT20HL2,GDF5,HOXB2,KCNE1,KLHL10,LMO3,LOC100192378, LOC400804,NOS1,ODAM,RARB,SLC2A4,THAP8,TMEM200B |

| * Co-Expression network figures were drawn using R package igraph. Only the top 20 genes with the highest correlations were shown. Red circle: input gene, orange circle: cell metabolism gene, sky circle: other gene |
: Open all plots for all cancer types
| Top |
: Open all interacting genes' information including KEGG pathway for all interacting genes from DAVID
| Top |
| Pharmacological Information for CDS2 |
| There's no related Drug. |
| Top |
| Cross referenced IDs for CDS2 |
| * We obtained these cross-references from Uniprot database. It covers 150 different DBs, 18 categories. http://www.uniprot.org/help/cross_references_section |
: Open all cross reference information
|
Copyright © 2016-Present - The Univsersity of Texas Health Science Center at Houston @ |