|
||||||||||||||||||||||||||||||||||||||||||||||||||||||||||||||||||||||||||||||||||||||||||||||||||||||||||||||||||||||||||||||||||||||||||||||||||||||||||||||||||||||||||||||||||||||||||||||||||||||||||||||||||||||||||||||||||||||||||||||||||||||||||||||||||||||||||||||||||||||||||||||||||||||||||||||||||||||||||
| |
| Phenotypic Information (metabolism pathway, cancer, disease, phenome) |
| |
| |
| Gene-Gene Network Information: Co-Expression Network, Interacting Genes & KEGG |
| |
|


| Gene Summary for MUC16 |
| Basic gene info. | Gene symbol | MUC16 |
| Gene name | mucin 16, cell surface associated | |
| Synonyms | CA125 | |
| Cytomap | UCSC genome browser: 19p13.2 | |
| Genomic location | chr19 :8959519-9092018 | |
| Type of gene | protein-coding | |
| RefGenes | NM_024690.2, | |
| Ensembl id | ENSG00000181143 | |
| Description | CA-125CA125 ovarian cancer antigenMUC-16mucin-16ovarian cancer-related tumor marker CA125ovarian carcinoma antigen CA125 | |
| Modification date | 20141222 | |
| dbXrefs | MIM : 606154 | |
| HGNC : HGNC | ||
| Ensembl : ENSG00000181143 | ||
| Vega : OTTHUMG00000169191 | ||
| Protein | UniProt: Q8WXI7 go to UniProt's Cross Reference DB Table | |
| Expression | CleanEX: HS_MUC16 | |
| BioGPS: 94025 | ||
| Gene Expression Atlas: ENSG00000181143 | ||
| The Human Protein Atlas: ENSG00000181143 | ||
| Pathway | NCI Pathway Interaction Database: MUC16 | |
| KEGG: MUC16 | ||
| REACTOME: MUC16 | ||
| ConsensusPathDB | ||
| Pathway Commons: MUC16 | ||
| Metabolism | MetaCyc: MUC16 | |
| HUMANCyc: MUC16 | ||
| Regulation | Ensembl's Regulation: ENSG00000181143 | |
| miRBase: chr19 :8,959,519-9,092,018 | ||
| TargetScan: NM_024690 | ||
| cisRED: ENSG00000181143 | ||
| Context | iHOP: MUC16 | |
| cancer metabolism search in PubMed: MUC16 | ||
| UCL Cancer Institute: MUC16 | ||
| Assigned class in ccmGDB | A - This gene has a literature evidence and it belongs to cancer gene. | |
| References showing role of MUC16 in cancer cell metabolism | 1. Haridas D, Ponnusamy MP, Chugh S, Lakshmanan I, Seshacharyulu P, et al. (2014) MUC16: molecular analysis and its functional implications in benign and malignant conditions. The FASEB Journal 28: 4183-4199. go to article 2. Shukla SK, Gunda V, Abrego J, Haridas D, Mishra A, et al. (2015) MUC16-mediated activation of mTOR and c-Myc reprograms pancreatic cancer metabolism. Oncotarget. go to article | |
| Top |
| Phenotypic Information for MUC16(metabolism pathway, cancer, disease, phenome) |
| Cancer | CGAP: MUC16 |
| Familial Cancer Database: MUC16 | |
| * This gene is included in those cancer gene databases. |
|
|
|
|
|
| . | ||||||||||||||||||||||||||||||||||||||||||||||||||||||||||||||||||||||||||||||||||||||||||||||||||||||||||||||||||||||||||||||||||||||||||||||||||||||||||||||||||||||||||||||||||||||||||||||||||||||||||||||||||||||||||||||||||||||||||||||||||||||||||||||||||||||||||||||||||||||||||||||||||||||||||||||||||||
Oncogene 1 | Significant driver gene in | |||||||||||||||||||||||||||||||||||||||||||||||||||||||||||||||||||||||||||||||||||||||||||||||||||||||||||||||||||||||||||||||||||||||||||||||||||||||||||||||||||||||||||||||||||||||||||||||||||||||||||||||||||||||||||||||||||||||||||||||||||||||||||||||||||||||||||||||||||||||||||||||||||||||||||||||||||||||||
| cf) number; DB name 1 Oncogene; http://nar.oxfordjournals.org/content/35/suppl_1/D721.long, 2 Tumor Suppressor gene; https://bioinfo.uth.edu/TSGene/, 3 Cancer Gene Census; http://www.nature.com/nrc/journal/v4/n3/abs/nrc1299.html, 4 CancerGenes; http://nar.oxfordjournals.org/content/35/suppl_1/D721.long, 5 Network of Cancer Gene; http://ncg.kcl.ac.uk/index.php, 1Therapeutic Vulnerabilities in Cancer; http://cbio.mskcc.org/cancergenomics/statius/ |
| REACTOME_METABOLISM_OF_PROTEINS | |
| OMIM | 606154; gene. |
| Orphanet | |
| Disease | KEGG Disease: MUC16 |
| MedGen: MUC16 (Human Medical Genetics with Condition) | |
| ClinVar: MUC16 | |
| Phenotype | MGI: MUC16 (International Mouse Phenotyping Consortium) |
| PhenomicDB: MUC16 | |
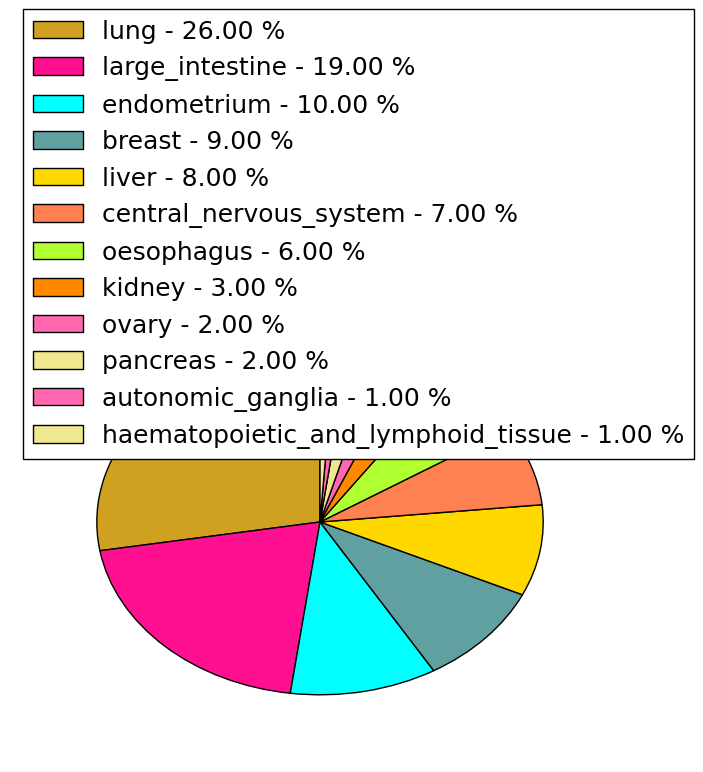
| Mutations for MUC16 |
| * Under tables are showing count per each tissue to give us broad intuition about tissue specific mutation patterns.You can go to the detailed page for each mutation database's web site. |
| - Statistics for Tissue and Mutation type | Top |
 |
| - For Inter-chromosomal Variations |
| * Inter-chromosomal variantions includes 'interchromosomal amplicon to amplicon', 'interchromosomal amplicon to non-amplified dna', 'interchromosomal insertion', 'Interchromosomal unknown type'. |
 |
| - For Intra-chromosomal Variations |
| * Intra-chromosomal variantions includes 'intrachromosomal amplicon to amplicon', 'intrachromosomal amplicon to non-amplified dna', 'intrachromosomal deletion', 'intrachromosomal fold-back inversion', 'intrachromosomal inversion', 'intrachromosomal tandem duplication', 'Intrachromosomal unknown type', 'intrachromosomal with inverted orientation', 'intrachromosomal with non-inverted orientation'. |
 |
| Sample | Symbol_a | Chr_a | Start_a | End_a | Symbol_b | Chr_b | Start_b | End_b |
| ovary | MUC16 | chr19 | 8971622 | 8971642 | MUC16 | chr19 | 8978386 | 8978406 |
| ovary | MUC16 | chr19 | 8977219 | 8977239 | FLJ30838 | chr2 | 58947727 | 58947747 |
| ovary | MUC16 | chr19 | 9035145 | 9035165 | MUC16 | chr19 | 9035574 | 9035594 |
| ovary | MUC16 | chr19 | 9050563 | 9050583 | chr19 | 9292048 | 9292068 | |
| ovary | MUC16 | chr19 | 9055871 | 9055891 | ZNF317 | chr19 | 9268420 | 9268440 |
| ovary | MUC16 | chr19 | 9080898 | 9080918 | chr19 | 9093726 | 9093746 | |
| ovary | MUC16 | chr19 | 9084550 | 9084570 | chr19 | 9101765 | 9101785 | |
| ovary | MUC16 | chr19 | 9088983 | 9089003 | chr19 | 9233686 | 9233706 | |
| pancreas | MUC16 | chr19 | 9027982 | 9028002 | ARHGAP35 | chr19 | 47441021 | 47441041 |
| cf) Tissue number; Tissue name (1;Breast, 2;Central_nervous_system, 3;Haematopoietic_and_lymphoid_tissue, 4;Large_intestine, 5;Liver, 6;Lung, 7;Ovary, 8;Pancreas, 9;Prostate, 10;Skin, 11;Soft_tissue, 12;Upper_aerodigestive_tract) |
| * From mRNA Sanger sequences, Chitars2.0 arranged chimeric transcripts. This table shows MUC16 related fusion information. |
| ID | Head Gene | Tail Gene | Accession | Gene_a | qStart_a | qEnd_a | Chromosome_a | tStart_a | tEnd_a | Gene_a | qStart_a | qEnd_a | Chromosome_a | tStart_a | tEnd_a |
| AK023298 | MUC16 | 1 | 433 | 19 | 9049994 | 9056241 | DNAJC22 | 428 | 1559 | 12 | 49742766 | 49745683 | |
| AU133673 | MUC16 | 1 | 434 | 19 | 9049994 | 9056241 | DNAJC22 | 429 | 680 | 12 | 49742766 | 49743198 | |
| AA640762 | MUC16 | 4 | 137 | 19 | 9000482 | 9001879 | MUC16 | 131 | 355 | 19 | 8999456 | 9000489 | |
| BI013178 | MUC16 | 8 | 234 | 19 | 8966686 | 8969304 | SCUBE3 | 218 | 519 | 6 | 35197380 | 35197681 | |
| Top |
| Mutation type/ Tissue ID | brca | cns | cerv | endome | haematopo | kidn | Lintest | liver | lung | ns | ovary | pancre | prost | skin | stoma | thyro | urina | |||
| Total # sample | 2 | 3 | 1 | 4 | 2 | 1 | 3 | 5 | 8 | 6 | 2 | 1 | 1 | 5 | ||||||
| GAIN (# sample) | 2 | 2 | 1 | 4 | 2 | 3 | 6 | 6 | 1 | 3 | ||||||||||
| LOSS (# sample) | 1 | 2 | 1 | 1 | 2 | 2 | 2 | 1 | 2 |
| cf) Tissue ID; Tissue type (1; Breast, 2; Central_nervous_system, 3; Cervix, 4; Endometrium, 5; Haematopoietic_and_lymphoid_tissue, 6; Kidney, 7; Large_intestine, 8; Liver, 9; Lung, 10; NS, 11; Ovary, 12; Pancreas, 13; Prostate, 14; Skin, 15; Stomach, 16; Thyroid, 17; Urinary_tract) |
| Top |
|
 |
| Top |
| Stat. for Non-Synonymous SNVs (# total SNVs=1125) | (# total SNVs=357) |
 |  |
(# total SNVs=17) | (# total SNVs=6) |
 |  |
| Top |
| * When you move the cursor on each content, you can see more deailed mutation information on the Tooltip. Those are primary_site,primary_histology,mutation(aa),pubmedID. |
| GRCh37 position | Mutation(aa) | Unique sampleID count |
| chr19:9090831-9090831 | p.P328P | 8 |
| chr19:9080501-9080501 | p.G3177E | 6 |
| chr19:9072091-9072091 | p.P5119S | 6 |
| chr19:9067623-9067623 | p.S6608* | 5 |
| chr19:9075173-9075173 | p.M4091I | 4 |
| chr19:9073638-9073638 | p.R4603Q | 4 |
| chr19:9063678-9063678 | p.D7923A | 4 |
| chr19:9089508-9089508 | p.V769V | 4 |
| chr19:9066259-9066259 | p.T7063A | 4 |
| chr19:9060904-9060904 | p.E8848K | 4 |
| Top |
|
 |
| Point Mutation/ Tissue ID | 1 | 2 | 3 | 4 | 5 | 6 | 7 | 8 | 9 | 10 | 11 | 12 | 13 | 14 | 15 | 16 | 17 | 18 | 19 | 20 |
| # sample | 53 | 76 | 10 | 144 | 62 | 75 | 2 | 59 | 11 | 5 | 180 | 97 | 26 | 2 | 15 | 194 | 102 | 20 | 73 | |
| # mutation | 74 | 87 | 17 | 300 | 65 | 113 | 2 | 66 | 11 | 5 | 355 | 195 | 27 | 3 | 17 | 976 | 203 | 18 | 210 | |
| nonsynonymous SNV | 56 | 59 | 13 | 218 | 46 | 81 | 1 | 51 | 9 | 3 | 265 | 134 | 17 | 2 | 11 | 689 | 142 | 11 | 153 | |
| synonymous SNV | 18 | 28 | 4 | 83 | 19 | 32 | 1 | 15 | 2 | 2 | 90 | 61 | 10 | 1 | 6 | 287 | 61 | 7 | 57 |
| cf) Tissue ID; Tissue type (1; BLCA[Bladder Urothelial Carcinoma], 2; BRCA[Breast invasive carcinoma], 3; CESC[Cervical squamous cell carcinoma and endocervical adenocarcinoma], 4; COAD[Colon adenocarcinoma], 5; GBM[Glioblastoma multiforme], 6; Glioma Low Grade, 7; HNSC[Head and Neck squamous cell carcinoma], 8; KICH[Kidney Chromophobe], 9; KIRC[Kidney renal clear cell carcinoma], 10; KIRP[Kidney renal papillary cell carcinoma], 11; LAML[Acute Myeloid Leukemia], 12; LUAD[Lung adenocarcinoma], 13; LUSC[Lung squamous cell carcinoma], 14; OV[Ovarian serous cystadenocarcinoma ], 15; PAAD[Pancreatic adenocarcinoma], 16; PRAD[Prostate adenocarcinoma], 17; SKCM[Skin Cutaneous Melanoma], 18:STAD[Stomach adenocarcinoma], 19:THCA[Thyroid carcinoma], 20:UCEC[Uterine Corpus Endometrial Carcinoma]) |
| Top |
| * We represented just top 10 SNVs. When you move the cursor on each content, you can see more deailed mutation information on the Tooltip. Those are primary_site, primary_histology, mutation(aa), pubmedID. |
| Genomic Position | Mutation(aa) | Unique sampleID count |
| chr19:9072091 | p.P5119S | 9 |
| chr19:9048764 | p.P328P | 8 |
| chr19:9090831 | p.L10956P | 8 |
| chr19:9048771 | p.F10954L | 5 |
| chr19:9089508 | p.G3177E | 4 |
| chr19:9080501 | p.V769V | 4 |
| chr19:9014654 | p.R12774H | 4 |
| chr19:9054252 | p.M4091I | 3 |
| chr19:9063963 | p.Q6158R | 3 |
| chr19:9065721 | p.R4603Q | 3 |
| * Copy number data were extracted from TCGA using R package TCGA-Assembler. The URLs of all public data files on TCGA DCC data server were gathered on Jan-05-2015. Function ProcessCNAData in TCGA-Assembler package was used to obtain gene-level copy number value which is calculated as the average copy number of the genomic region of a gene. |
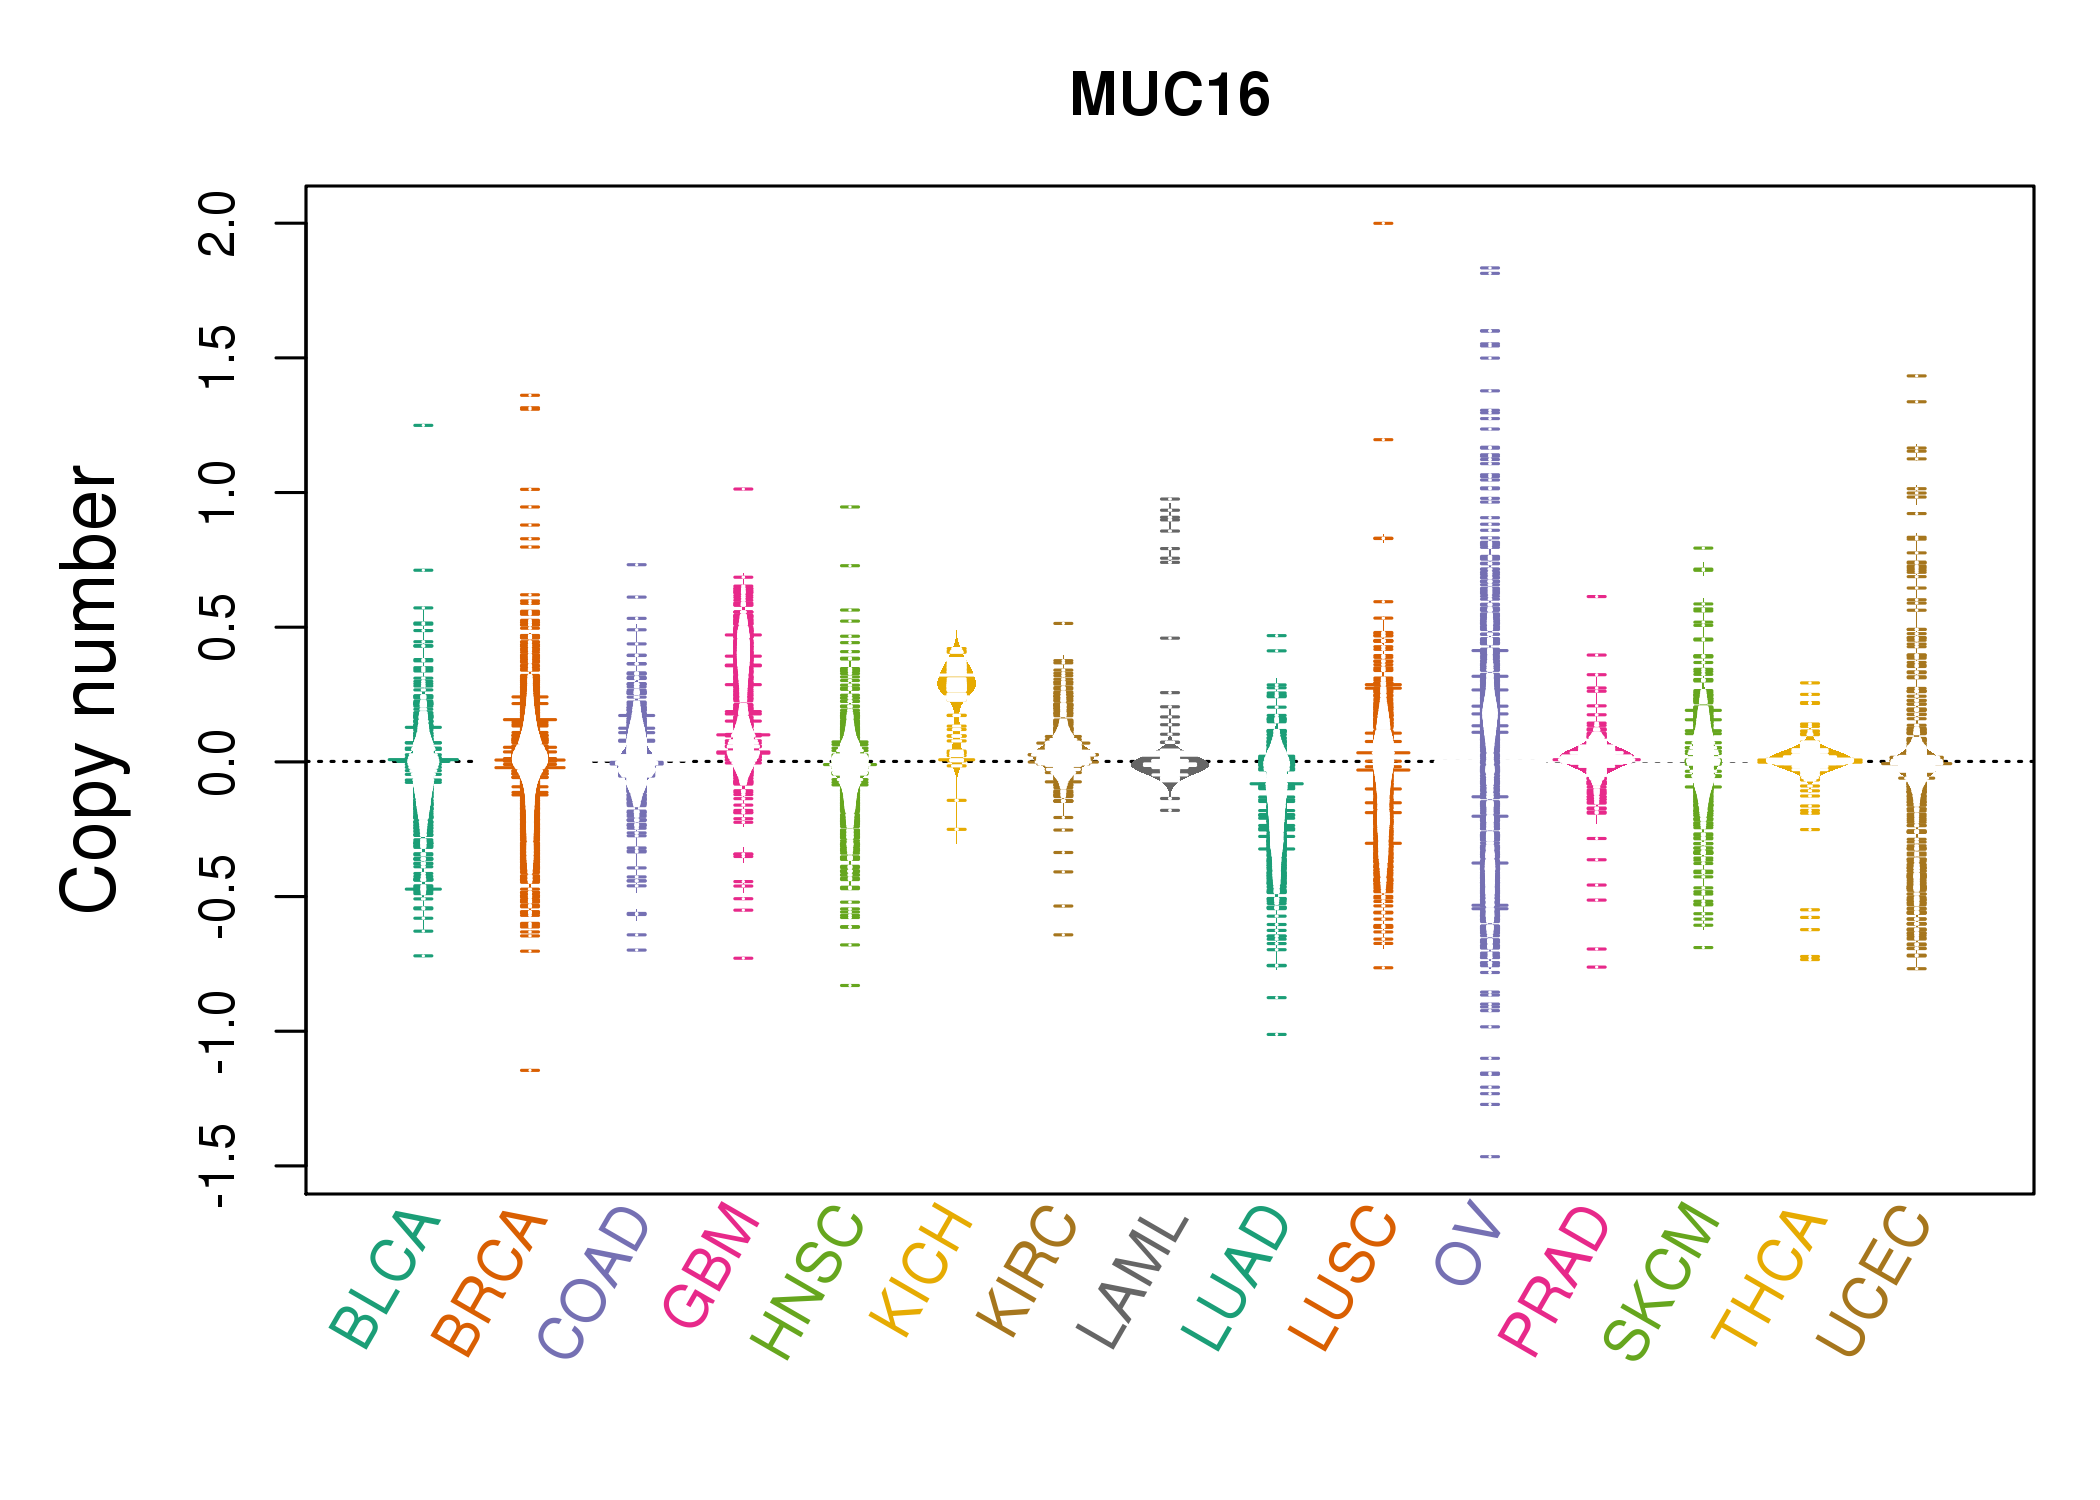 |
| cf) Tissue ID[Tissue type]: BLCA[Bladder Urothelial Carcinoma], BRCA[Breast invasive carcinoma], CESC[Cervical squamous cell carcinoma and endocervical adenocarcinoma], COAD[Colon adenocarcinoma], GBM[Glioblastoma multiforme], Glioma Low Grade, HNSC[Head and Neck squamous cell carcinoma], KICH[Kidney Chromophobe], KIRC[Kidney renal clear cell carcinoma], KIRP[Kidney renal papillary cell carcinoma], LAML[Acute Myeloid Leukemia], LUAD[Lung adenocarcinoma], LUSC[Lung squamous cell carcinoma], OV[Ovarian serous cystadenocarcinoma ], PAAD[Pancreatic adenocarcinoma], PRAD[Prostate adenocarcinoma], SKCM[Skin Cutaneous Melanoma], STAD[Stomach adenocarcinoma], THCA[Thyroid carcinoma], UCEC[Uterine Corpus Endometrial Carcinoma] |
| Top |
| Gene Expression for MUC16 |
| * CCLE gene expression data were extracted from CCLE_Expression_Entrez_2012-10-18.res: Gene-centric RMA-normalized mRNA expression data. |
 |
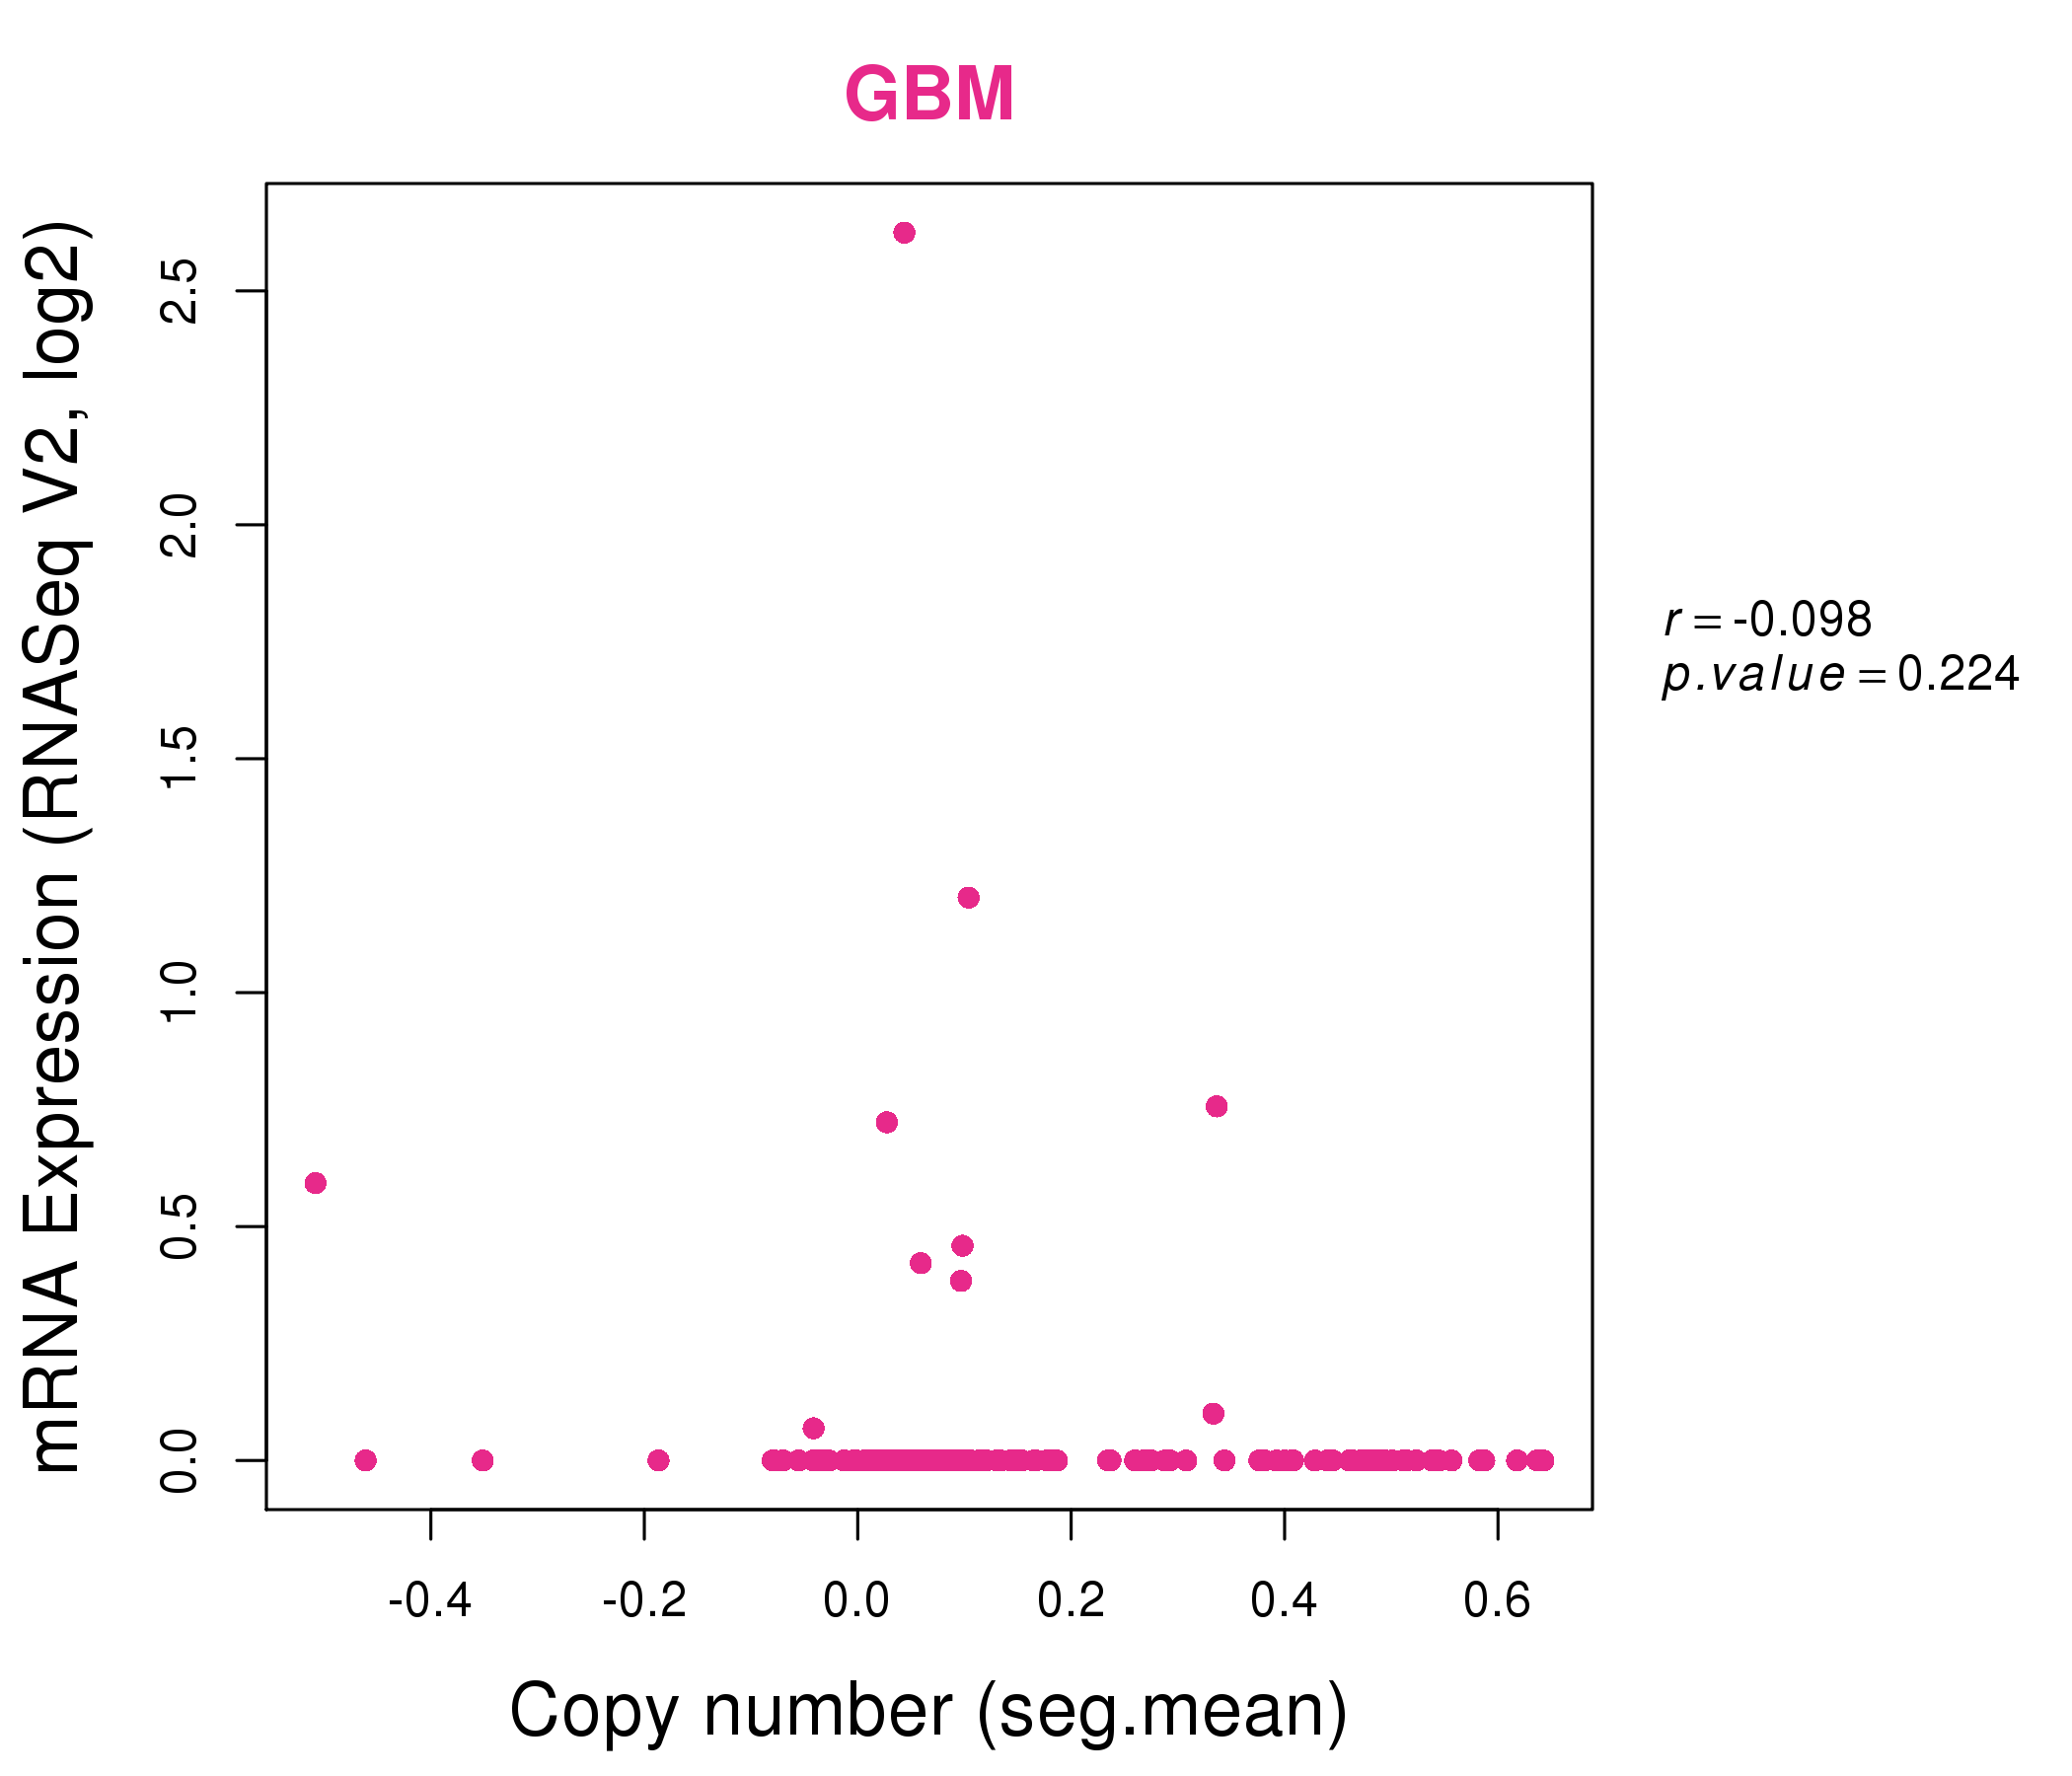
| * Normalized gene expression data of RNASeqV2 was extracted from TCGA using R package TCGA-Assembler. The URLs of all public data files on TCGA DCC data server were gathered at Jan-05-2015. Only eight cancer types have enough normal control samples for differential expression analysis. (t test, adjusted p<0.05 (using Benjamini-Hochberg FDR)) |
 |
| Top |
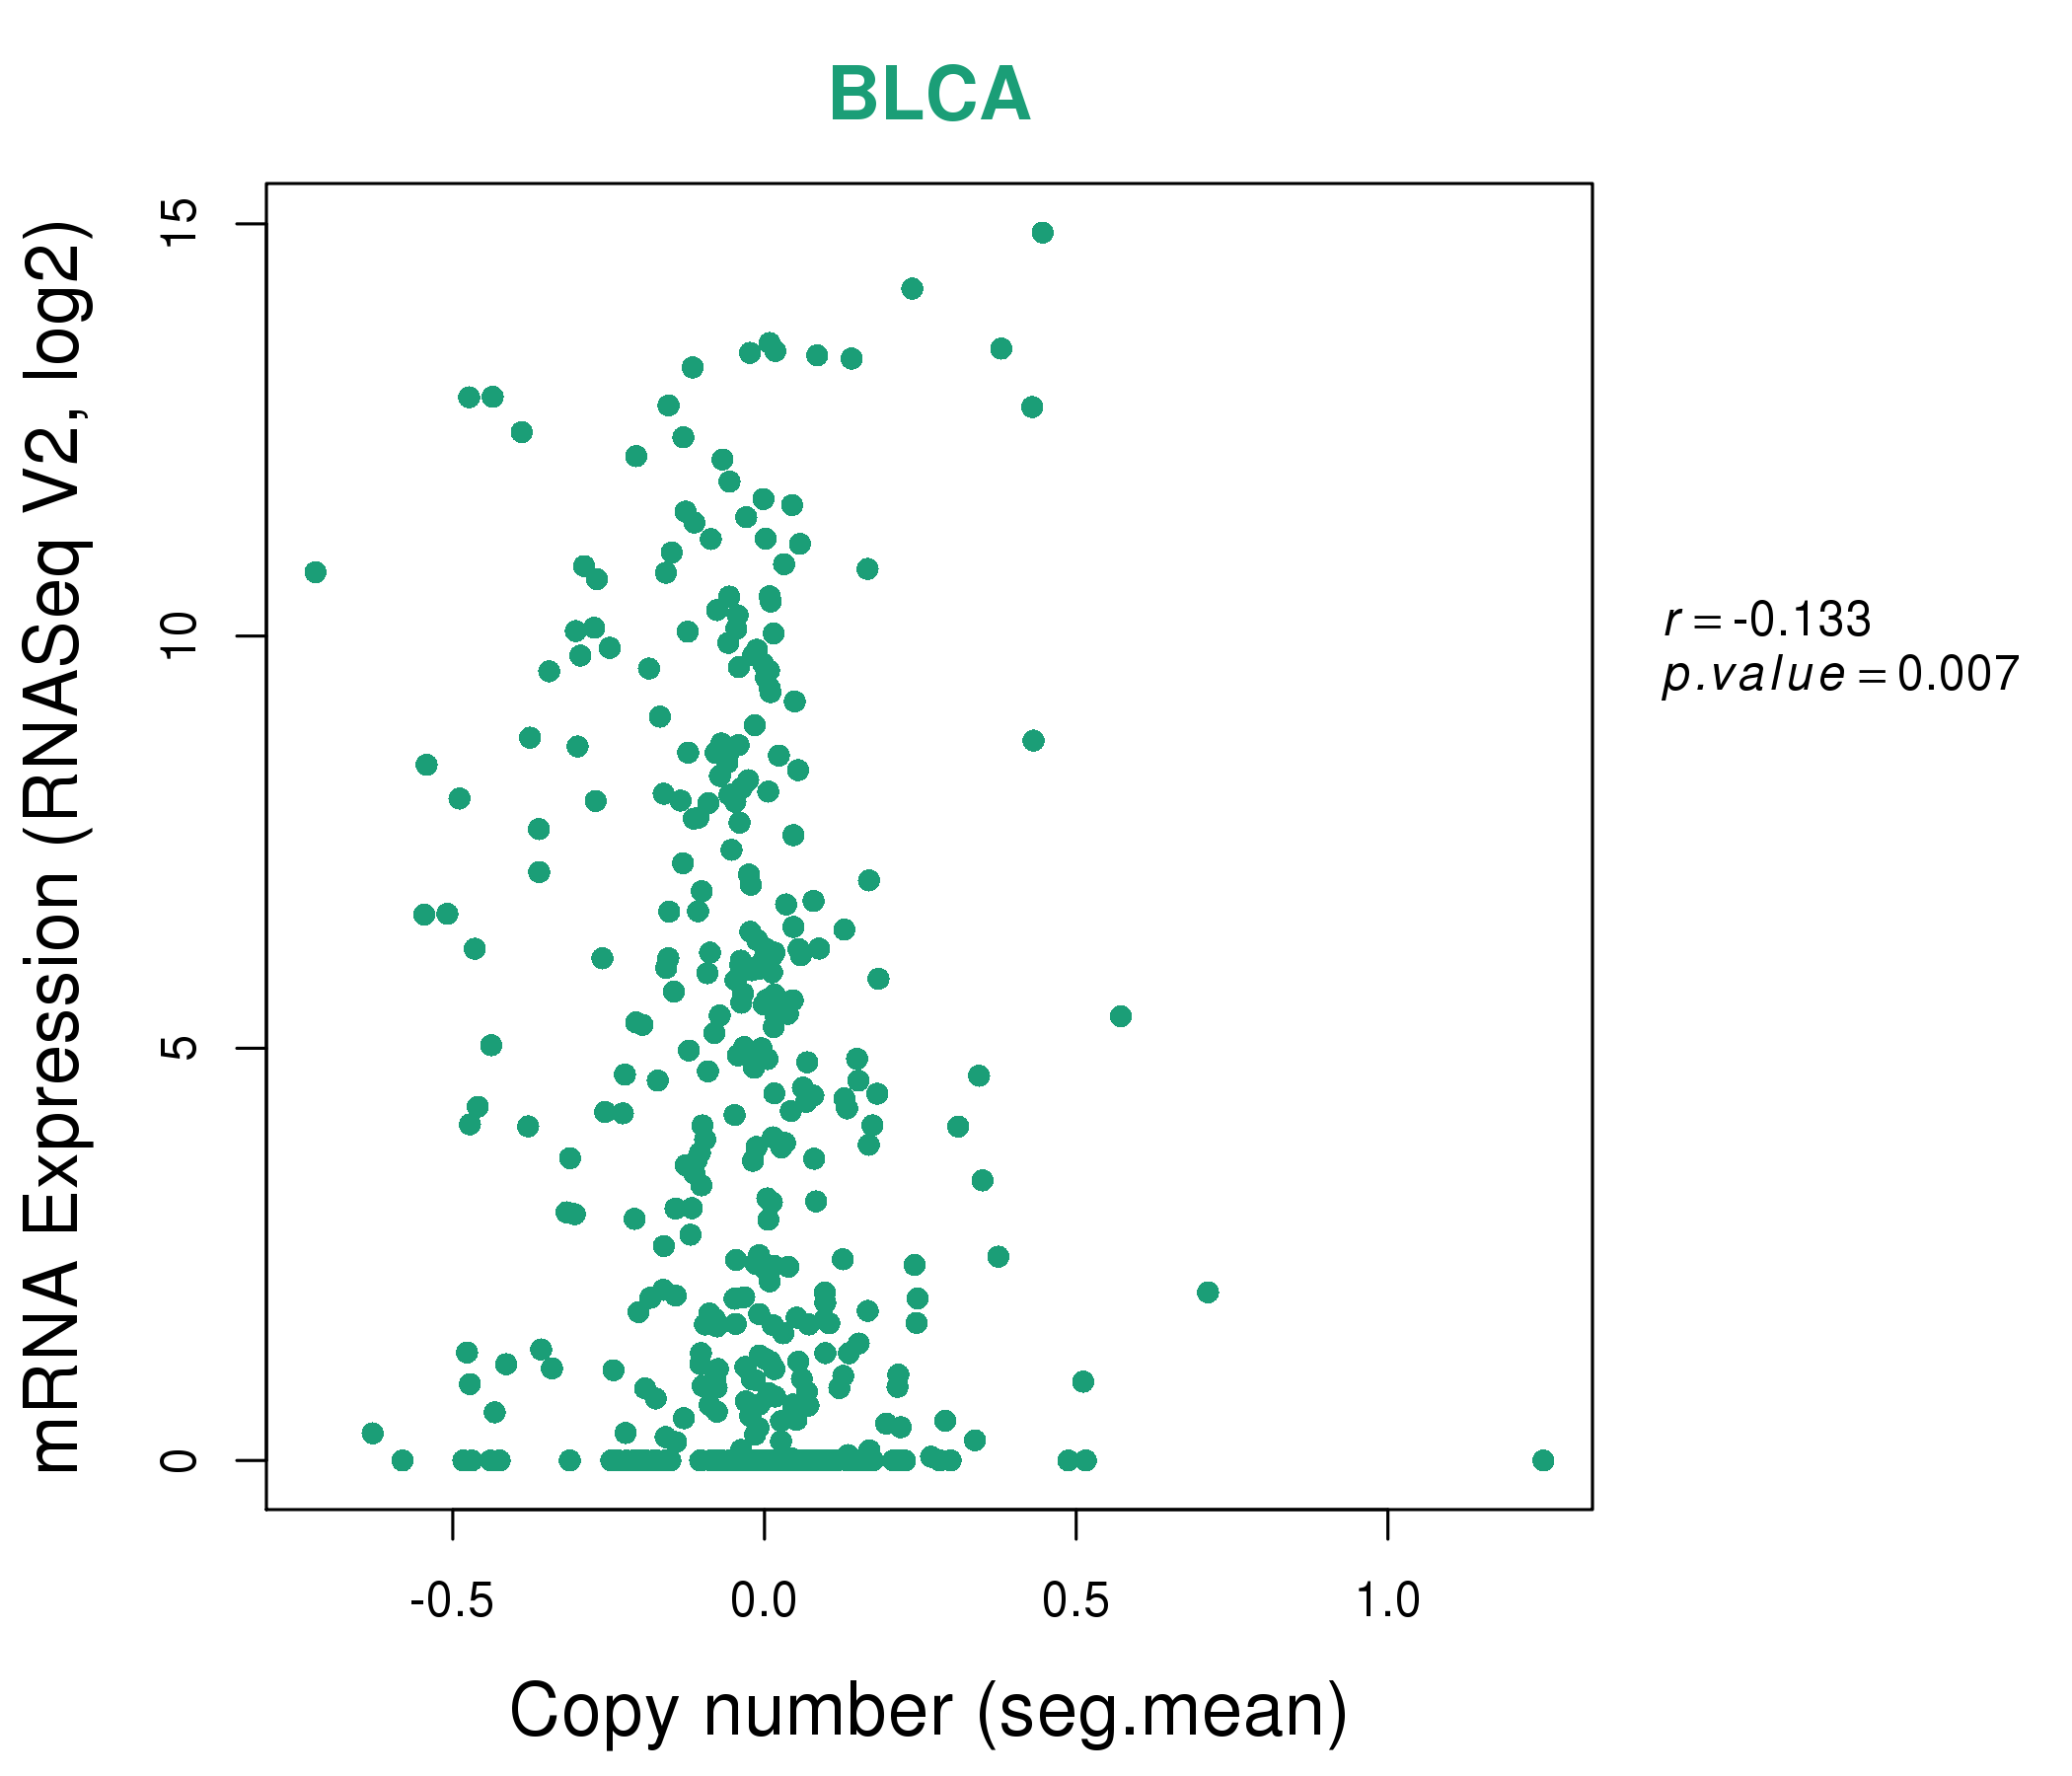
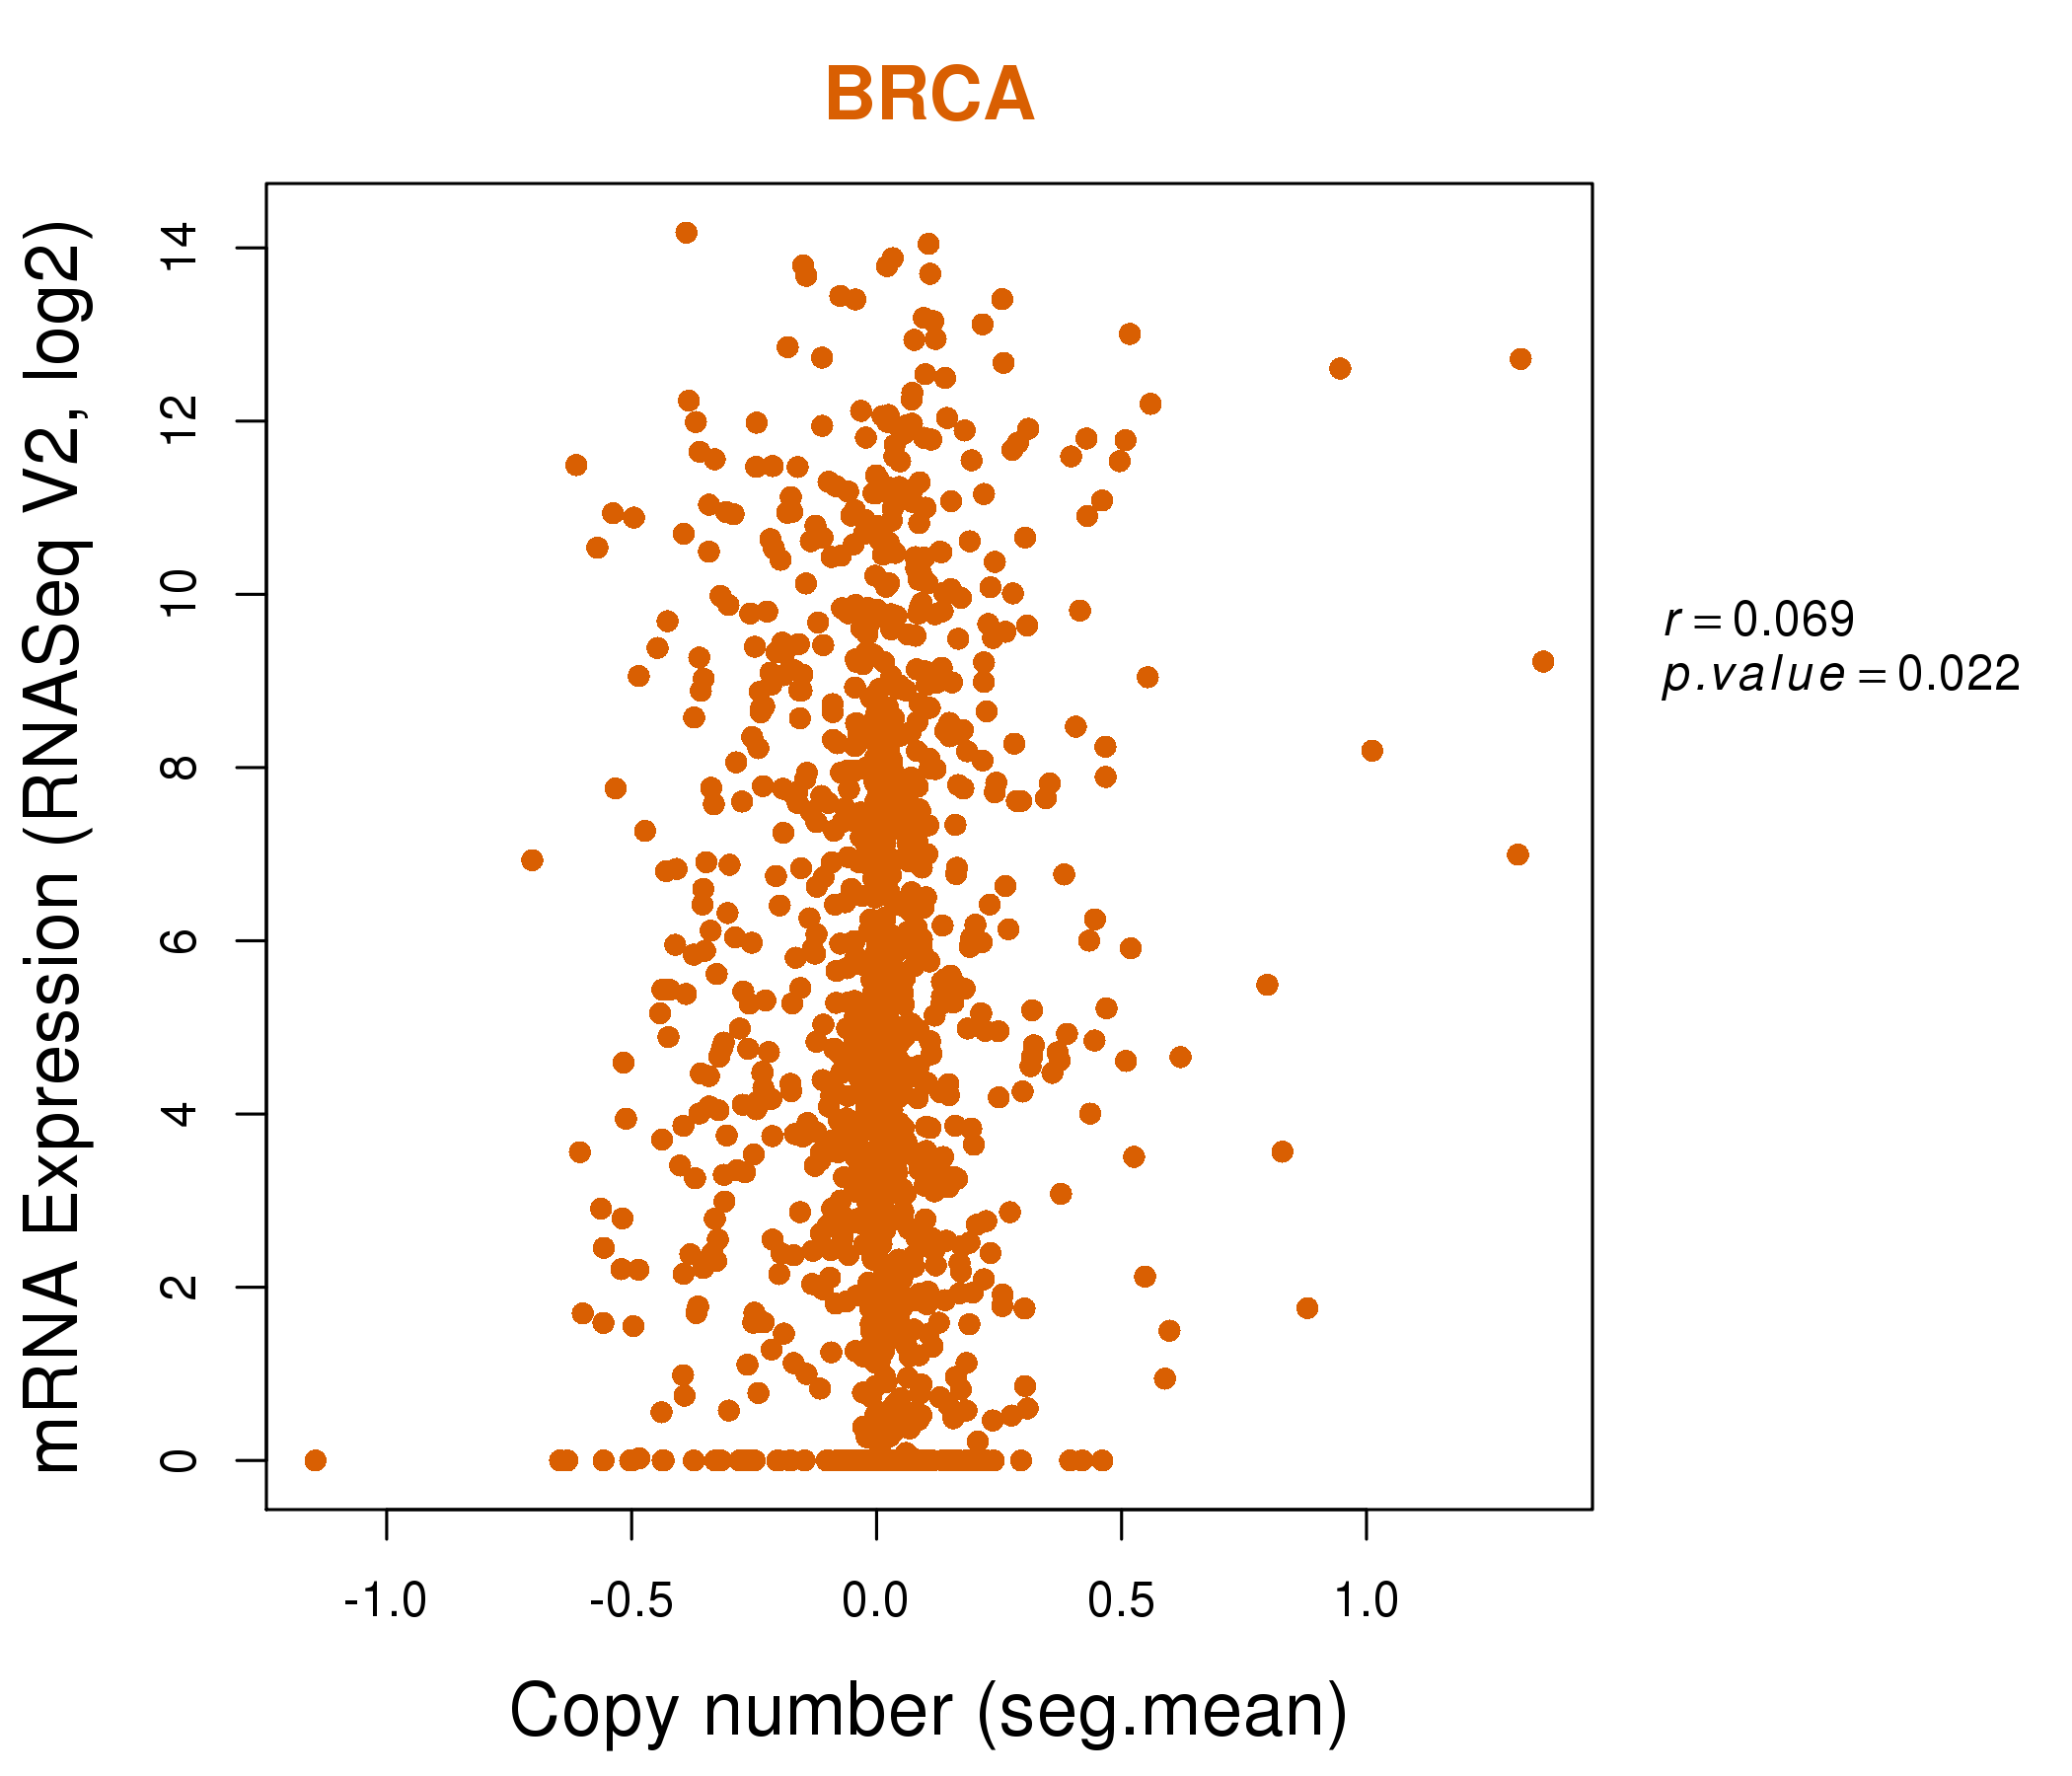
| * This plots show the correlation between CNV and gene expression. |
: Open all plots for all cancer types
 |
|
 |
|
| Top |
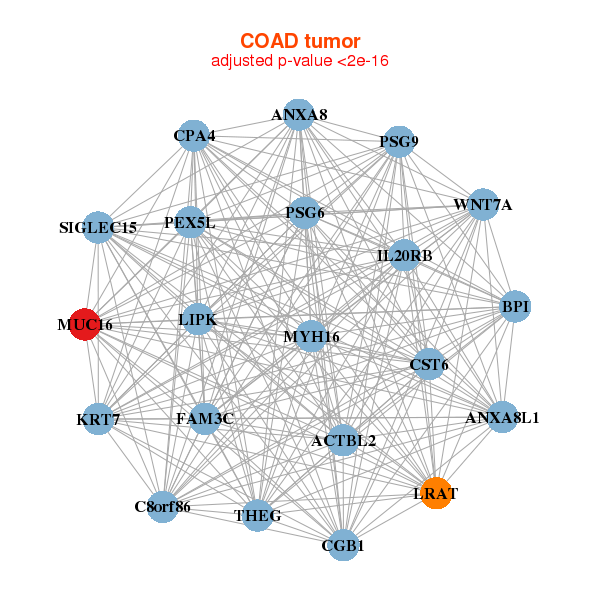
| Gene-Gene Network Information |
| * Co-Expression network figures were drawn using R package igraph. Only the top 20 genes with the highest correlations were shown. Red circle: input gene, orange circle: cell metabolism gene, sky circle: other gene |
: Open all plots for all cancer types
 |
|
| ACSL6,APOBEC3B,ARHGEF9,CAPN14,CDC42EP1,CTSV,CXCL16, KCNG1,KRT9,MFGE8,MUC16,PADI2,PGBD5,PLEKHG1, PRKX,RAET1L,RASGEF1C,ROPN1,SLC15A1,TP53BP2,VGLL1 | C12orf77,CD3G,COL22A1,CTLA4,DAPP1,GPR114,GRIN2A, HLA-DOB,HORMAD1,ICOS,IKZF3,MIR155HG,MUC16,NLRC3, OR7G1,P2RY10,RASSF5,TEX11,TLR10,TOX,ZNF80 |
 |
|
| ACTBL2,ANXA8,ANXA8L1,BPI,C8orf86,CGB1,CPA4, CST6,FAM3C,IL20RB,KRT7,LIPK,LRAT,MUC16, MYH16,PEX5L,PSG6,PSG9,SIGLEC15,THEG,WNT7A | C20orf141,NCOR1P1,CCDC129,CHAT,GNG13,GPX5,KLK13, KPRP,LCE2C,LPA,MEPE,MUC16,CHODL-AS1,OR2D2, PGLYRP3,SEBOX,SNORA79,TAS1R3,TRPM5,VTCN1,ZSWIM2 |


| * Co-Expression network figures were drawn using R package igraph. Only the top 20 genes with the highest correlations were shown. Red circle: input gene, orange circle: cell metabolism gene, sky circle: other gene |
: Open all plots for all cancer types
| Top |
: Open all interacting genes' information including KEGG pathway for all interacting genes from DAVID
| Top |
| Pharmacological Information for MUC16 |
| There's no related Drug. |
| Top |
| Cross referenced IDs for MUC16 |
| * We obtained these cross-references from Uniprot database. It covers 150 different DBs, 18 categories. http://www.uniprot.org/help/cross_references_section |
: Open all cross reference information
|
Copyright © 2016-Present - The Univsersity of Texas Health Science Center at Houston @ |