|
||||||||||||||||||||||||||||||||||||||||||||||||||||||||||||||||||||||||||||||||||||||||||||||||||||||||||||||||||||||||||||||||||||||||||||||||||||||||||||||||||||||||||||||||||||||||||||||||||||||||||||||||||||||||||||||||||||||||||||||||||||||||||||||||||||||||||||||||||||||||||||||||||||||||||||||||||||||||||
| |
| Phenotypic Information (metabolism pathway, cancer, disease, phenome) |
| |
| |
| Gene-Gene Network Information: Co-Expression Network, Interacting Genes & KEGG |
| |
|


| Gene Summary for PGS1 |
| Top |
| Phenotypic Information for PGS1(metabolism pathway, cancer, disease, phenome) |
| Cancer | CGAP: PGS1 |
| Familial Cancer Database: PGS1 | |
| * This gene is included in those cancer gene databases. |
|
|
|
|
|
| . | ||||||||||||||||||||||||||||||||||||||||||||||||||||||||||||||||||||||||||||||||||||||||||||||||||||||||||||||||||||||||||||||||||||||||||||||||||||||||||||||||||||||||||||||||||||||||||||||||||||||||||||||||||||||||||||||||||||||||||||||||||||||||||||||||||||||||||||||||||||||||||||||||||||||||||||||||||||
Oncogene 1 | Significant driver gene in | |||||||||||||||||||||||||||||||||||||||||||||||||||||||||||||||||||||||||||||||||||||||||||||||||||||||||||||||||||||||||||||||||||||||||||||||||||||||||||||||||||||||||||||||||||||||||||||||||||||||||||||||||||||||||||||||||||||||||||||||||||||||||||||||||||||||||||||||||||||||||||||||||||||||||||||||||||||||||
| cf) number; DB name 1 Oncogene; http://nar.oxfordjournals.org/content/35/suppl_1/D721.long, 2 Tumor Suppressor gene; https://bioinfo.uth.edu/TSGene/, 3 Cancer Gene Census; http://www.nature.com/nrc/journal/v4/n3/abs/nrc1299.html, 4 CancerGenes; http://nar.oxfordjournals.org/content/35/suppl_1/D721.long, 5 Network of Cancer Gene; http://ncg.kcl.ac.uk/index.php, 1Therapeutic Vulnerabilities in Cancer; http://cbio.mskcc.org/cancergenomics/statius/ |
| KEGG_GLYCEROPHOSPHOLIPID_METABOLISM REACTOME_PHOSPHOLIPID_METABOLISM REACTOME_METABOLISM_OF_LIPIDS_AND_LIPOPROTEINS | |
| OMIM | |
| Orphanet | |
| Disease | KEGG Disease: PGS1 |
| MedGen: PGS1 (Human Medical Genetics with Condition) | |
| ClinVar: PGS1 | |
| Phenotype | MGI: PGS1 (International Mouse Phenotyping Consortium) |
| PhenomicDB: PGS1 | |
| Mutations for PGS1 |
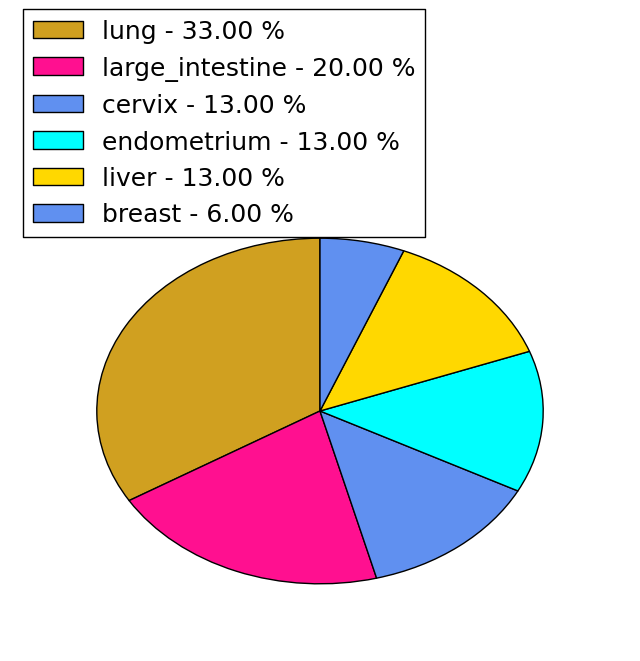
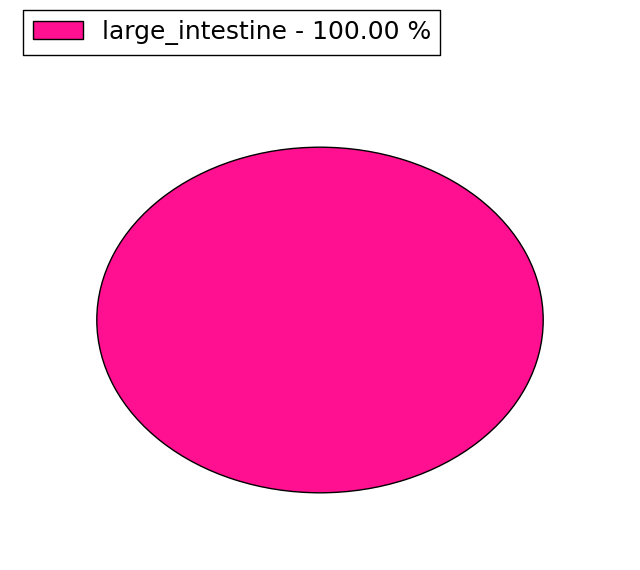
| * Under tables are showing count per each tissue to give us broad intuition about tissue specific mutation patterns.You can go to the detailed page for each mutation database's web site. |
| - Statistics for Tissue and Mutation type | Top |
 |
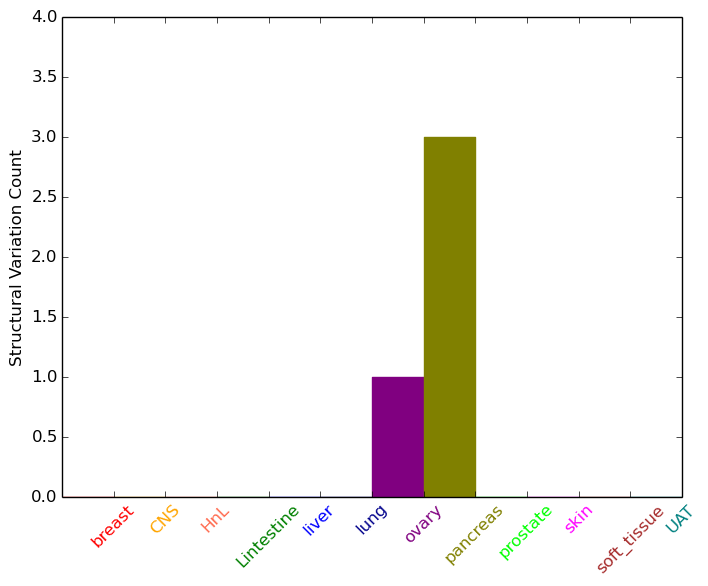
| - For Inter-chromosomal Variations |
| There's no inter-chromosomal structural variation. |
| - For Intra-chromosomal Variations |
| * Intra-chromosomal variantions includes 'intrachromosomal amplicon to amplicon', 'intrachromosomal amplicon to non-amplified dna', 'intrachromosomal deletion', 'intrachromosomal fold-back inversion', 'intrachromosomal inversion', 'intrachromosomal tandem duplication', 'Intrachromosomal unknown type', 'intrachromosomal with inverted orientation', 'intrachromosomal with non-inverted orientation'. |
 |
| Sample | Symbol_a | Chr_a | Start_a | End_a | Symbol_b | Chr_b | Start_b | End_b |
| ovary | PGS1 | chr17 | 76397164 | 76397184 | PGS1 | chr17 | 76401290 | 76401310 |
| pancreas | PGS1 | chr17 | 76393464 | 76393484 | PGS1 | chr17 | 76393361 | 76393381 |
| pancreas | PGS1 | chr17 | 76398960 | 76398980 | AFMID | chr17 | 76193680 | 76193700 |
| cf) Tissue number; Tissue name (1;Breast, 2;Central_nervous_system, 3;Haematopoietic_and_lymphoid_tissue, 4;Large_intestine, 5;Liver, 6;Lung, 7;Ovary, 8;Pancreas, 9;Prostate, 10;Skin, 11;Soft_tissue, 12;Upper_aerodigestive_tract) |
| * From mRNA Sanger sequences, Chitars2.0 arranged chimeric transcripts. This table shows PGS1 related fusion information. |
| ID | Head Gene | Tail Gene | Accession | Gene_a | qStart_a | qEnd_a | Chromosome_a | tStart_a | tEnd_a | Gene_a | qStart_a | qEnd_a | Chromosome_a | tStart_a | tEnd_a |
| BF333583 | PGS1 | 4 | 65 | 17 | 76417376 | 76417437 | ZZEF1 | 57 | 295 | 17 | 3988975 | 3989894 | |
| BF898112 | PGS1 | 20 | 94 | 17 | 76403318 | 76403392 | PGS1 | 87 | 368 | 17 | 76403401 | 76403681 | |
| Top |
| Mutation type/ Tissue ID | brca | cns | cerv | endome | haematopo | kidn | Lintest | liver | lung | ns | ovary | pancre | prost | skin | stoma | thyro | urina | |||
| Total # sample | 1 | |||||||||||||||||||
| GAIN (# sample) | 1 | |||||||||||||||||||
| LOSS (# sample) |
| cf) Tissue ID; Tissue type (1; Breast, 2; Central_nervous_system, 3; Cervix, 4; Endometrium, 5; Haematopoietic_and_lymphoid_tissue, 6; Kidney, 7; Large_intestine, 8; Liver, 9; Lung, 10; NS, 11; Ovary, 12; Pancreas, 13; Prostate, 14; Skin, 15; Stomach, 16; Thyroid, 17; Urinary_tract) |
| Top |
|
 |
| Top |
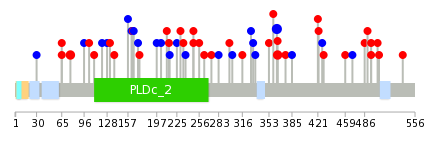
| Stat. for Non-Synonymous SNVs (# total SNVs=26) | (# total SNVs=15) |
 |  |
(# total SNVs=1) | (# total SNVs=0) |
 |
| Top |
| * When you move the cursor on each content, you can see more deailed mutation information on the Tooltip. Those are primary_site,primary_histology,mutation(aa),pubmedID. |
| GRCh37 position | Mutation(aa) | Unique sampleID count |
| chr17:76399860-76399860 | p.I364I | 3 |
| chr17:76399861-76399861 | p.D365Y | 3 |
| chr17:76388642-76388642 | p.V77M | 2 |
| chr17:76400034-76400034 | p.K422N | 2 |
| chr17:76396799-76396799 | p.R248H | 1 |
| chr17:76392418-76392418 | p.V121V | 1 |
| chr17:76399825-76399825 | p.P353S | 1 |
| chr17:76395526-76395526 | p.L203L | 1 |
| chr17:76410964-76410964 | p.L469L | 1 |
| chr17:76396823-76396823 | p.A256V | 1 |
| Top |
|
 |
| Point Mutation/ Tissue ID | 1 | 2 | 3 | 4 | 5 | 6 | 7 | 8 | 9 | 10 | 11 | 12 | 13 | 14 | 15 | 16 | 17 | 18 | 19 | 20 |
| # sample | 2 | 1 | 4 | 1 | 2 | 4 | 2 | 9 | 4 | 8 | ||||||||||
| # mutation | 2 | 2 | 4 | 1 | 2 | 4 | 2 | 9 | 4 | 8 | ||||||||||
| nonsynonymous SNV | 2 | 2 | 1 | 2 | 2 | 2 | 4 | 3 | 6 | |||||||||||
| synonymous SNV | 2 | 2 | 2 | 5 | 1 | 2 |
| cf) Tissue ID; Tissue type (1; BLCA[Bladder Urothelial Carcinoma], 2; BRCA[Breast invasive carcinoma], 3; CESC[Cervical squamous cell carcinoma and endocervical adenocarcinoma], 4; COAD[Colon adenocarcinoma], 5; GBM[Glioblastoma multiforme], 6; Glioma Low Grade, 7; HNSC[Head and Neck squamous cell carcinoma], 8; KICH[Kidney Chromophobe], 9; KIRC[Kidney renal clear cell carcinoma], 10; KIRP[Kidney renal papillary cell carcinoma], 11; LAML[Acute Myeloid Leukemia], 12; LUAD[Lung adenocarcinoma], 13; LUSC[Lung squamous cell carcinoma], 14; OV[Ovarian serous cystadenocarcinoma ], 15; PAAD[Pancreatic adenocarcinoma], 16; PRAD[Prostate adenocarcinoma], 17; SKCM[Skin Cutaneous Melanoma], 18:STAD[Stomach adenocarcinoma], 19:THCA[Thyroid carcinoma], 20:UCEC[Uterine Corpus Endometrial Carcinoma]) |
| Top |
| * We represented just top 10 SNVs. When you move the cursor on each content, you can see more deailed mutation information on the Tooltip. Those are primary_site, primary_histology, mutation(aa), pubmedID. |
| Genomic Position | Mutation(aa) | Unique sampleID count |
| chr17:76399861 | p.D365Y | 3 |
| chr17:76388642 | p.V77M | 2 |
| chr17:76400049 | p.E214K | 1 |
| chr17:76394407 | p.A427A | 1 |
| chr17:76396874 | p.L225L | 1 |
| chr17:76400074 | p.E436Q | 1 |
| chr17:76394412 | p.V230I | 1 |
| chr17:76399660 | p.R459W | 1 |
| chr17:76400143 | p.L237L | 1 |
| chr17:76395508 | p.L469L | 1 |
| * Copy number data were extracted from TCGA using R package TCGA-Assembler. The URLs of all public data files on TCGA DCC data server were gathered on Jan-05-2015. Function ProcessCNAData in TCGA-Assembler package was used to obtain gene-level copy number value which is calculated as the average copy number of the genomic region of a gene. |
 |
| cf) Tissue ID[Tissue type]: BLCA[Bladder Urothelial Carcinoma], BRCA[Breast invasive carcinoma], CESC[Cervical squamous cell carcinoma and endocervical adenocarcinoma], COAD[Colon adenocarcinoma], GBM[Glioblastoma multiforme], Glioma Low Grade, HNSC[Head and Neck squamous cell carcinoma], KICH[Kidney Chromophobe], KIRC[Kidney renal clear cell carcinoma], KIRP[Kidney renal papillary cell carcinoma], LAML[Acute Myeloid Leukemia], LUAD[Lung adenocarcinoma], LUSC[Lung squamous cell carcinoma], OV[Ovarian serous cystadenocarcinoma ], PAAD[Pancreatic adenocarcinoma], PRAD[Prostate adenocarcinoma], SKCM[Skin Cutaneous Melanoma], STAD[Stomach adenocarcinoma], THCA[Thyroid carcinoma], UCEC[Uterine Corpus Endometrial Carcinoma] |
| Top |
| Gene Expression for PGS1 |
| * CCLE gene expression data were extracted from CCLE_Expression_Entrez_2012-10-18.res: Gene-centric RMA-normalized mRNA expression data. |
 |
| * Normalized gene expression data of RNASeqV2 was extracted from TCGA using R package TCGA-Assembler. The URLs of all public data files on TCGA DCC data server were gathered at Jan-05-2015. Only eight cancer types have enough normal control samples for differential expression analysis. (t test, adjusted p<0.05 (using Benjamini-Hochberg FDR)) |
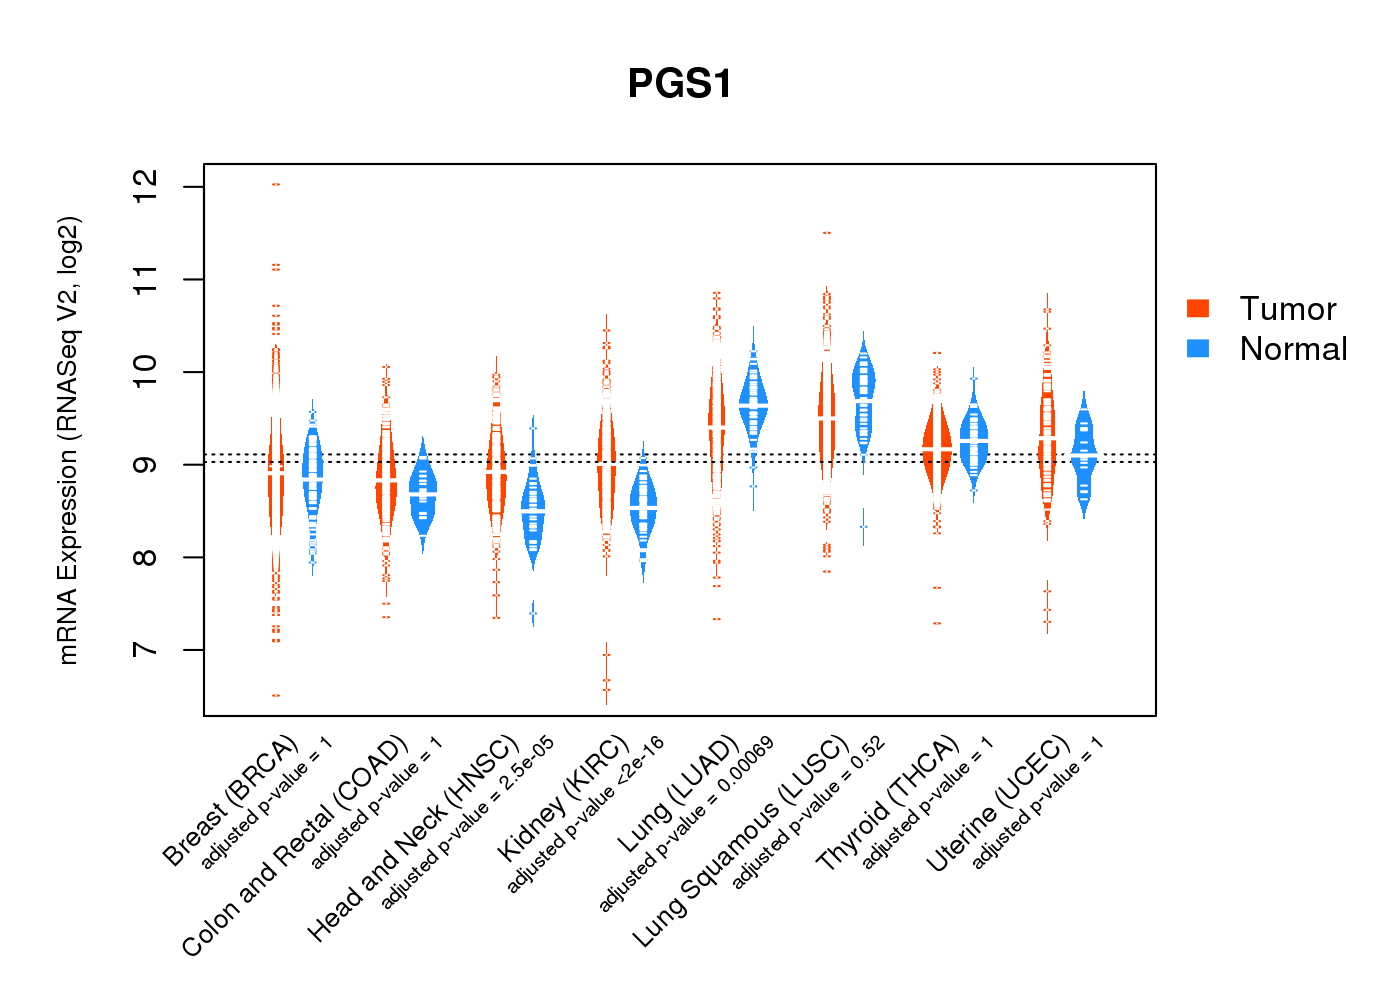 |
| Top |
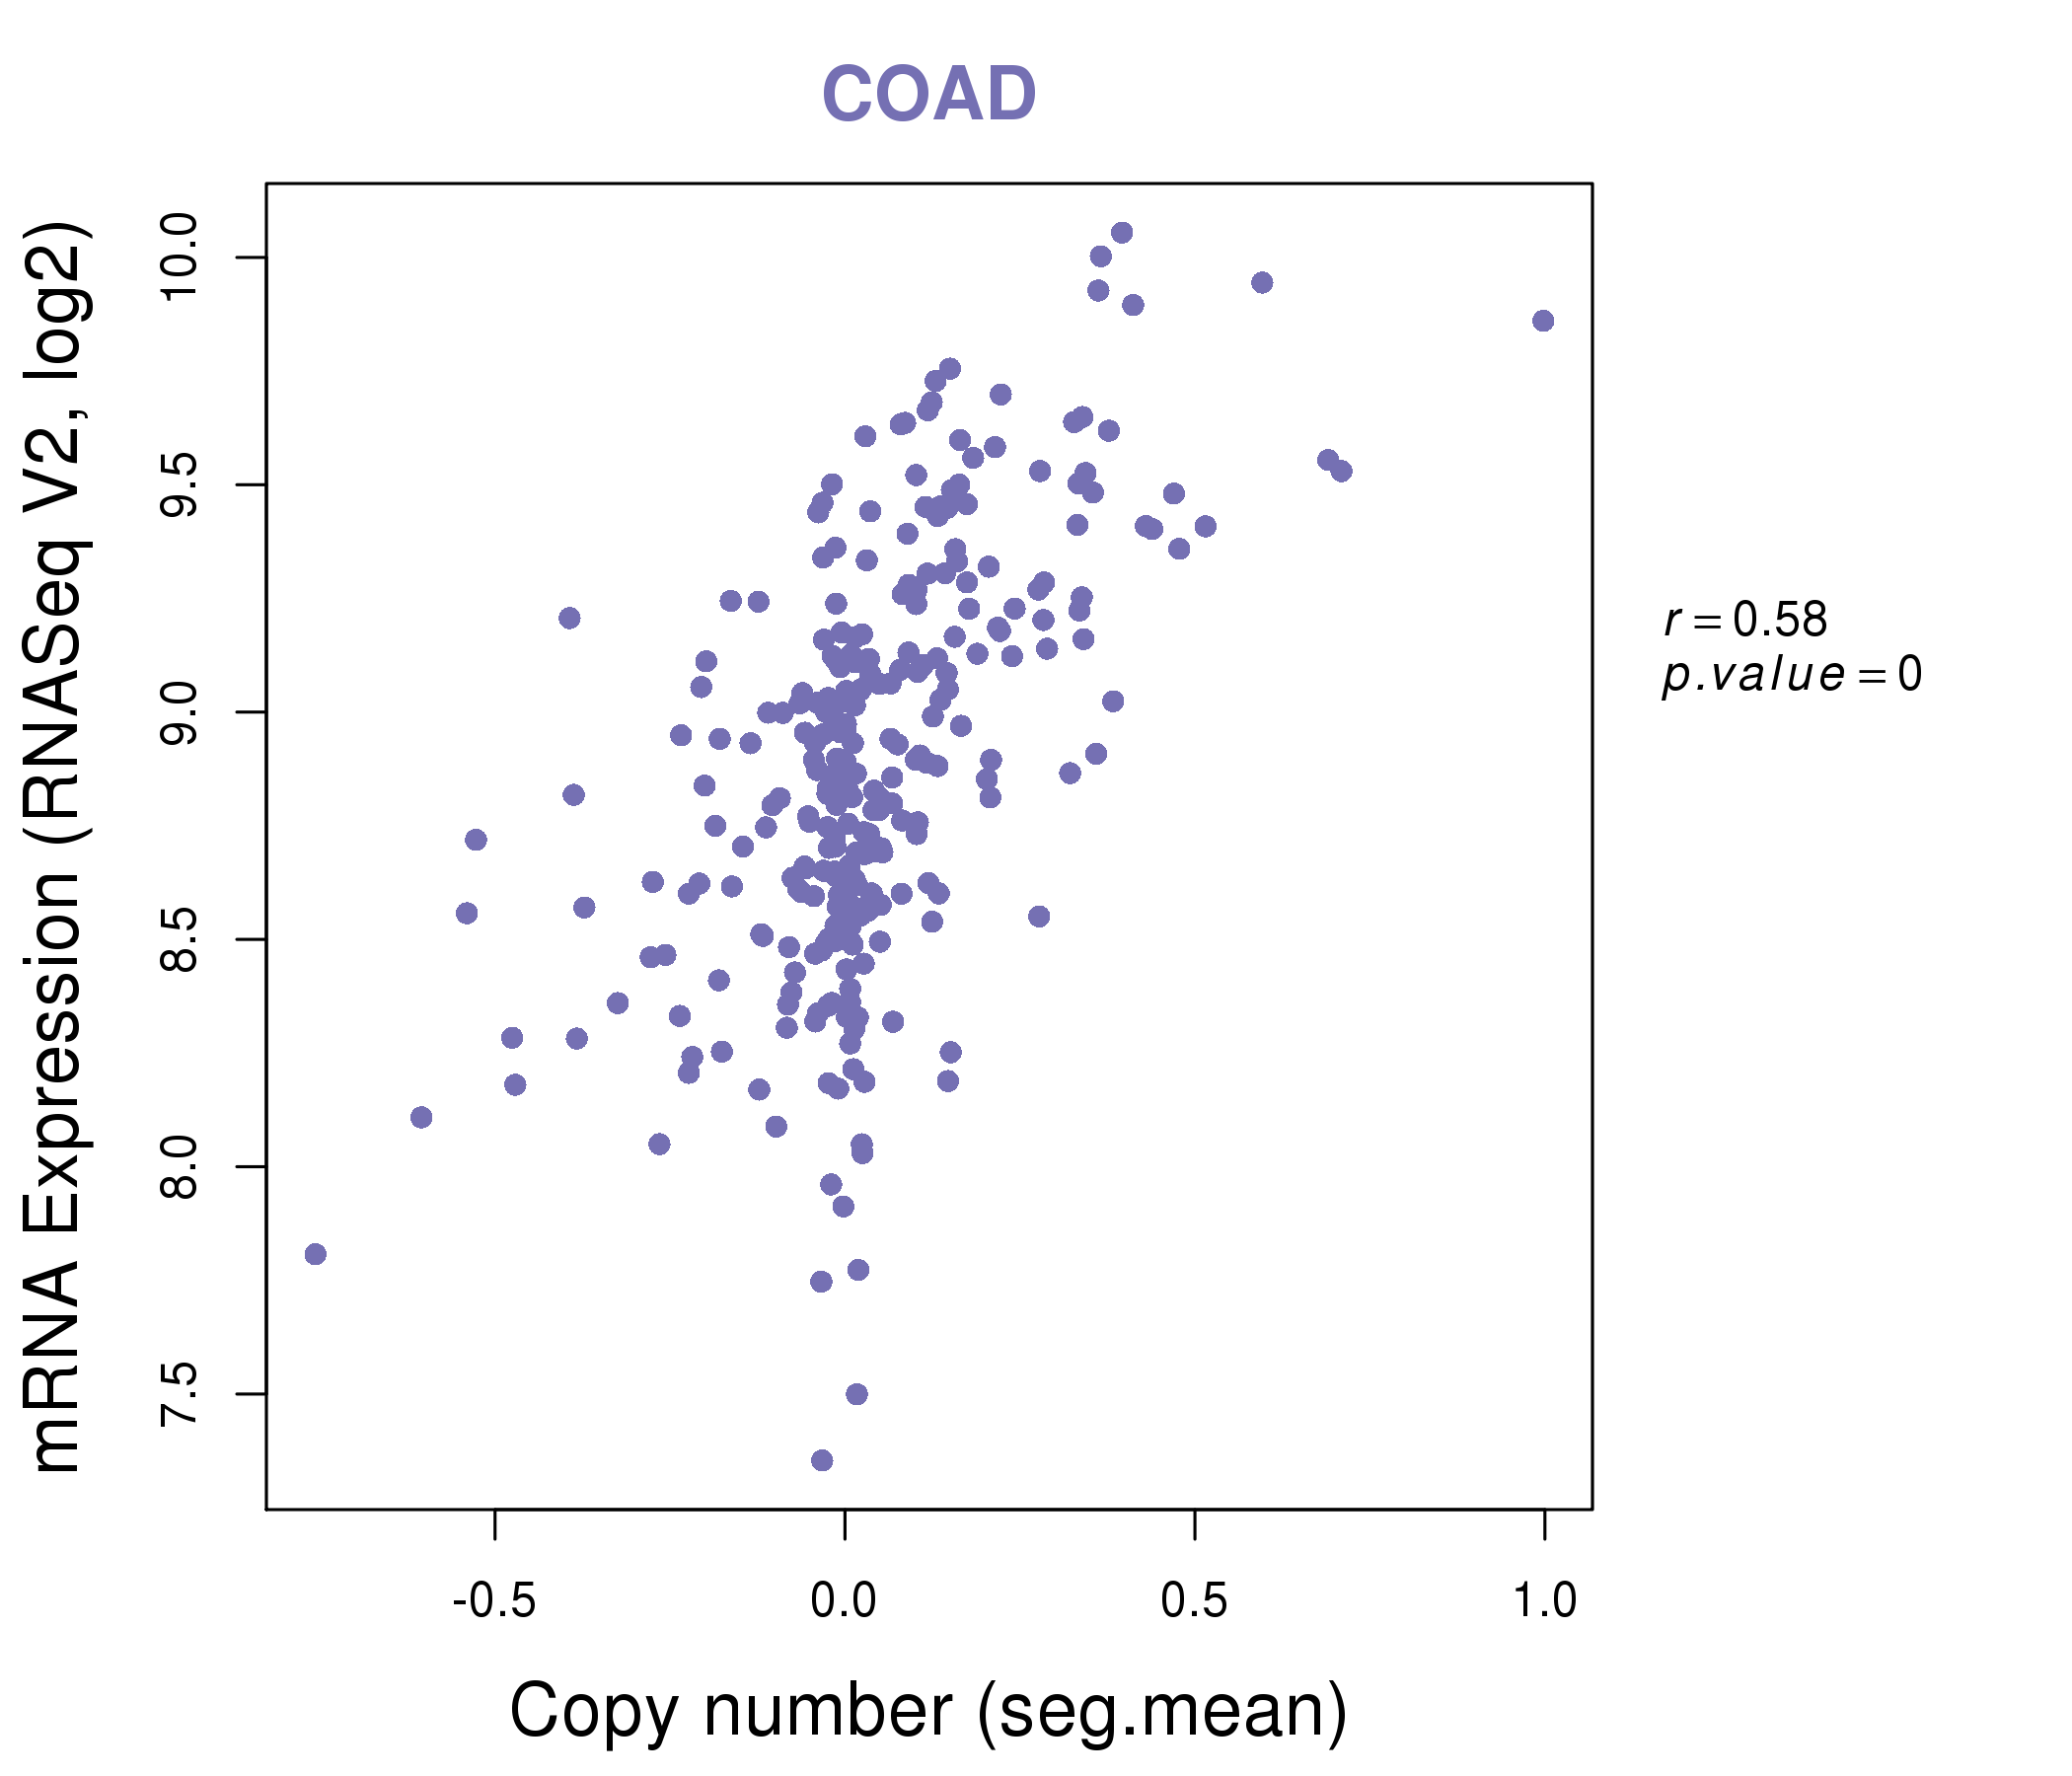
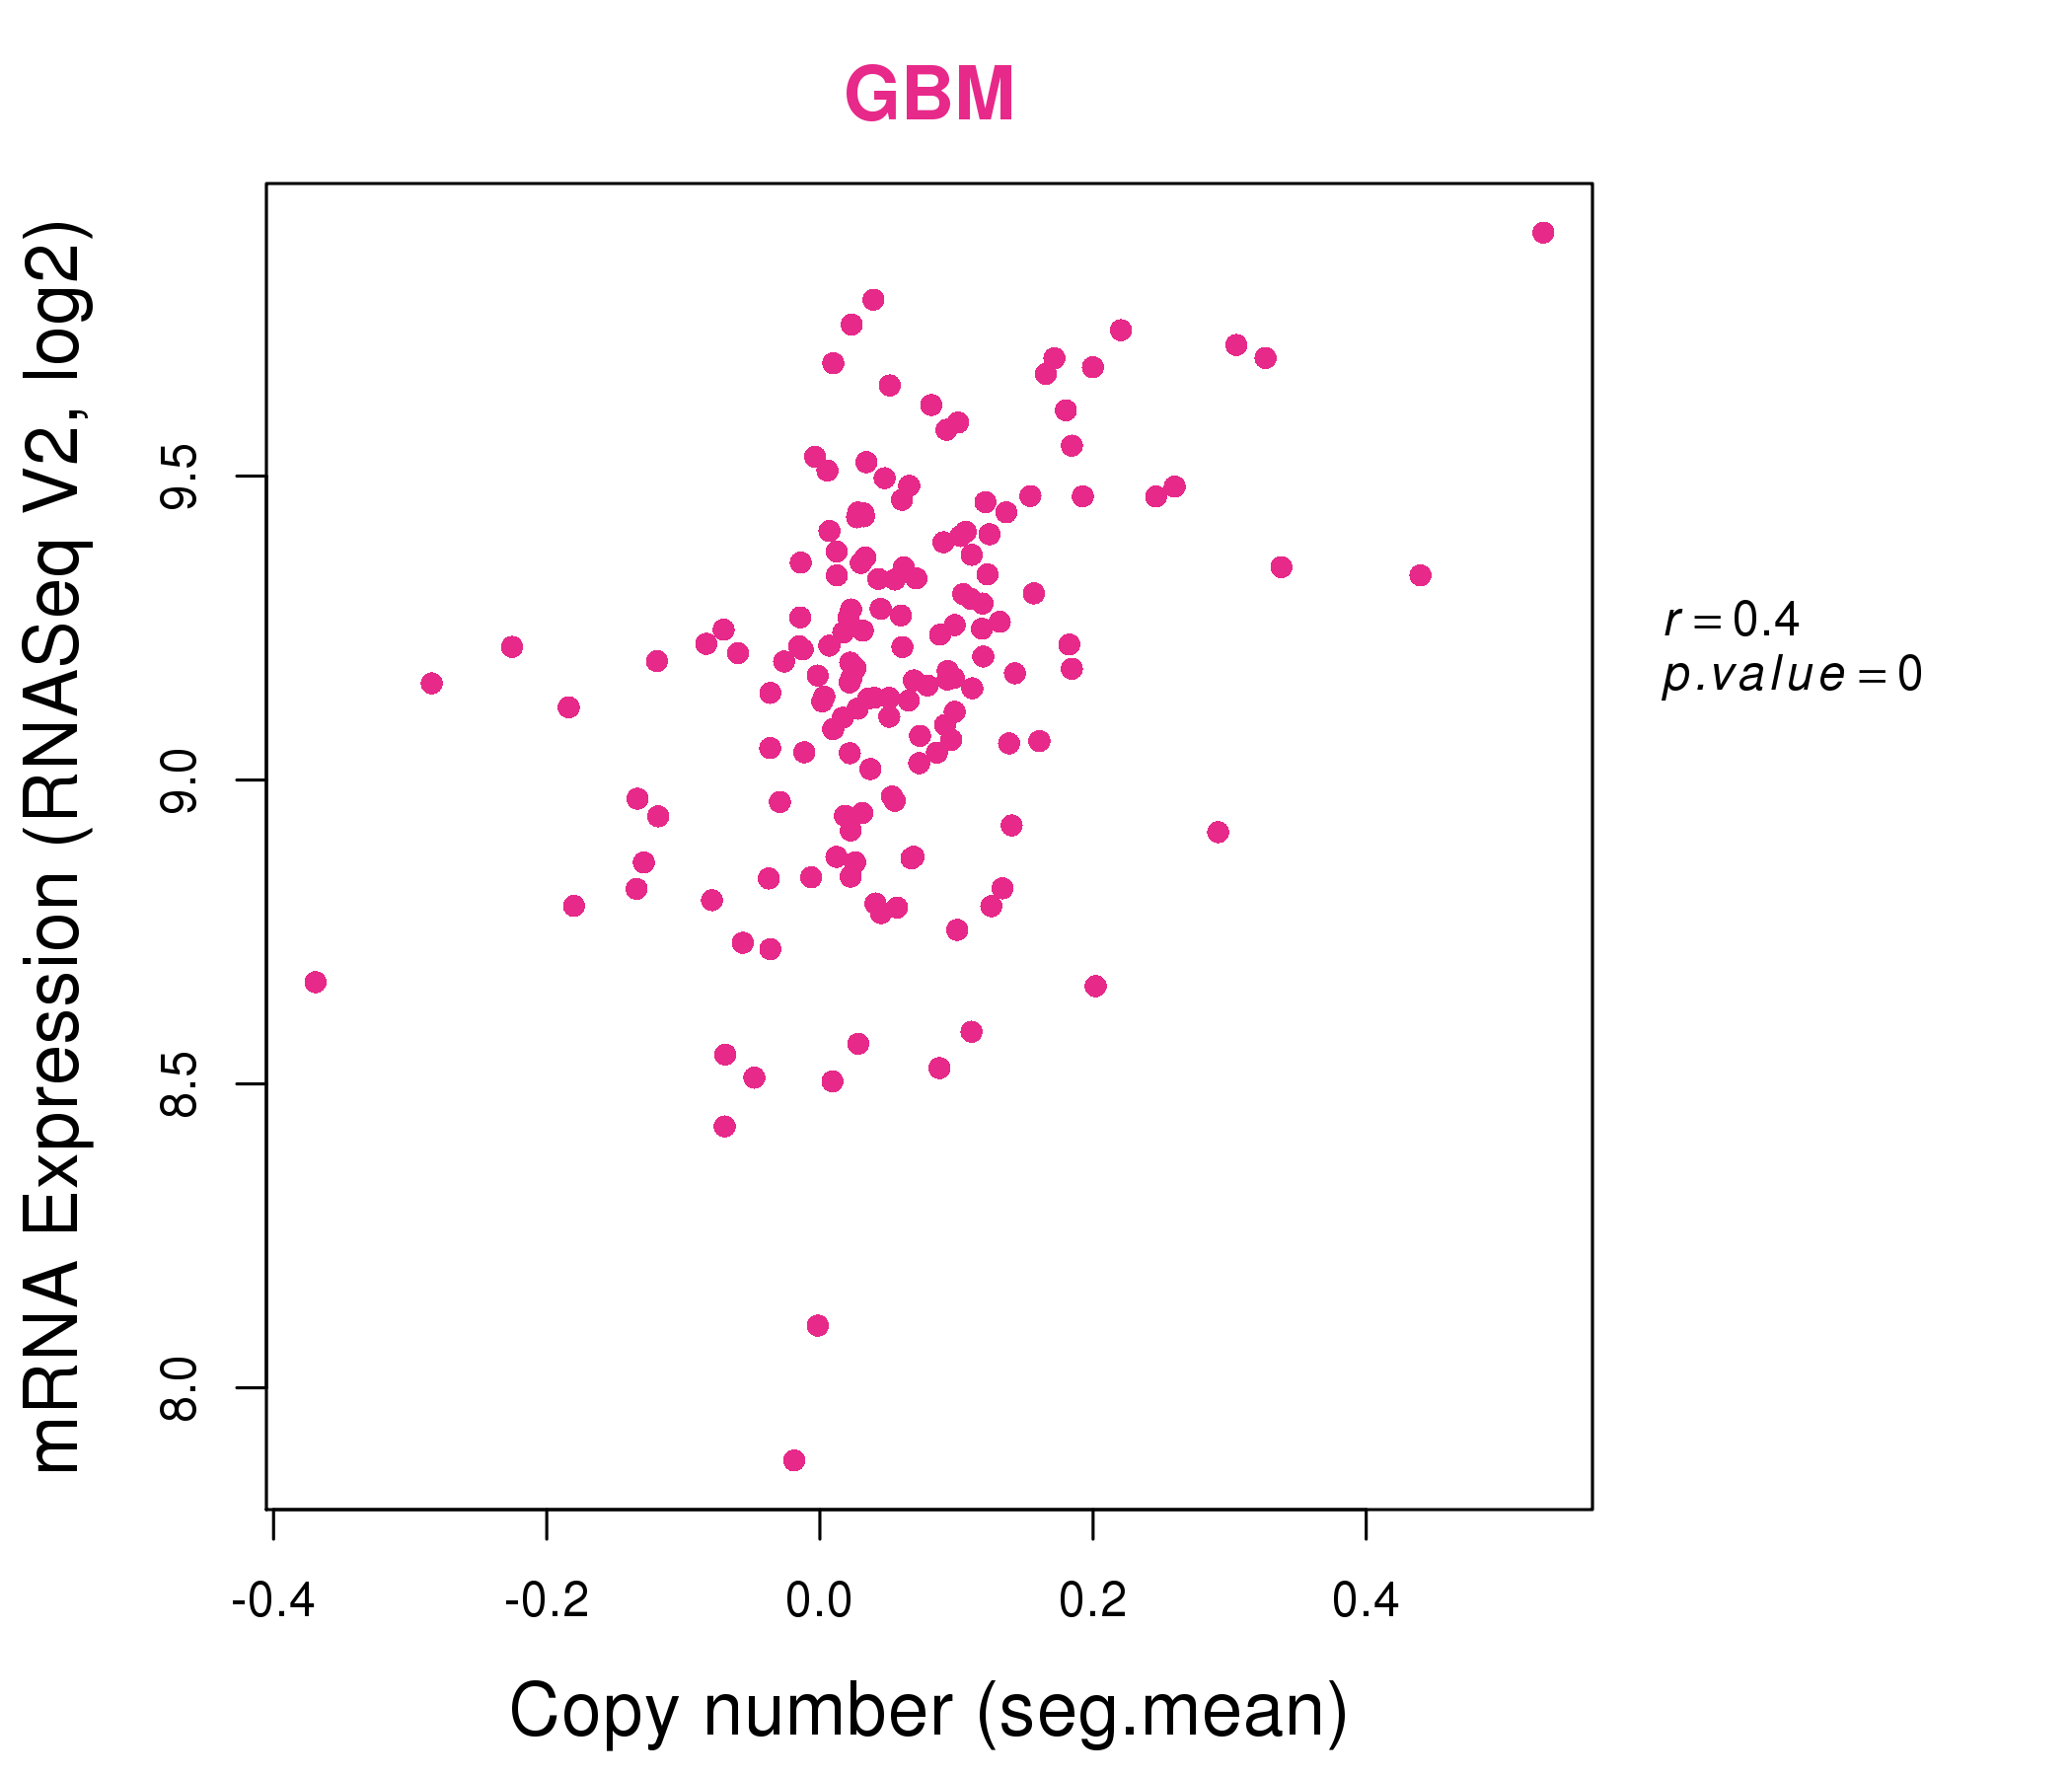
| * This plots show the correlation between CNV and gene expression. |
: Open all plots for all cancer types
 |
|
 |
|

| Top |
| Gene-Gene Network Information |
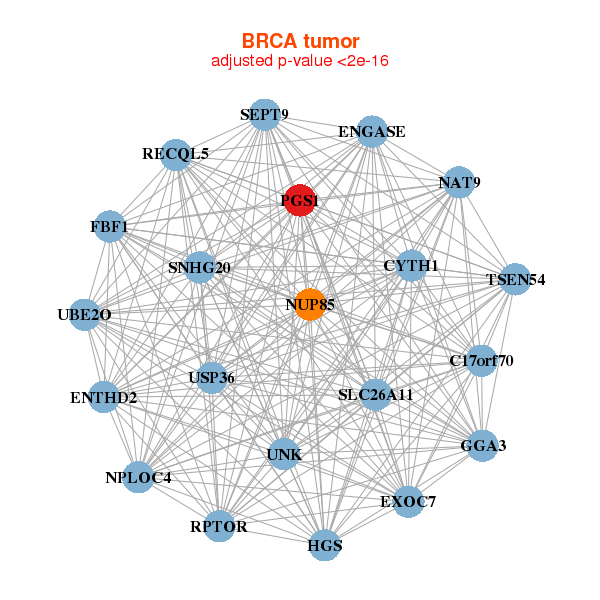
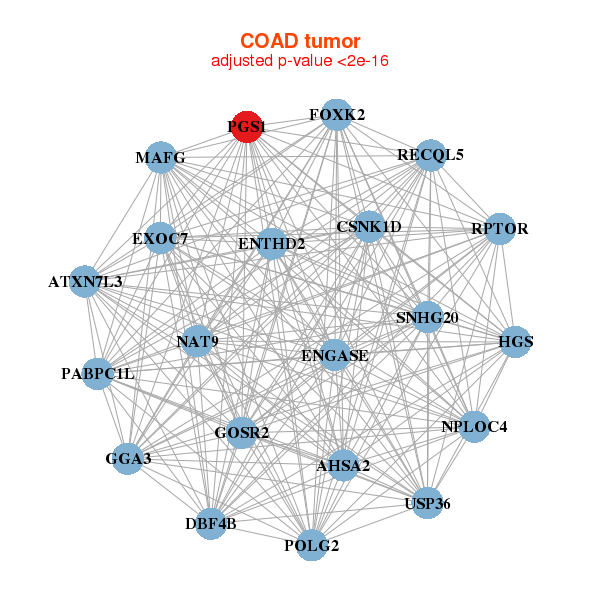
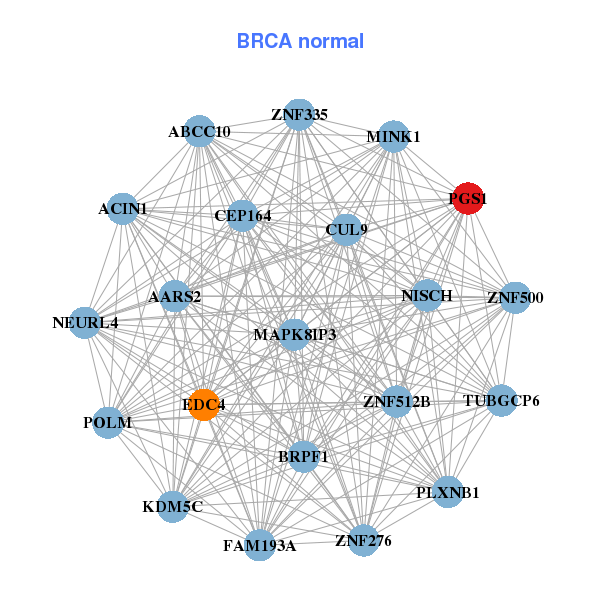
| * Co-Expression network figures were drawn using R package igraph. Only the top 20 genes with the highest correlations were shown. Red circle: input gene, orange circle: cell metabolism gene, sky circle: other gene |
: Open all plots for all cancer types
 |
|
| ENTHD2,C17orf70,SNHG20,CYTH1,ENGASE,EXOC7,FBF1, GGA3,HGS,NAT9,NPLOC4,NUP85,PGS1,RECQL5, RPTOR,SEPT9,SLC26A11,TSEN54,UBE2O,UNK,USP36 | AARS2,ABCC10,ACIN1,BRPF1,CEP164,CUL9,EDC4, FAM193A,KDM5C,MAPK8IP3,MINK1,NEURL4,NISCH,PGS1, PLXNB1,POLM,TUBGCP6,ZNF276,ZNF335,ZNF500,ZNF512B |
 |
|
| AHSA2,ATXN7L3,ENTHD2,SNHG20,CSNK1D,DBF4B,ENGASE, EXOC7,FOXK2,GGA3,GOSR2,HGS,MAFG,NAT9, NPLOC4,PABPC1L,PGS1,POLG2,RECQL5,RPTOR,USP36 | ADAT2,APBB3,ARGLU1,ATG16L2,CCNL2,DDX26B,FER1L4, HMGXB3,KCNAB3,CLUHP3,KIAA0895L,LOC100272228,LOC146880,NSUN5P2, OGT,PGS1,PLEKHM1P,RHOT2,AKAP17A,SLC6A7,SNHG12 |
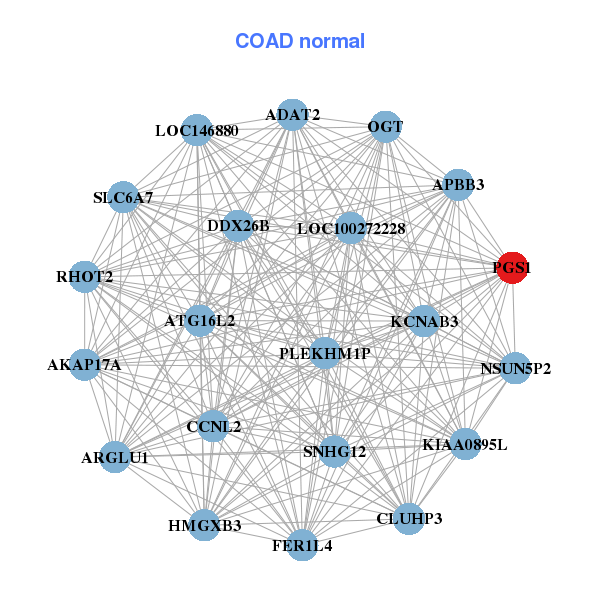
| * Co-Expression network figures were drawn using R package igraph. Only the top 20 genes with the highest correlations were shown. Red circle: input gene, orange circle: cell metabolism gene, sky circle: other gene |
: Open all plots for all cancer types
| Top |
: Open all interacting genes' information including KEGG pathway for all interacting genes from DAVID
| Top |
| Pharmacological Information for PGS1 |
| There's no related Drug. |
| Top |
| Cross referenced IDs for PGS1 |
| * We obtained these cross-references from Uniprot database. It covers 150 different DBs, 18 categories. http://www.uniprot.org/help/cross_references_section |
: Open all cross reference information
|
Copyright © 2016-Present - The Univsersity of Texas Health Science Center at Houston @ |