|
||||||||||||||||||||||||||||||||||||||||||||||||||||||||||||||||||||||||||||||||||||||||||||||||||||||||||||||||||||||||||||||||||||||||||||||||||||||||||||||||||||||||||||||||||||||||||||||||||||||||||||||||||||||||||||||||||||||||||||||||||||||||||||||||||||||||||||||||||||||||||||||||||||||||||||||||||||||||||
| |
| Phenotypic Information (metabolism pathway, cancer, disease, phenome) |
| |
| |
| Gene-Gene Network Information: Co-Expression Network, Interacting Genes & KEGG |
| |
|


| Gene Summary for HS2ST1 |
| Basic gene info. | Gene symbol | HS2ST1 |
| Gene name | heparan sulfate 2-O-sulfotransferase 1 | |
| Synonyms | dJ604K5.2 | |
| Cytomap | UCSC genome browser: 1p22.3 | |
| Genomic location | chr1 :87380334-87575681 | |
| Type of gene | protein-coding | |
| RefGenes | NM_001134492.1, NM_012262.3, | |
| Ensembl id | ENSG00000153936 | |
| Description | 2-O-sulfotransferase2OST | |
| Modification date | 20141207 | |
| dbXrefs | MIM : 604844 | |
| HGNC : HGNC | ||
| Ensembl : ENSG00000153936 | ||
| HPRD : 09215 | ||
| Vega : OTTHUMG00000010255 | ||
| Protein | UniProt: go to UniProt's Cross Reference DB Table | |
| Expression | CleanEX: HS_HS2ST1 | |
| BioGPS: 9653 | ||
| Gene Expression Atlas: ENSG00000153936 | ||
| The Human Protein Atlas: ENSG00000153936 | ||
| Pathway | NCI Pathway Interaction Database: HS2ST1 | |
| KEGG: HS2ST1 | ||
| REACTOME: HS2ST1 | ||
| ConsensusPathDB | ||
| Pathway Commons: HS2ST1 | ||
| Metabolism | MetaCyc: HS2ST1 | |
| HUMANCyc: HS2ST1 | ||
| Regulation | Ensembl's Regulation: ENSG00000153936 | |
| miRBase: chr1 :87,380,334-87,575,681 | ||
| TargetScan: NM_001134492 | ||
| cisRED: ENSG00000153936 | ||
| Context | iHOP: HS2ST1 | |
| cancer metabolism search in PubMed: HS2ST1 | ||
| UCL Cancer Institute: HS2ST1 | ||
| Assigned class in ccmGDB | C | |
| Top |
| Phenotypic Information for HS2ST1(metabolism pathway, cancer, disease, phenome) |
| Cancer | CGAP: HS2ST1 |
| Familial Cancer Database: HS2ST1 | |
| * This gene is included in those cancer gene databases. |
|
|
|
|
|
| . | ||||||||||||||||||||||||||||||||||||||||||||||||||||||||||||||||||||||||||||||||||||||||||||||||||||||||||||||||||||||||||||||||||||||||||||||||||||||||||||||||||||||||||||||||||||||||||||||||||||||||||||||||||||||||||||||||||||||||||||||||||||||||||||||||||||||||||||||||||||||||||||||||||||||||||||||||||||
Oncogene 1 | Significant driver gene in | |||||||||||||||||||||||||||||||||||||||||||||||||||||||||||||||||||||||||||||||||||||||||||||||||||||||||||||||||||||||||||||||||||||||||||||||||||||||||||||||||||||||||||||||||||||||||||||||||||||||||||||||||||||||||||||||||||||||||||||||||||||||||||||||||||||||||||||||||||||||||||||||||||||||||||||||||||||||||
| cf) number; DB name 1 Oncogene; http://nar.oxfordjournals.org/content/35/suppl_1/D721.long, 2 Tumor Suppressor gene; https://bioinfo.uth.edu/TSGene/, 3 Cancer Gene Census; http://www.nature.com/nrc/journal/v4/n3/abs/nrc1299.html, 4 CancerGenes; http://nar.oxfordjournals.org/content/35/suppl_1/D721.long, 5 Network of Cancer Gene; http://ncg.kcl.ac.uk/index.php, 1Therapeutic Vulnerabilities in Cancer; http://cbio.mskcc.org/cancergenomics/statius/ |
| REACTOME_METABOLISM_OF_CARBOHYDRATES | |
| OMIM | |
| Orphanet | |
| Disease | KEGG Disease: HS2ST1 |
| MedGen: HS2ST1 (Human Medical Genetics with Condition) | |
| ClinVar: HS2ST1 | |
| Phenotype | MGI: HS2ST1 (International Mouse Phenotyping Consortium) |
| PhenomicDB: HS2ST1 | |
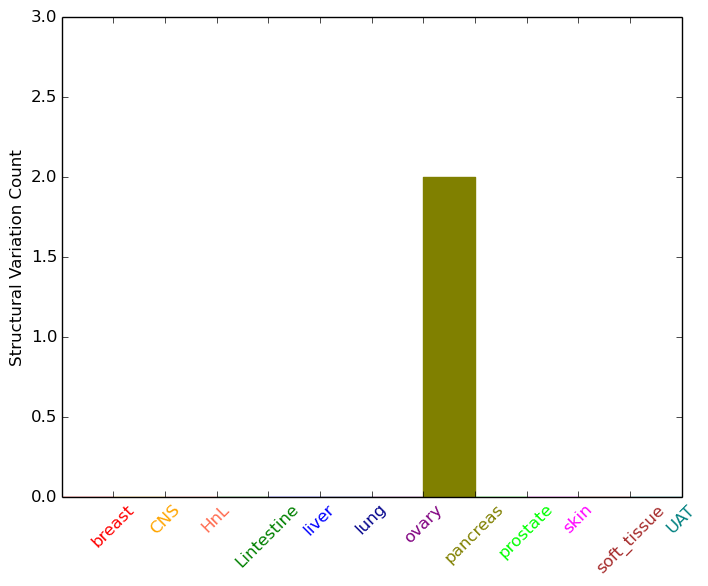
| Mutations for HS2ST1 |
| * Under tables are showing count per each tissue to give us broad intuition about tissue specific mutation patterns.You can go to the detailed page for each mutation database's web site. |
| - Statistics for Tissue and Mutation type | Top |
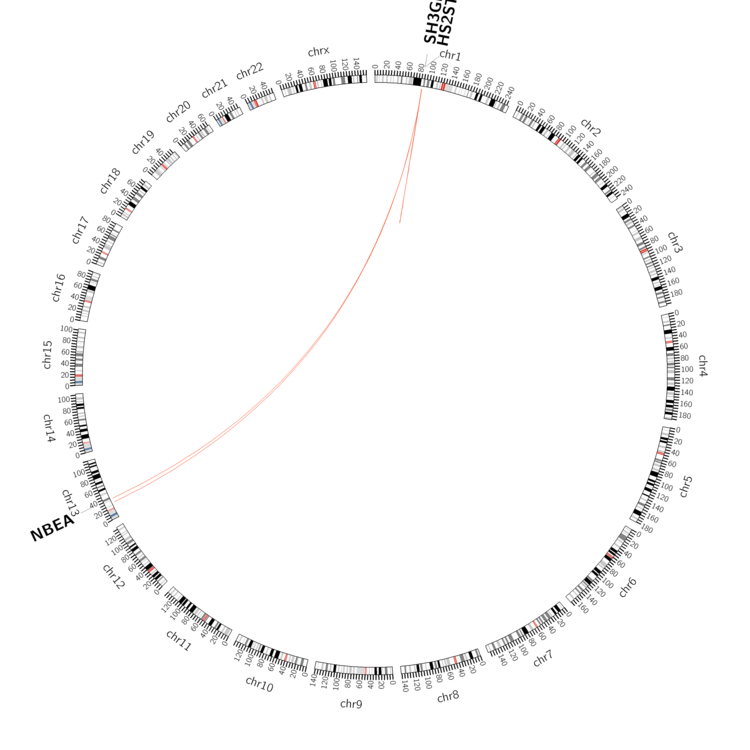 |
| - For Inter-chromosomal Variations |
| * Inter-chromosomal variantions includes 'interchromosomal amplicon to amplicon', 'interchromosomal amplicon to non-amplified dna', 'interchromosomal insertion', 'Interchromosomal unknown type'. |
 |
| - For Intra-chromosomal Variations |
| * Intra-chromosomal variantions includes 'intrachromosomal amplicon to amplicon', 'intrachromosomal amplicon to non-amplified dna', 'intrachromosomal deletion', 'intrachromosomal fold-back inversion', 'intrachromosomal inversion', 'intrachromosomal tandem duplication', 'Intrachromosomal unknown type', 'intrachromosomal with inverted orientation', 'intrachromosomal with non-inverted orientation'. |
 |
| Sample | Symbol_a | Chr_a | Start_a | End_a | Symbol_b | Chr_b | Start_b | End_b |
| ovary | HS2ST1 | chr1 | 87381877 | 87381897 | SH3GLB1 | chr1 | 87207894 | 87207914 |
| ovary | HS2ST1 | chr1 | 87511572 | 87511592 | HS2ST1 | chr1 | 87505832 | 87505852 |
| ovary | HS2ST1 | chr1 | 87575397 | 87575417 | HS2ST1 | chr1 | 87569785 | 87569805 |
| pancreas | HS2ST1 | chr1 | 87451427 | 87451447 | NBEA | chr13 | 35785576 | 35785596 |
| pancreas | HS2ST1 | chr1 | 87502943 | 87502963 | HS2ST1 | chr1 | 87502871 | 87502891 |
| cf) Tissue number; Tissue name (1;Breast, 2;Central_nervous_system, 3;Haematopoietic_and_lymphoid_tissue, 4;Large_intestine, 5;Liver, 6;Lung, 7;Ovary, 8;Pancreas, 9;Prostate, 10;Skin, 11;Soft_tissue, 12;Upper_aerodigestive_tract) |
| * From mRNA Sanger sequences, Chitars2.0 arranged chimeric transcripts. This table shows HS2ST1 related fusion information. |
| ID | Head Gene | Tail Gene | Accession | Gene_a | qStart_a | qEnd_a | Chromosome_a | tStart_a | tEnd_a | Gene_a | qStart_a | qEnd_a | Chromosome_a | tStart_a | tEnd_a |
| BE156347 | CENPF | 14 | 142 | 1 | 214822145 | 214825155 | HS2ST1 | 132 | 151 | 1 | 87613124 | 87613143 | |
| BF947708 | HS2ST1 | 1 | 119 | 1 | 87380651 | 87380768 | KCNJ2-AS1 | 116 | 522 | 17 | 68164747 | 68165150 | |
| AW086208 | HS2ST1 | 175 | 202 | 1 | 87483849 | 87483876 | PCGF3 | 196 | 400 | 4 | 763719 | 763922 | |
| BF223279 | HS2ST1 | 200 | 222 | 1 | 87512693 | 87512716 | SSX2IP | 211 | 524 | 1 | 85111955 | 85112268 | |
| BP376296 | UBA2 | 8 | 463 | 19 | 34945363 | 34955033 | HS2ST1 | 464 | 582 | 1 | 87511808 | 87511926 | |
| BF917753 | HS2ST1 | 10 | 203 | 1 | 87381618 | 87381811 | RUNX2 | 189 | 626 | 6 | 45421434 | 45421870 | |
| Top |
| Mutation type/ Tissue ID | brca | cns | cerv | endome | haematopo | kidn | Lintest | liver | lung | ns | ovary | pancre | prost | skin | stoma | thyro | urina | |||
| Total # sample | 1 | |||||||||||||||||||
| GAIN (# sample) | 1 | |||||||||||||||||||
| LOSS (# sample) |
| cf) Tissue ID; Tissue type (1; Breast, 2; Central_nervous_system, 3; Cervix, 4; Endometrium, 5; Haematopoietic_and_lymphoid_tissue, 6; Kidney, 7; Large_intestine, 8; Liver, 9; Lung, 10; NS, 11; Ovary, 12; Pancreas, 13; Prostate, 14; Skin, 15; Stomach, 16; Thyroid, 17; Urinary_tract) |
| Top |
|
 |
| Top |
| Stat. for Non-Synonymous SNVs (# total SNVs=24) | (# total SNVs=4) |
 |  |
(# total SNVs=0) | (# total SNVs=1) |
 |
| Top |
| * When you move the cursor on each content, you can see more deailed mutation information on the Tooltip. Those are primary_site,primary_histology,mutation(aa),pubmedID. |
| GRCh37 position | Mutation(aa) | Unique sampleID count |
| chr1:87558333-87558333 | p.R190Q | 2 |
| chr1:87538859-87538859 | p.? | 2 |
| chr1:87538643-87538643 | p.R51* | 2 |
| chr1:87549881-87549881 | p.R123H | 2 |
| chr1:87538679-87538679 | p.R63W | 2 |
| chr1:87563588-87563588 | p.P219L | 2 |
| chr1:87380793-87380793 | p.L25R | 1 |
| chr1:87569257-87569257 | p.E277K | 1 |
| chr1:87538749-87538749 | p.S86N | 1 |
| chr1:87558325-87558325 | p.L187L | 1 |
| Top |
|
 |
| Point Mutation/ Tissue ID | 1 | 2 | 3 | 4 | 5 | 6 | 7 | 8 | 9 | 10 | 11 | 12 | 13 | 14 | 15 | 16 | 17 | 18 | 19 | 20 |
| # sample | 1 | 2 | 1 | 4 | 4 | 2 | 1 | 1 | 2 | 2 | 5 | 5 | ||||||||
| # mutation | 1 | 2 | 1 | 4 | 4 | 2 | 1 | 1 | 2 | 2 | 5 | 5 | ||||||||
| nonsynonymous SNV | 1 | 2 | 1 | 3 | 4 | 2 | 1 | 1 | 1 | 1 | 3 | 5 | ||||||||
| synonymous SNV | 1 | 1 | 1 | 2 |
| cf) Tissue ID; Tissue type (1; BLCA[Bladder Urothelial Carcinoma], 2; BRCA[Breast invasive carcinoma], 3; CESC[Cervical squamous cell carcinoma and endocervical adenocarcinoma], 4; COAD[Colon adenocarcinoma], 5; GBM[Glioblastoma multiforme], 6; Glioma Low Grade, 7; HNSC[Head and Neck squamous cell carcinoma], 8; KICH[Kidney Chromophobe], 9; KIRC[Kidney renal clear cell carcinoma], 10; KIRP[Kidney renal papillary cell carcinoma], 11; LAML[Acute Myeloid Leukemia], 12; LUAD[Lung adenocarcinoma], 13; LUSC[Lung squamous cell carcinoma], 14; OV[Ovarian serous cystadenocarcinoma ], 15; PAAD[Pancreatic adenocarcinoma], 16; PRAD[Prostate adenocarcinoma], 17; SKCM[Skin Cutaneous Melanoma], 18:STAD[Stomach adenocarcinoma], 19:THCA[Thyroid carcinoma], 20:UCEC[Uterine Corpus Endometrial Carcinoma]) |
| Top |
| * We represented just top 10 SNVs. When you move the cursor on each content, you can see more deailed mutation information on the Tooltip. Those are primary_site, primary_histology, mutation(aa), pubmedID. |
| Genomic Position | Mutation(aa) | Unique sampleID count |
| chr1:87563588 | p.P219L,HS2ST1 | 2 |
| chr1:87380793 | p.Q30E,HS2ST1 | 1 |
| chr1:87549881 | p.R188W,HS2ST1 | 1 |
| chr1:87380807 | p.Q32R,HS2ST1 | 1 |
| chr1:87549891 | p.R188R,HS2ST1 | 1 |
| chr1:87569257 | p.A46T,HS2ST1 | 1 |
| chr1:87380814 | p.G206G,HS2ST1 | 1 |
| chr1:87549897 | p.H48Y,HS2ST1 | 1 |
| chr1:87569270 | p.E212Q,HS2ST1 | 1 |
| chr1:87538628 | p.R56Q,HS2ST1 | 1 |
| * Copy number data were extracted from TCGA using R package TCGA-Assembler. The URLs of all public data files on TCGA DCC data server were gathered on Jan-05-2015. Function ProcessCNAData in TCGA-Assembler package was used to obtain gene-level copy number value which is calculated as the average copy number of the genomic region of a gene. |
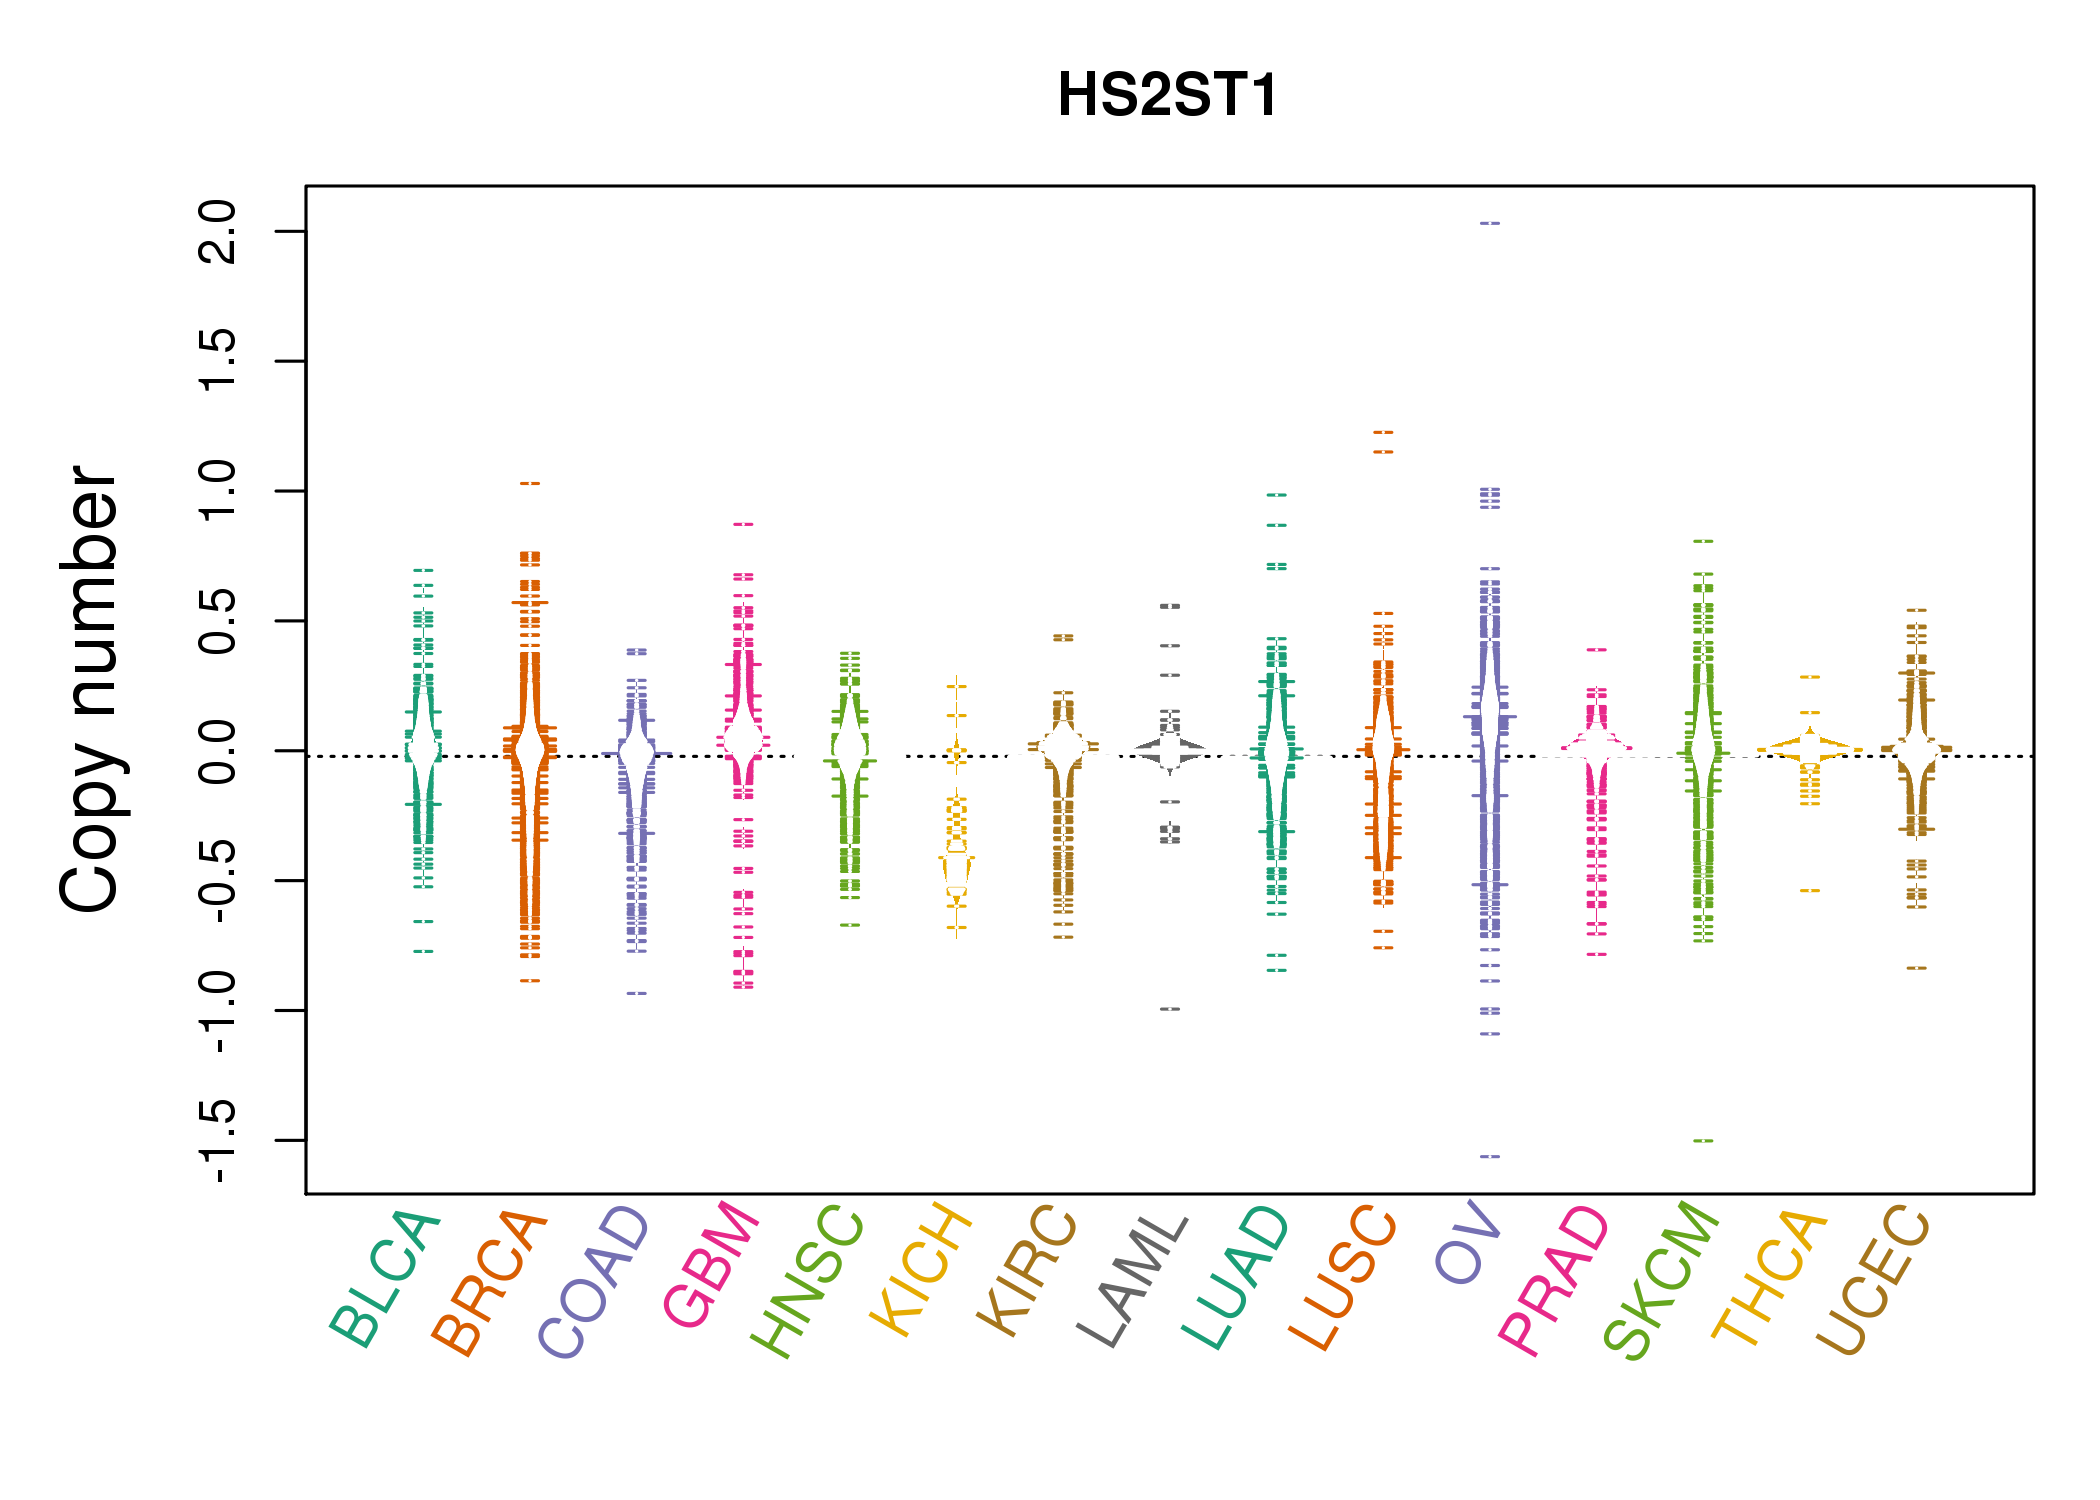 |
| cf) Tissue ID[Tissue type]: BLCA[Bladder Urothelial Carcinoma], BRCA[Breast invasive carcinoma], CESC[Cervical squamous cell carcinoma and endocervical adenocarcinoma], COAD[Colon adenocarcinoma], GBM[Glioblastoma multiforme], Glioma Low Grade, HNSC[Head and Neck squamous cell carcinoma], KICH[Kidney Chromophobe], KIRC[Kidney renal clear cell carcinoma], KIRP[Kidney renal papillary cell carcinoma], LAML[Acute Myeloid Leukemia], LUAD[Lung adenocarcinoma], LUSC[Lung squamous cell carcinoma], OV[Ovarian serous cystadenocarcinoma ], PAAD[Pancreatic adenocarcinoma], PRAD[Prostate adenocarcinoma], SKCM[Skin Cutaneous Melanoma], STAD[Stomach adenocarcinoma], THCA[Thyroid carcinoma], UCEC[Uterine Corpus Endometrial Carcinoma] |
| Top |
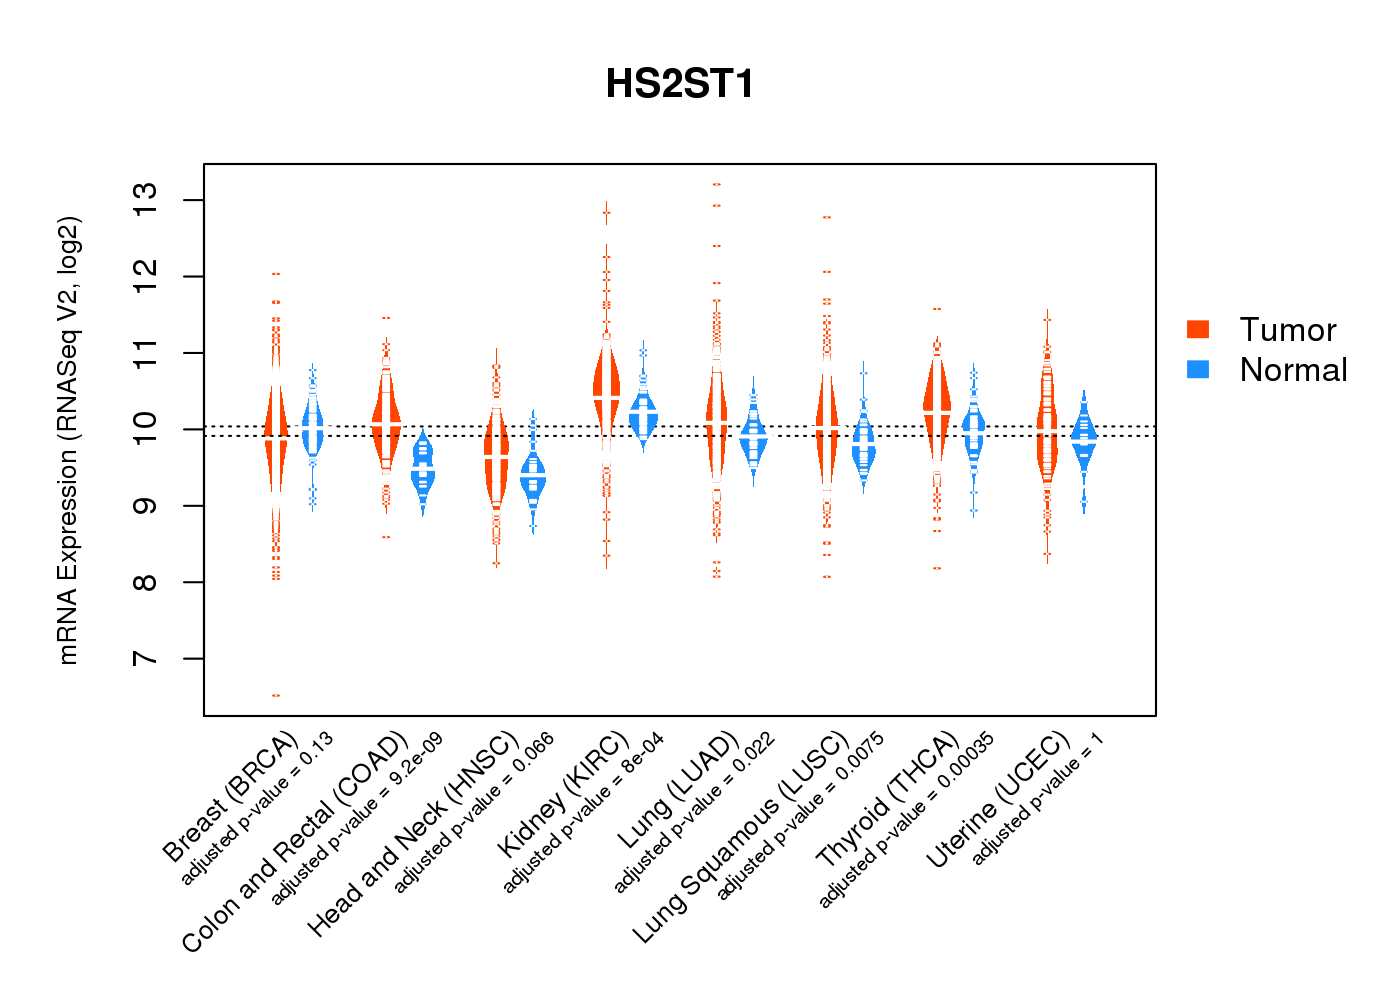
| Gene Expression for HS2ST1 |
| * CCLE gene expression data were extracted from CCLE_Expression_Entrez_2012-10-18.res: Gene-centric RMA-normalized mRNA expression data. |
 |
| * Normalized gene expression data of RNASeqV2 was extracted from TCGA using R package TCGA-Assembler. The URLs of all public data files on TCGA DCC data server were gathered at Jan-05-2015. Only eight cancer types have enough normal control samples for differential expression analysis. (t test, adjusted p<0.05 (using Benjamini-Hochberg FDR)) |
 |
| Top |
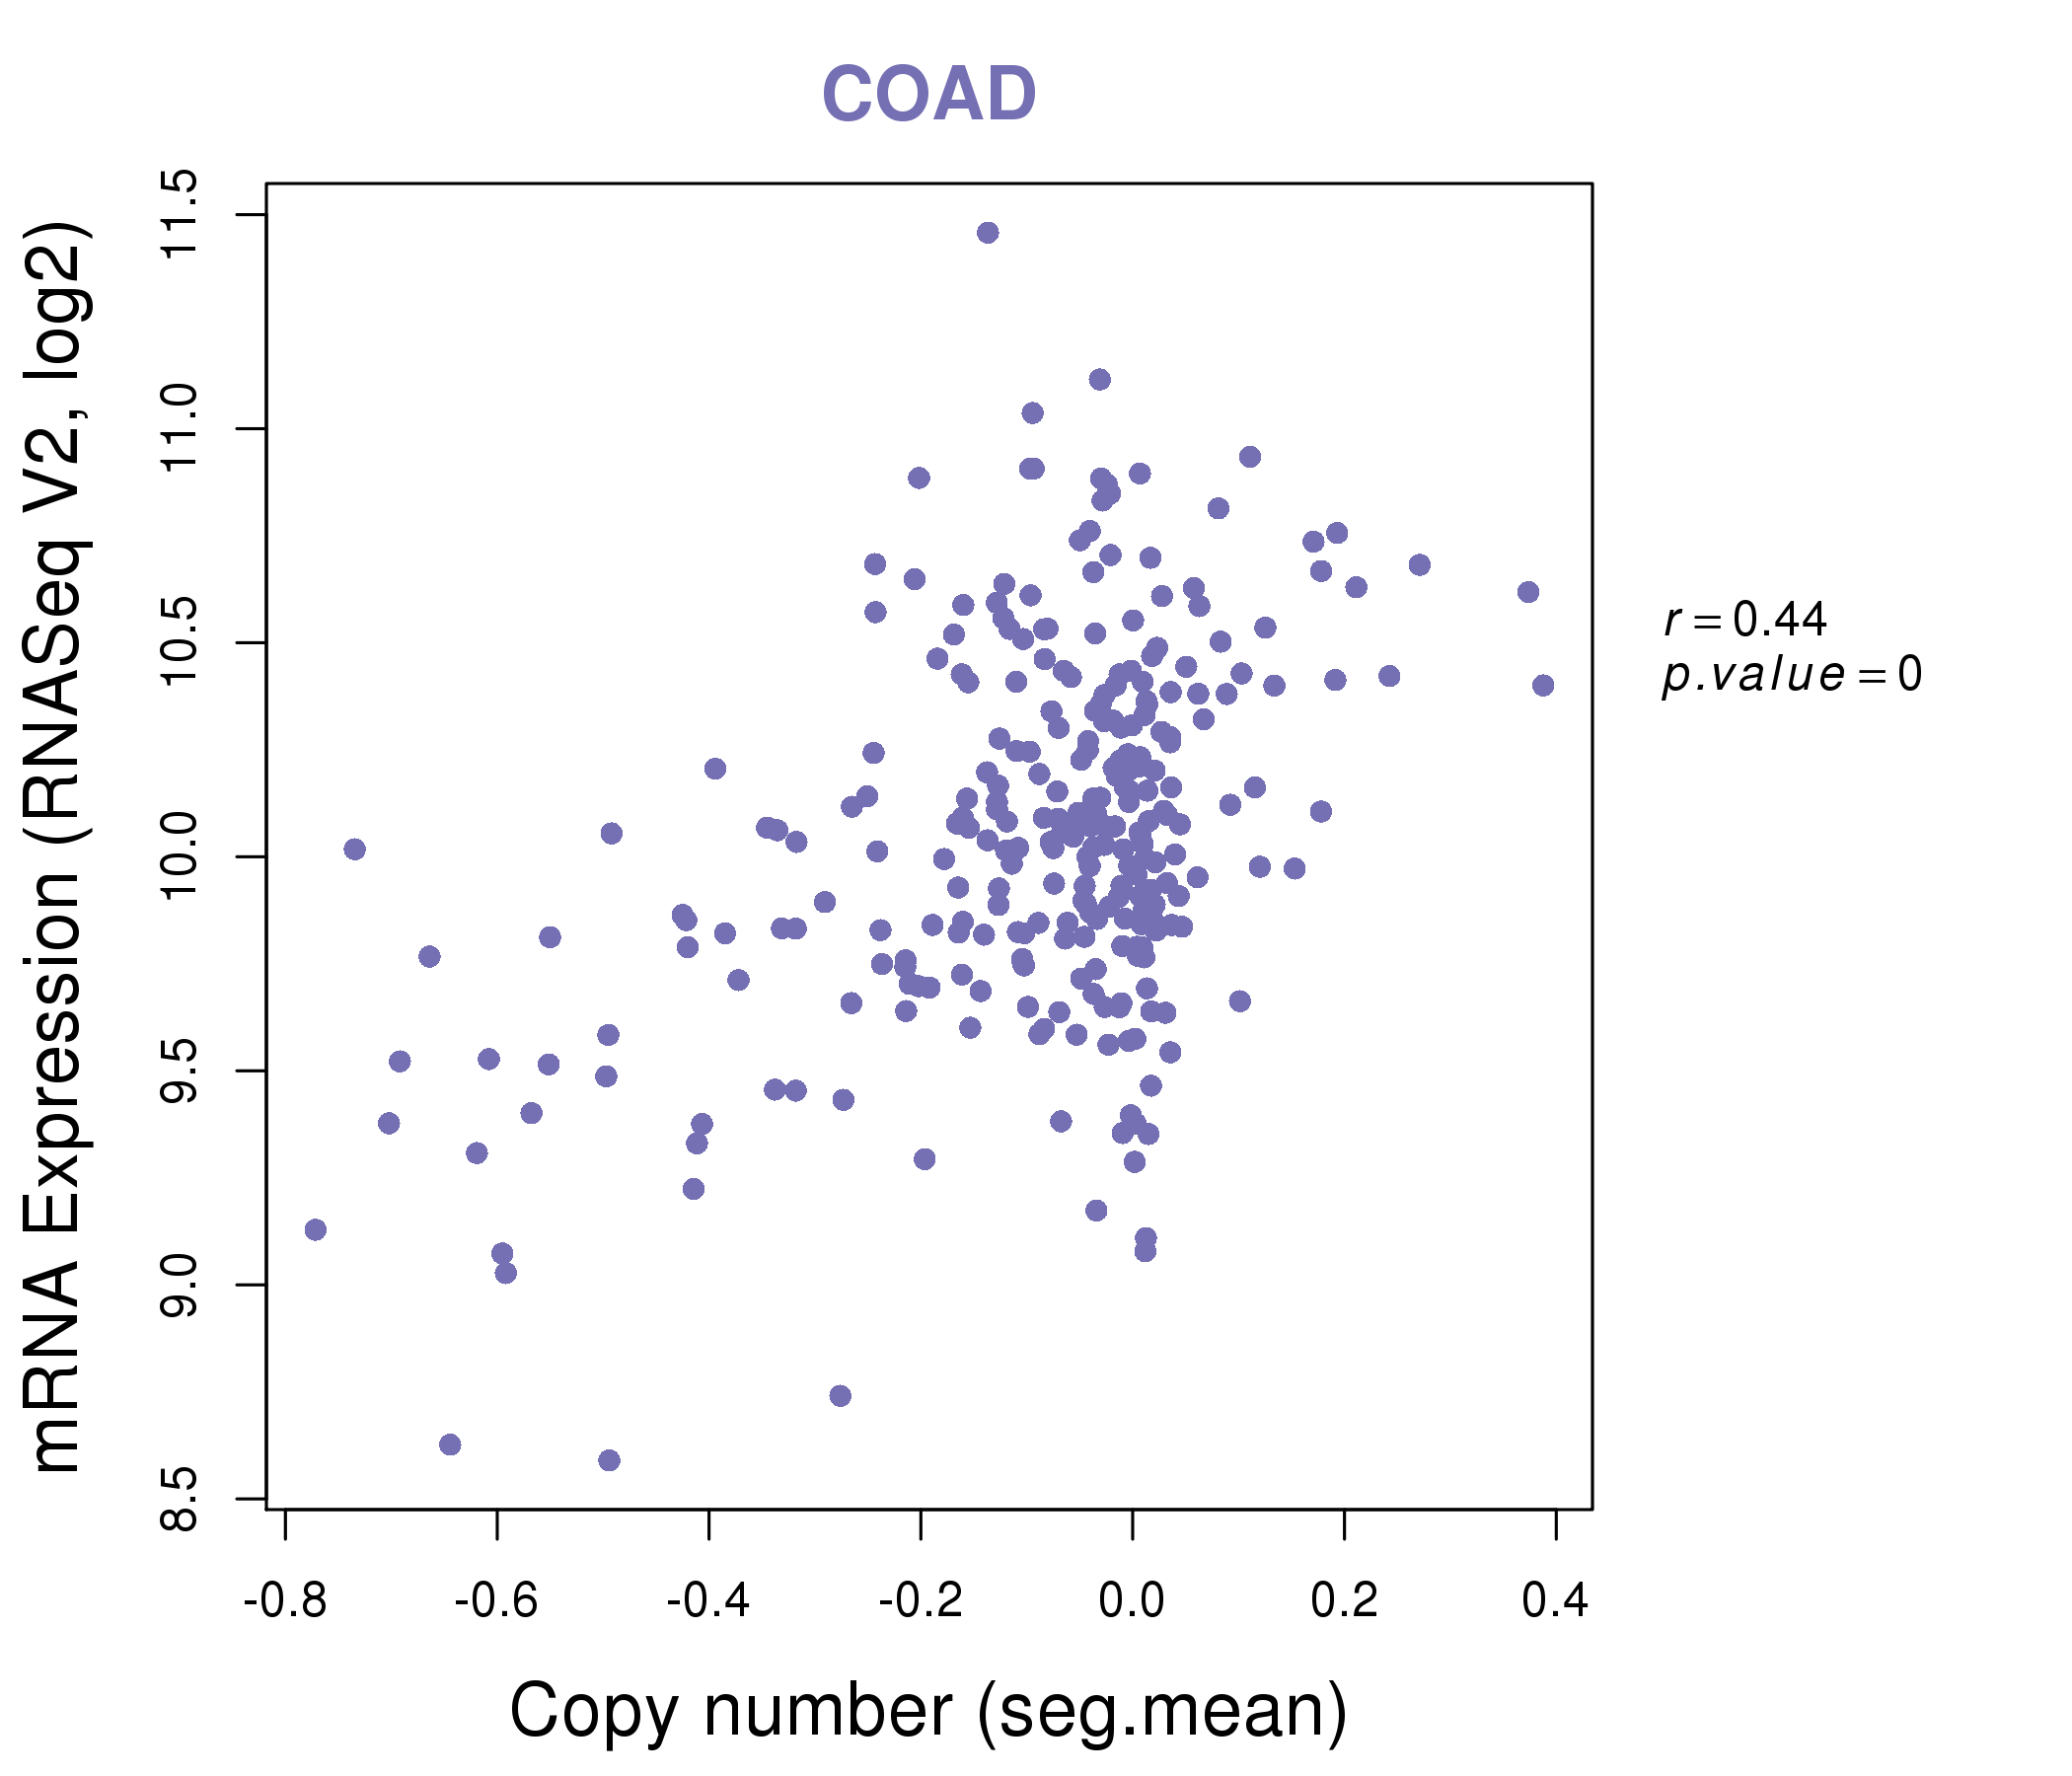
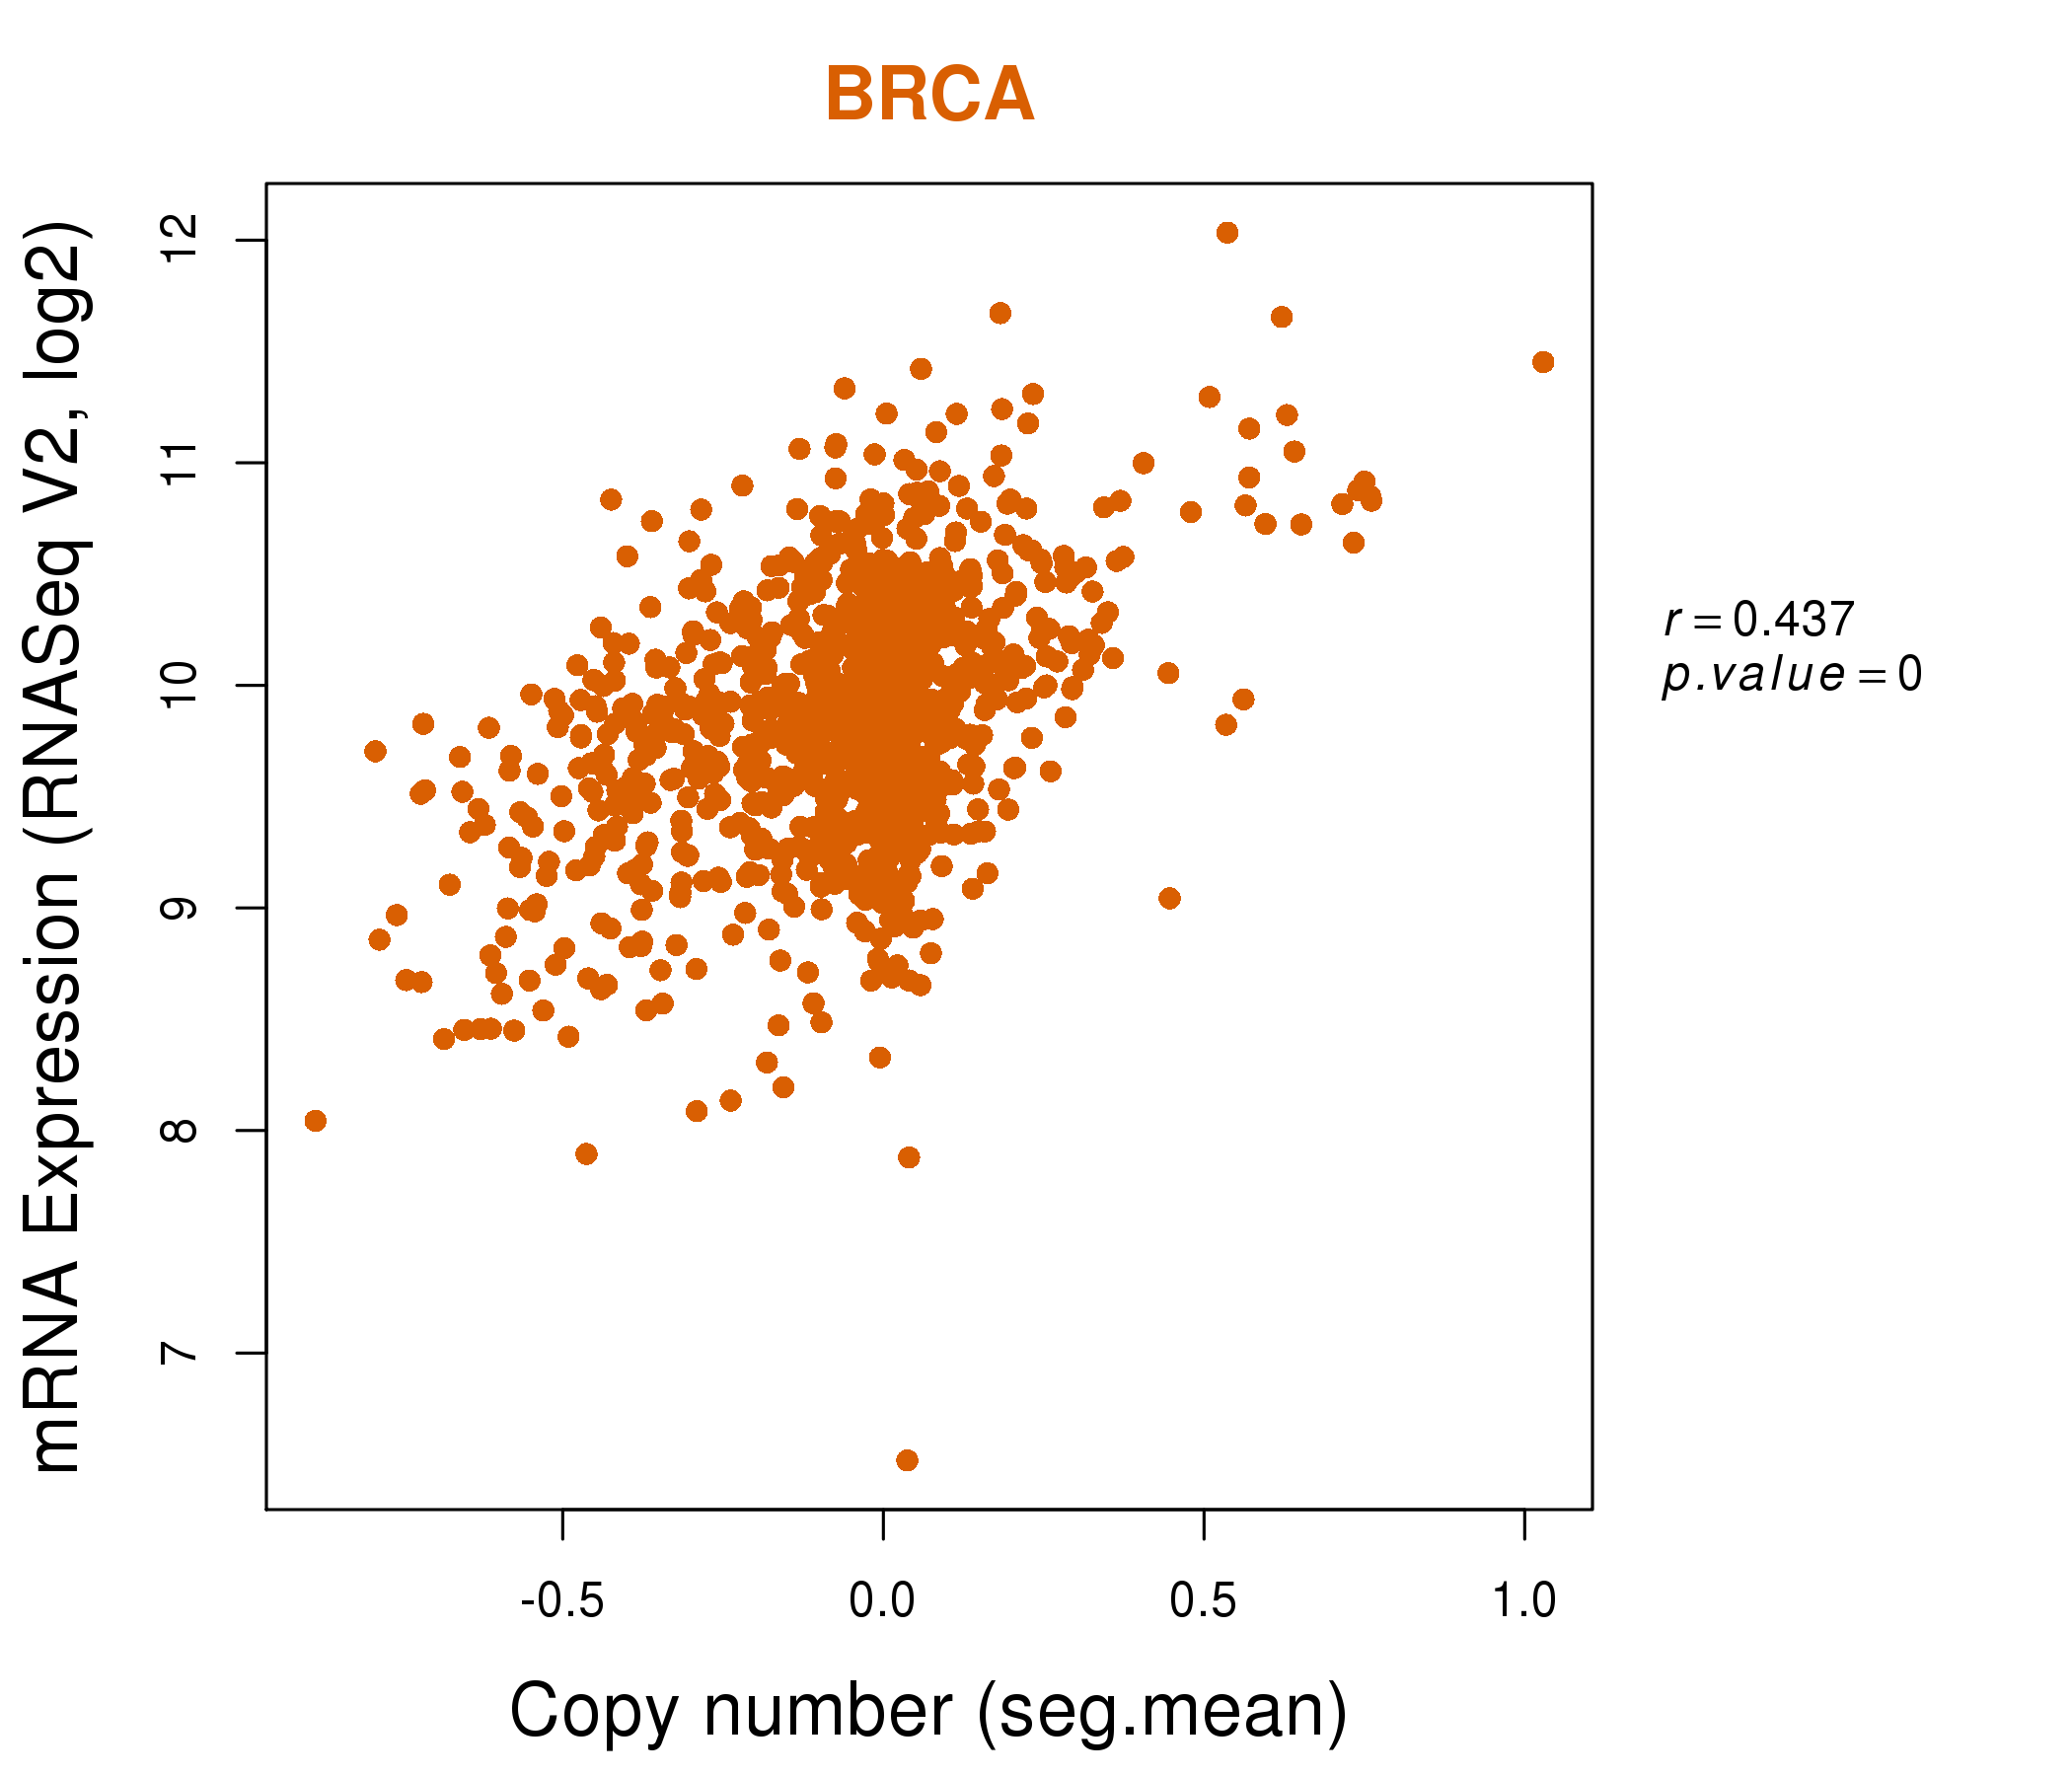
| * This plots show the correlation between CNV and gene expression. |
: Open all plots for all cancer types
 |
|
 |
|

| Top |
| Gene-Gene Network Information |
| * Co-Expression network figures were drawn using R package igraph. Only the top 20 genes with the highest correlations were shown. Red circle: input gene, orange circle: cell metabolism gene, sky circle: other gene |
: Open all plots for all cancer types
 |
|
| ADAM17,ANKRD13C,CTTNBP2NL,DBT,DR1,EVI5,EXTL2, HIAT1,HS2ST1,LRRC40,LRRC8B,PKN2,RBMXL1,ROCK2, RRAGC,SEP15,SH3GLB1,SLC30A7,ZFR,ZNF644,ZYG11B | CREB1,CTDSPL2,FNDC3A,G2E3,HS2ST1,CFAP97,LMBR1, LRRC58,MIB1,PDS5A,PPIP5K2,PRRC1,QSER1,SENP1, SLC39A10,SMARCAD1,SMC2,SUZ12,TMTC3,UBXN4,ZNF148 |
 |
|
| ARL15,CSDE1,EDNRA,FNBP1L,GLCE,HIAT1,HOOK1, HS2ST1,MTF2,NRAS,PIGK,SCARB2,SH3GLB1,SSX2IP, ST13,STAU2,TMED5,TRIM33,ZNF644,ZNHIT6,ZZZ3 | ADNP,APPL1,ARID1B,NDNF,CAPN7,CNOT6L,CPD, DENND4C,FAM73A,HS2ST1,MIA3,PGAP1,POFUT1,PTENP1, PTK2,RAD50,ST18,TCF12,TNKS,ZNF318,ZNF395 |


| * Co-Expression network figures were drawn using R package igraph. Only the top 20 genes with the highest correlations were shown. Red circle: input gene, orange circle: cell metabolism gene, sky circle: other gene |
: Open all plots for all cancer types
| Top |
: Open all interacting genes' information including KEGG pathway for all interacting genes from DAVID
| Top |
| Pharmacological Information for HS2ST1 |
| There's no related Drug. |
| Top |
| Cross referenced IDs for HS2ST1 |
| * We obtained these cross-references from Uniprot database. It covers 150 different DBs, 18 categories. http://www.uniprot.org/help/cross_references_section |
: Open all cross reference information
|
Copyright © 2016-Present - The Univsersity of Texas Health Science Center at Houston @ |