|
||||||||||||||||||||||||||||||||||||||||||||||||||||||||||||||||||||||||||||||||||||||||||||||||||||||||||||||||||||||||||||||||||||||||||||||||||||||||||||||||||||||||||||||||||||||||||||||||||||||||||||||||||||||||||||||||||||||||||||||||||||||||||||||||||||||||||||||||||||||||||||||||||||||||||||||||||||||||||
| |
| Phenotypic Information (metabolism pathway, cancer, disease, phenome) |
| |
| |
| Gene-Gene Network Information: Co-Expression Network, Interacting Genes & KEGG |
| |
|


| Gene Summary for MLEC |
| Basic gene info. | Gene symbol | MLEC |
| Gene name | malectin | |
| Synonyms | KIAA0152 | |
| Cytomap | UCSC genome browser: 12q24.31 | |
| Genomic location | chr12 :121124948-121139667 | |
| Type of gene | protein-coding | |
| RefGenes | NM_014730.2, | |
| Ensembl id | ENSG00000110917 | |
| Description | oligosaccharyltransferase complex subunit (non-catalytic) | |
| Modification date | 20141207 | |
| dbXrefs | MIM : 613802 | |
| HGNC : HGNC | ||
| Ensembl : ENSG00000110917 | ||
| HPRD : 13781 | ||
| Vega : OTTHUMG00000169187 | ||
| Protein | UniProt: go to UniProt's Cross Reference DB Table | |
| Expression | CleanEX: HS_MLEC | |
| BioGPS: 9761 | ||
| Gene Expression Atlas: ENSG00000110917 | ||
| The Human Protein Atlas: ENSG00000110917 | ||
| Pathway | NCI Pathway Interaction Database: MLEC | |
| KEGG: MLEC | ||
| REACTOME: MLEC | ||
| ConsensusPathDB | ||
| Pathway Commons: MLEC | ||
| Metabolism | MetaCyc: MLEC | |
| HUMANCyc: MLEC | ||
| Regulation | Ensembl's Regulation: ENSG00000110917 | |
| miRBase: chr12 :121,124,948-121,139,667 | ||
| TargetScan: NM_014730 | ||
| cisRED: ENSG00000110917 | ||
| Context | iHOP: MLEC | |
| cancer metabolism search in PubMed: MLEC | ||
| UCL Cancer Institute: MLEC | ||
| Assigned class in ccmGDB | C | |
| Top |
| Phenotypic Information for MLEC(metabolism pathway, cancer, disease, phenome) |
| Cancer | CGAP: MLEC |
| Familial Cancer Database: MLEC | |
| * This gene is included in those cancer gene databases. |
|
|
|
|
|
| . | ||||||||||||||||||||||||||||||||||||||||||||||||||||||||||||||||||||||||||||||||||||||||||||||||||||||||||||||||||||||||||||||||||||||||||||||||||||||||||||||||||||||||||||||||||||||||||||||||||||||||||||||||||||||||||||||||||||||||||||||||||||||||||||||||||||||||||||||||||||||||||||||||||||||||||||||||||||
Oncogene 1 | Significant driver gene in | |||||||||||||||||||||||||||||||||||||||||||||||||||||||||||||||||||||||||||||||||||||||||||||||||||||||||||||||||||||||||||||||||||||||||||||||||||||||||||||||||||||||||||||||||||||||||||||||||||||||||||||||||||||||||||||||||||||||||||||||||||||||||||||||||||||||||||||||||||||||||||||||||||||||||||||||||||||||||
| cf) number; DB name 1 Oncogene; http://nar.oxfordjournals.org/content/35/suppl_1/D721.long, 2 Tumor Suppressor gene; https://bioinfo.uth.edu/TSGene/, 3 Cancer Gene Census; http://www.nature.com/nrc/journal/v4/n3/abs/nrc1299.html, 4 CancerGenes; http://nar.oxfordjournals.org/content/35/suppl_1/D721.long, 5 Network of Cancer Gene; http://ncg.kcl.ac.uk/index.php, 1Therapeutic Vulnerabilities in Cancer; http://cbio.mskcc.org/cancergenomics/statius/ |
| REACTOME_METABOLISM_OF_PROTEINS | |
| OMIM | |
| Orphanet | |
| Disease | KEGG Disease: MLEC |
| MedGen: MLEC (Human Medical Genetics with Condition) | |
| ClinVar: MLEC | |
| Phenotype | MGI: MLEC (International Mouse Phenotyping Consortium) |
| PhenomicDB: MLEC | |
| Mutations for MLEC |
| * Under tables are showing count per each tissue to give us broad intuition about tissue specific mutation patterns.You can go to the detailed page for each mutation database's web site. |
| There's no structural variation information in COSMIC data for this gene. |
| * From mRNA Sanger sequences, Chitars2.0 arranged chimeric transcripts. This table shows MLEC related fusion information. |
| ID | Head Gene | Tail Gene | Accession | Gene_a | qStart_a | qEnd_a | Chromosome_a | tStart_a | tEnd_a | Gene_a | qStart_a | qEnd_a | Chromosome_a | tStart_a | tEnd_a |
| AI632281 | TERF1 | 1 | 61 | 8 | 73958605 | 73958665 | MLEC | 52 | 386 | 12 | 121135317 | 121135651 | |
| BE550278 | TERF1 | 1 | 61 | 8 | 73958605 | 73958665 | MLEC | 52 | 385 | 12 | 121135317 | 121135651 | |
| AI656269 | TERF1 | 1 | 61 | 8 | 73958605 | 73958665 | MLEC | 52 | 385 | 12 | 121135317 | 121135651 | |
| AI962170 | TERF1 | 1 | 61 | 8 | 73958605 | 73958665 | MLEC | 52 | 386 | 12 | 121135317 | 121135651 | |
| BE501371 | TERF1 | 1 | 61 | 8 | 73958605 | 73958665 | MLEC | 52 | 385 | 12 | 121135317 | 121135651 | |
| BG955818 | MUC5B | 11 | 210 | 11 | 1271330 | 1271533 | MLEC | 202 | 403 | 12 | 121139214 | 121139415 | |
| AI825089 | TERF1 | 1 | 61 | 8 | 73958605 | 73958665 | MLEC | 52 | 290 | 12 | 121135412 | 121135651 | |
| AA243990 | MLEC | 8 | 158 | 12 | 121139379 | 121139529 | MLEC | 157 | 450 | 12 | 121139070 | 121139364 | |
| BF806090 | MLEC | 8 | 292 | 12 | 121125681 | 121125966 | MAGI1 | 287 | 553 | 3 | 65720244 | 65720510 | |
| AA244053 | MLEC | 1 | 383 | 12 | 121138982 | 121139364 | MLEC | 382 | 493 | 12 | 121139418 | 121139529 | |
| BE930957 | MOB3B | 35 | 136 | 9 | 27393376 | 27393478 | MLEC | 129 | 470 | 12 | 121134483 | 121134823 | |
| AI651406 | TXNDC9 | 1 | 351 | 2 | 99953945 | 99977642 | MLEC | 346 | 374 | 12 | 121137167 | 121137195 | |
| Top |
| Mutation type/ Tissue ID | brca | cns | cerv | endome | haematopo | kidn | Lintest | liver | lung | ns | ovary | pancre | prost | skin | stoma | thyro | urina | |||
| Total # sample | 1 | |||||||||||||||||||
| GAIN (# sample) | 1 | |||||||||||||||||||
| LOSS (# sample) |
| cf) Tissue ID; Tissue type (1; Breast, 2; Central_nervous_system, 3; Cervix, 4; Endometrium, 5; Haematopoietic_and_lymphoid_tissue, 6; Kidney, 7; Large_intestine, 8; Liver, 9; Lung, 10; NS, 11; Ovary, 12; Pancreas, 13; Prostate, 14; Skin, 15; Stomach, 16; Thyroid, 17; Urinary_tract) |
| Top |
|
 |
| Top |
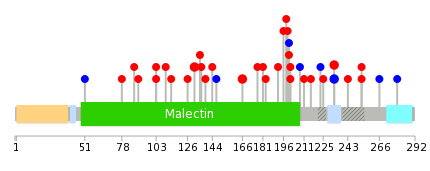
| Stat. for Non-Synonymous SNVs (# total SNVs=28) | (# total SNVs=7) |
 | 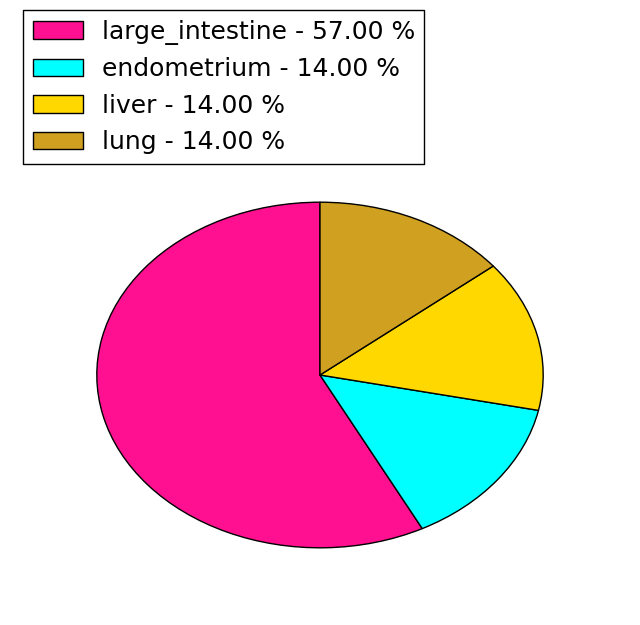 |
(# total SNVs=2) | (# total SNVs=0) |
 |
| Top |
| * When you move the cursor on each content, you can see more deailed mutation information on the Tooltip. Those are primary_site,primary_histology,mutation(aa),pubmedID. |
| GRCh37 position | Mutation(aa) | Unique sampleID count |
| chr12:121132050-121132050 | p.Y131C | 2 |
| chr12:121134166-121134168 | p.E233delE | 2 |
| chr12:121134168-121134168 | p.E233E | 2 |
| chr12:121132708-121132708 | p.D166N | 2 |
| chr12:121131987-121131987 | p.G110V | 1 |
| chr12:121134267-121134267 | p.S266S | 1 |
| chr12:121132754-121132754 | p.Q181R | 1 |
| chr12:121132937-121132937 | p.M211V | 1 |
| chr12:121131998-121131998 | p.P114S | 1 |
| chr12:121134306-121134306 | p.F279F | 1 |
| Top |
|
 |
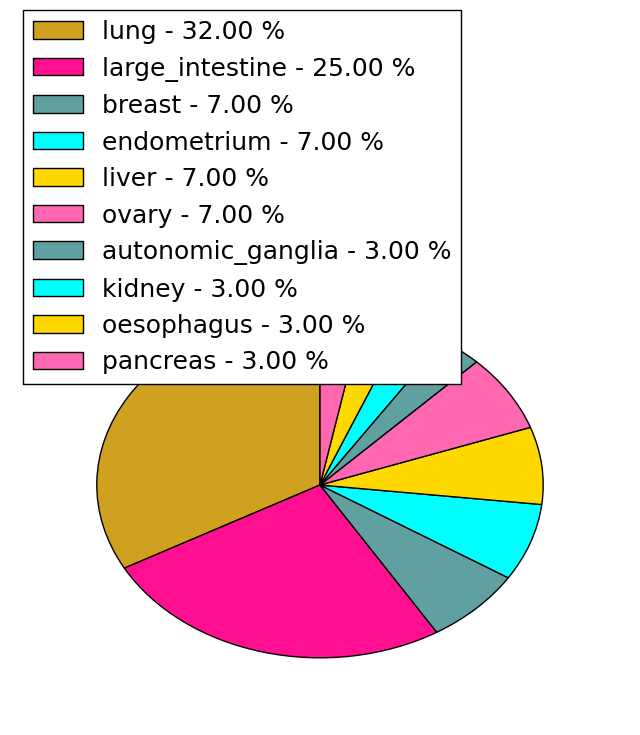
| Point Mutation/ Tissue ID | 1 | 2 | 3 | 4 | 5 | 6 | 7 | 8 | 9 | 10 | 11 | 12 | 13 | 14 | 15 | 16 | 17 | 18 | 19 | 20 |
| # sample | 2 | 1 | 8 | 1 | 1 | 6 | 3 | 1 | 1 | 1 | 2 | 3 | ||||||||
| # mutation | 2 | 1 | 8 | 1 | 1 | 6 | 3 | 1 | 1 | 1 | 2 | 3 | ||||||||
| nonsynonymous SNV | 1 | 1 | 6 | 1 | 1 | 5 | 2 | 1 | 1 | 1 | 1 | 2 | ||||||||
| synonymous SNV | 1 | 2 | 1 | 1 | 1 | 1 |
| cf) Tissue ID; Tissue type (1; BLCA[Bladder Urothelial Carcinoma], 2; BRCA[Breast invasive carcinoma], 3; CESC[Cervical squamous cell carcinoma and endocervical adenocarcinoma], 4; COAD[Colon adenocarcinoma], 5; GBM[Glioblastoma multiforme], 6; Glioma Low Grade, 7; HNSC[Head and Neck squamous cell carcinoma], 8; KICH[Kidney Chromophobe], 9; KIRC[Kidney renal clear cell carcinoma], 10; KIRP[Kidney renal papillary cell carcinoma], 11; LAML[Acute Myeloid Leukemia], 12; LUAD[Lung adenocarcinoma], 13; LUSC[Lung squamous cell carcinoma], 14; OV[Ovarian serous cystadenocarcinoma ], 15; PAAD[Pancreatic adenocarcinoma], 16; PRAD[Prostate adenocarcinoma], 17; SKCM[Skin Cutaneous Melanoma], 18:STAD[Stomach adenocarcinoma], 19:THCA[Thyroid carcinoma], 20:UCEC[Uterine Corpus Endometrial Carcinoma]) |
| Top |
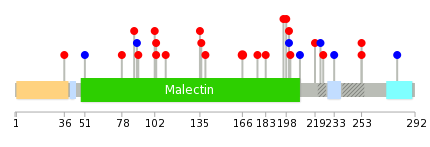
| * We represented just top 10 SNVs. When you move the cursor on each content, you can see more deailed mutation information on the Tooltip. Those are primary_site, primary_histology, mutation(aa), pubmedID. |
| Genomic Position | Mutation(aa) | Unique sampleID count |
| chr12:121132708 | p.D166N | 2 |
| chr12:121131964 | p.G110V | 1 |
| chr12:121132899 | p.E233E | 1 |
| chr12:121134306 | p.S135Y | 1 |
| chr12:121131965 | p.R253W | 1 |
| chr12:121132904 | p.Q136K | 1 |
| chr12:121131966 | p.R253P | 1 |
| chr12:121132906 | p.V139L | 1 |
| chr12:121131987 | p.F279F | 1 |
| chr12:121132908 | p.K177T | 1 |
| * Copy number data were extracted from TCGA using R package TCGA-Assembler. The URLs of all public data files on TCGA DCC data server were gathered on Jan-05-2015. Function ProcessCNAData in TCGA-Assembler package was used to obtain gene-level copy number value which is calculated as the average copy number of the genomic region of a gene. |
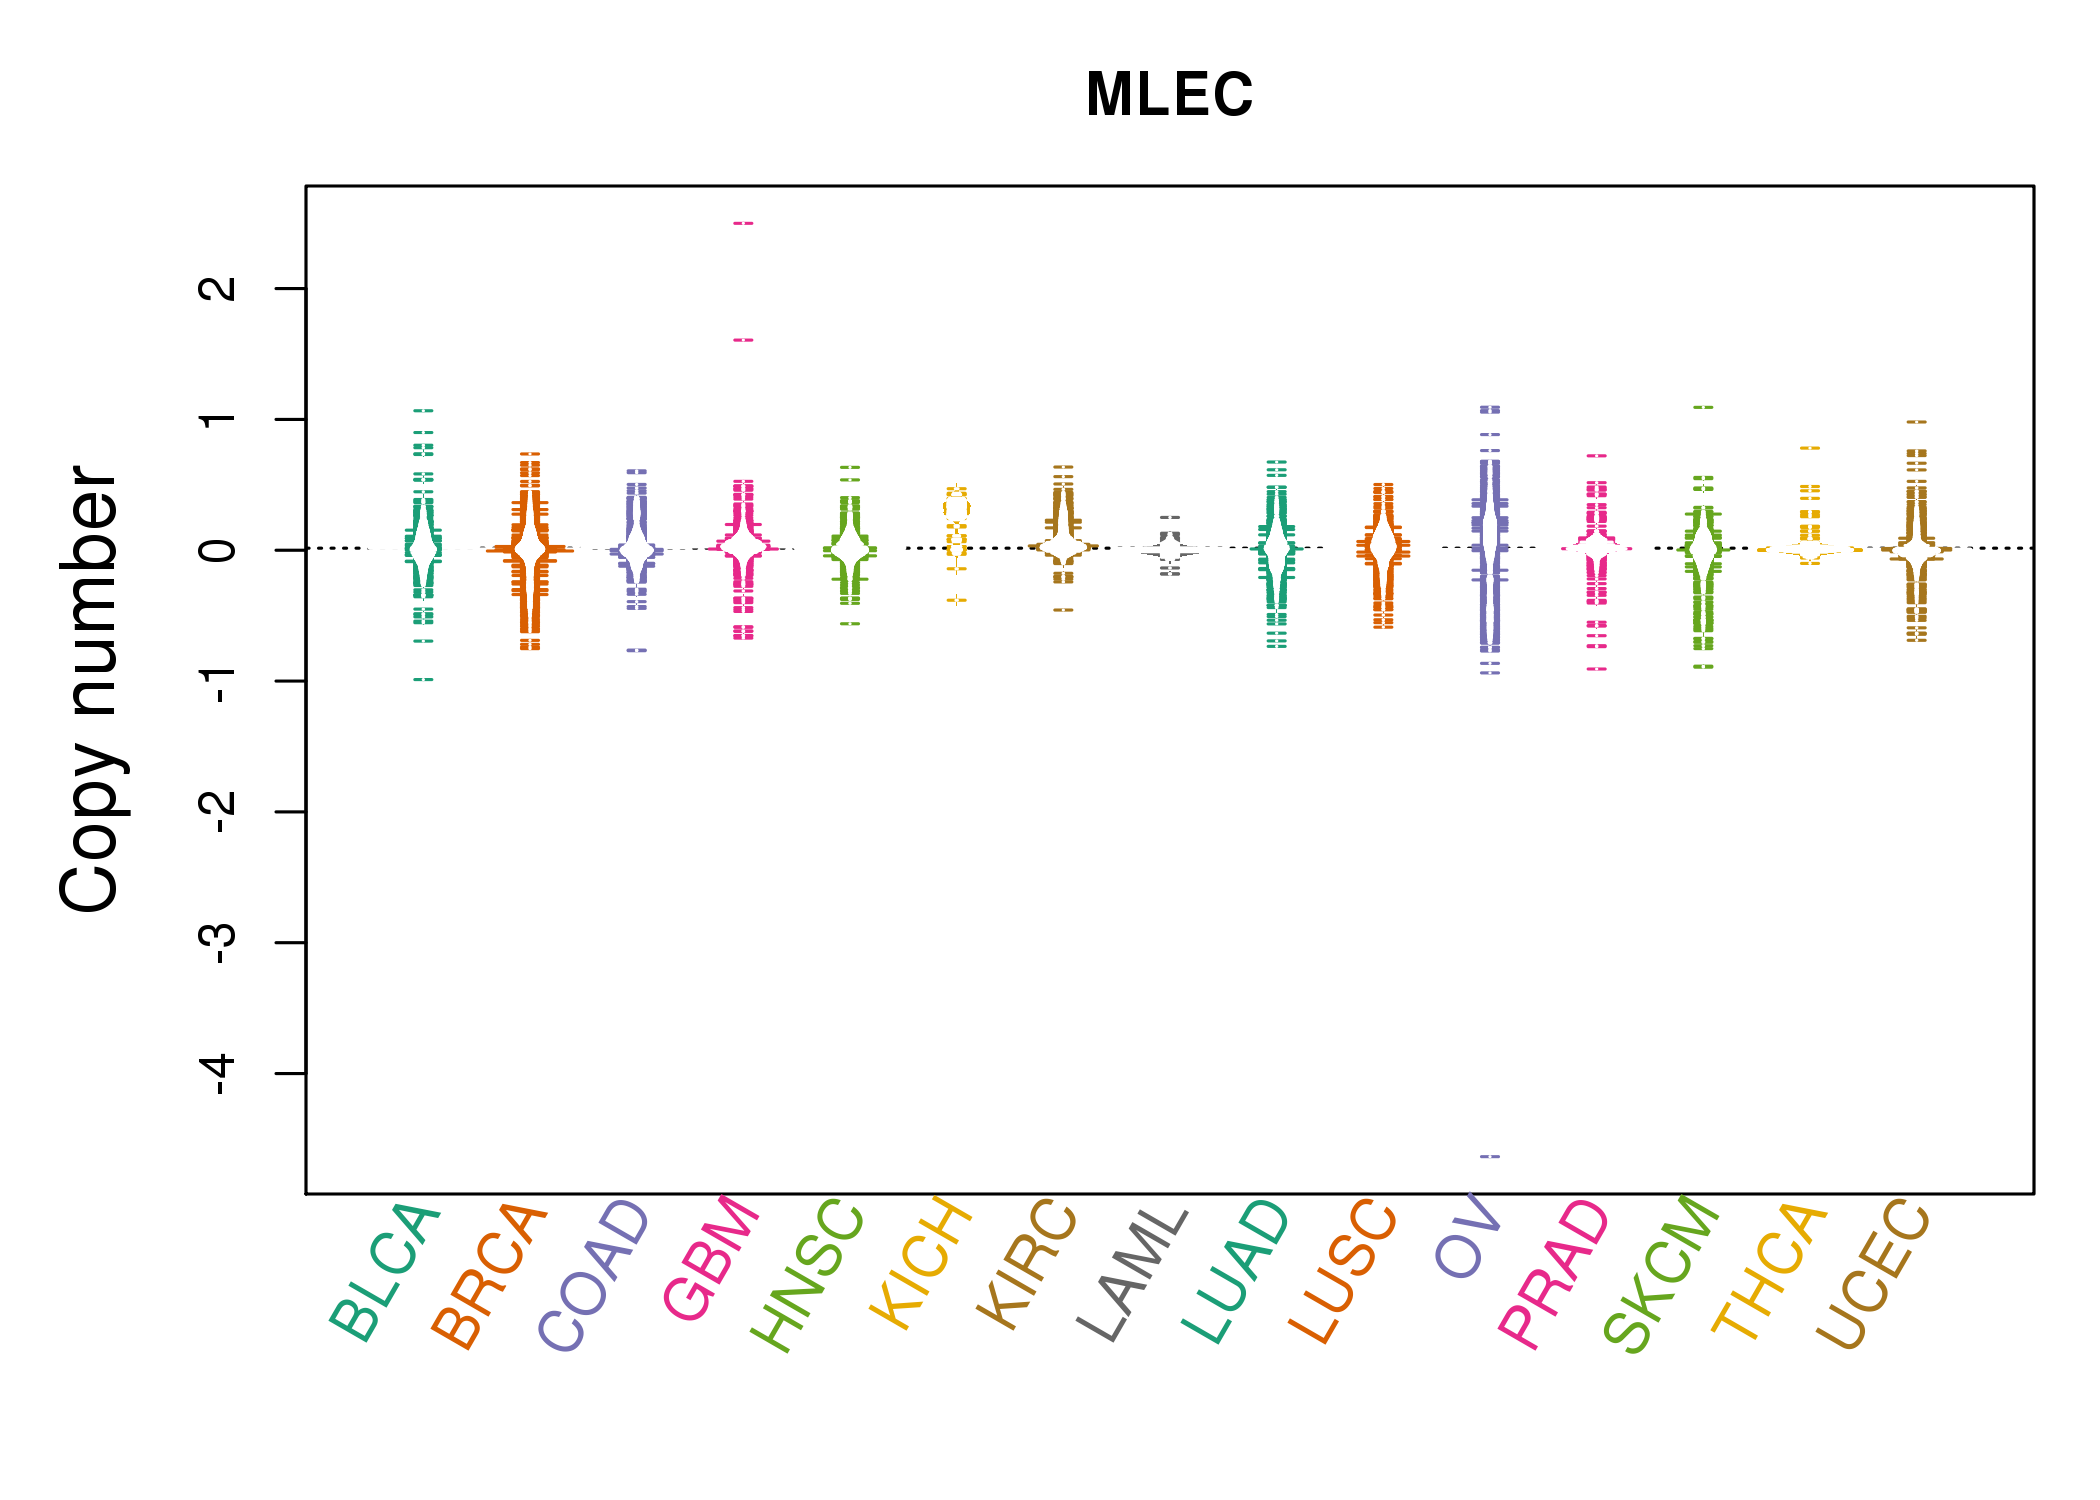 |
| cf) Tissue ID[Tissue type]: BLCA[Bladder Urothelial Carcinoma], BRCA[Breast invasive carcinoma], CESC[Cervical squamous cell carcinoma and endocervical adenocarcinoma], COAD[Colon adenocarcinoma], GBM[Glioblastoma multiforme], Glioma Low Grade, HNSC[Head and Neck squamous cell carcinoma], KICH[Kidney Chromophobe], KIRC[Kidney renal clear cell carcinoma], KIRP[Kidney renal papillary cell carcinoma], LAML[Acute Myeloid Leukemia], LUAD[Lung adenocarcinoma], LUSC[Lung squamous cell carcinoma], OV[Ovarian serous cystadenocarcinoma ], PAAD[Pancreatic adenocarcinoma], PRAD[Prostate adenocarcinoma], SKCM[Skin Cutaneous Melanoma], STAD[Stomach adenocarcinoma], THCA[Thyroid carcinoma], UCEC[Uterine Corpus Endometrial Carcinoma] |
| Top |
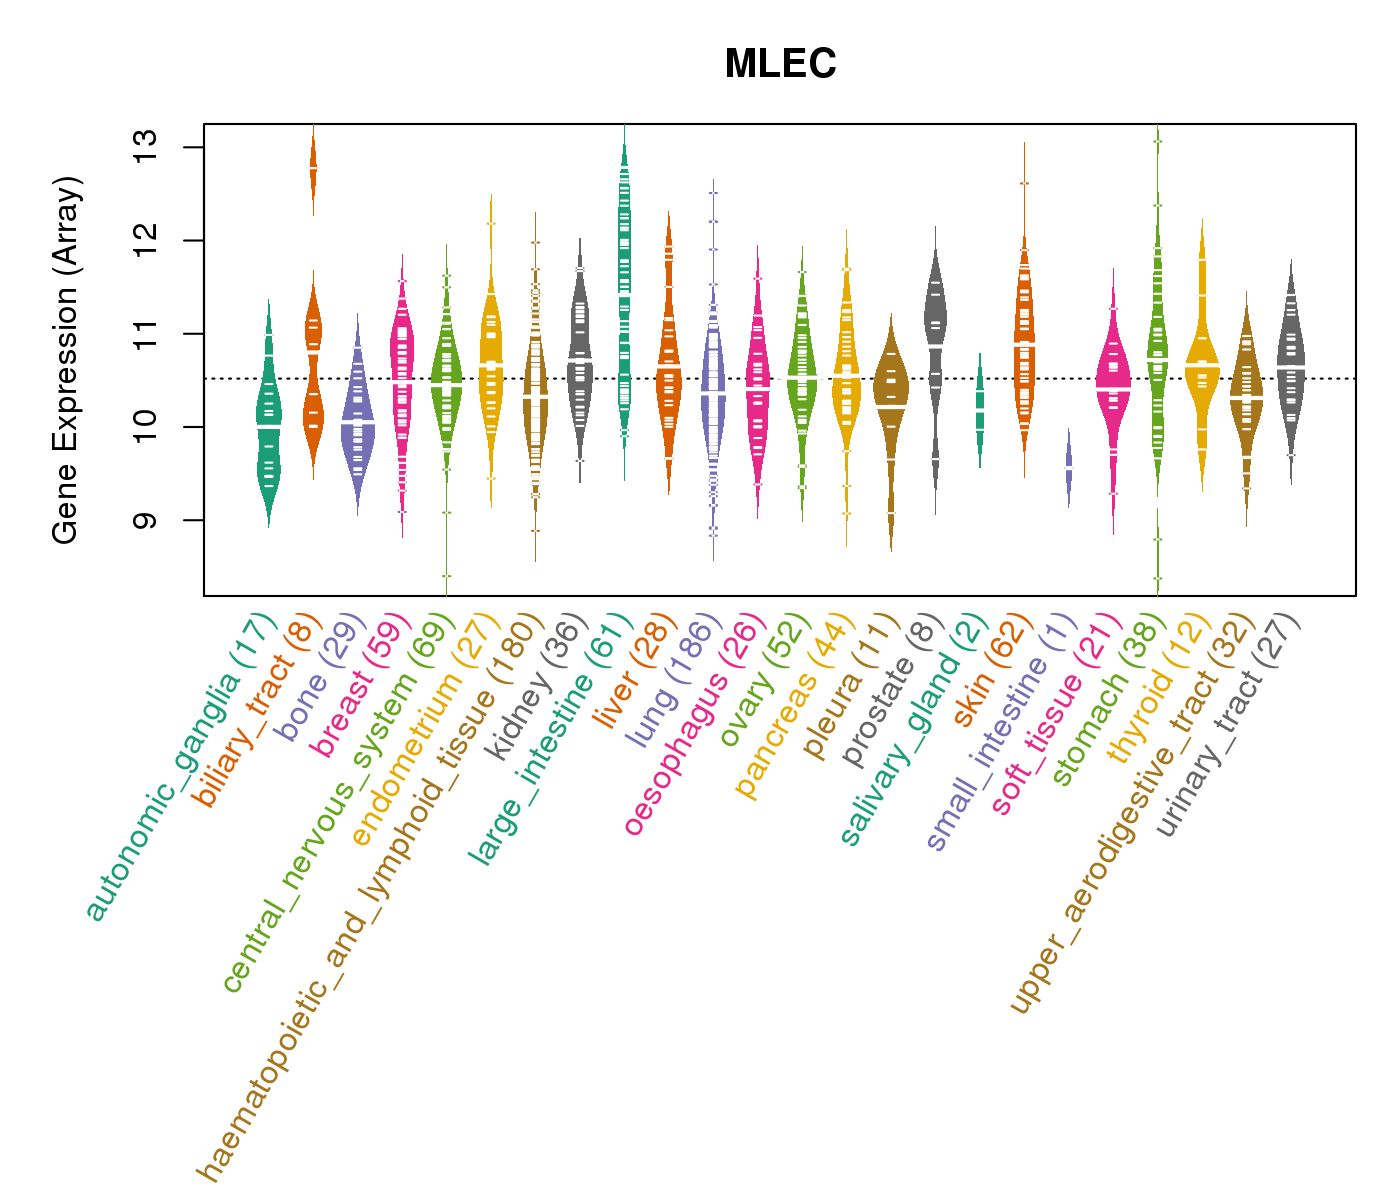
| Gene Expression for MLEC |
| * CCLE gene expression data were extracted from CCLE_Expression_Entrez_2012-10-18.res: Gene-centric RMA-normalized mRNA expression data. |
 |
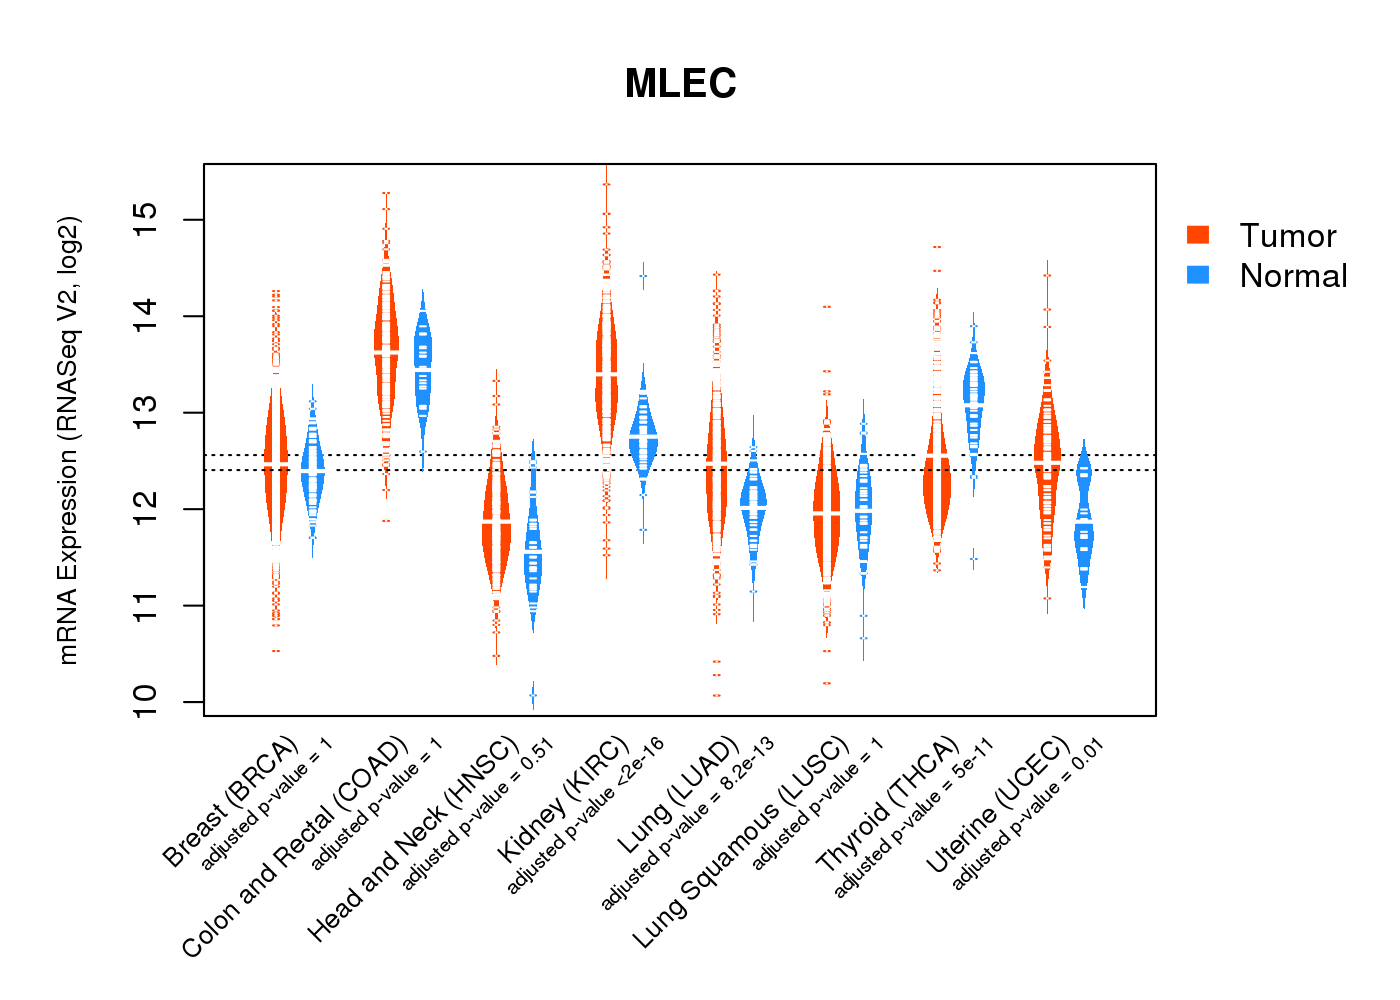
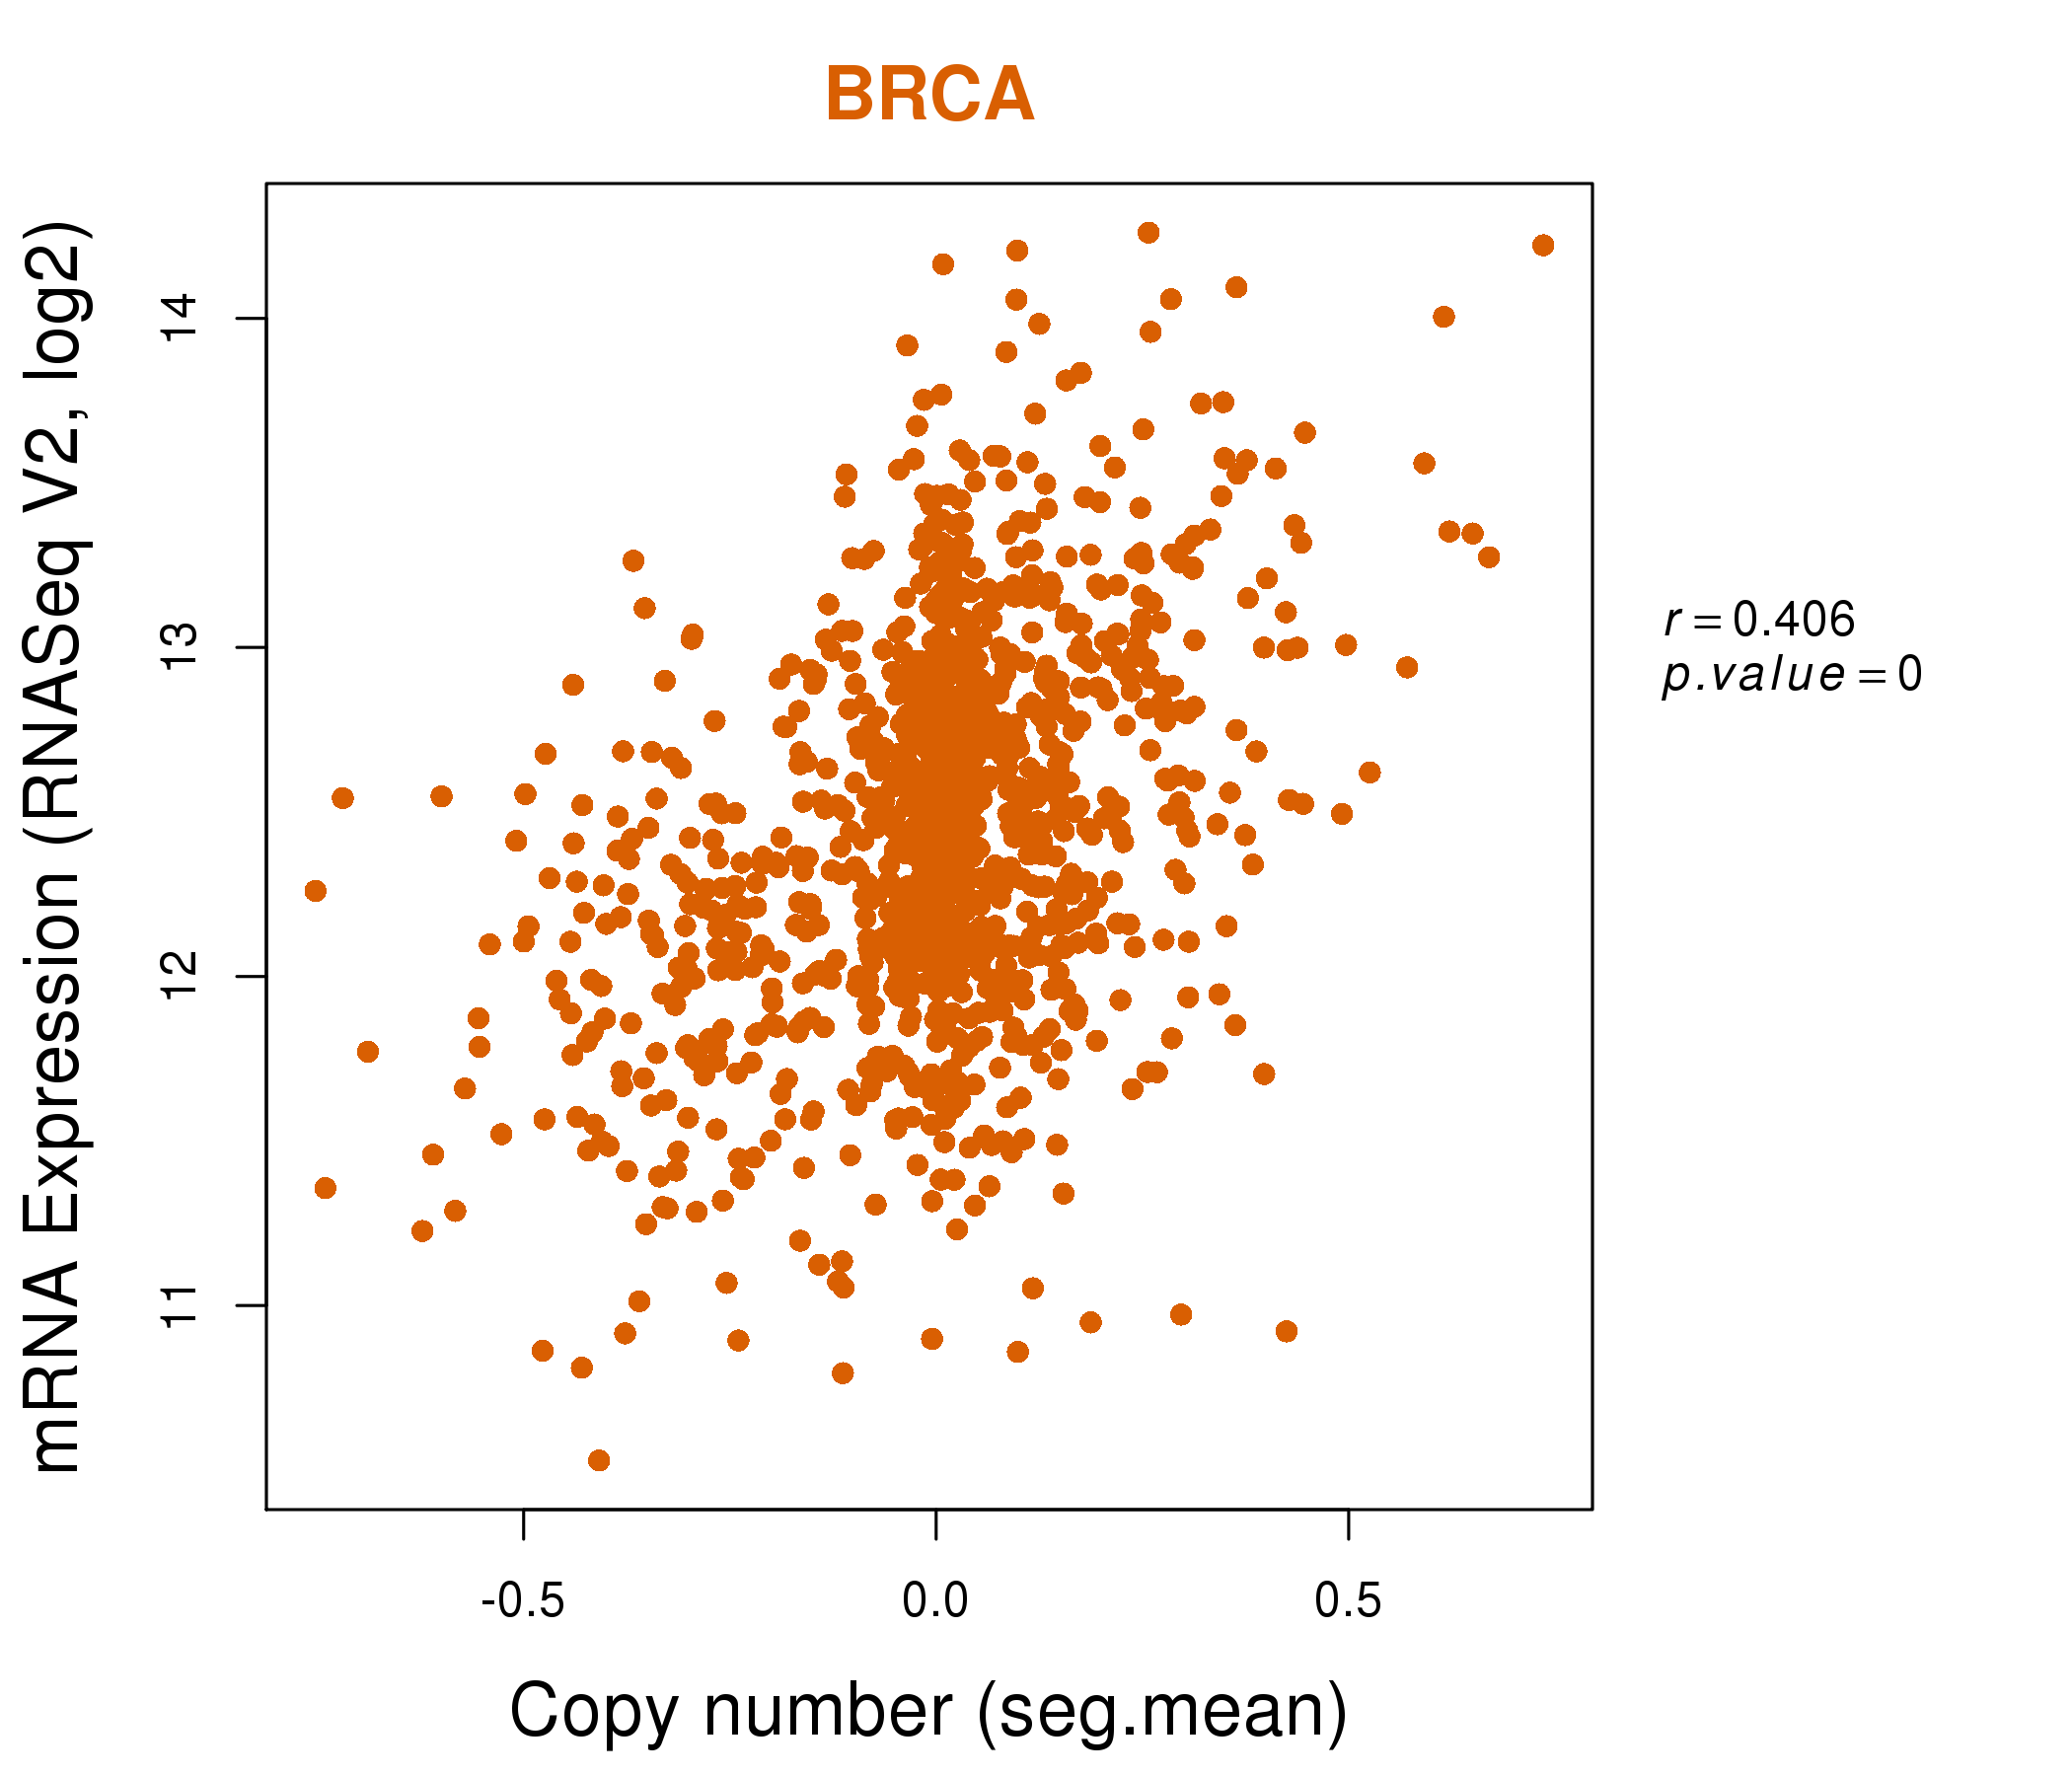
| * Normalized gene expression data of RNASeqV2 was extracted from TCGA using R package TCGA-Assembler. The URLs of all public data files on TCGA DCC data server were gathered at Jan-05-2015. Only eight cancer types have enough normal control samples for differential expression analysis. (t test, adjusted p<0.05 (using Benjamini-Hochberg FDR)) |
 |
| Top |
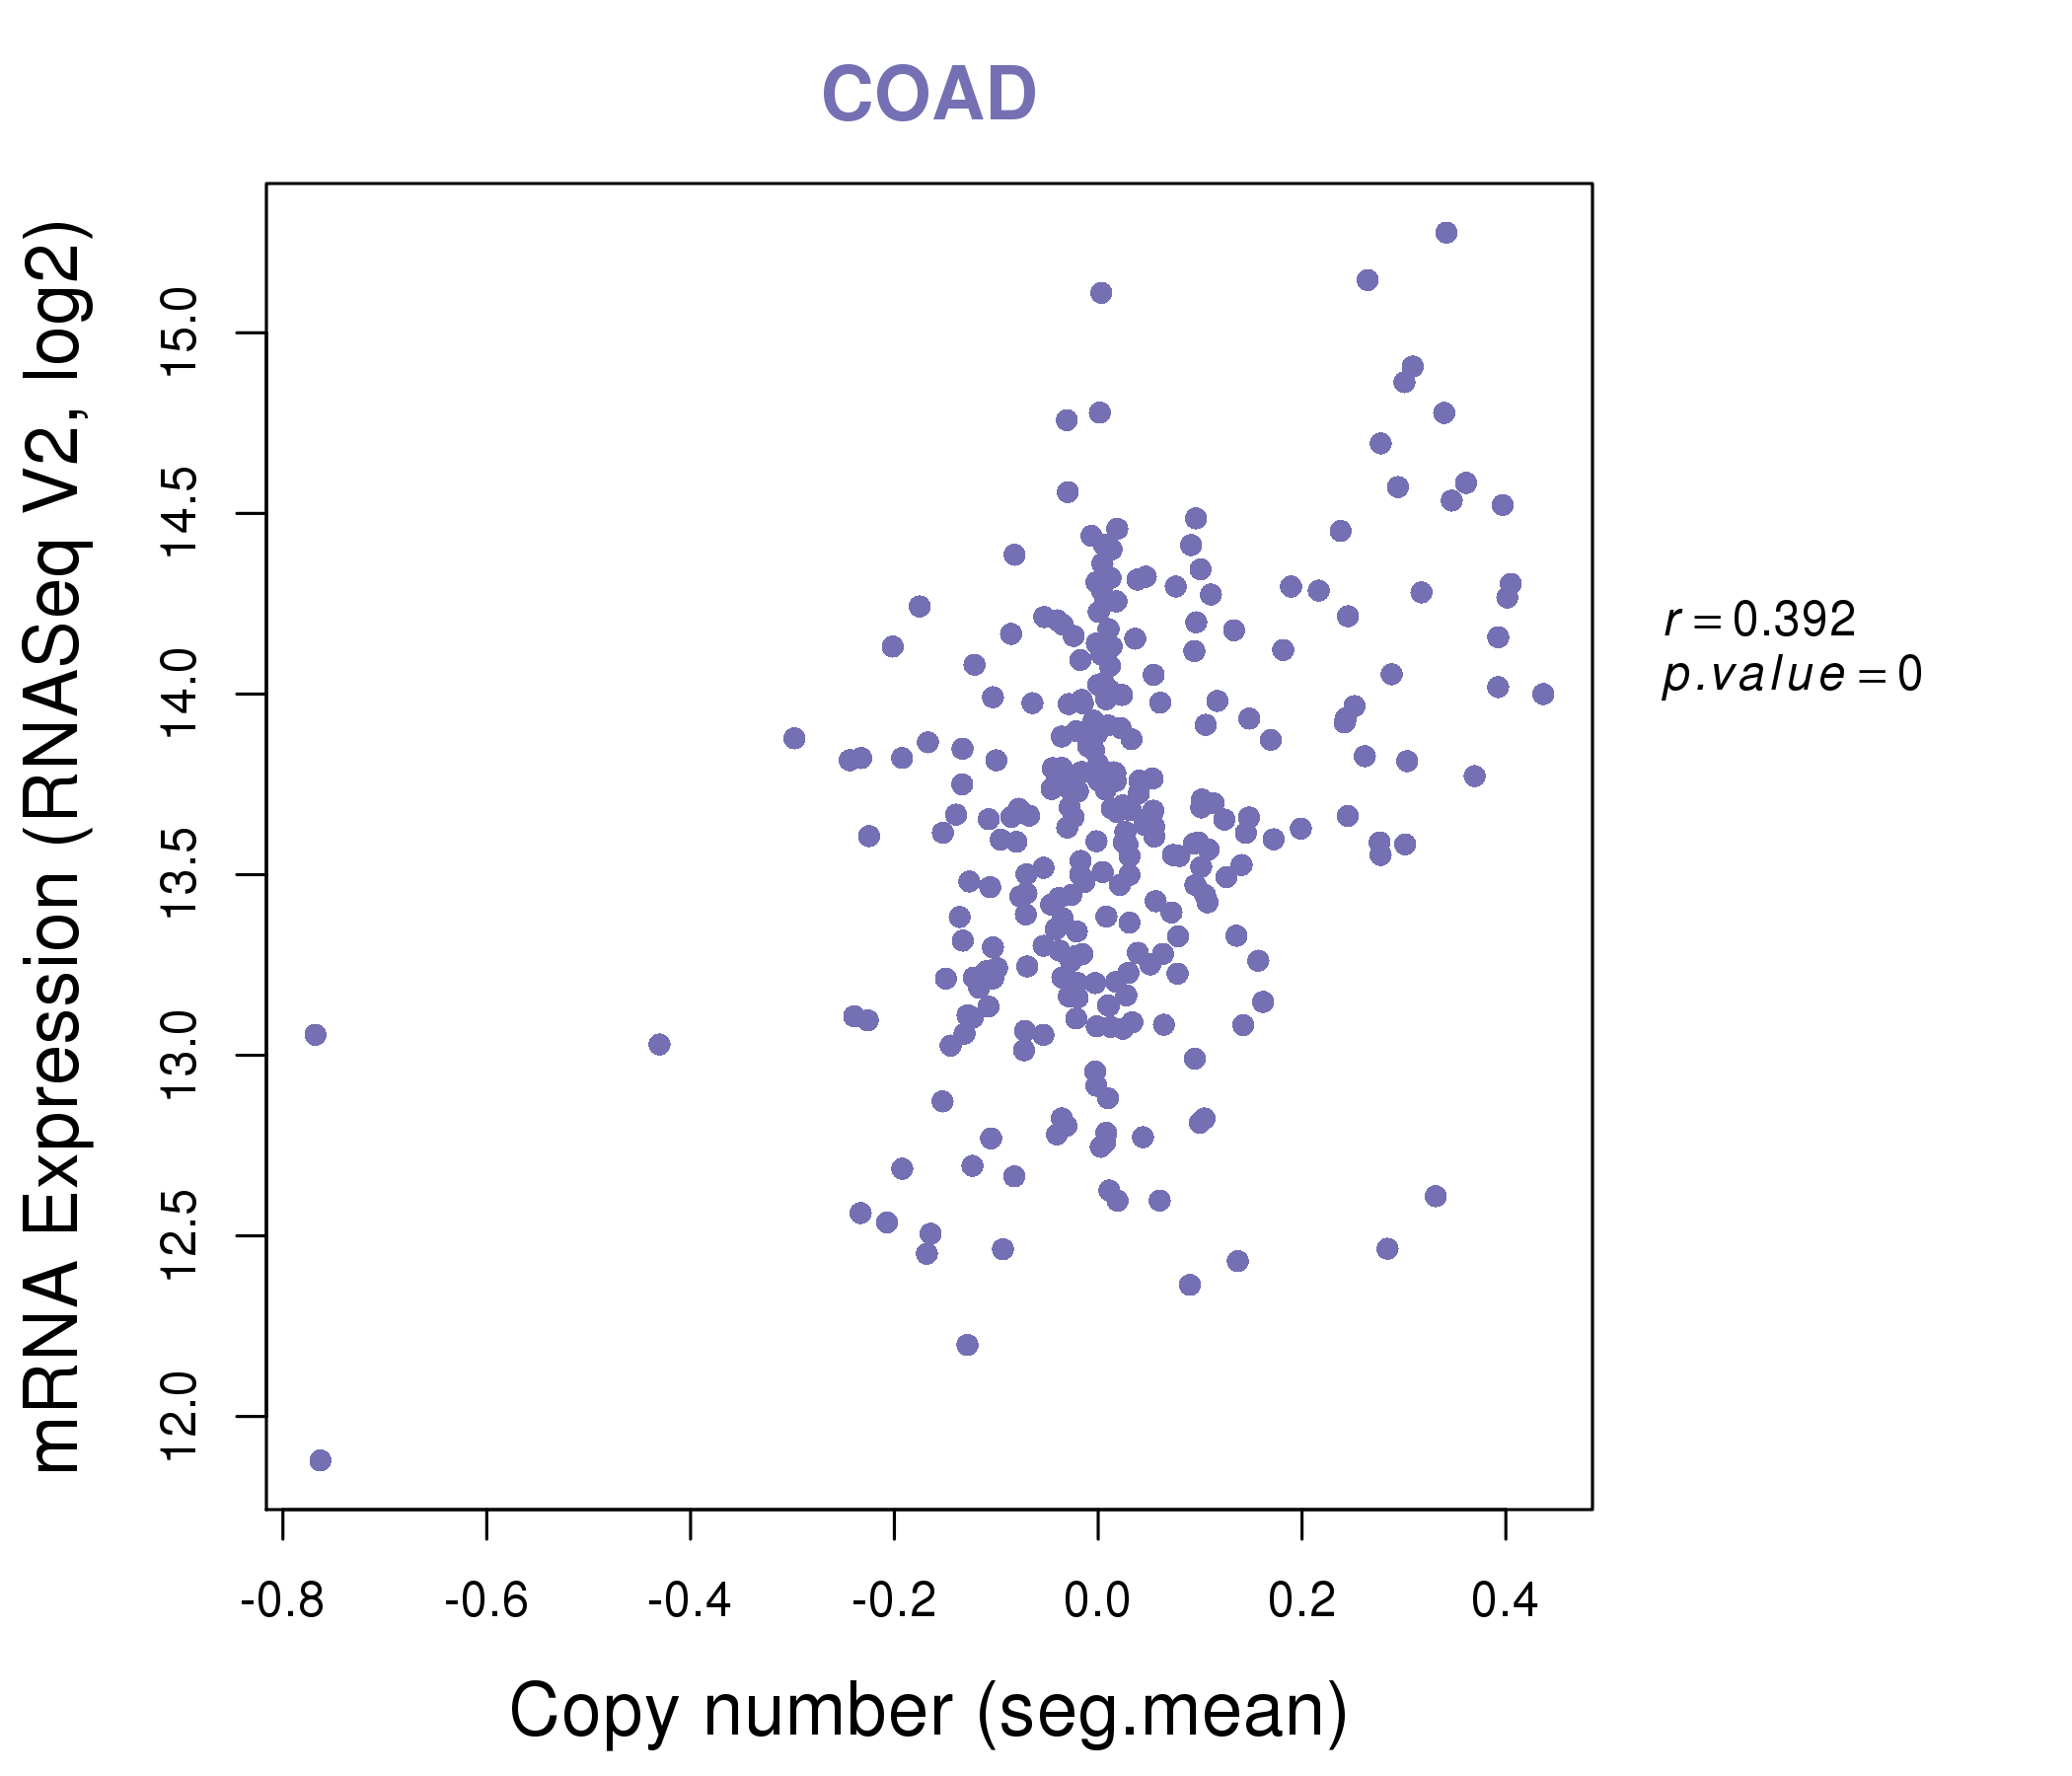
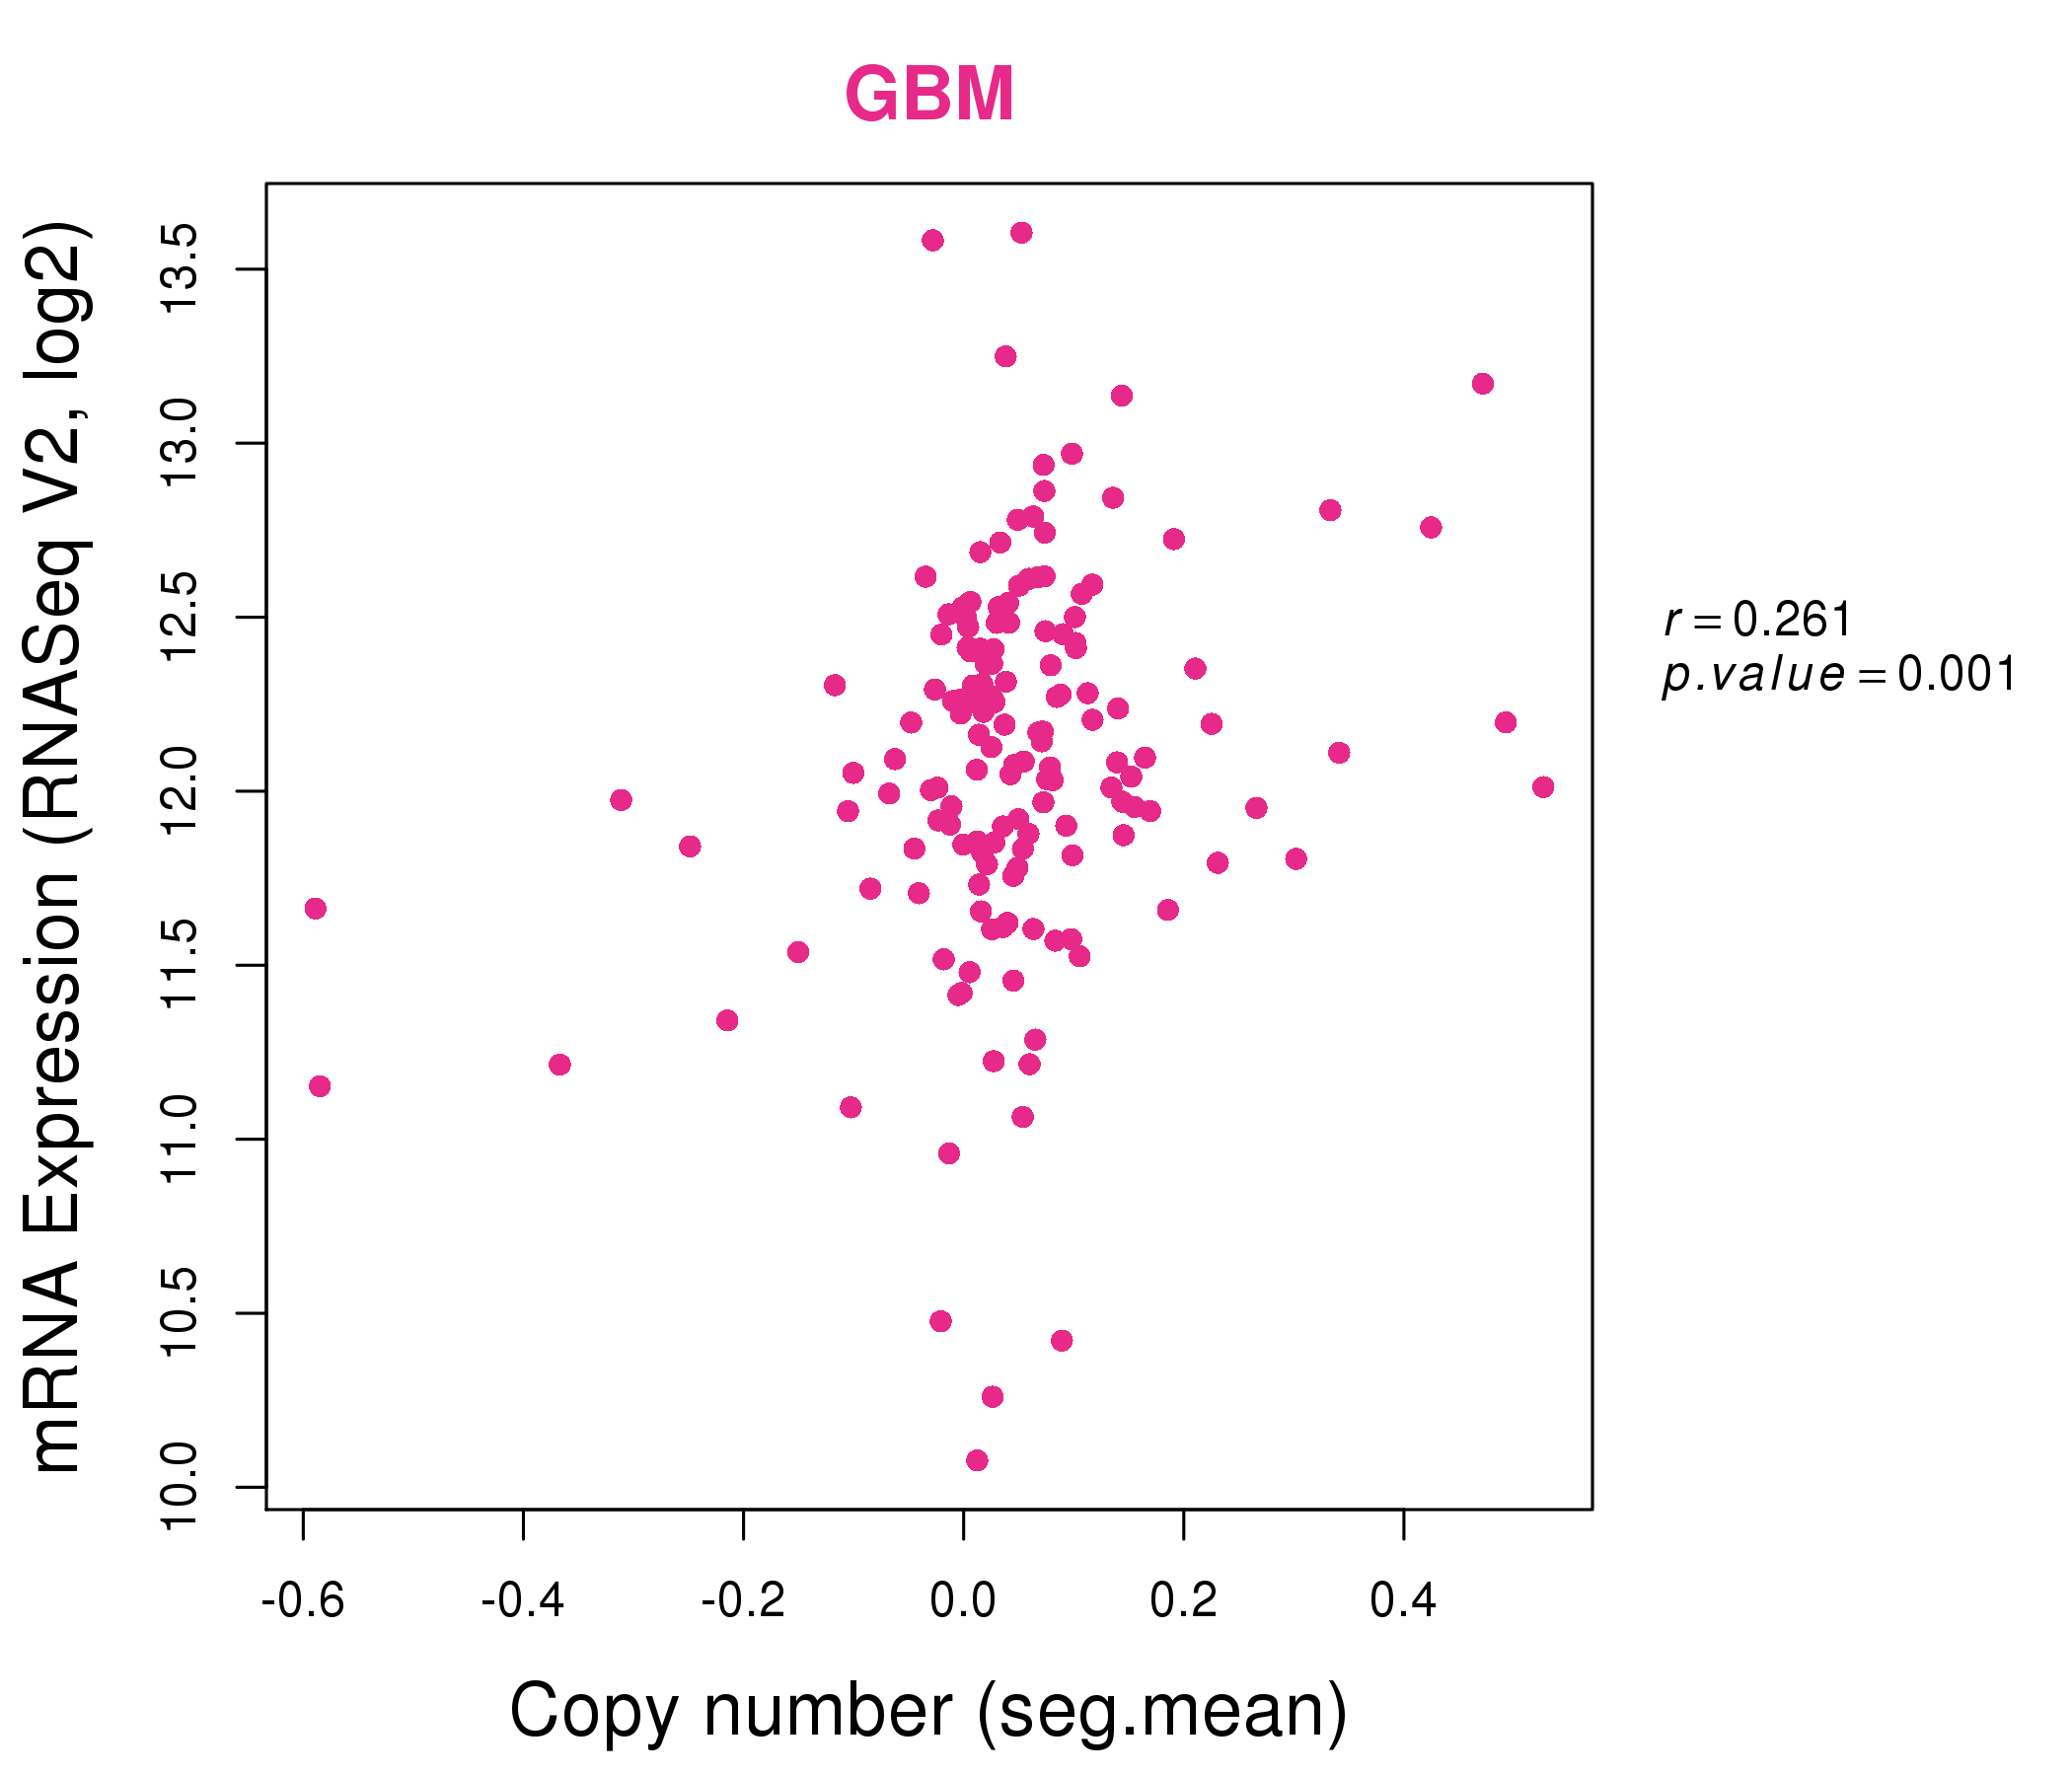
| * This plots show the correlation between CNV and gene expression. |
: Open all plots for all cancer types
 |
|
 |
|
| Top |
| Gene-Gene Network Information |
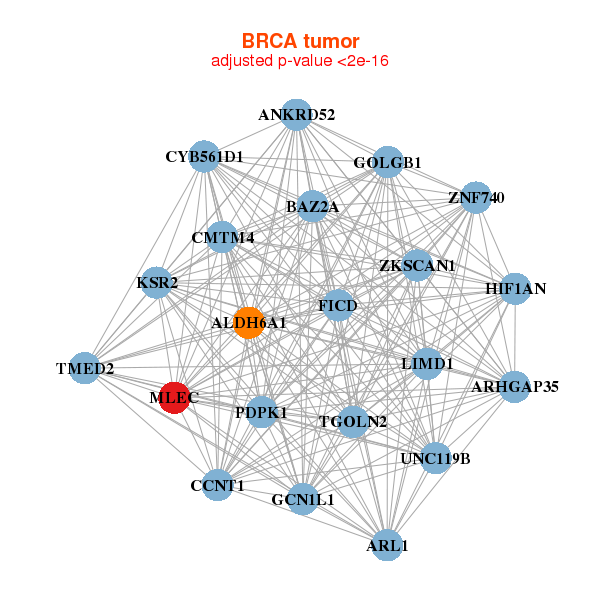
| * Co-Expression network figures were drawn using R package igraph. Only the top 20 genes with the highest correlations were shown. Red circle: input gene, orange circle: cell metabolism gene, sky circle: other gene |
: Open all plots for all cancer types
 |
|
| ALDH6A1,ANKRD52,ARL1,BAZ2A,CCNT1,CMTM4,CYB561D1, FICD,GCN1L1,GOLGB1,ARHGAP35,HIF1AN,KSR2,LIMD1, MLEC,PDPK1,TGOLN2,TMED2,UNC119B,ZKSCAN1,ZNF740 | ACOT4,AGPAT3,COPA,FBXW2,GPAM,HIPK2,HK2, KCTD21,KIAA0100,MAPK10,SLC25A51,MLEC,PBLD,PCYOX1, PIGS,RAB2A,SLC16A2,MIEF1,SNX19,SORT1,UNC13B |
 |
|
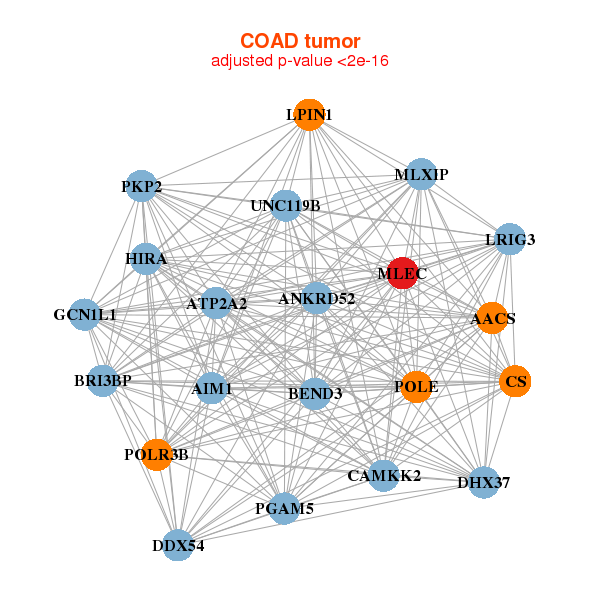
| AACS,AIM1,ANKRD52,ATP2A2,BEND3,BRI3BP,CAMKK2, CS,DDX54,DHX37,GCN1L1,HIRA,LPIN1,LRIG3, MLEC,MLXIP,PGAM5,PKP2,POLE,POLR3B,UNC119B | BEND3,C9orf129,CDT1,CENPF,DARS2,DNAJC16,EFTUD2, FAM120A,CLUH,LARS2,MCCC2,METTL13,MLEC,PIGO, POLR3B,PROM2,SPTLC2,STEAP3,TARS2,TP53,TPX2 |
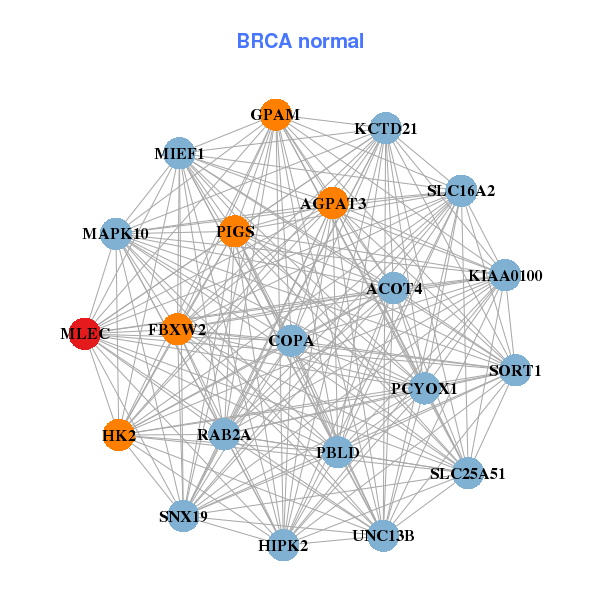
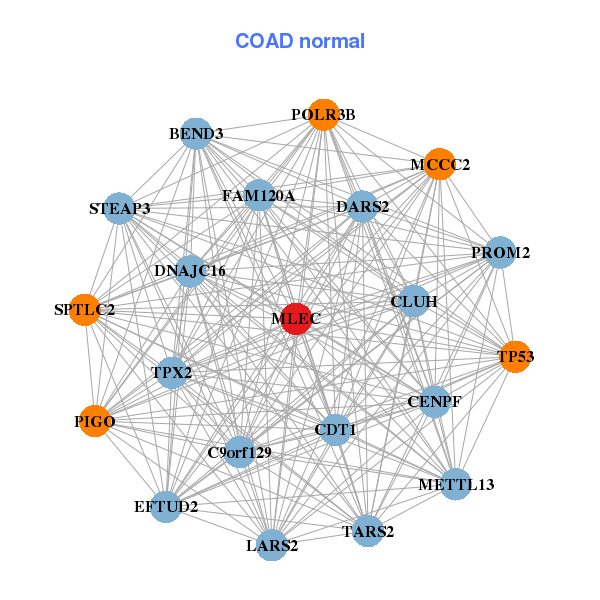
| * Co-Expression network figures were drawn using R package igraph. Only the top 20 genes with the highest correlations were shown. Red circle: input gene, orange circle: cell metabolism gene, sky circle: other gene |
: Open all plots for all cancer types
| Top |
: Open all interacting genes' information including KEGG pathway for all interacting genes from DAVID
| Top |
| Pharmacological Information for MLEC |
| There's no related Drug. |
| Top |
| Cross referenced IDs for MLEC |
| * We obtained these cross-references from Uniprot database. It covers 150 different DBs, 18 categories. http://www.uniprot.org/help/cross_references_section |
: Open all cross reference information
|
Copyright © 2016-Present - The Univsersity of Texas Health Science Center at Houston @ |