|
mutLBSgeneDB |
| |
| |
| |
| |
| |
| |
|

| Gene summary for TOB1 |
 Gene summary Gene summary |
| Basic gene Info. | Gene symbol | TOB1 |
| Gene name | transducer of ERBB2, 1 | |
| Synonyms | APRO6|PIG49|TOB|TROB|TROB1 | |
| Cytomap | UCSC genome browser: 17q21 | |
| Type of gene | protein-coding | |
| RefGenes | NM_001243877.1, NM_001243885.1,NM_005749.3, | |
| Description | proliferation-inducing gene 49protein Tob1transducer of erbB-2 1 | |
| Modification date | 20141207 | |
| dbXrefs | MIM : 605523 | |
| HGNC : HGNC | ||
| Ensembl : ENSG00000141232 | ||
| HPRD : 09273 | ||
| Vega : OTTHUMG00000162277 | ||
| Protein | UniProt: P50616 go to UniProt's Cross Reference DB Table | |
| Expression | CleanEX: HS_TOB1 | |
| BioGPS: 10140 | ||
| Pathway | NCI Pathway Interaction Database: TOB1 | |
| KEGG: TOB1 | ||
| REACTOME: TOB1 | ||
| Pathway Commons: TOB1 | ||
| Context | iHOP: TOB1 | |
| ligand binding site mutation search in PubMed: TOB1 | ||
| UCL Cancer Institute: TOB1 | ||
| Assigned class in mutLBSgeneDB | C: This gene just belongs to mutLBSgenes. | |
| Gene ontology having evidence of Inferred from Direct Assay (IDA) from Entrez |
| GO ID | GO Term | PubMed ID | GO:0008285 | negative regulation of cell proliferation | 19276069 | GO:0017148 | negative regulation of translation | 23236473 | GO:0060212 | negative regulation of nuclear-transcribed mRNA poly(A) tail shortening | 18377426 | GO:0060213 | positive regulation of nuclear-transcribed mRNA poly(A) tail shortening | 21336257 | GO:1900153 | positive regulation of nuclear-transcribed mRNA catabolic process, deadenylation-dependent decay | 21336257 |
| Top |
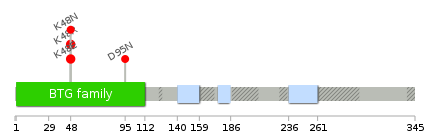
| Ligand binding site mutations for TOB1 |
| Lollipop-style diagram of mutations at LBS in amino-acid sequence. We represented ligand binding site mutations only. (You can see big image via clicking.) |
 |
| Cancer type specific mutLBS sorted by frequency |
| LBS | AAchange of nsSNV | Cancer type | # samples | P49 | K48R | COAD | 2 | P49 | K48E | COAD | 2 | W93,F97 | D95N | BLCA | 1 | P49 | K48N | COAD | 1 |
| cf) Cancer type abbreviation. BLCA: Bladder urothelial carcinoma, BRCA: Breast invasive carcinoma, CESC: Cervical squamous cell carcinoma and endocervical adenocarcinoma, COAD: Colon adenocarcinoma, GBM: Glioblastoma multiforme, LGG: Brain lower grade glioma, HNSC: Head and neck squamous cell carcinoma, KICH: Kidney chromophobe, KIRC: Kidney renal clear cell carcinoma, KIRP: Kidney renal papillary cell carcinoma, LAML: Acute myeloid leukemia, LUAD: Lung adenocarcinoma, LUSC: Lung squamous cell carcinoma, OV: Ovarian serous cystadenocarcinoma, PAAD: Pancreatic adenocarcinoma, PRAD: Prostate adenocarcinoma, SKCM: Skin cutaneous melanoma, STAD: Stomach adenocarcinoma, THCA: Thyroid carcinoma, UCEC: Uterine corpus endometrial carcinoma. |
| Top |
| Protein structure related information for TOB1 |
| Relative protein structure stability change (ΔΔE) using Mupro 1.1 Mupro score denotes assessment of the effect of mutations on thermodynamic stability. (ΔΔE<0: mutation decreases stability, ΔΔE>0: mutation increases stability) |
 : nsSNV at non-LBS : nsSNV at non-LBS : nsSNV at LBS : nsSNV at LBS |
 |
| nsSNVs sorted by the relative stability change of protein structure by each mutation Blue: mutations of positive stability change. and red : the most recurrent mutation for this gene. |
| LBS | AAchange of nsSNV | Relative stability change | W93 | D95N | -1.2125003 | F97 | D95N | -1.2125003 | P49 | K48N | -1.151233 | P49 | K48R | -0.81157635 | P49 | K48E | -0.77910959 |
| (MuPro1.1: Jianlin Cheng et al., Prediction of Protein Stability Changes for Single-Site Mutations Using Support Vector Machines, PROTEINS: Structure, Function, and Bioinformatics. 2006, 62:1125-1132) |
| Structure image for TOB1 from PDB |
| PDB ID | PDB title | PDB structure | 2Z15 | Crystal structure of human Tob1 protein | 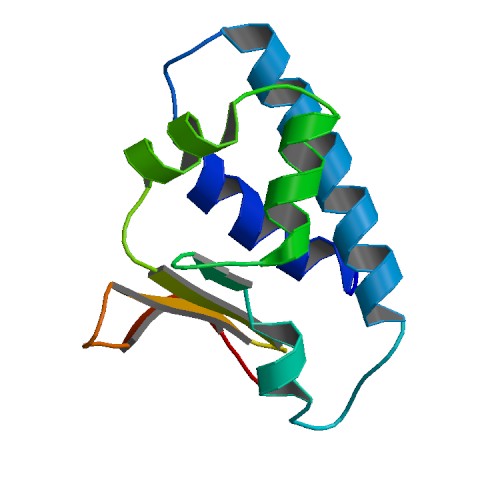 |
| Top |
| Differential gene expression and gene-gene network for TOB1 |
| Differential gene expression between mutated and non-mutated LBS samples in all 16 major cancer types |
| Differential co-expressed gene network based on protein-protein interaction data (CePIN) |
| Top |
| Top |
| Phenotype information for TOB1 |
| Gene level disease information (DisGeNet) |
| Disease ID | Disease name | # PubMed | Association type |
| umls:C0263454 | Chloracne | 1 | Biomarker |
| umls:C0014175 | Endometriosis | 1 | Biomarker |
| umls:C0027659 | Neoplasms, Experimental | 1 | Biomarker |
| Mutation level pathogenic information (ClinVar annotation) |
| Allele ID | AA change | Clinical significance | Origin | Phenotype IDs |
| Top |
| Pharmacological information for TOB1 |
| Gene expression profile of anticancer drug treated cell-lines (CCLE) Heatmap showing the correlation between gene expression and drug response across all the cell-lines. We chose the top 20 among 138 drugs.We used Pearson's correlation coefficient. |
 |
| Drug information targeting mutLBSgene (Approved drugs only) |
| Drug status | DrugBank ID | Name | Type | Drug structure |
| Gene-centered ligand-gene interaction network |
 |
| Ligands binding to mutated ligand binding site of TOB1 go to BioLip |
| Ligand ID | Ligand short name | Ligand long name | PDB ID | PDB name | mutLBS | 549 | 1-(PROPAN-2-YL)-1H-BENZIMIDAZOLE-5-CARBOXYLIC ACID | 5ci9 | A | P49 F97 | 53Y | PYRROLO[1,2-A]QUINOXALIN-4(5H)-ONE | 5ci8 | A | W93 |
| Top |
| Conservation information for LBS of TOB1 |
| Multiple alignments for P50616 in multiple species |
| LBS | AA sequence | # species | Species |
 |
Copyright © 2016-Present - The University of Texas Health Science Center at Houston |