|
mutLBSgeneDB |
| |
| |
| |
| |
| |
| |
|

| Gene summary for AGTR1 |
 Gene summary Gene summary |
| Basic gene Info. | Gene symbol | AGTR1 |
| Gene name | angiotensin II receptor, type 1 | |
| Synonyms | AG2S|AGTR1B|AT1|AT1AR|AT1B|AT1BR|AT1R|AT2R1|HAT1R | |
| Cytomap | UCSC genome browser: 3q24 | |
| Type of gene | protein-coding | |
| RefGenes | NM_000685.4, NM_004835.4,NM_009585.3,NM_031850.3,NM_032049.3, | |
| Description | type-1 angiotensin II receptortype-1B angiotensin II receptor | |
| Modification date | 20141222 | |
| dbXrefs | MIM : 106165 | |
| HGNC : HGNC | ||
| Ensembl : ENSG00000144891 | ||
| HPRD : 00107 | ||
| Vega : OTTHUMG00000159503 | ||
| Protein | UniProt: P30556 go to UniProt's Cross Reference DB Table | |
| Expression | CleanEX: HS_AGTR1 | |
| BioGPS: 185 | ||
| Pathway | NCI Pathway Interaction Database: AGTR1 | |
| KEGG: AGTR1 | ||
| REACTOME: AGTR1 | ||
| Pathway Commons: AGTR1 | ||
| Context | iHOP: AGTR1 | |
| ligand binding site mutation search in PubMed: AGTR1 | ||
| UCL Cancer Institute: AGTR1 | ||
| Assigned class in mutLBSgeneDB | B: This gene belongs to targetable_mutLBSgenes. | |
| Gene ontology having evidence of Inferred from Direct Assay (IDA) from Entrez |
| GO ID | GO Term | PubMed ID | GO:0007186 | G-protein coupled receptor signaling pathway | 1378723 | GO:0007204 | positive regulation of cytosolic calcium ion concentration | 1567413 | GO:0007266 | Rho protein signal transduction | 15611106 | GO:0019229 | regulation of vasoconstriction | 15117835 | GO:0019722 | calcium-mediated signaling | 1567413 | GO:0038166 | angiotensin-activated signaling pathway | 15611106 | GO:0051482 | positive regulation of cytosolic calcium ion concentration involved in phospholipase C-activating G-protein coupled signaling pathway | 1567413 | GO:0060326 | cell chemotaxis | 15635042 | GO:0086097 | phospholipase C-activating angiotensin-activated signaling pathway | 10993080 |
| Top |
| Ligand binding site mutations for AGTR1 |
| Lollipop-style diagram of mutations at LBS in amino-acid sequence. We represented ligand binding site mutations only. (You can see big image via clicking.) |
 |
| Cancer type specific mutLBS sorted by frequency |
| LBS | AAchange of nsSNV | Cancer type | # samples | A163,R167 | I165M | COAD | 1 | V108 | S107R | HNSC | 1 | Y292 | F293L | HNSC | 1 | P285 | A283T | LUSC | 1 | Y35 | I37V | STAD | 1 |
| cf) Cancer type abbreviation. BLCA: Bladder urothelial carcinoma, BRCA: Breast invasive carcinoma, CESC: Cervical squamous cell carcinoma and endocervical adenocarcinoma, COAD: Colon adenocarcinoma, GBM: Glioblastoma multiforme, LGG: Brain lower grade glioma, HNSC: Head and neck squamous cell carcinoma, KICH: Kidney chromophobe, KIRC: Kidney renal clear cell carcinoma, KIRP: Kidney renal papillary cell carcinoma, LAML: Acute myeloid leukemia, LUAD: Lung adenocarcinoma, LUSC: Lung squamous cell carcinoma, OV: Ovarian serous cystadenocarcinoma, PAAD: Pancreatic adenocarcinoma, PRAD: Prostate adenocarcinoma, SKCM: Skin cutaneous melanoma, STAD: Stomach adenocarcinoma, THCA: Thyroid carcinoma, UCEC: Uterine corpus endometrial carcinoma. |
| Top |
| Protein structure related information for AGTR1 |
| Relative protein structure stability change (ΔΔE) using Mupro 1.1 Mupro score denotes assessment of the effect of mutations on thermodynamic stability. (ΔΔE<0: mutation decreases stability, ΔΔE>0: mutation increases stability) |
 : nsSNV at non-LBS : nsSNV at non-LBS : nsSNV at LBS : nsSNV at LBS |
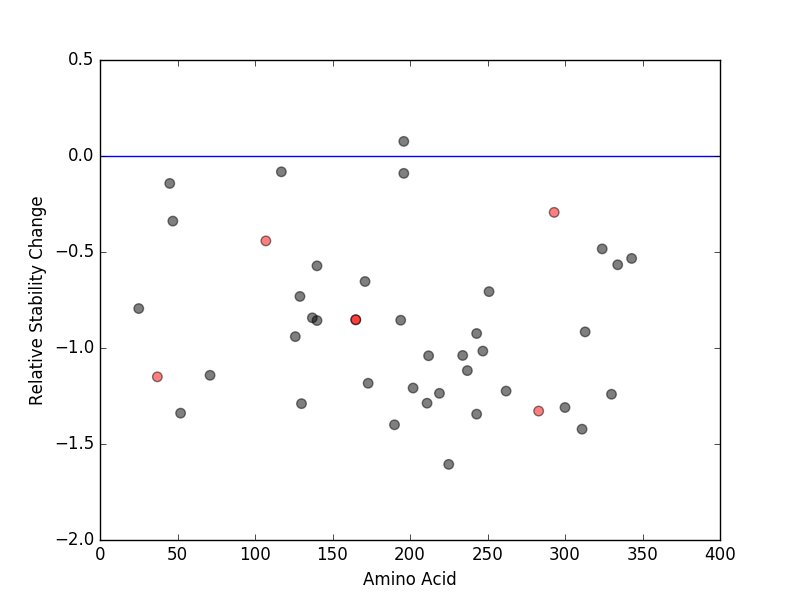 |
| nsSNVs sorted by the relative stability change of protein structure by each mutation Blue: mutations of positive stability change. and red : the most recurrent mutation for this gene. |
| LBS | AAchange of nsSNV | Relative stability change | P285 | A283T | -1.3284703 | Y35 | I37V | -1.1501873 | A163 | I165M | -0.85286538 | R167 | I165M | -0.85286538 | V108 | S107R | -0.44221857 | Y292 | F293L | -0.29366058 |
| (MuPro1.1: Jianlin Cheng et al., Prediction of Protein Stability Changes for Single-Site Mutations Using Support Vector Machines, PROTEINS: Structure, Function, and Bioinformatics. 2006, 62:1125-1132) |
| Structure image for AGTR1 from PDB |
| Top |
| Differential gene expression and gene-gene network for AGTR1 |
| Differential gene expression between mutated and non-mutated LBS samples in all 16 major cancer types |
| Differential co-expressed gene network based on protein-protein interaction data (CePIN) |
| Top |
| Top |
| Phenotype information for AGTR1 |
| Gene level disease information (DisGeNet) |
| Disease ID | Disease name | # PubMed | Association type |
| umls:C0020538 | Hypertension | 194 | AlteredExpression, Biomarker, GeneticVariation |
| umls:C0085580 | Hypertension, Essential | 44 | Biomarker, GeneticVariation |
| umls:C0022658 | Kidney Diseases | 22 | Biomarker, GeneticVariation |
| umls:C0018801 | Heart Failure | 14 | AlteredExpression, Biomarker, GeneticVariation, Therapeutic |
| umls:C0162871 | Aortic Aneurysm, Abdominal | 7 | Biomarker, GeneticVariation |
| umls:C0033687 | Proteinuria | 5 | Biomarker, GeneticVariation |
| umls:C0011884 | Diabetic Retinopathy | 4 | Biomarker, GeneticVariation |
| umls:C0013274 | Ductus Arteriosus, Patent | 2 | Biomarker, GeneticVariation |
| umls:C0000786 | Abortion, Spontaneous | 2 | Biomarker, GeneticVariation |
| umls:C0266313 | Allanson Pantzar McLeod syndrome | 1 | Biomarker, GeneticVariation |
| umls:C0887833 | Carcinoma, Pancreatic Ductal | 1 | Biomarker |
| umls:C0027627 | Neoplasm Metastasis | 1 | Biomarker |
| umls:C0032019 | Pituitary Neoplasms | 1 | Biomarker |
| Mutation level pathogenic information (ClinVar annotation) |
| Allele ID | AA change | Clinical significance | Origin | Phenotype IDs |
| Top |
| Pharmacological information for AGTR1 |
| Gene expression profile of anticancer drug treated cell-lines (CCLE) Heatmap showing the correlation between gene expression and drug response across all the cell-lines. We chose the top 20 among 138 drugs.We used Pearson's correlation coefficient. |
 |
| Gene-centered drug-gene interaction network |
 |
| Drug information targeting mutLBSgene (Approved drugs only) |
| Drug status | DrugBank ID | Name | Type | Drug structure |
| Approved|investigational | DB00177 | Valsartan | Small molecule | 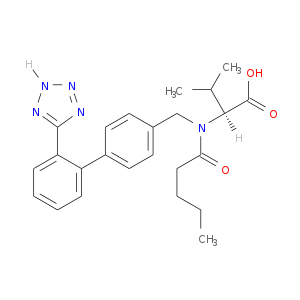 |
| Approved|investigational | DB00275 | Olmesartan | Small molecule |  |
| Approved | DB00678 | Losartan | Small molecule |  |
| Approved | DB00796 | Candesartan | Small molecule | 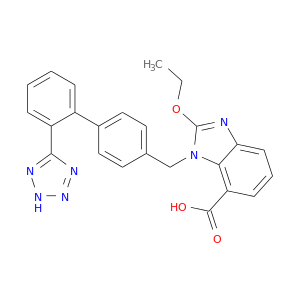 |
| Approved | DB00876 | Eprosartan | Small molecule |  |
| Approved|investigational | DB00966 | Telmisartan | Small molecule |  |
| Approved|investigational | DB01029 | Irbesartan | Small molecule | 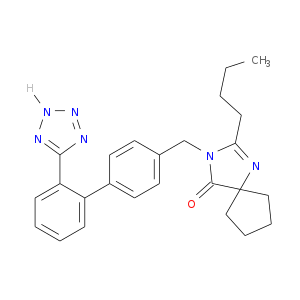 |
| Approved | DB01342 | Forasartan | Small molecule |  |
| Approved | DB01347 | Saprisartan | Small molecule | 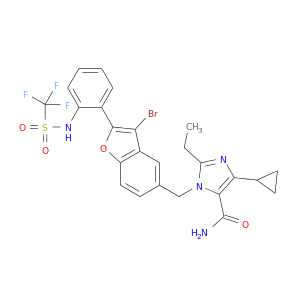 |
| Approved | DB01349 | Tasosartan | Small molecule | 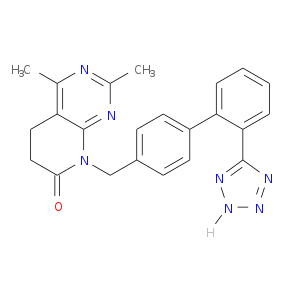 |
| Investigational | DB05739 | CYT006-AngQb | Biotech |  |
| Approved | DB08822 | Azilsartan medoxomil | Small molecule |  |
| Gene-centered ligand-gene interaction network |
 |
| Ligands binding to mutated ligand binding site of AGTR1 go to BioLip |
| Ligand ID | Ligand short name | Ligand long name | PDB ID | PDB name | mutLBS | ZD7 | 5,7-DIETHYL-1-{[2'-(1H-TETRAZOL-5-YL)BIPHENYL-4- YL]METHYL}-3,4-DIHYDRO-1,6-NAPHTHYRIDIN-2(1H)-ONE | 4yay | A | Y35 V108 A163 R167 P285 Y292 | OLM | OLMESARTAN | 4zud | A | Y35 V108 R167 Y292 |
| Top |
| Conservation information for LBS of AGTR1 |
| Multiple alignments for P30556 in multiple species |
| LBS | AA sequence | # species | Species |
 |
Copyright © 2016-Present - The University of Texas Health Science Center at Houston |