Data collection of TSGene 2.0 and how to use TSGene 2.0: |
|---|
|
1. Data collection of TSGene 2.0 database Curation of tumor suppressor genes from literature 2. Information for tumor suppressor genes General information and literature evidence Text search of tumor suppressor genes Quick access information in database Blast all protein and nucleotide sequences By pan-cancer gene expression pattern By pan-cancer mutational feature
|
Data collection of TSGene database |
Why use TSGene 2.0 [ top ] |
|
Since our publication of TSGene 1.0 in 2013, we have received many inquires for more details about our TSGene. Addtionally, many more cancer datasets, especially those from pan-cancer studies, have been released since we published TSGene. In this updated version, we collected hundreds of additional tumor suppressor genes from literature. TSGene2.0 now contains 1217 human genes (1018 coding and 199 non-coding genes) curated from a total of over 9000 PubMed abstracts. The primary aim of TSGene 2.0 is to support cancer research by maintaining a high quality tumor suppressor gene list for pan-cancer analysis. This database serve a comprehensive, fully classified, richly and accurately annotated tumor suppressor gene knowledgebase, with extensive cross-references and querying interfaces freely accessible to the scientific community. In this updated version, the new features include:
|
Curation of tumor suppressor genes from literature [ top ] |
Curation of tumor suppressor genes from literature includes five steps: 1). exhaustive searching for relevant abstracts from the PubMed and Generif databases using the key words "tumor suppressor gene;" 2). extracting the description for the tumor suppressor gene from text; 3). grouping the descriptions extracted from PubMed abstracts and Generfi records by their topics using Entrez related topic function; 4). extraction of gene name from the grouped descriptions of the tumor suppressor genes; 5). genes mapping the gene name to Entrez geneID. Exhaustive search: Extracting description: Group abstracts: Curation: Mapping the gene symbols: |
Information for tumor suppressor genes [ top ] |
|
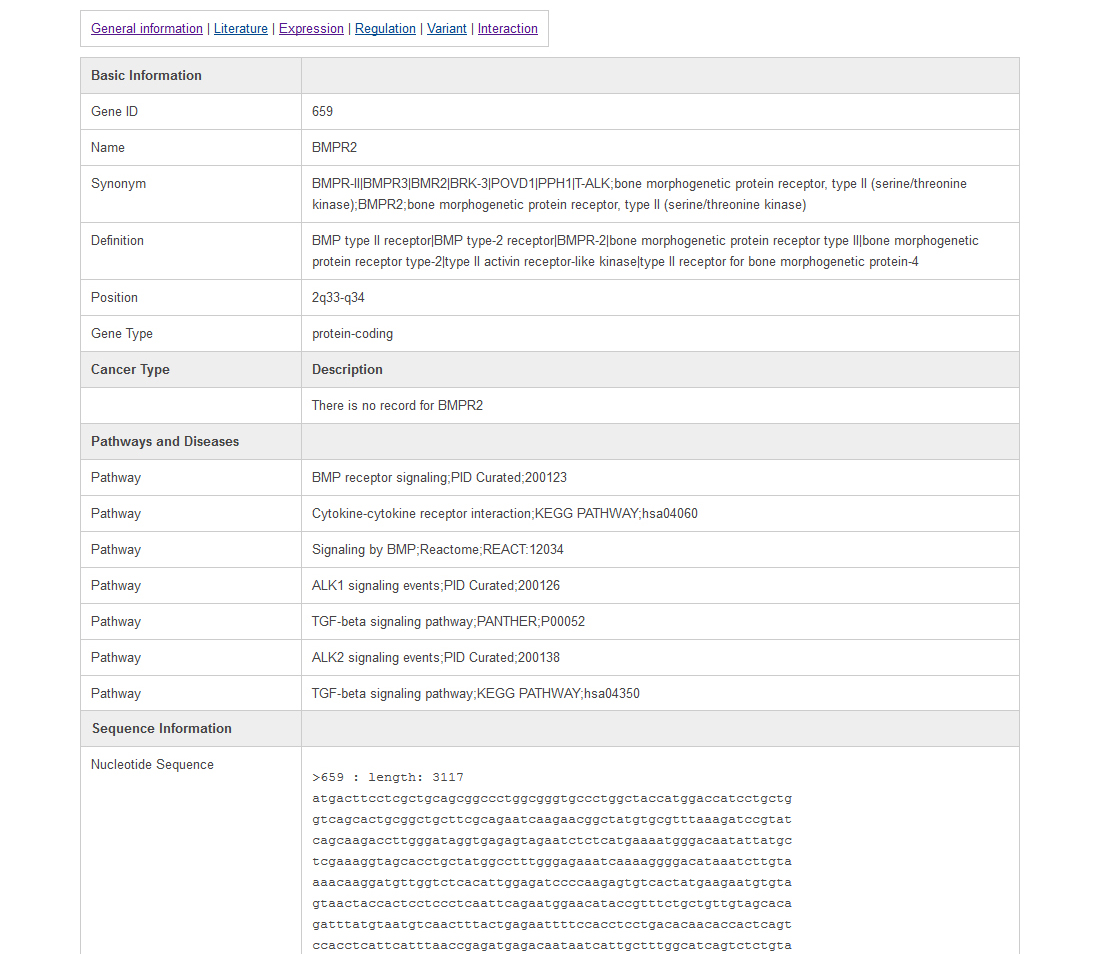
Information is represented on six different types of pages, including general information view, literature highlight view, gene expression view, gene regulation view, gene mutation view, and gene interaction view. The general information page is like the following:In this page, users can find the data source and our curated descriptions for tumor suppressor genes from literature. It is easy to switch to other annotations by clicking the hyperlink at the top of the page.
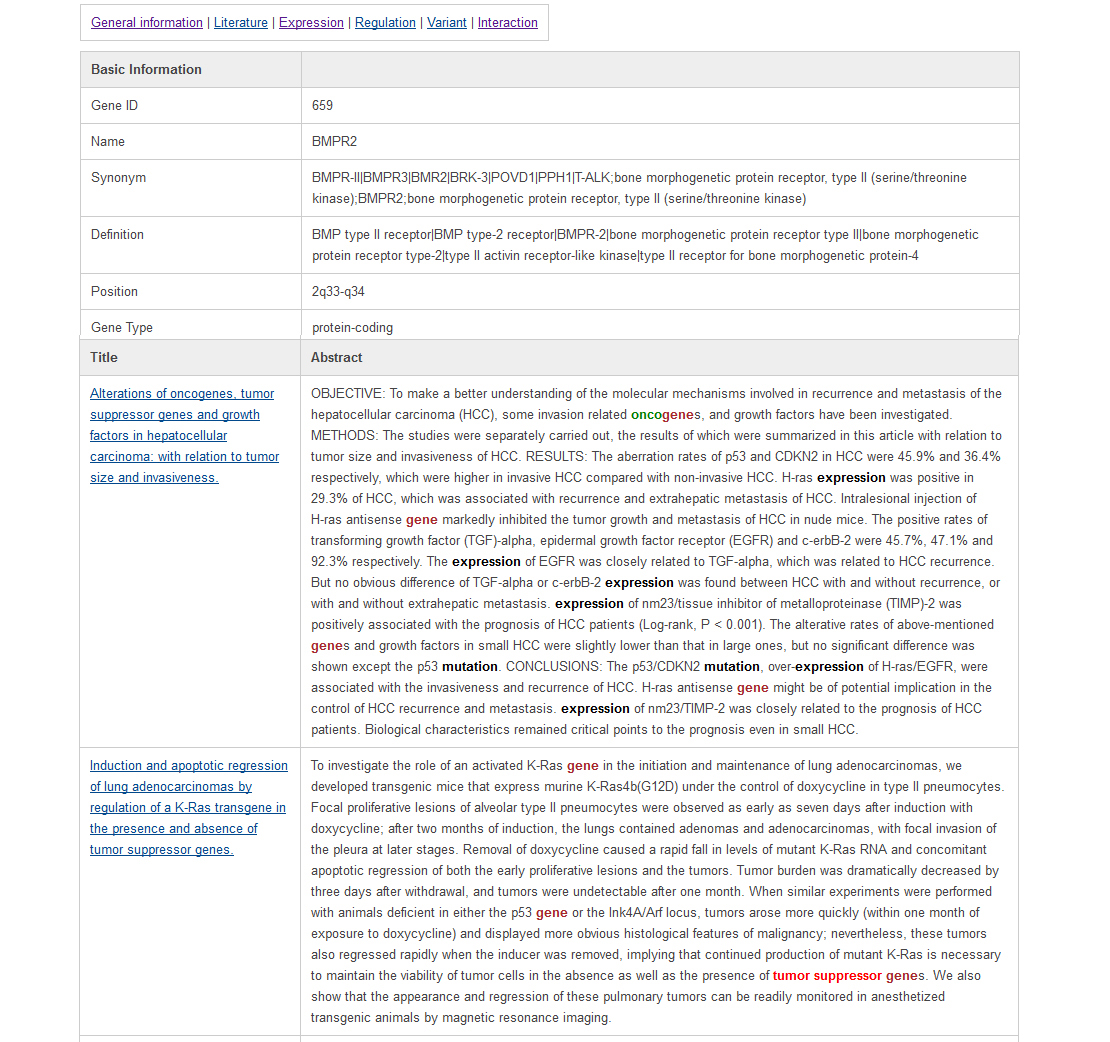
User can find the details of the literatures with keywords highlighted in the literature highlight page as below. The keyword "tumor suppressor" is marked in red; keywords such as "cancer" and "pathway" are marked in brown; and the keywords in the category of "oncogene" are highlighted in green; the keywords such as "mutation" and "expression" are marked in black as shown in below.
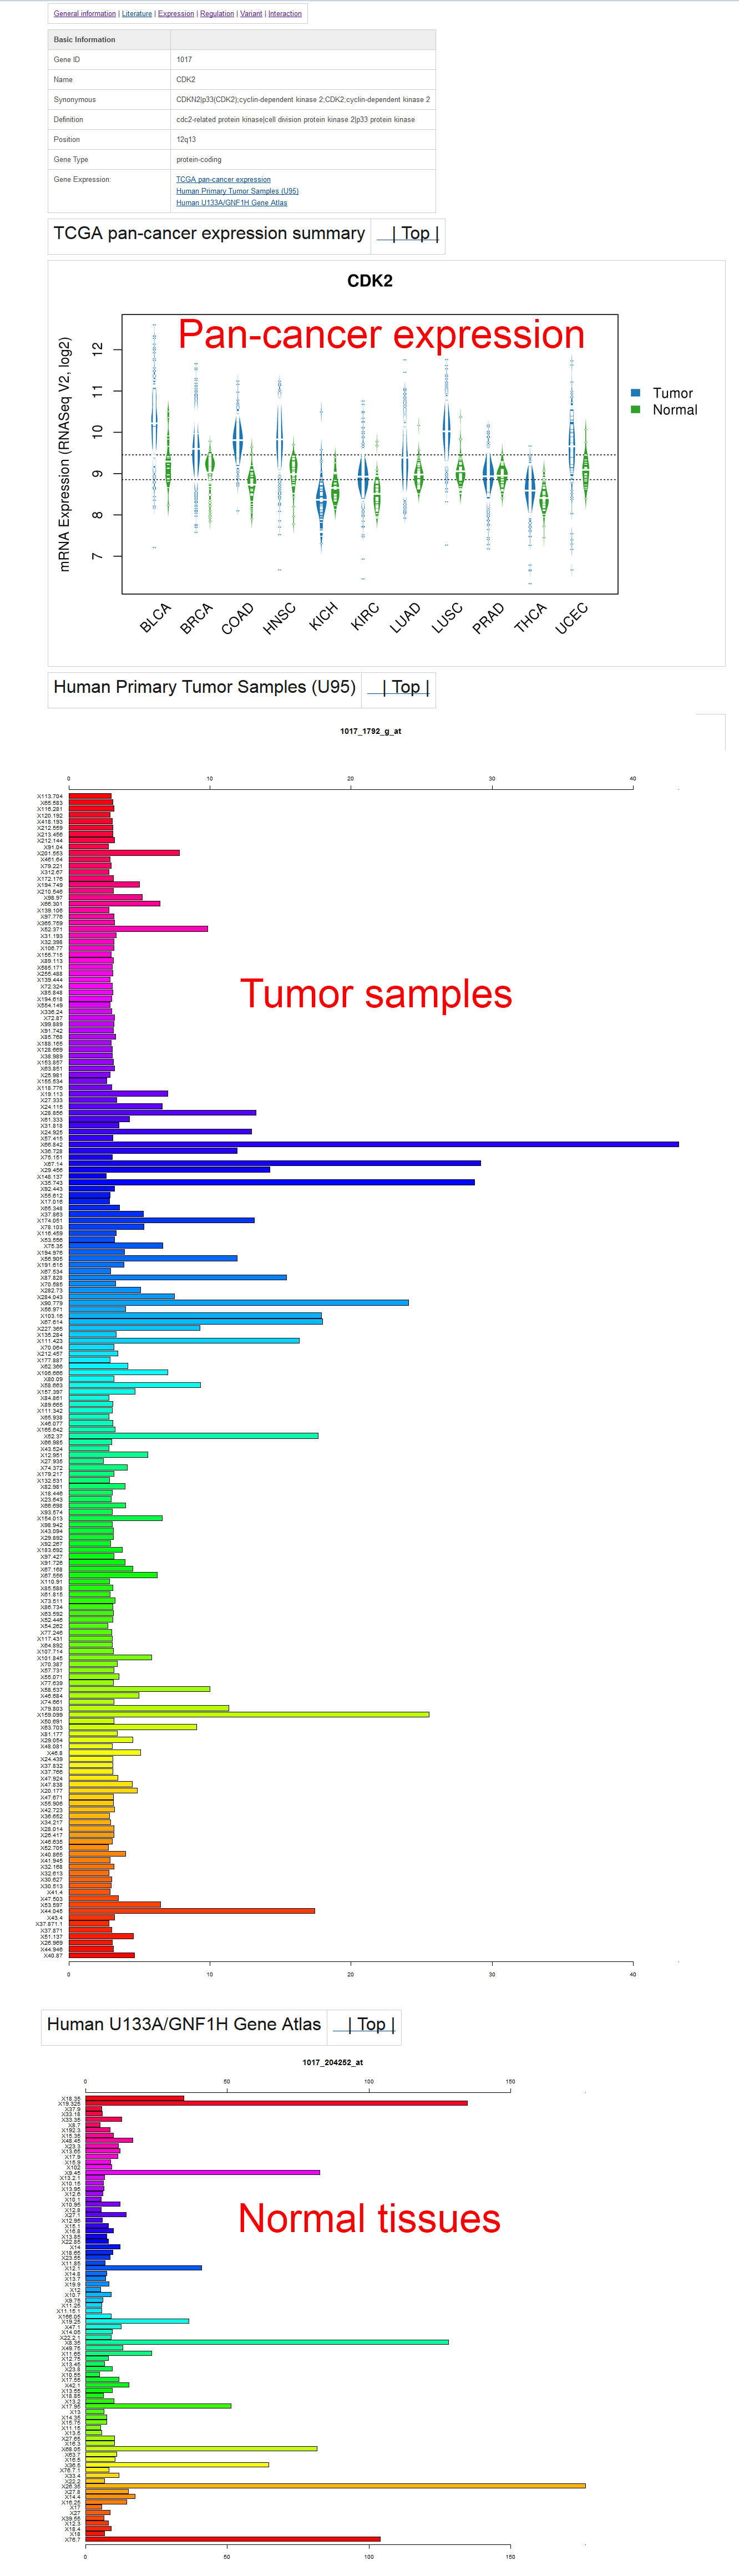
The gene expression page is as below:In this page, users can find the gene expression summary in the tumor and normal tissues from 11 TCGA cancer types. Similar to our previous version, the gene expression profiles from 184 human tumor samples and 84 normal tissue samples from BioGPS are also presented. It is easy to view the sample information of the 184 tumor samples by clicking the hyperlink in the profile images. Some genes have multiple probes; to provide an unbiased view for users, we presented all the gene expressions from all probes without any modification.
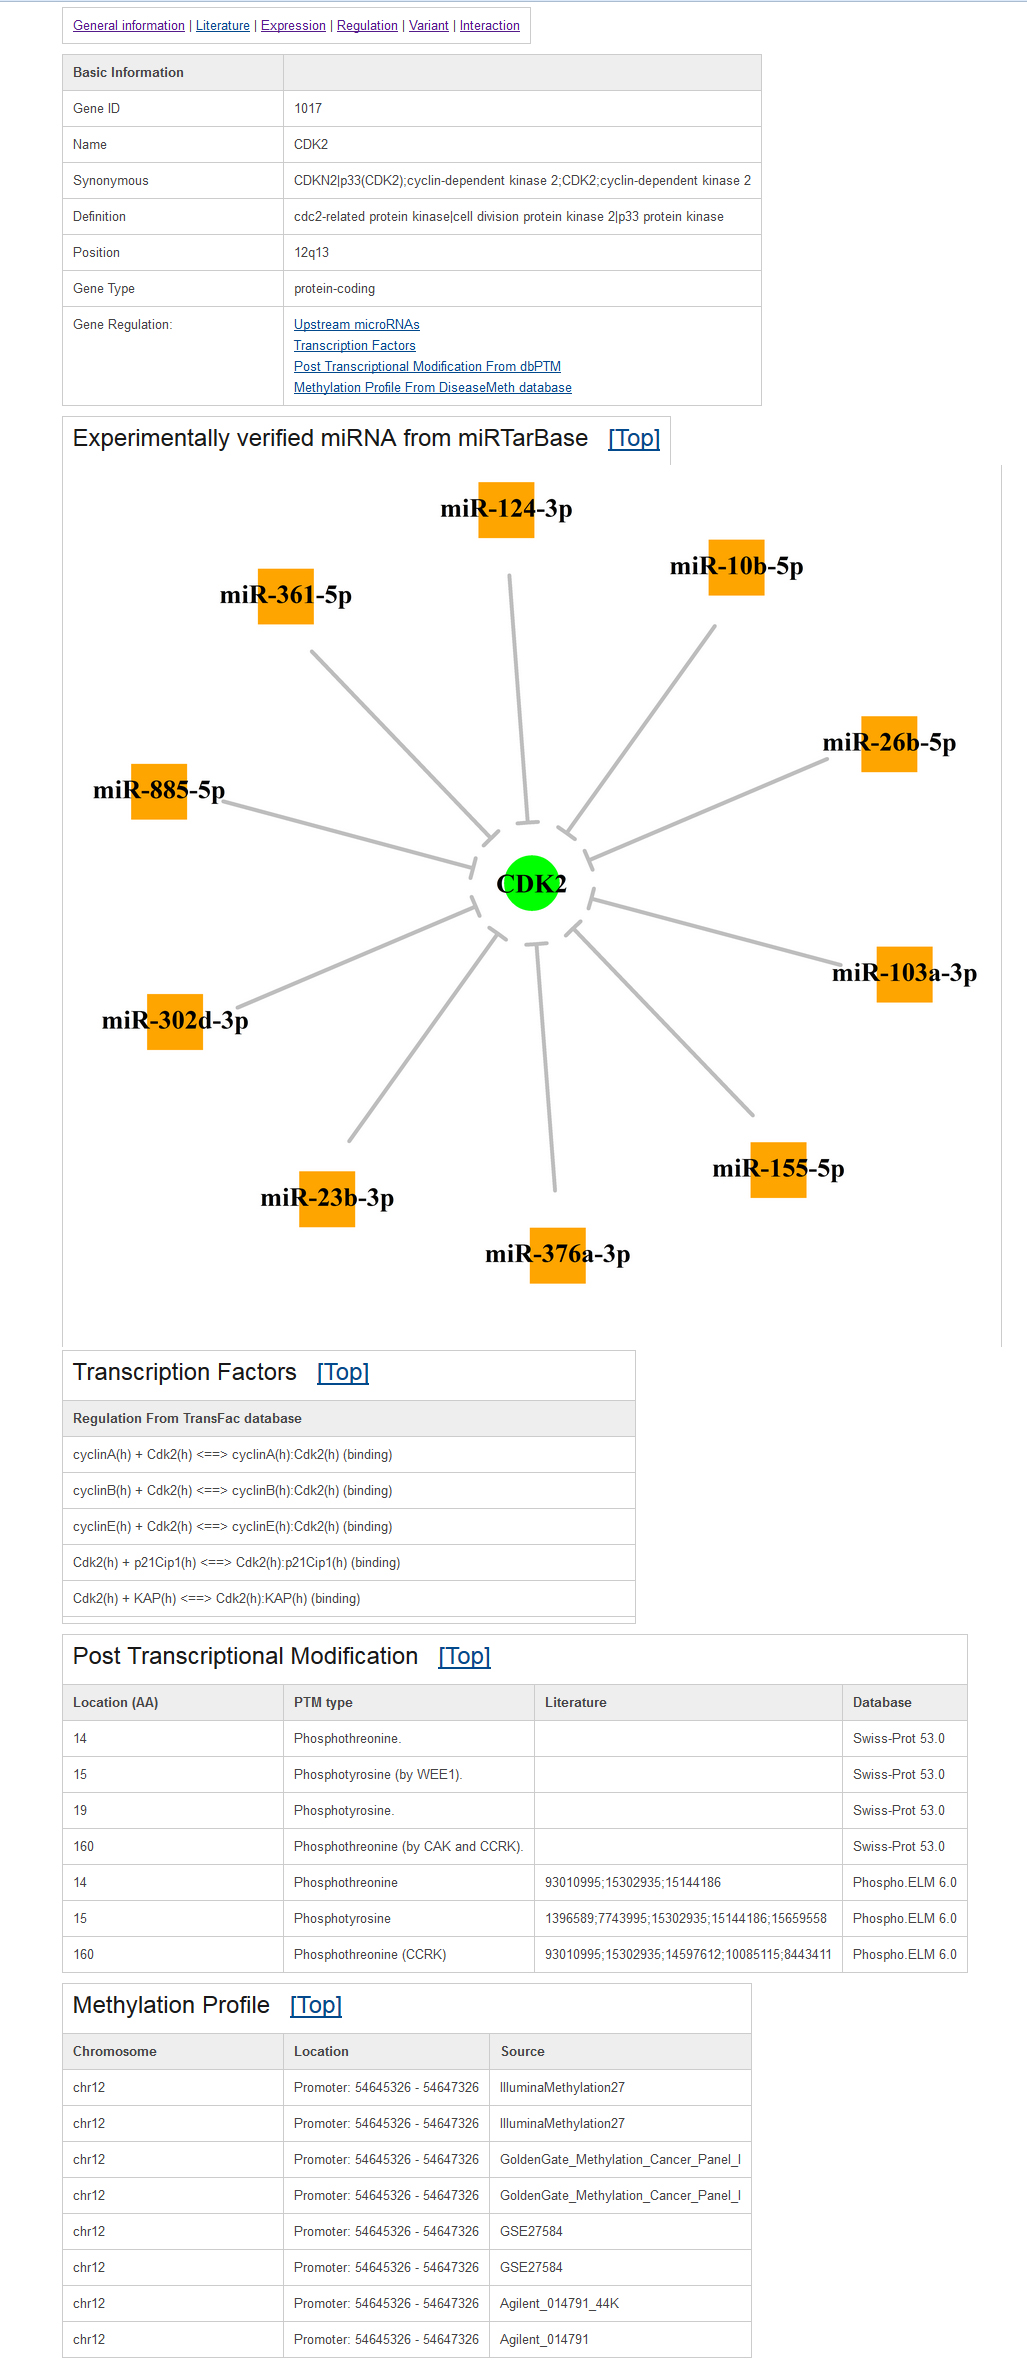
Example gene regulation page:In TSGene2.0, we added the upstream microRNAs of each tumor suppressor gene based on the experimentally verified microRNAs annotation from miRTarbase database (June 16, 2015). Similar to our previous version, the transcription factor regulation and post-transcriptional modification information were integrated from the TRANSFAC and dbPTM databases. In addition, the methylation in promoter regions was annotated based on data from the DiseaseMeth database.
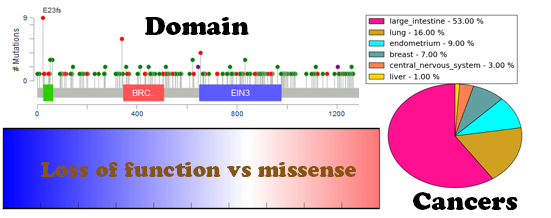
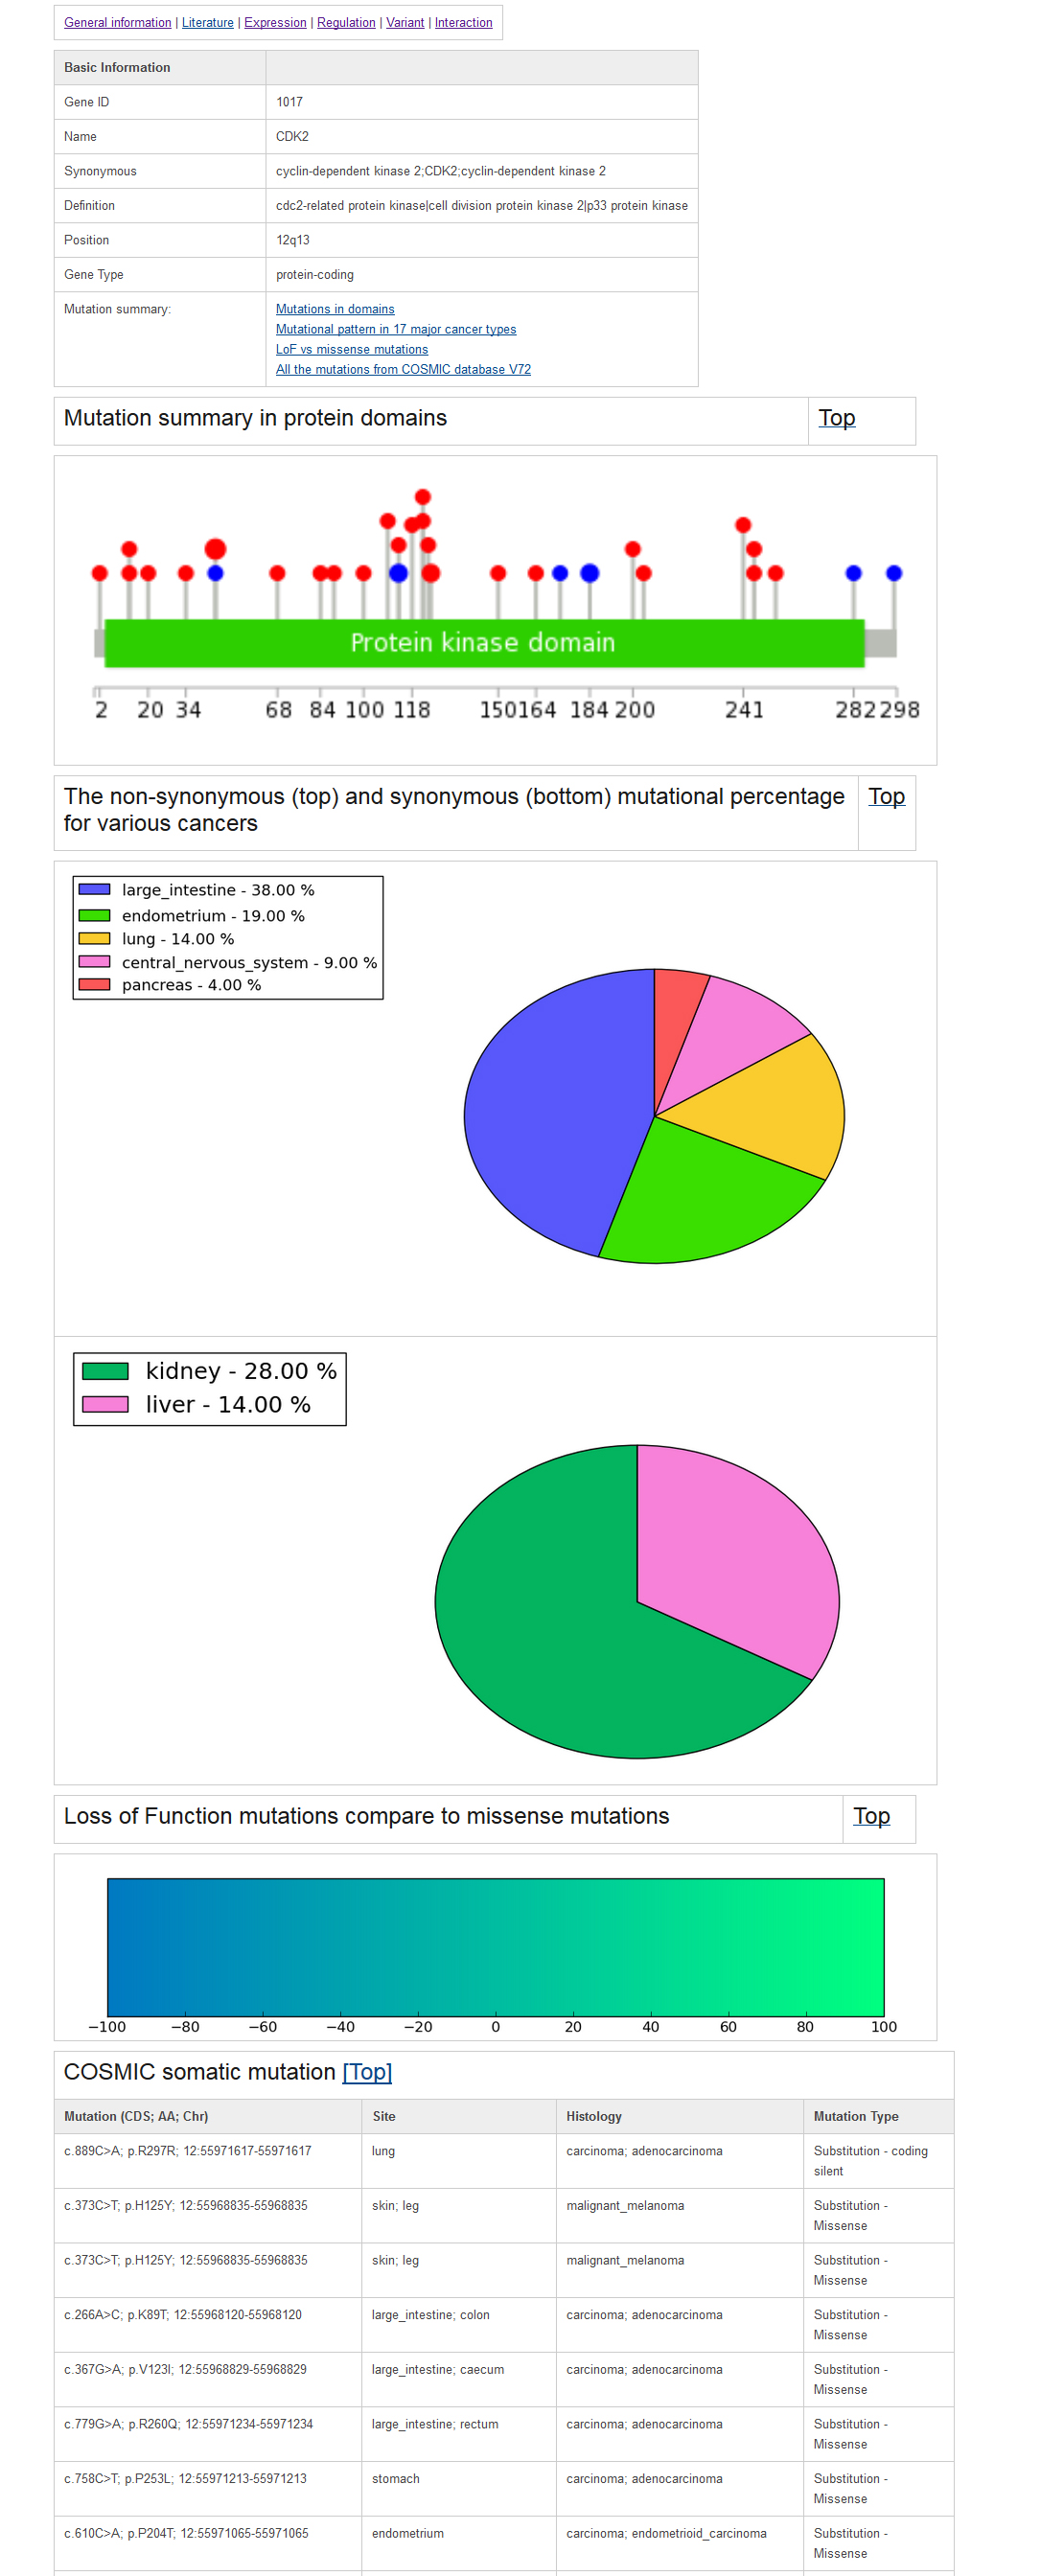
Example gene mutation page:All the related mutations were collected from the COSMIC (V72) database; we further divided the mutations into three main types, including "Substitution," "Insertion & Deletion," and "Other mutation." To explore the cancer mutational pattern in multiple cancers and functional domains, we first used Lollipop plots to visualize the point mutations along the functional domain in each TSG. The protein domain annotation were incorporated from the UniProt database. These plots will help users to obtain a quick impression about where the hotspot mutation sites in each TSGs are (See the example as below). In addition, we used the circle size to represent the number of mutations. The sites with relatively more mutations are plotted in bigger dots. To provide an overview of the most prevalent cancer mutations, we focused on 17 major cancer type and plotted the mutation frequency for each cancer types. The recent study titled "Cumulative Haploinsufficiency and Triplosensitivity Drive Aneuploidy Patterns to Shape the Cancer Genome" (2013, cell) showed that the cumulative haploinsufficiency and triplosensitivity of tumor suppressor genes may drive cancer aneuploidy. To provide digested information on this, we compared the mutation pattern of Loss-of-Function mutations compared to missense mutations for all the tumor suppressors using COSMIC data. We defined the Loss-of-Function mutations using the following annotation from COSMIC: Deletion - Frameshift, Whole gene deletion, Complex - deletion inframe, Deletion - In frame, Insertion - Frameshift, Frameshift, Substitution - Nonsense. Next we counted the Loss-of-Function mutations and missense mutations for each tumor suppressor. The final results are represented as a bar plot below. In the plot, the blue color shows the relative number of loss of function mutations and the green color indicates the relative number of missense mutations. Using these plots, we found that TP53 was showed totally loss of function mutation patterns. PTEN represents in the middle of the two mutational categories. AKT1 represents loss of function mutational feature which is less than TP53. BRCA1 shows a slightly stronger loss of function mutation pattern compared to missense mutation. By using this mutation pattern bar plot, users can obtain an overview of tumor suppressor mutational characteristics more easily.
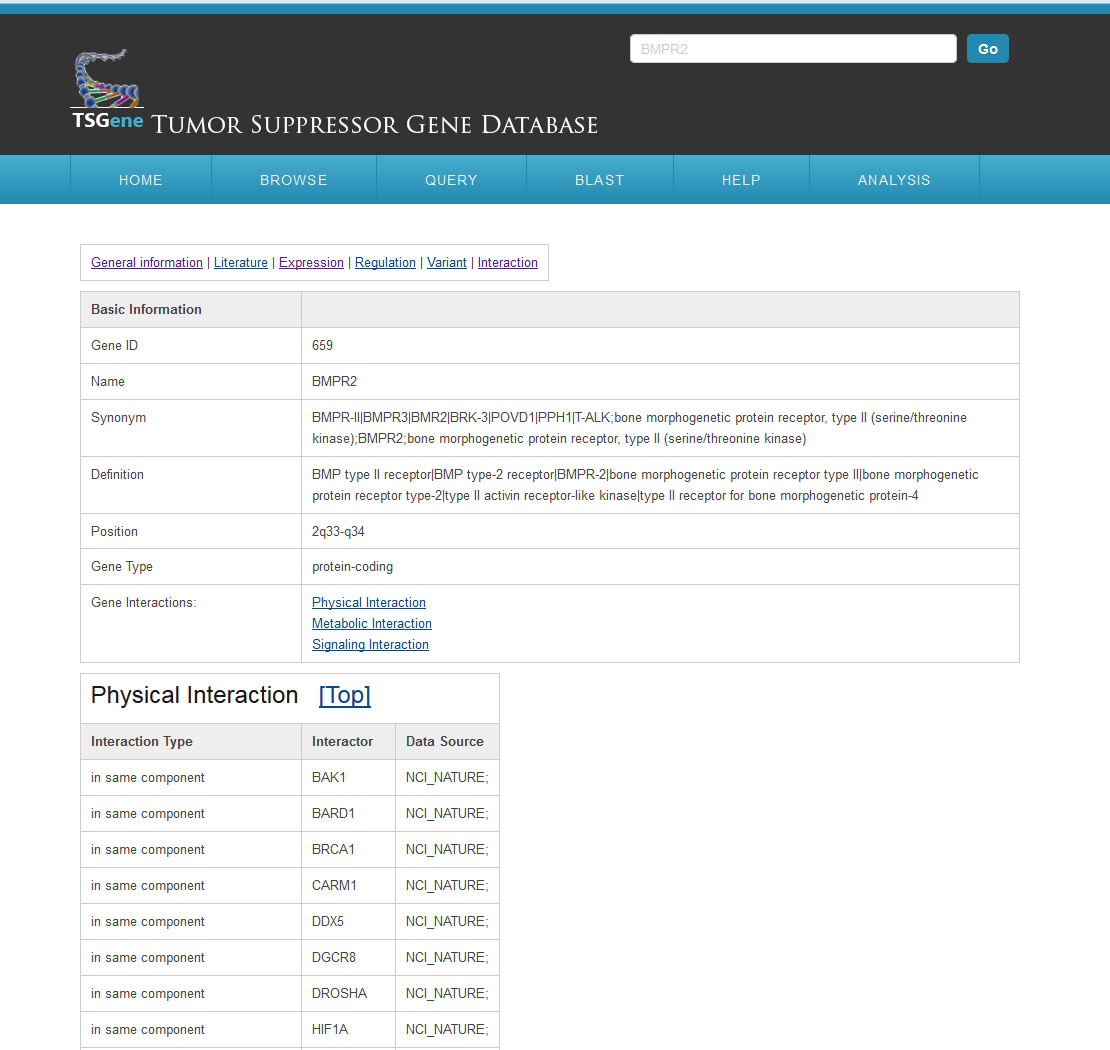
The gene interaction page appears as follows:All the related protein-protein interactions were collected from the PathwayCommon database; we further divided the interactions into three main types, including "Physical Interaction," "Metabolic Interaction," and "Signaling Interaction."
|
|
|
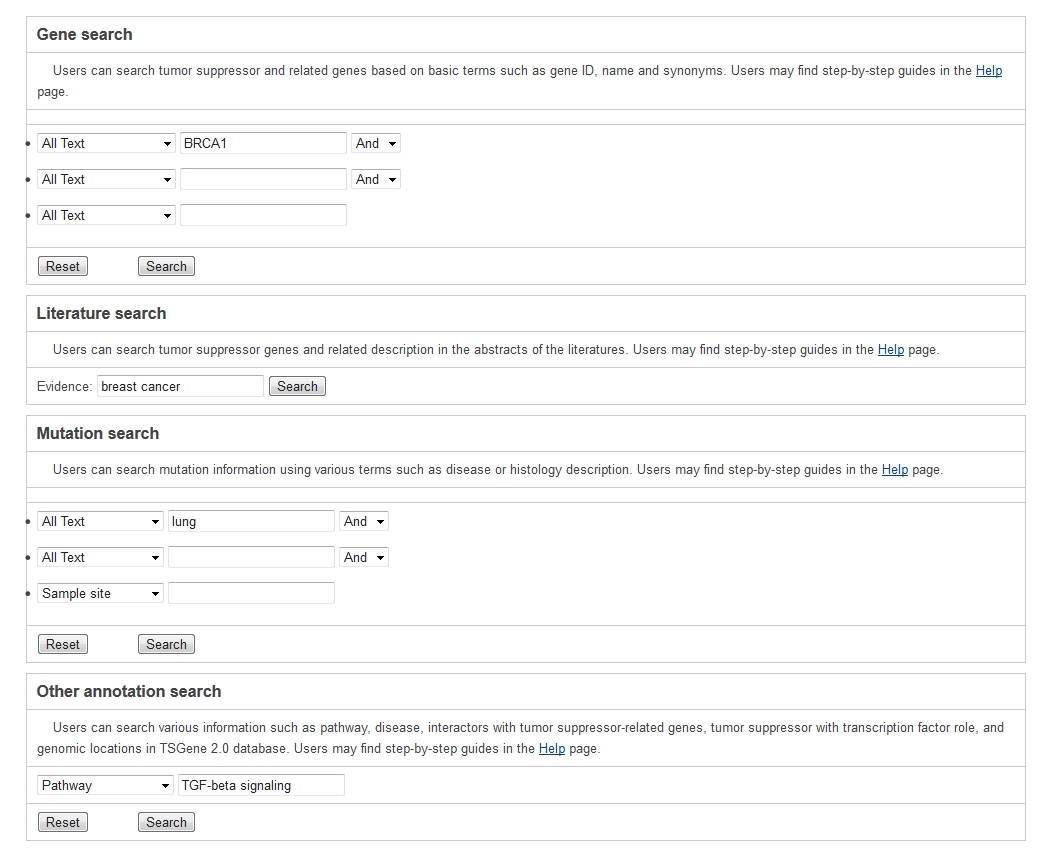
All the tumor suppressor genes and their annotations in our database are searchable. The text search (Query) and sequence-based blast (Blast) are provided. Text search of various annotation in our databaseUsers can search against the TSGene by typing TSG's name, accession IDs and its characteristics, including genomic location, regulatory, interaction partner, mutation, biological pathway, and genetic disease. In total, we provided four different search forms for users, including "Gene General Information Search", "Literature Search", "Mutation Search", and "Other Annotation Search" to allow users to access general information, literature-based information, mutation, and other annotation information respectively.
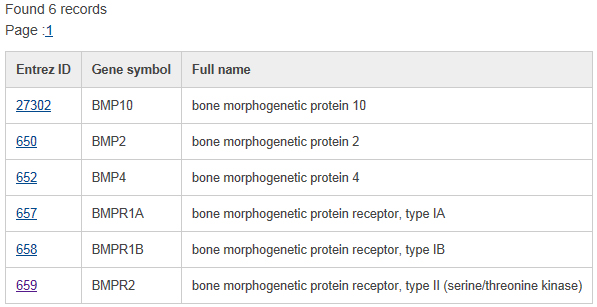
The search is performed by typing keywords into any field separately or into several fields simultaneously in the query forms. Generally, text search information in each searching form mainly includes three steps. Take the basic information query as an example below. select a specific annotation or field from the dropdown menu in basic gene information and mutation query forms. Input your interesting keyword. In addition, the basic gene information and mutation query forms support the logical 'And,' 'Or,' and 'Not' operators to combine multiple keywords. The search result shows the list of matched tumor suppressor genes linked to the detailed gene information page below.
Quick search a list of genes in database:To quickly access the information in the database, a quick search form is provided at the top of each page.
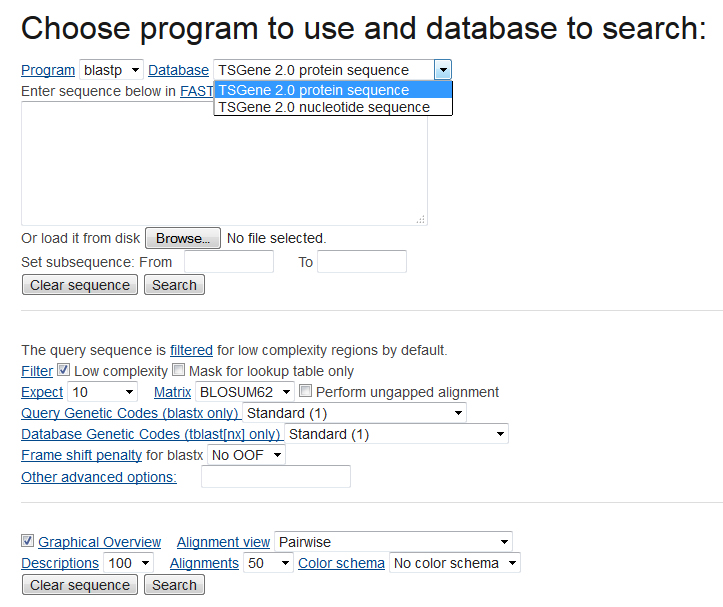
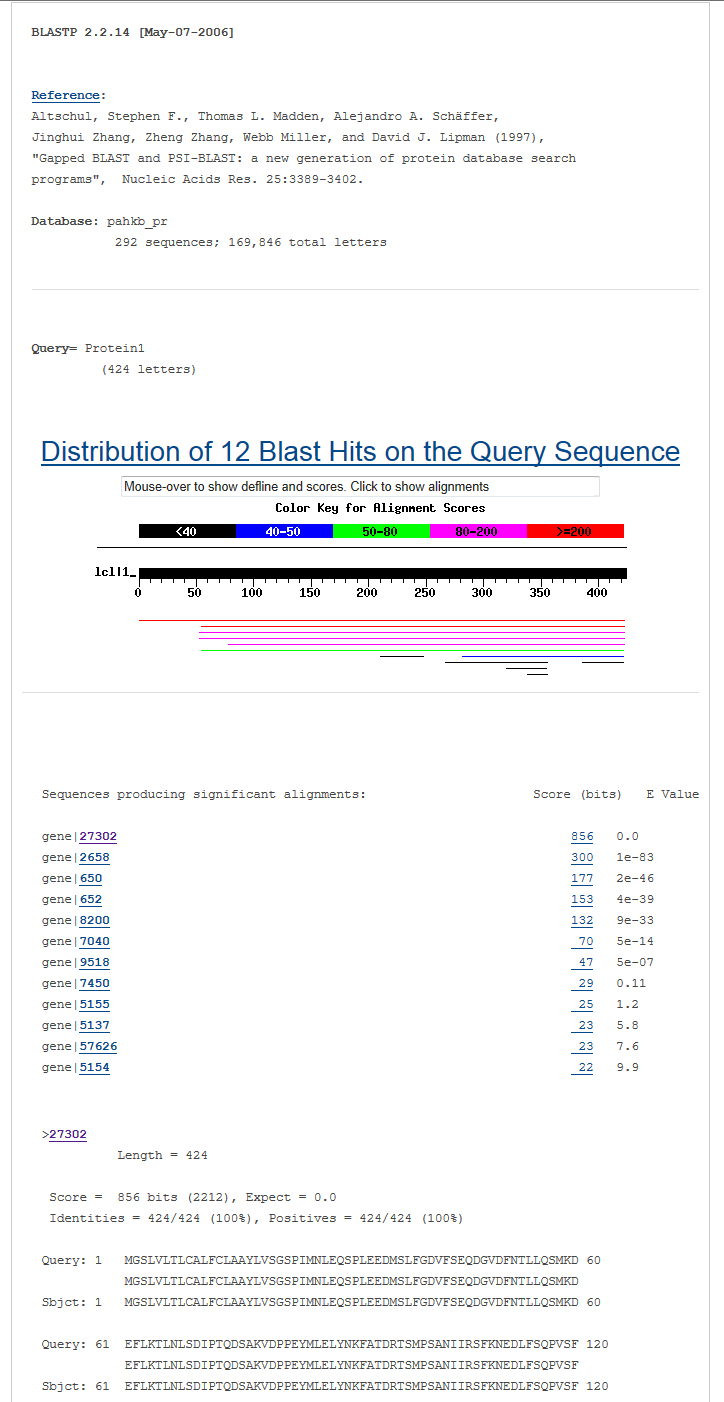
Blast all sequences of genes in our databaseIn the BLAST menu, users can search the TSGene database based on their input sequences. The high similarity tumor suppressor genes with input sequences will be listed in the BLAST result page. In the input page, users can choose various sequence alignment options such as E-value and identity. The matched sequence signatures are visualized on the query sequence with colored bars containing the alignment score. To do a sequence-based search for all the tumor suppressor genes, please access the BLAST page.
The output of BLAST is as below |
Browse database [ top ] |
|
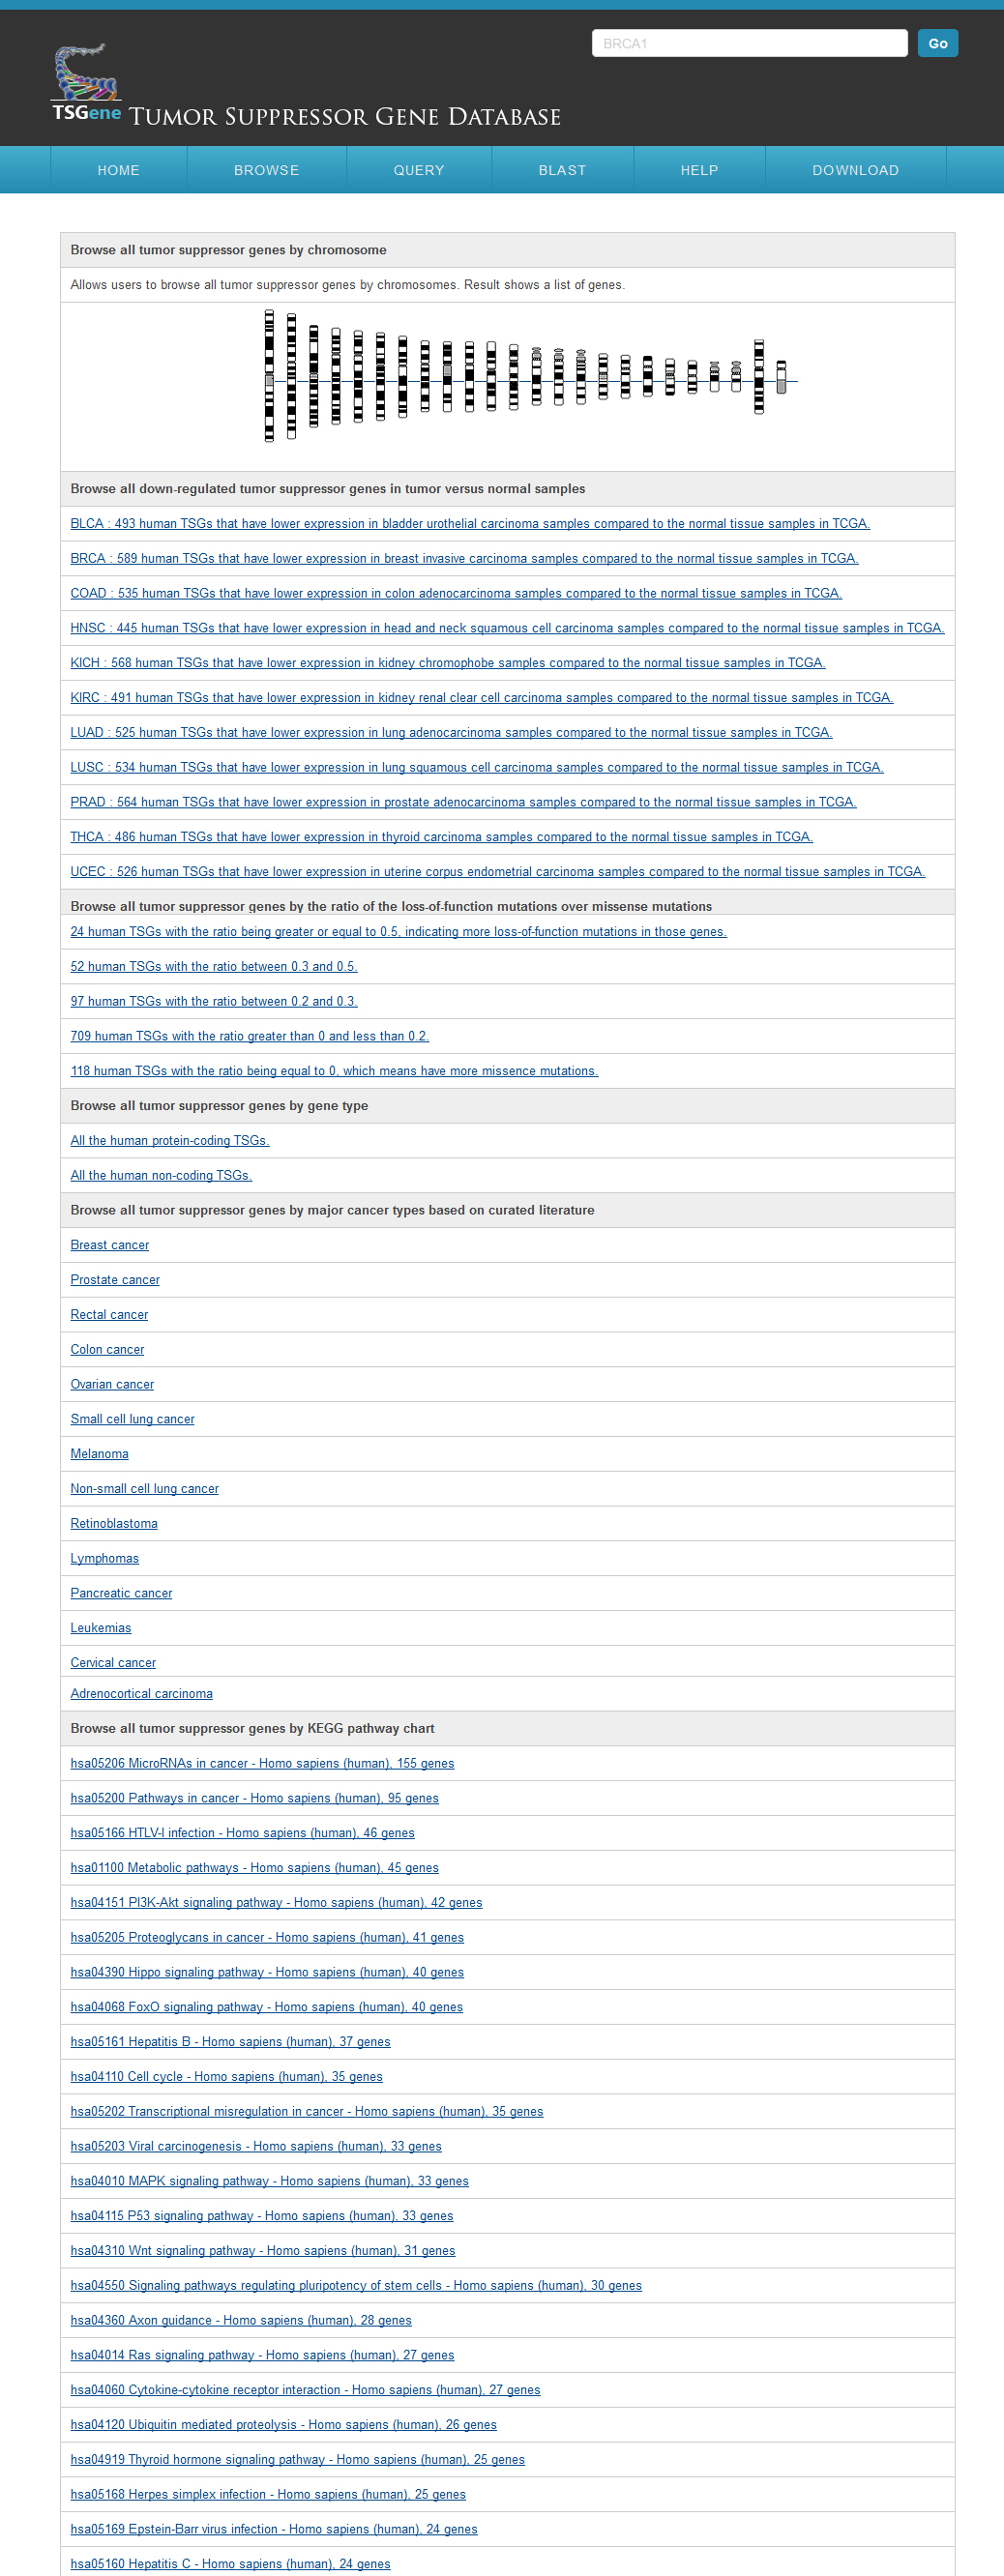
The TSGene database supports browsing tumor suppressor genes using cancer types and KEGG pathway maps. In the cancer type page, users can explore the tumor suppressor genes within specific cancers easily among organized cancer types from NCI. In addition, to help users get a bird's eye view for biological processes of tumor suppressor genes, the marked KEGG maps were provided. Users can browse the tumor suppressor gene of TSGene with their annotated feature list rather than the cancer classification and marked KEGG maps. TSGene also supports annotation-based browsing including chromosome, gene type, data source, data quality. |
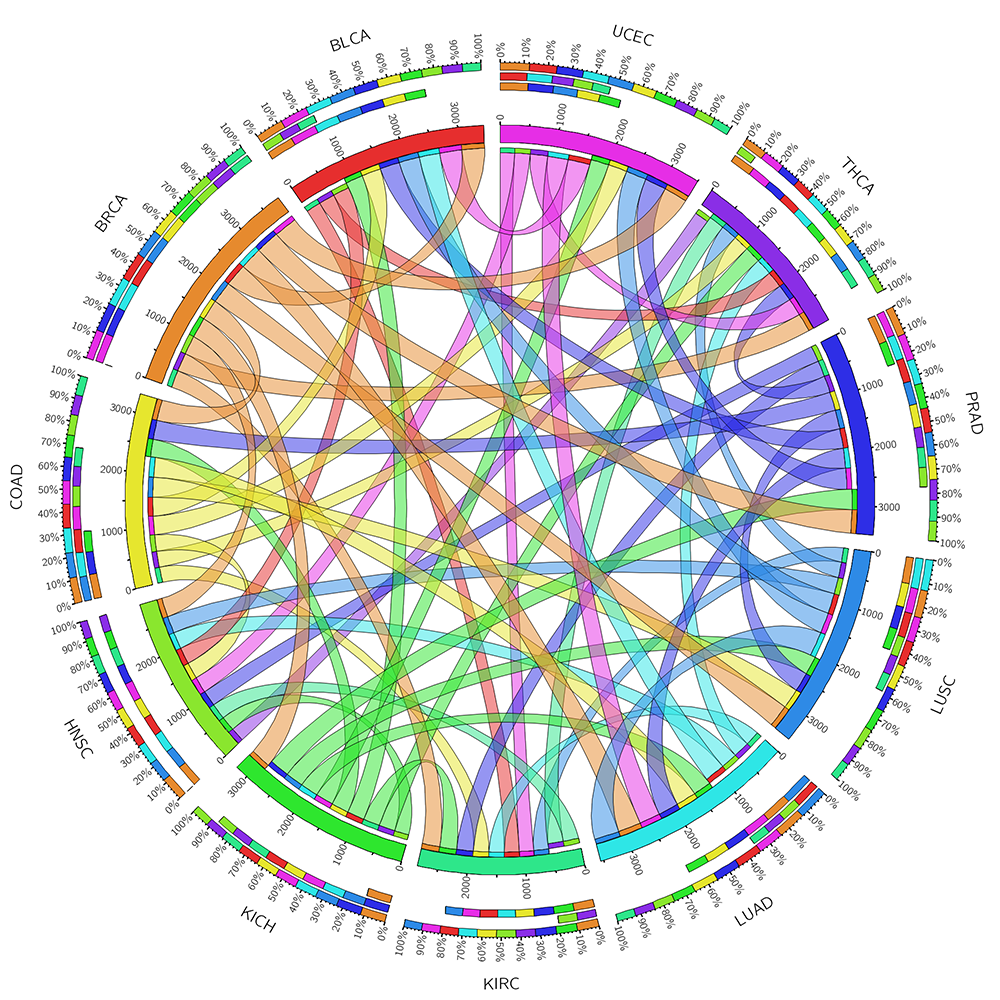
Browse by chromosome and gene typeFrom the Browser page, users can access the tumor suppressor gene lists using six browsing functions: genomic location, TCGA pan-cancer gene expression analysis results, COSMIC pan-cancer mutational pattern, gene types, major cancer types and the associated KEGG pathways. For the gene types, user can find all the protein coding and recently reported non-coding tumor suppressor genes in the browser page. Users can easily browser all the cancer types according to NCI cancer classifiction system. Users can also visulize all the KEGG pathways with any tumor suppressor genes recorded in our database. or all the protein-coding TSGs, we also performed differential expression analysis between tumor and normal samples in 11 cancer types. We first extracted RNASeqV2 normalized gene expression data from TCGA using the R package TCGA-Assembler (data release date is Jan-05-2015). We further conducted t-test for each TSGs in each cancer types comparing the differential gene expression pattern between normal and cancer samples. Using the corrected P-value 0.05 as cutoff, we identified hundreds TSGs that are significantly down-regulated in tumor samples. To provide a bird view of the expression trends across multiple cancers, we also plotted all the TSGs’ expression in normal and cancer samples across 11 cancer types. Following recent study on comparing tumor suppressors and oncogenes, which showed that the cumulative haploinsufficiency and triplosensitivity of tumor suppressor may drive cancer aneuploidy, we classified TSGs in our database based on the ratio between loss-of-function mutations and missence mutations. In the plot, the blue color is showing the relative number of loss of fucntion mutations and the green color is for the relative number of missense mutations. Using these plots, we found that TP53 was showing totally loss of function mutation patterns. PTEN is showing in the middle of the two mutational categories. AKT1 is also showing loss of function mutational feature which is less than TP53. The other example on BRCA1 is that a little stronger loss of function mutation pattern comparing to missense mutation. By using this mutation pattern bar plot, use can obtain an overview of tumor suppressor mutational characteristics more easily.
|
Data download and feedback [ top ] |
Data is freely available for academic use. For commercial use, please contact us. The data can be downloaded from the Download page.We hope you can help us improve our database.If you have any suggestion, or know some information is incorrect, or have new tumor suppressor genes (both coding and non-coding), please feel free to send us via email. |