 |
| |
| |
| |
| |
| |
| |
|

| TissGeneSummary for ADORA3 |
 Gene summary Gene summary |
| Basic gene information | Gene symbol | ADORA3 |
| Gene name | adenosine A3 receptor | |
| Synonyms | A3AR | |
| Cytomap | UCSC genome browser: 1p13.2 | |
| Type of gene | protein-coding | |
| RefGenes | NM_000677.3, NM_001302678.1,NM_001302679.1, | |
| Description | adenosine receptor A3 | |
| Modification date | 20141207 | |
| dbXrefs | MIM : 600445 | |
| HGNC : HGNC | ||
| Ensembl : ENSG00000121933 | ||
| HPRD : 08984 | ||
| HPRD : 12424 | ||
| Vega : OTTHUMG00000011957 | ||
| Protein | UniProt: go to UniProt's Cross Reference DB Table | |
| Expression | CleanEX: HS_ADORA3 | |
| BioGPS: 140 | ||
| Pathway | NCI Pathway Interaction Database: ADORA3 | |
| KEGG: ADORA3 | ||
| REACTOME: ADORA3 | ||
| Pathway Commons: ADORA3 | ||
| Context | iHOP: ADORA3 | |
| ligand binding site mutation search in PubMed: ADORA3 | ||
| UCL Cancer Institute: ADORA3 | ||
| Assigned class in TissGDB* | C | |
| Included tissue-specific gene expression resources | TiGER,GTEx | |
| Specific-tissues in normal samples (assigned by TissGDB using HPA, TiGER, and GTEx) | Testis | |
| Cancer types related to the specific-tissues in cancer samples (assigned by TissGDB using TCGA) | TGCT | |
| Reference showing the relevant tissue of ADORA3 | ||
| Description by TissGene annotations | ||
| * Class A consists of genes with literature evidence and is part of the cTissGenes. Class B consists of only cTissGenes without additional evidence. The remaining genes belong to Class C. |
| Gene ontology having evidence of Inferred from Direct Assay (IDA) from Entrez |
| GO ID | GO term | PubMed ID |
| Top |
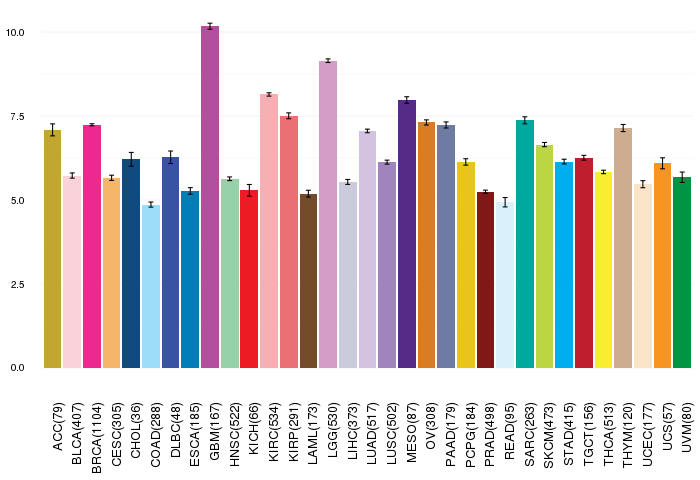
| TissGeneExp for ADORA3 |
| Gene expressions across 28 cancer types (X-axis: cancer type and Y-axis: log2(norm_counts+1)) (TCGA IlluminaHiSeq_RNASeqV2, pan-cancer normalized log2(norm_counts+1) data, version 2016-08-16) |
 |
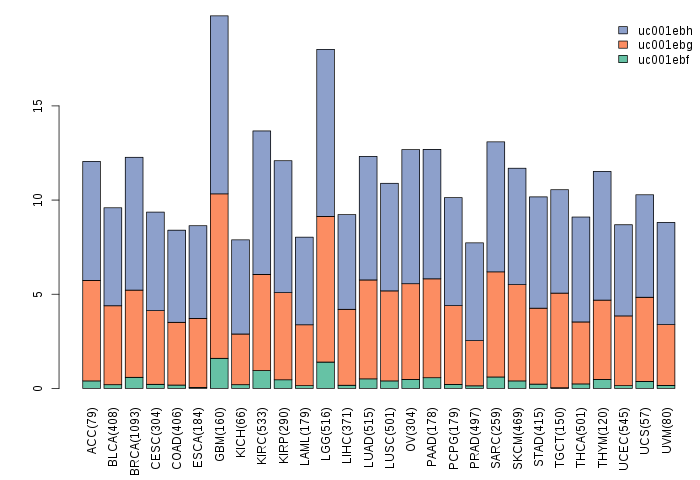
| Gene isoform expressions across 28 cancer types (X-axis: cancer type and Y-axis: log2(norm_counts+1)) (TCGA pan-cancer tcga_rsem_isoform_tpm, version 2016-09-01) |
 |
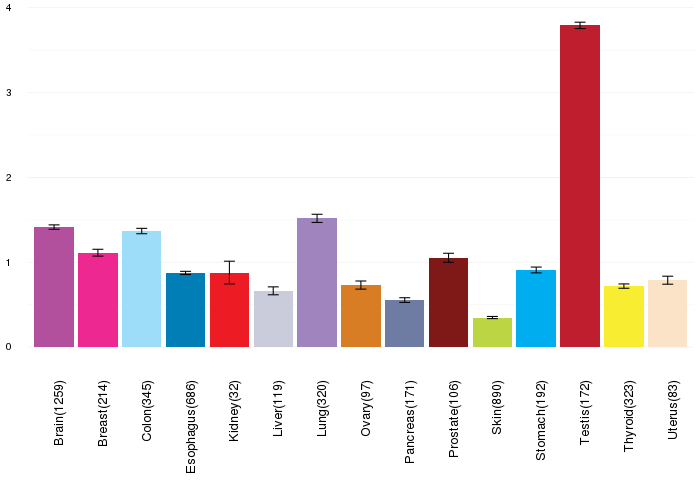
| Gene expressions across normal tissues of GTEx data (GTEx GTEx_Analysis_v6_RNA-seq_RNA-SeQCv1.1.8_gene_rpkm.gct) - Here, we shows the matched tissue types only among our 28 cancer types. |
 |
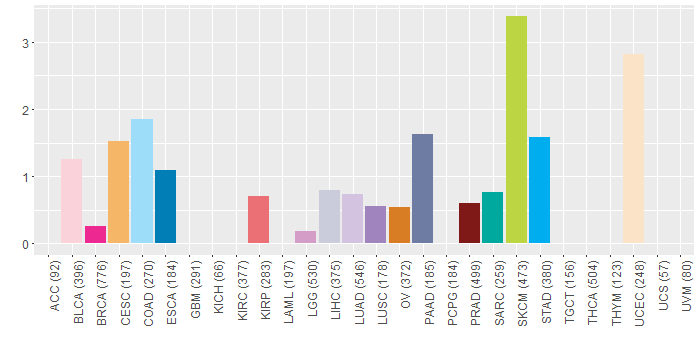
| Different expressions across 14 cancer types with more than 10 samples between matched tumors and normals (X-axis: cancer type and Y-axis: log2(norm_counts+1)) (TCGA IlluminaHiSeq_RNASeqV2, pan-cancer normalized log2(norm_counts+1) data, version 2016-08-16) |
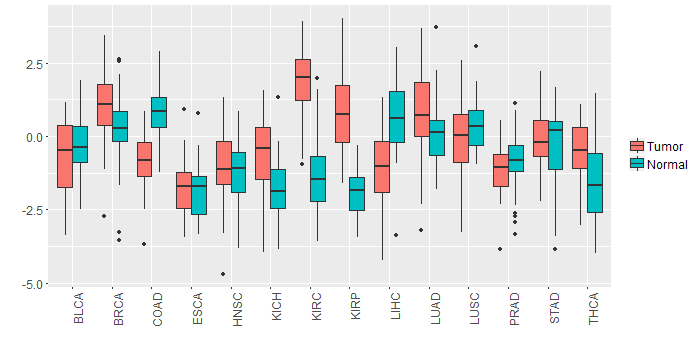 |
| - Significantly differentially expressed cancer types and information. (|Fold change|>1 and FDR<0.05) |
| Cancer type | Mean(exp) in tumor | Mean(exp) in matched normal | Log2FC | P-val. | FDR |
| KIRC | 1.930556717 | -1.452908561 | 3.383465278 | 2.15E-36 | 6.34E-35 |
| LIHC | -1.068623061 | 0.602150939 | -1.670774 | 5.10E-10 | 5.87E-09 |
| KIRP | 0.800819564 | -1.958780436 | 2.7596 | 3.77E-12 | 5.60E-11 |
| COAD | -0.930240292 | 0.820994323 | -1.751234615 | 2.10E-08 | 1.71E-07 |
| KICH | -0.598317061 | -1.729905061 | 1.131588 | 0.00257 | 0.005158725 |
| Top |
| TissGene-miRNA for ADORA3 |
| Significantly anti-correlated miRNAs of TissGene across 28 cancer types (Gene-miRNA relations from TargetScanHuman Relsease 7.1, Conserved_Site_Context_Scores.txt.zip, 06.01.2016) (TCGA IlluminaHiSeq_miRNASeq, log2(RPM+1) data, version 2016-11-21) (TCGA IlluminaHiSeq_RNASeqV2, log2(normalized_count+1) data, version 2016-08-16) (Spearman’s Rank Correlation (p-value<0.05 and coefficient<-0.25)) |
| Cancer type | miRNA id | miRNA accession | P-val. | Coeff. | # samples |
| Top |
| TissGeneMut for ADORA3 |
| TissGeneSNV for ADORA3 |
| nsSNV counts per each loci. Different colors of circles represent different cancer types. Circle size denotes number of samples. (TCGA somatic mutation (SNPs and small INDELs) data, version 2016-04-25) * Click on the image to enlarge it in a new window. |
 |
 |
| Somatic nucleotide variants of TissGene across 28 cancer types (X-axis: cancer type and Y-axis: % of mutated samples) The numbers in parentheses are numbers of samples with mutation (nsSNVs). (TCGA somatic mutation (SNPs and small INDELs) data, version 2016-04-25) |
 |
| - nsSNVs sorted by frequency. |
| AAchange | Cancer type | # samples |
| p.R205W | UCEC | 1 |
| p.I253M | CESC | 1 |
| p.G177E | SKCM | 1 |
| p.N327K | KIRP | 1 |
| p.S231A | STAD | 1 |
| p.T211M | COAD | 1 |
| p.D166N | SKCM | 1 |
| p.Y15C | PRAD | 1 |
| p.L31F | CESC | 1 |
| p.W20X | SKCM | 1 |
| p.R285C | STAD | 1 |
| p.E17K | SKCM | 1 |
| p.D247N | SKCM | 1 |
| p.A195T | LUSC | 1 |
| p.R205Q | SKCM | 1 |
| p.R189Q | STAD | 1 |
| p.M18I | SKCM | 1 |
| p.P145L | SKCM | 1 |
| p.A105T | LGG | 1 |
| p.E259K | SKCM | 1 |
| p.E19K | PAAD | 1 |
| p.T169M | HNSC | 1 |
| p.S271F | SKCM | 1 |
| p.H95L | LIHC | 1 |
| p.D175N | COAD | 1 |
| p.I27T | BLCA | 1 |
| p.R289H | UCEC | 1 |
| p.R159K | SKCM | 1 |
| p.D288G | UCEC | 1 |
| p.R205W | SKCM | 1 |
| p.R112C | SKCM | 1 |
| p.A178S | LIHC | 1 |
| p.R289H | BRCA | 1 |
| p.D213N | SKCM | 1 |
| p.W128* | SKCM | 1 |
| p.L90V | DLBC | 1 |
| p.P279H | COAD | 1 |
| p.G258E | SKCM | 1 |
| p.S306P | BLCA | 1 |
| p.I59V | SARC | 1 |
| p.S271* | CESC | 1 |
| p.K119R | BLCA | 1 |
| p.A105T | STAD | 1 |
| p.K282N | KIRP | 1 |
| p.M66T | ESCA | 1 |
| p.I301N | BLCA | 1 |
| p.K274N | UCEC | 1 |
| p.D153A | LUAD | 1 |
| p.S165* | LUAD | 1 |
| p.E19K | SKCM | 1 |
| p.Y81C | SARC | 1 |
| p.E21K | SKCM | 1 |
| p.A96T | COAD | 1 |
| p.E340K | SKCM | 1 |
| p.L297F | SKCM | 1 |
| p.A170T | STAD | 1 |
| p.I20L | LGG | 1 |
| p.D158N | UCEC | 1 |
| p.A195T | PAAD | 1 |
| p.A105T | LUAD | 1 |
| p.A240T | LIHC | 1 |
| p.S35L | BLCA | 1 |
| p.W20* | SKCM | 1 |
| p.G29D | UCEC | 1 |
| p.A240T | COAD | 1 |
| p.F80Y | OV | 1 |
| p.V171I | PAAD | 1 |
| p.R205Q | LUAD | 1 |
| p.L183F | PRAD | 1 |
| p.R289H | ESCA | 1 |
| p.T221I | HNSC | 1 |
| p.R193C | SKCM | 1 |
| p.W187L | HNSC | 1 |
| p.C174Y | BRCA | 1 |
| p.M174I | OV | 1 |
| p.A299S | PRAD | 1 |
| p.V171I | UCEC | 1 |
| p.V116I | STAD | 1 |
| Top |
| TissGeneCNV for ADORA3 |
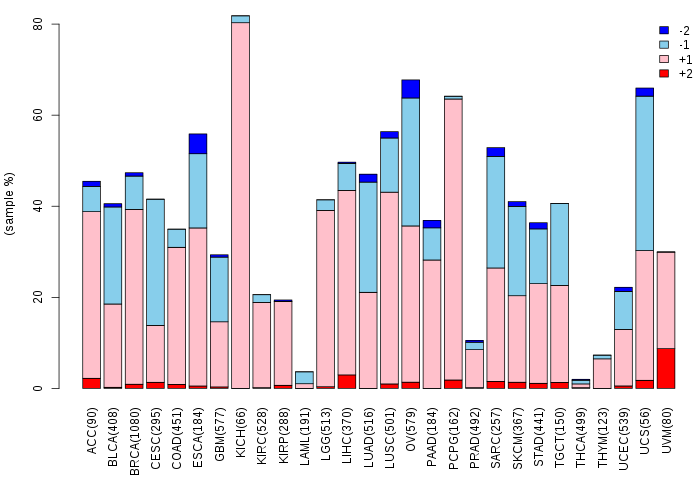
| Copy number variations of TissGene across 28 cancer types (X-axis: cancer type and Y-axis: % of CNV samples) (TCGA Gistic2_CopyNumber_Gistic2_all_data_by_genes, Gistic2 copy number data, version 2016-08-16) |
 |
| Top |
| TissGeneFusions for ADORA3 |
| Fusion genes including TissGene (ChimerDB 3.0, 2016-12-01 and TCGA fusion Portal 2015-12-01) |
| Database | Src | Cancer type | Sample | Fusion gene | ORF | 5'-gene BP | 3'-gene BP |
| Chimerdb3.0 | ChiTaRs | NA | AF226731 | TRIP4-ADORA3 | chr15:64713987 | chr1:112025970 | |
| Chimerdb3.0 | ChiTaRs | NA | AV705429 | TRIP4-ADORA3 | chr15:64713987 | chr1:112031298 | |
| TCGAfusionPortal | PRADA | BRCA | TCGA-A2-A0YE-01A | GDAP2-ADORA3 | Out-of-frame | Chr1:118420631 | Chr1:112043178 |
| TCGAfusionPortal | PRADA | LUAD | TCGA-50-5066-01A | TMED5-ADORA3 | Out-of-frame | Chr1:93645611 | Chr1:112028462 |
| Top |
| TissGeneNet for ADORA3 |
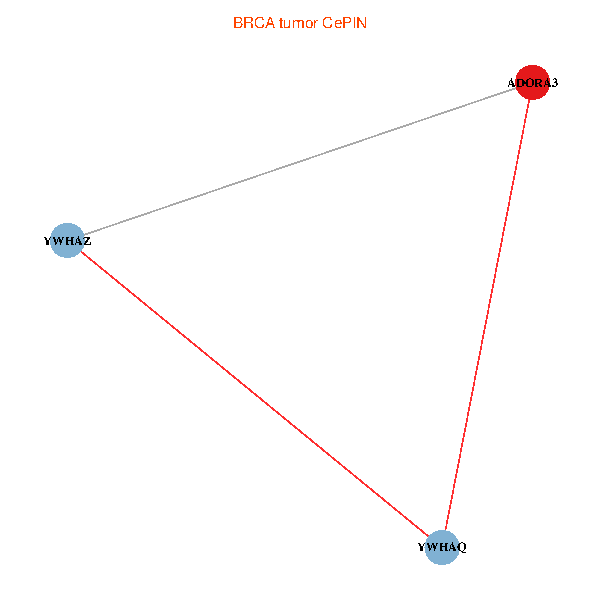
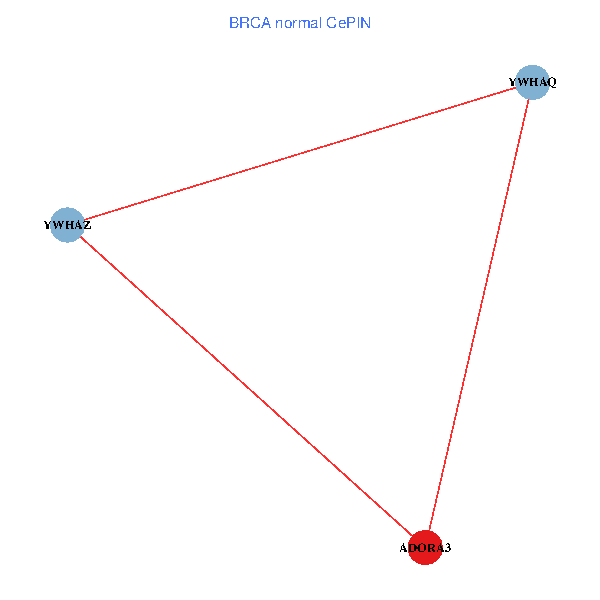
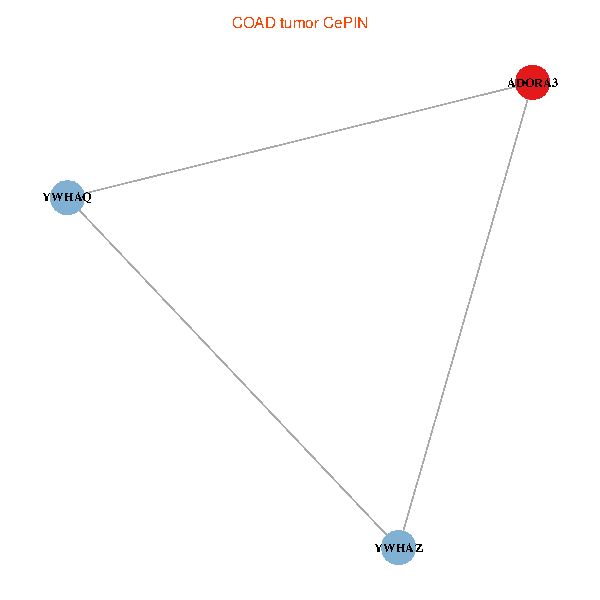
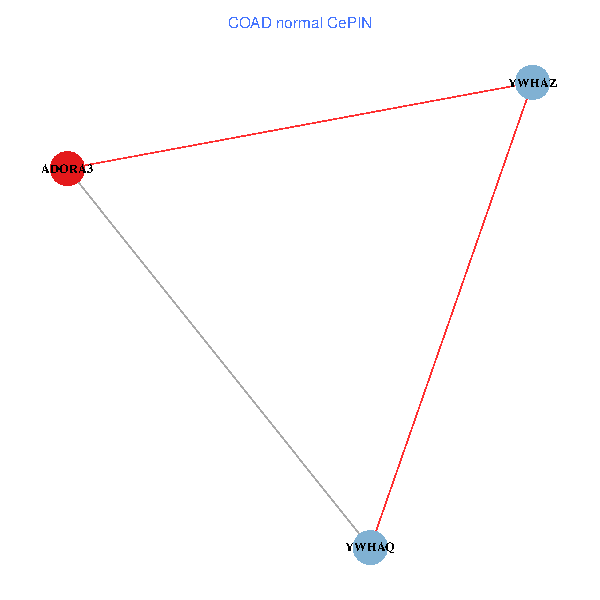
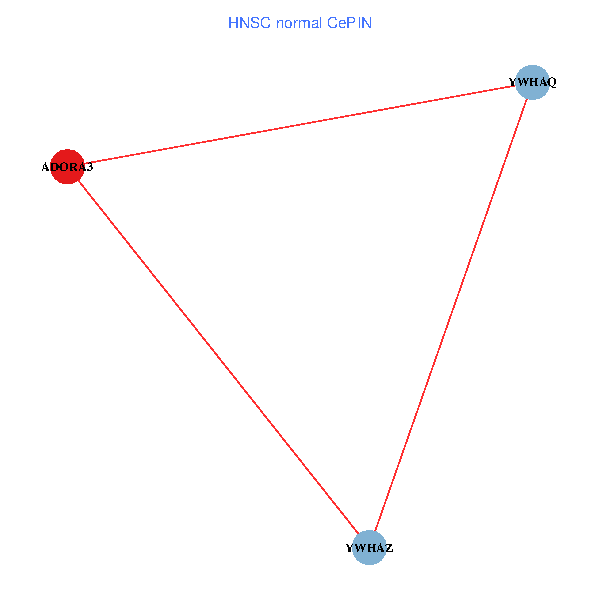
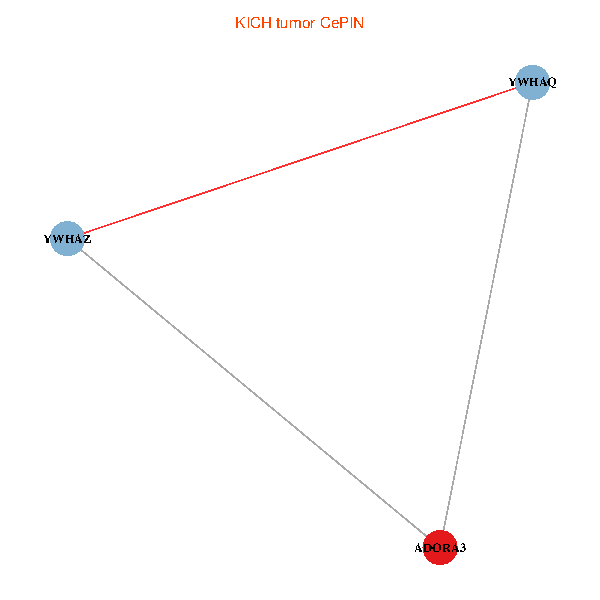
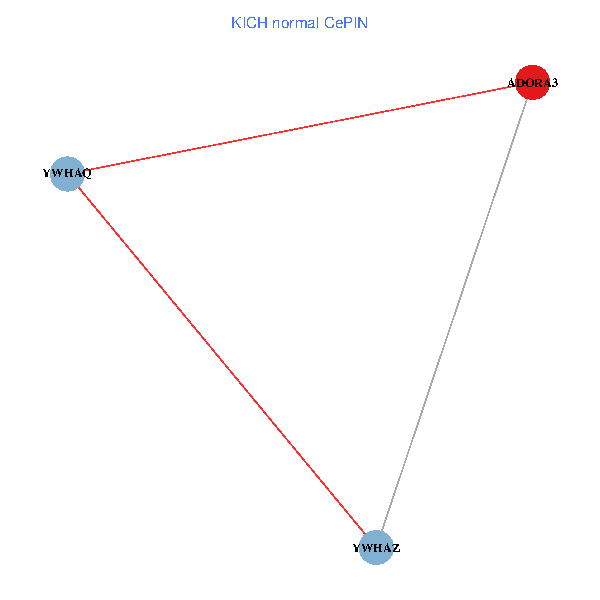
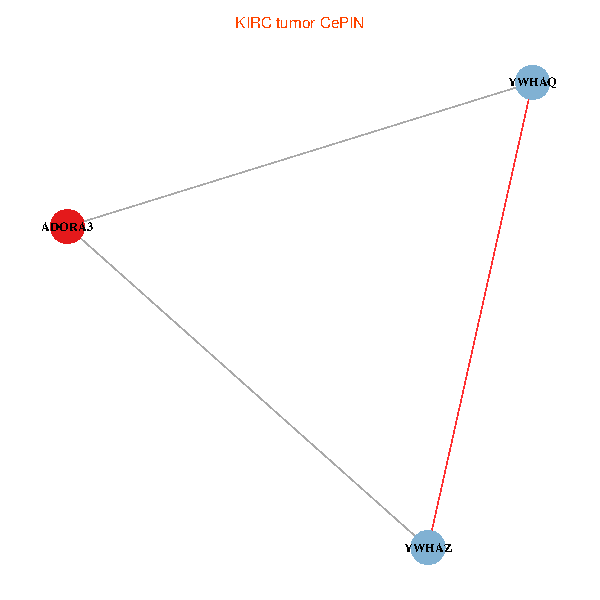
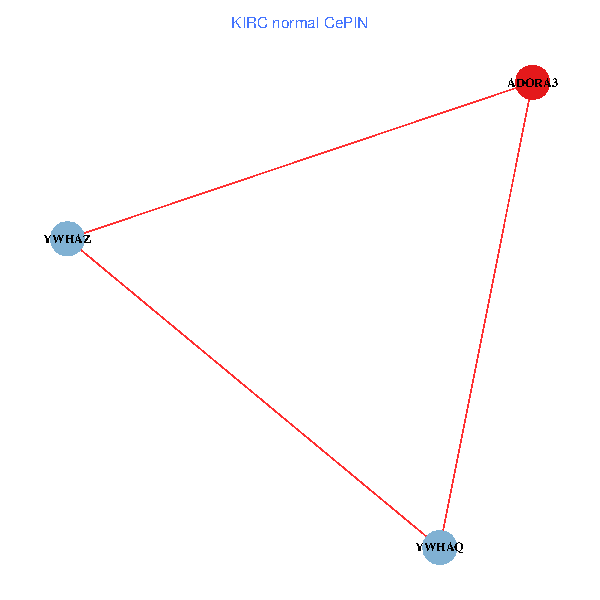
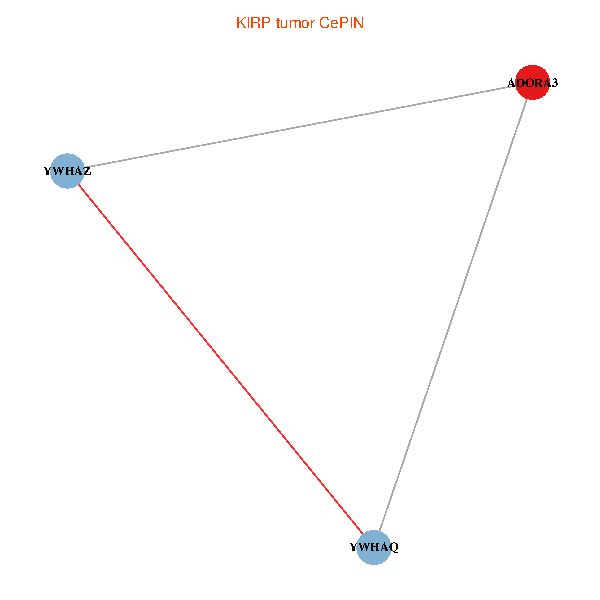
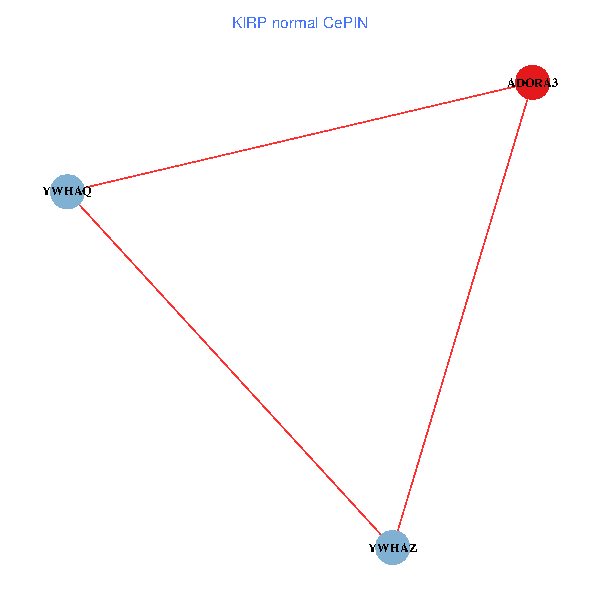
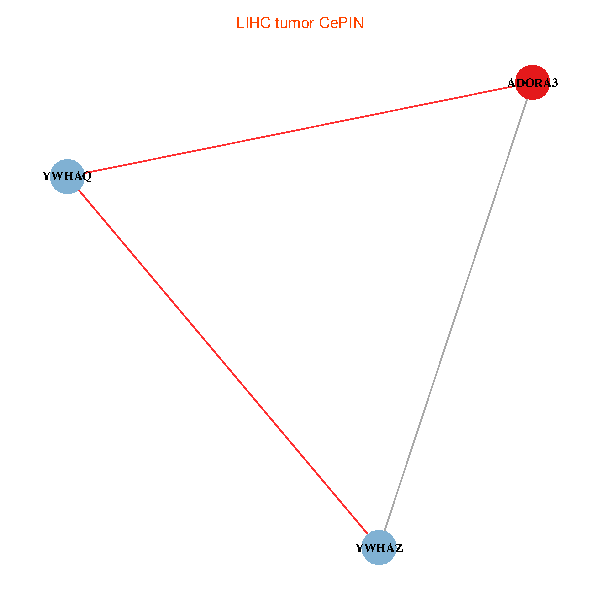
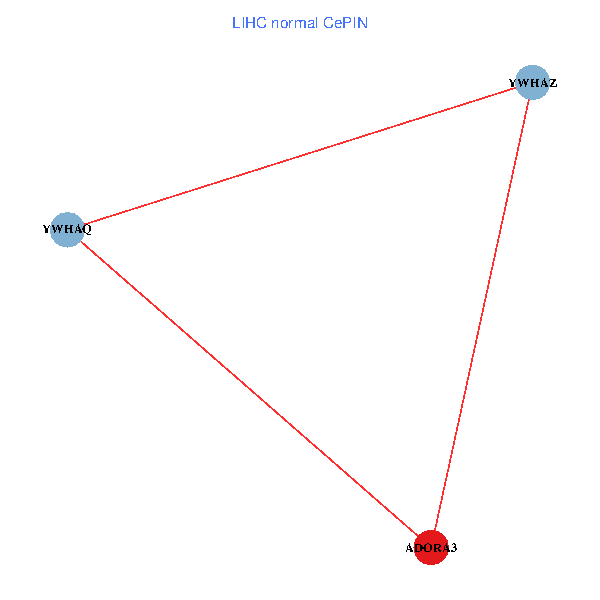
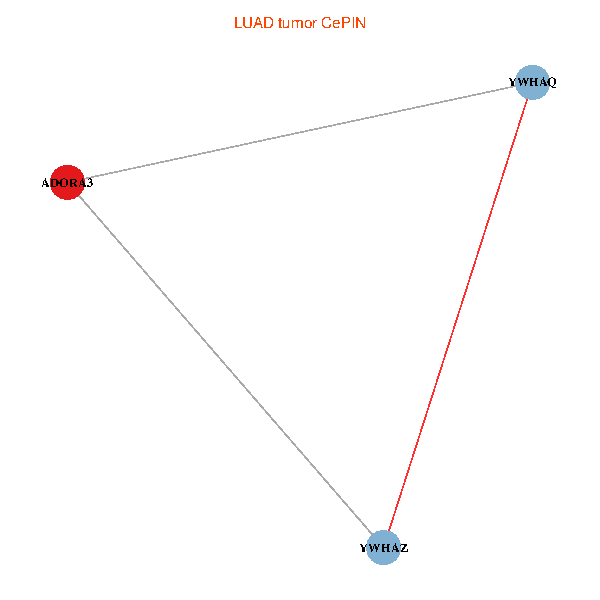
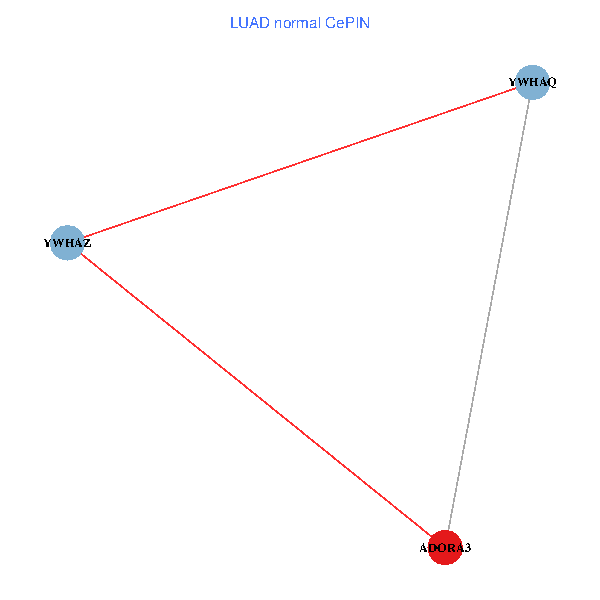
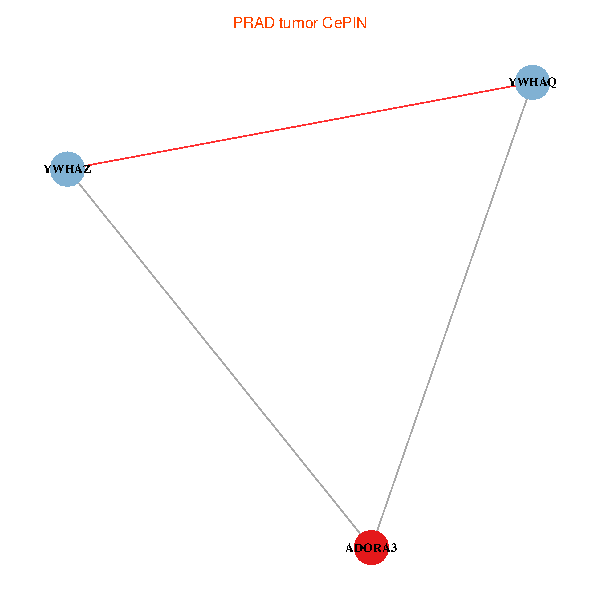
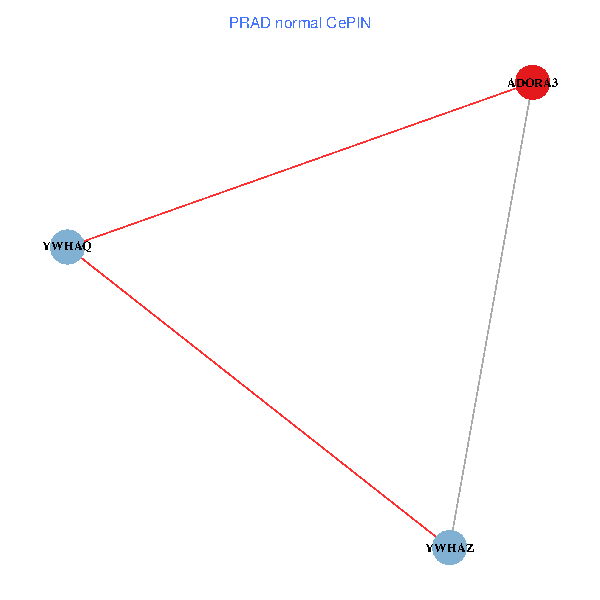
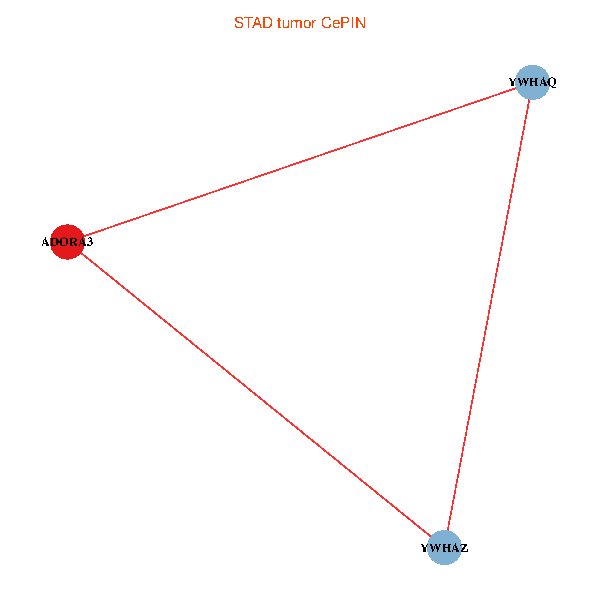
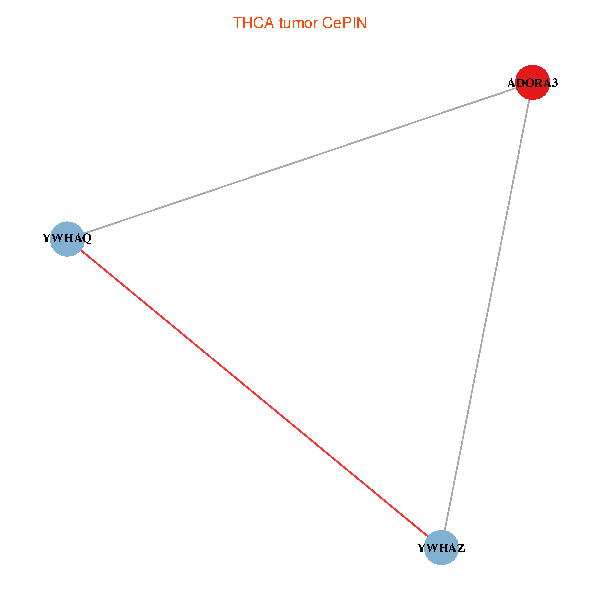
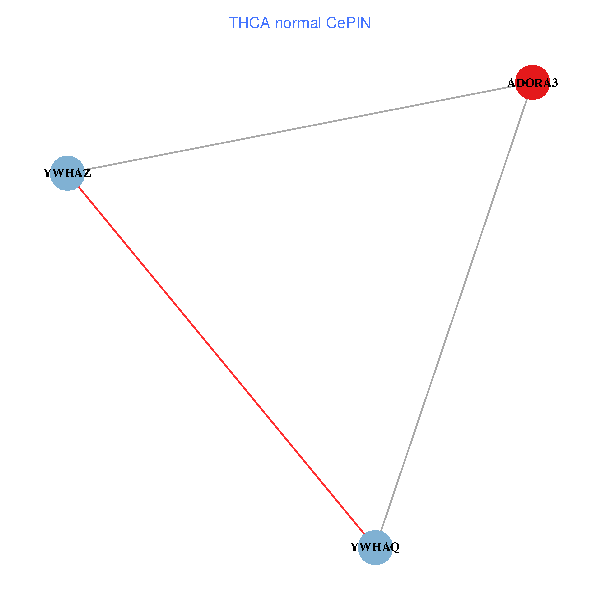
| Co-expressed gene networks based on protein-protein interaction data (CePIN) (TCGA IlluminaHiSeq_RNASeqV2, pan-cancer normalized log2(norm_counts+1) data, version 2016-08-16) (PINA2 ppi data) |
| BRCA (tumor) | BRCA (normal) |
| ADORA3, YWHAZ, YWHAQ (tumor) | ADORA3, YWHAZ, YWHAQ (normal) |
 |  |
| COAD (tumor) | COAD (normal) |
| ADORA3, YWHAZ, YWHAQ (tumor) | ADORA3, YWHAZ, YWHAQ (normal) |
 |  |
| HNSC (tumor) | HNSC (normal) |
| ADORA3, YWHAZ, YWHAQ (tumor) | ADORA3, YWHAZ, YWHAQ (normal) |
 |  |
| KICH (tumor) | KICH (normal) |
| ADORA3, YWHAZ, YWHAQ (tumor) | ADORA3, YWHAZ, YWHAQ (normal) |
 |  |
| KIRC (tumor) | KIRC (normal) |
| ADORA3, YWHAZ, YWHAQ (tumor) | ADORA3, YWHAZ, YWHAQ (normal) |
 |  |
| KIRP (tumor) | KIRP (normal) |
| ADORA3, YWHAZ, YWHAQ (tumor) | ADORA3, YWHAZ, YWHAQ (normal) |
 |  |
| LIHC (tumor) | LIHC (normal) |
| ADORA3, YWHAZ, YWHAQ (tumor) | ADORA3, YWHAZ, YWHAQ (normal) |
 |  |
| LUAD (tumor) | LUAD (normal) |
| ADORA3, YWHAZ, YWHAQ (tumor) | ADORA3, YWHAZ, YWHAQ (normal) |
 |  |
| LUSC (tumor) | LUSC (normal) |
| ADORA3, YWHAZ, YWHAQ (tumor) | ADORA3, YWHAZ, YWHAQ (normal) |
 |  |
| PRAD (tumor) | PRAD (normal) |
| ADORA3, YWHAZ, YWHAQ (tumor) | ADORA3, YWHAZ, YWHAQ (normal) |
 |  |
| STAD (tumor) | STAD (normal) |
| ADORA3, YWHAZ, YWHAQ (tumor) | ADORA3, YWHAZ, YWHAQ (normal) |
 |  |
| THCA (tumor) | THCA (normal) |
| ADORA3, YWHAZ, YWHAQ (tumor) | ADORA3, YWHAZ, YWHAQ (normal) |
 |  |
| Top |
| TissGeneProg for ADORA3 |
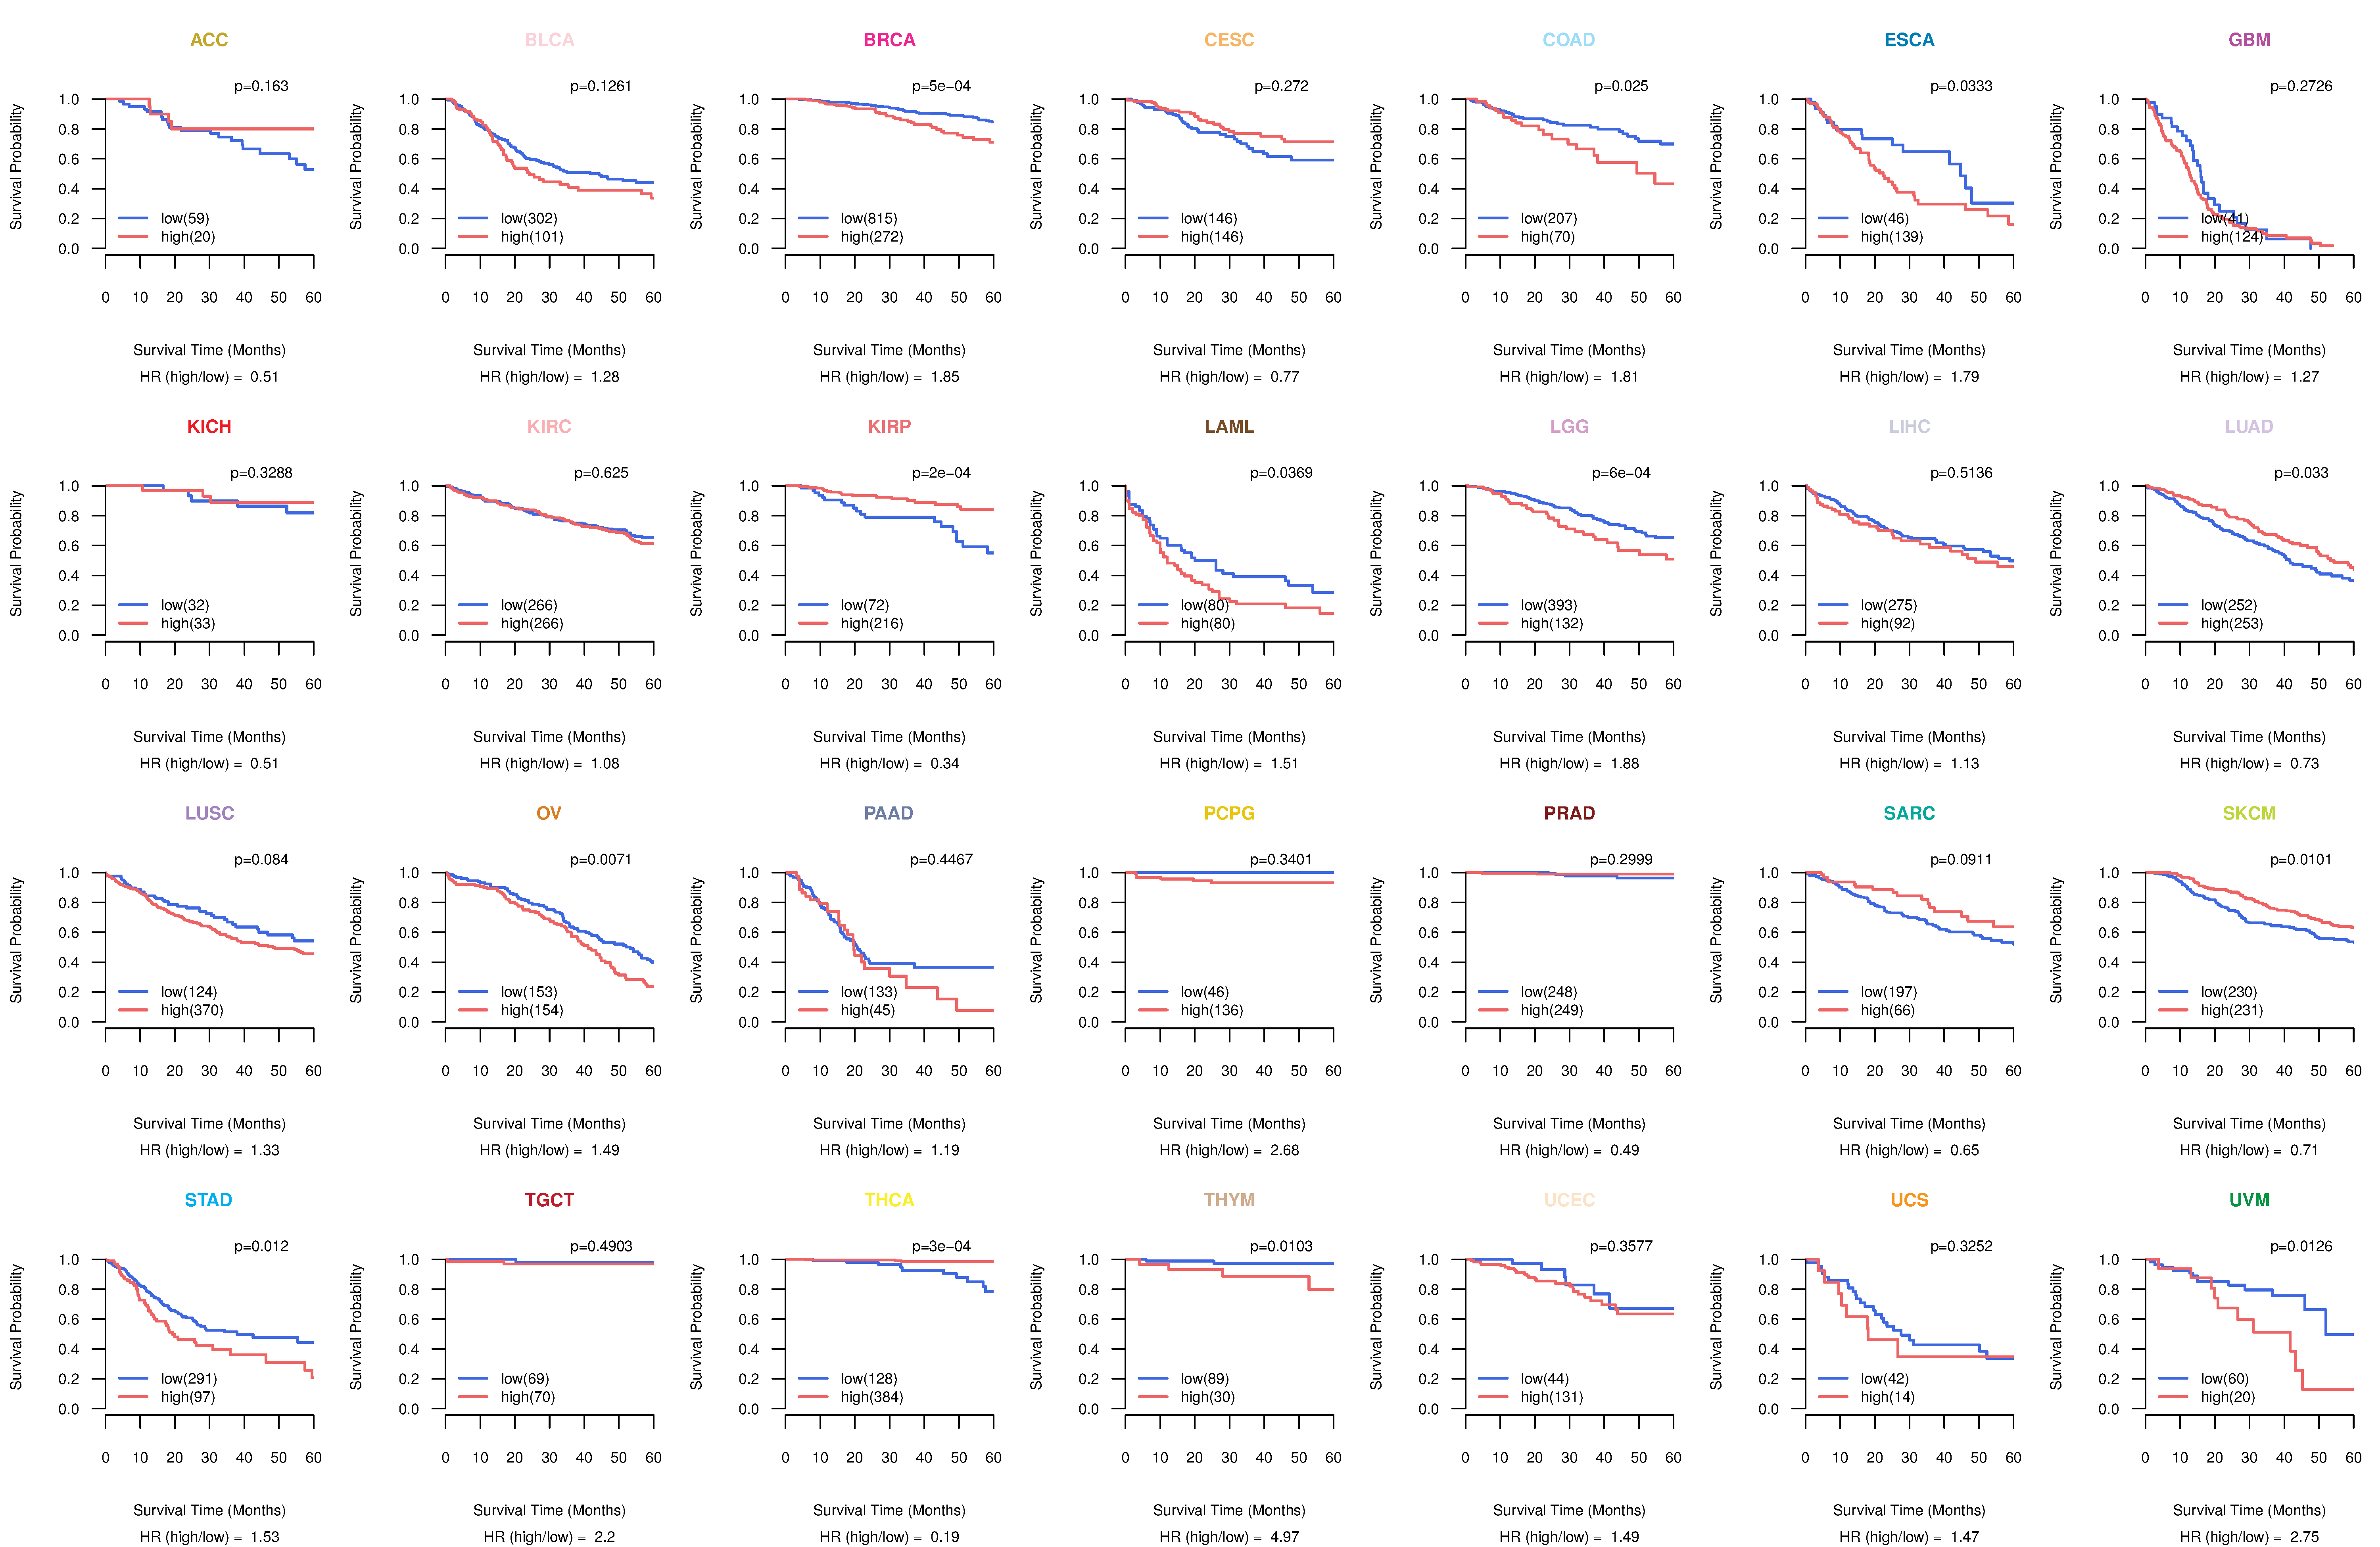
| Kaplan-Meier plots with logrank tests of overall survival (OS) using 28 cancer types (TCGA IlluminaHiSeq_RNASeqV2, pan-cancer normalized log2(norm_counts+1) data, version 2016-08-16) (TCGA clinicalMatrix, phenotype data, version 2016-04-27) * Click on the image to enlarge it in a new window. |
 |
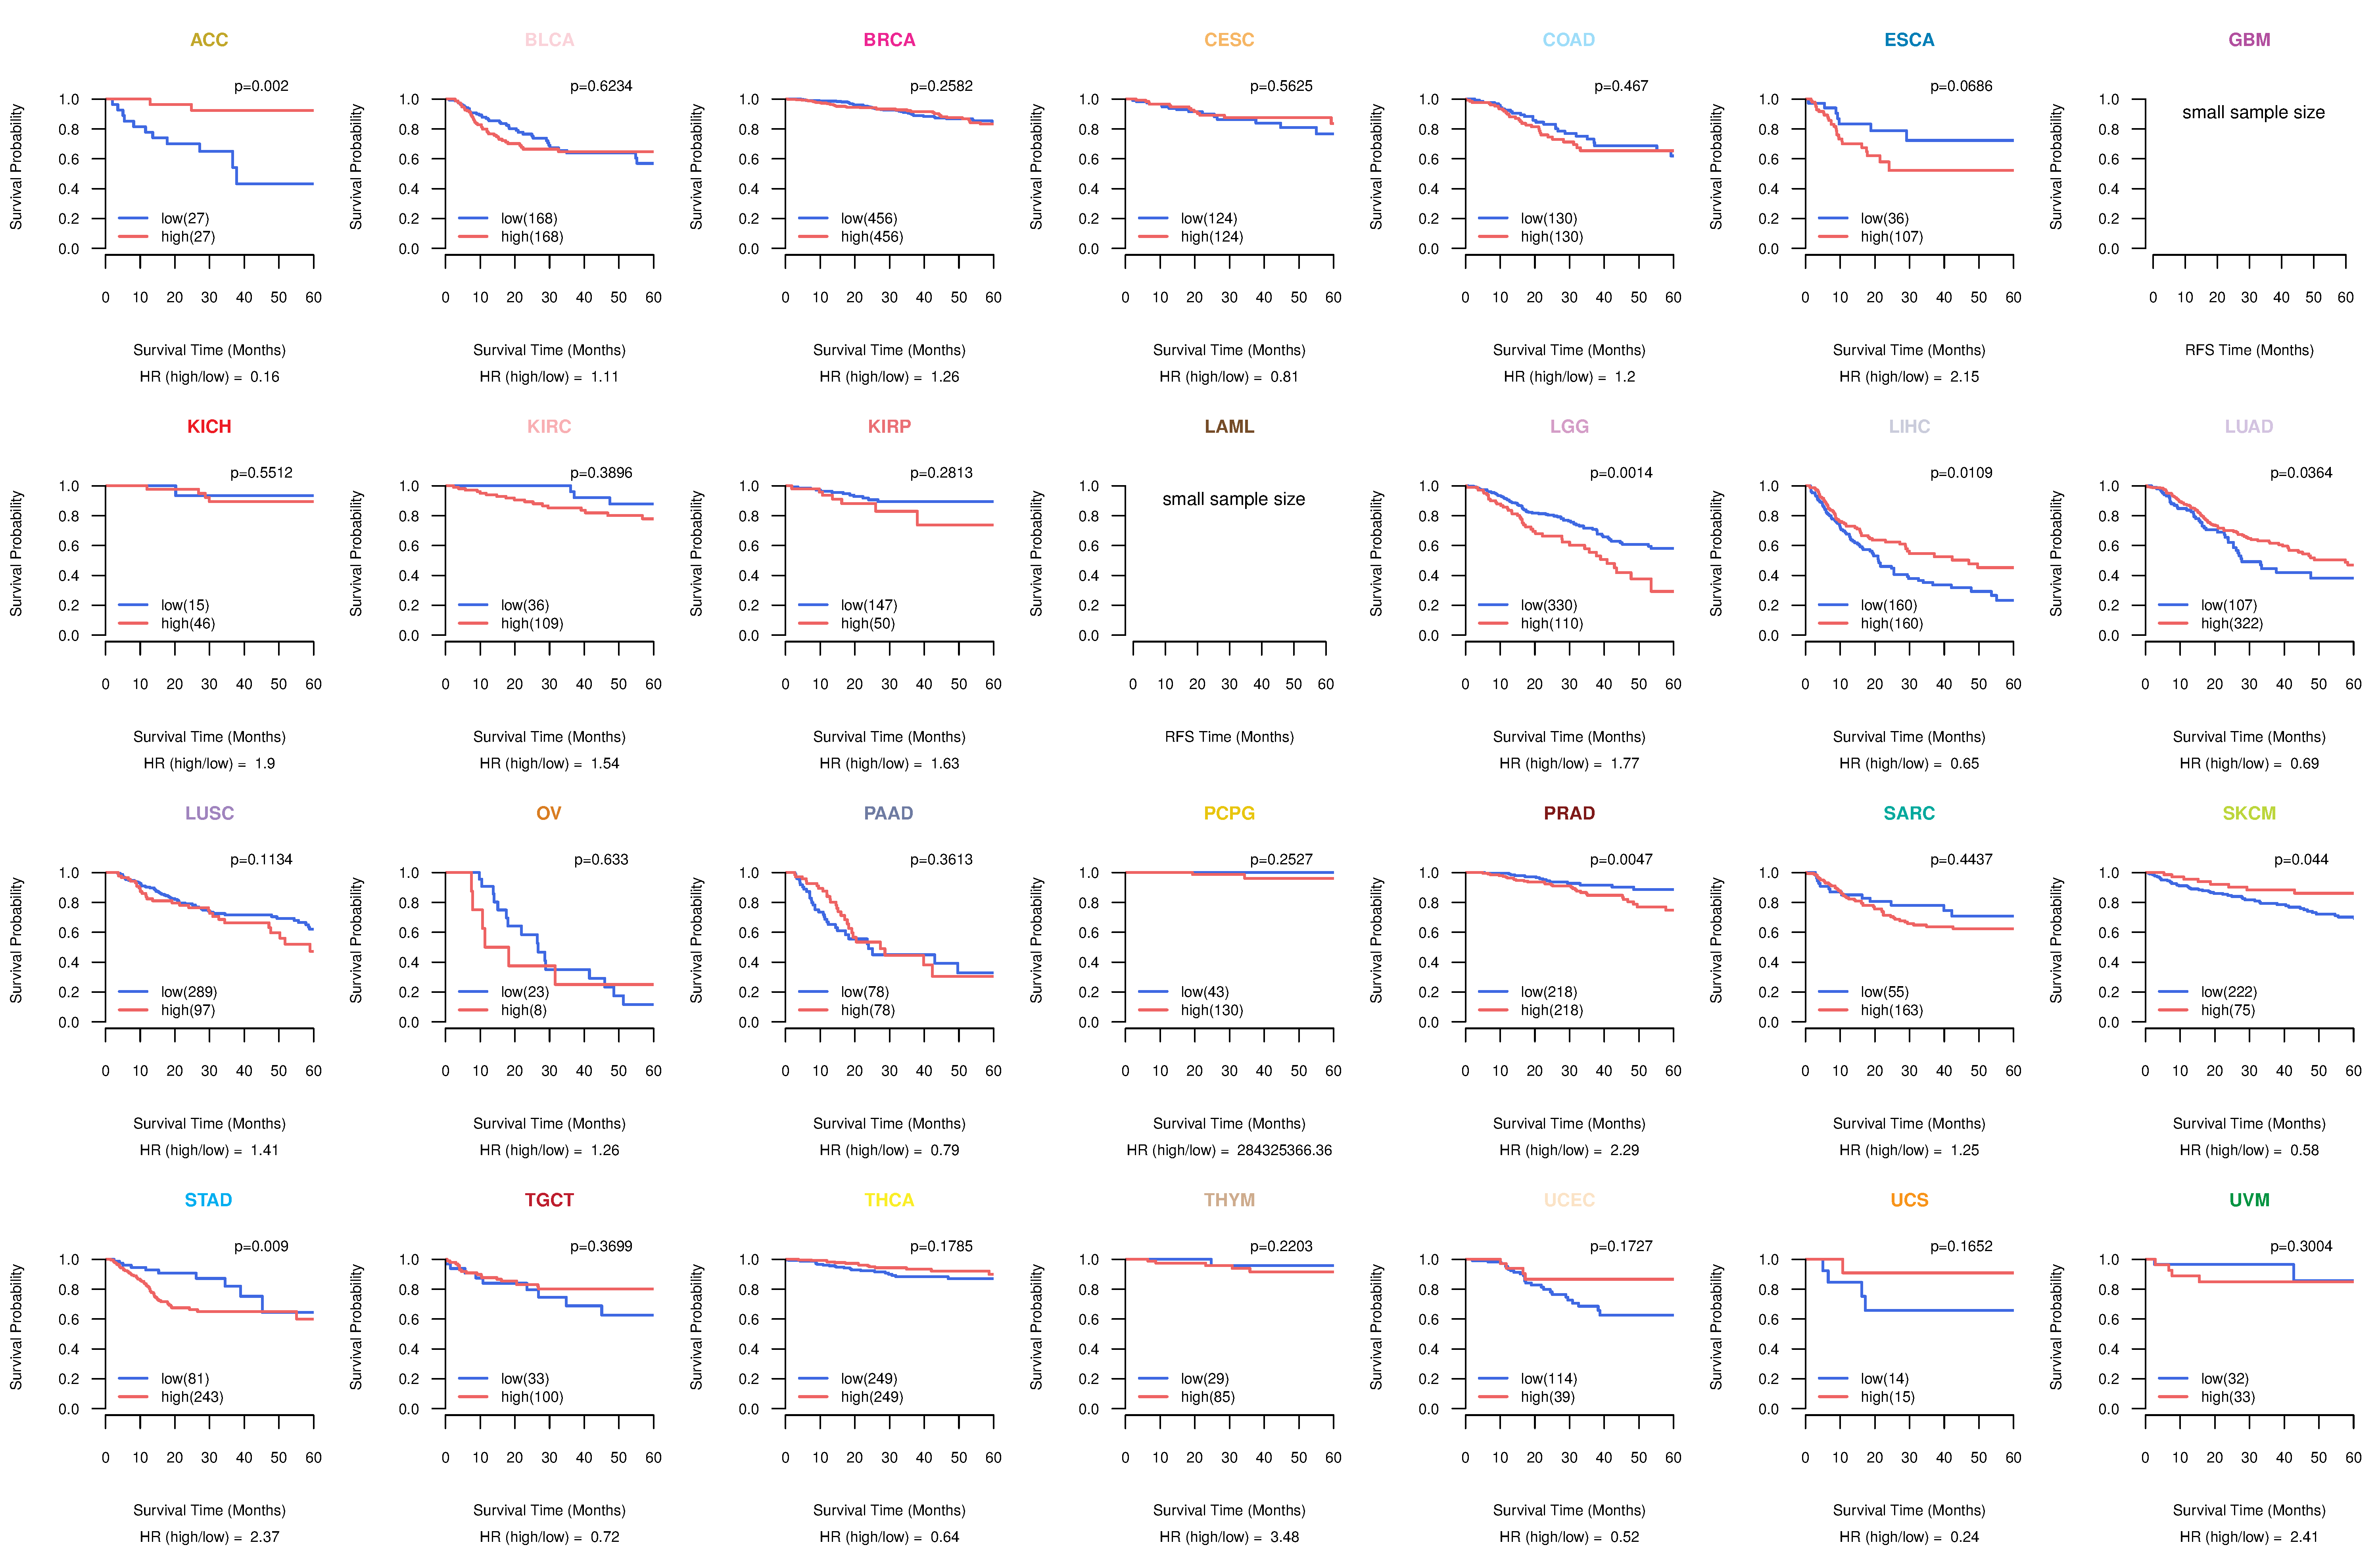
| Kaplan-Meier plots with logrank test of relapse free survival (RFS) using 28 cancer types (TCGA IlluminaHiSeq_RNASeqV2, pan-cancer normalized log2(norm_counts+1) data, version 2016-08-16) (TCGA clinicalMatrix, phenotype data, version 2016-04-27) * Click on the image enlarge it in a new window. |
 |
| Forest plot of Cox proportional hazard ratio (HR) and 95% CI of overall survival (OS) using 28 cancer types (TCGA IlluminaHiSeq_RNASeqV2, pan-cancer normalized log2(norm_counts+1) data, version 2016-08-16) (TCGA clinicalMatrix, phenotype data, version 2016-04-27) * Click on the image enlarge it in a new window. |
 |
| Forest plot of Cox proportional hazard ratio (HR) and 95% CI of relapse free survival (RFS) using 28 cancer types (TCGA IlluminaHiSeq_RNASeqV2, pan-cancer normalized log2(norm_counts+1) data, version 2016-08-16) (TCGA clinicalMatrix, phenotype data, version 2016-04-27) * Click on the image enlarge it in a new window. |
 |
| Top |
| TissGeneClin for ADORA3 |
| TissGeneDrug for ADORA3 |
| Drug information targeting TissGene (DrugBank Version 5.0.6, 2017-04-01) |
| DrugBank ID | Drug name | Drug activity | Drug type | Drug status |
| Top |
| TissGeneDisease for ADORA3 |
| Disease information associated with TissGene (DisGeNet, 2016-06-01) |
| Disease ID | Disease name | # pubmeds | Source |
| umls:C0027051 | Myocardial Infarction | 3 | CTD_human,GAD |
| umls:C0013182 | Drug Allergy | 2 | GAD |
| umls:C0021390 | Inflammatory Bowel Diseases | 2 | BeFree |
| umls:C0022116 | Ischemia | 2 | BeFree,CTD_human |
| umls:C1458155 | Mammary Neoplasms | 2 | LHGDN |
| umls:C0004096 | Asthma | 1 | GAD |
| umls:C0009324 | Ulcerative Colitis | 1 | BeFree |
| umls:C0009375 | Colonic Neoplasms | 1 | LHGDN |
| umls:C0009404 | Colorectal Neoplasms | 1 | LHGDN |
| umls:C0011860 | Diabetes Mellitus, Non-Insulin-Dependent | 1 | BeFree |
| umls:C0017661 | IGA Glomerulonephritis | 1 | CTD_human |
| umls:C0027627 | Neoplasm Metastasis | 1 | BeFree |
| umls:C0032285 | Pneumonia | 1 | BeFree |
| umls:C0040336 | Tobacco Use Disorder | 1 | GAD |
| umls:C0042109 | Urticaria | 1 | BeFree,GAD |
| umls:C0151744 | Myocardial Ischemia | 1 | GAD |
| umls:C0178874 | Tumor Progression | 1 | BeFree |
| umls:C0242379 | Malignant neoplasm of lung | 1 | BeFree |
| umls:C0684249 | Carcinoma of lung | 1 | BeFree |
| umls:C0878544 | Cardiomyopathies | 1 | GAD |
| umls:C2239176 | Liver carcinoma | 1 | LHGDN |
|
Copyright 2016-Present - The University of Texas Health Science Center at Houston (UTHealth) Web File Viewing | How to Report, Fraud, Waste and Abuse | State of Texas | Statewide Search | Texas Homeland Security | Site Policies |