
| Home | Download | Statistics | Landscape | Help |
Navigation1. Data collection of TissGDB2. Understanding of TissGDB's annotation category Search page, example: TMPRSS2 TissGene search result page TissGene annotation result page 1) TissGeneSummary category 2) TissGeneExp category 3) TissGene-miRNA category 4) TissGeneMut category - TissGeneSNV, TissGeneCNV, and TissGeneFusion 5) TissgNet category 6) TissgProg category 7) TissgClin category - TissgDrug and TissgDisease 3. Download data and contact us |
|
1. Data collection of TissGDB |
|
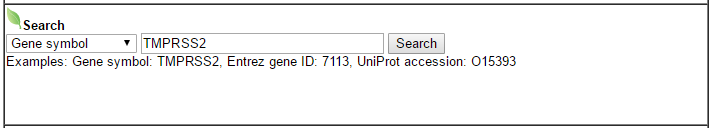
TissGene annotation result page
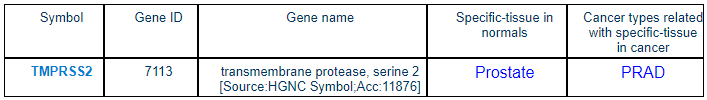
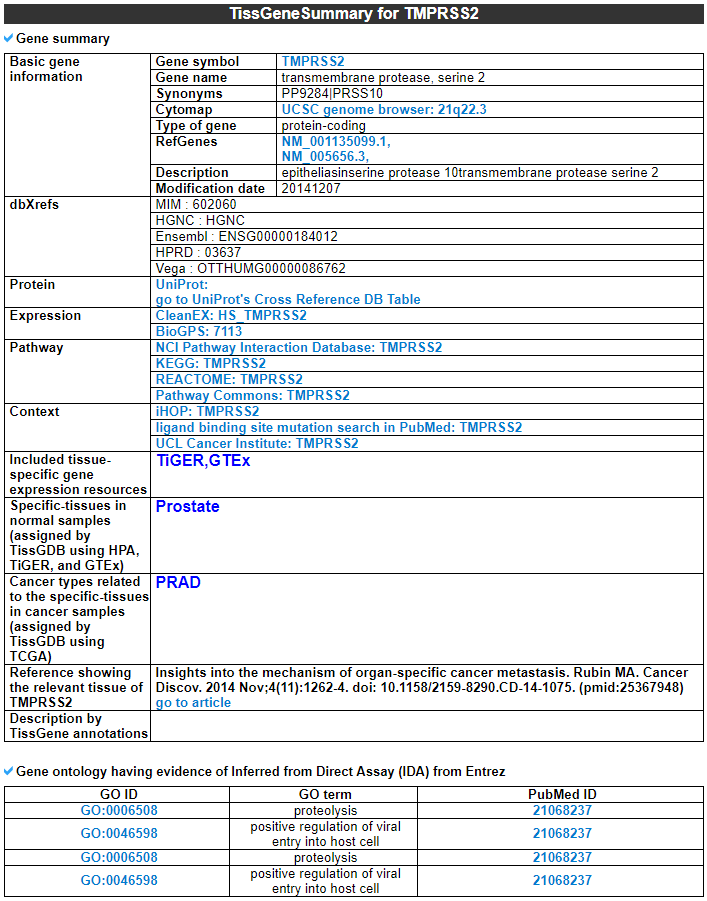
This category shows the gene's overall information from basic information such as symbol, alias, and locations to expression, pathway, regulation, and context. Words in blue are linked to their respective databases. TissGeneSummary table also shows the tissue and cancer type information including manually curated PubMed article information.
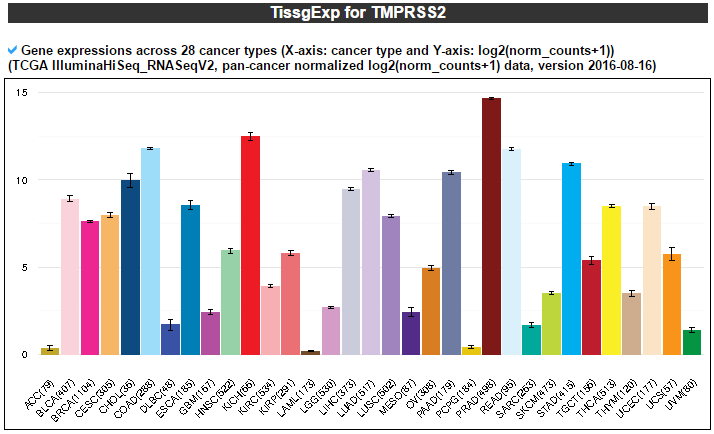
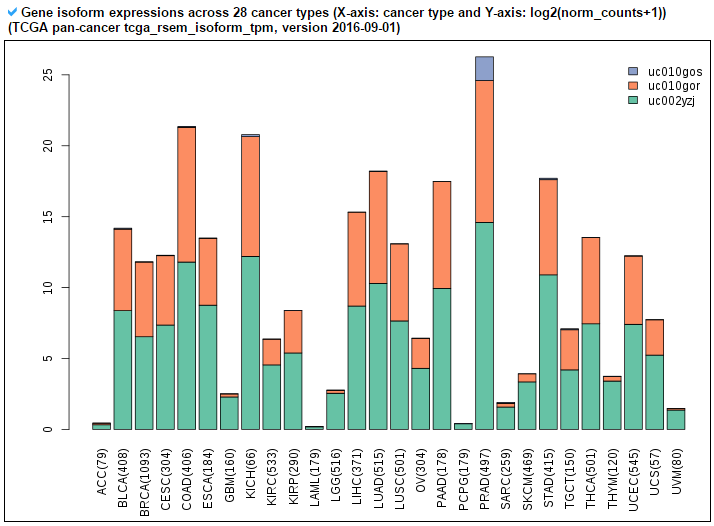
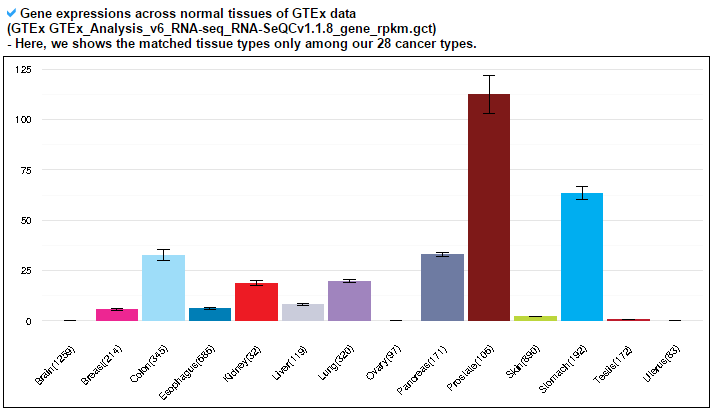
This category provides various annotations using gene expression values. --- This image shows the gene expression across 28 cancer types. --- This image shows the gene isoform expression across 28 cancer types. User can see the unique or different usage of the specific gene isoform. --- This image shows the gene expression across 14 tissues from GTEx data.
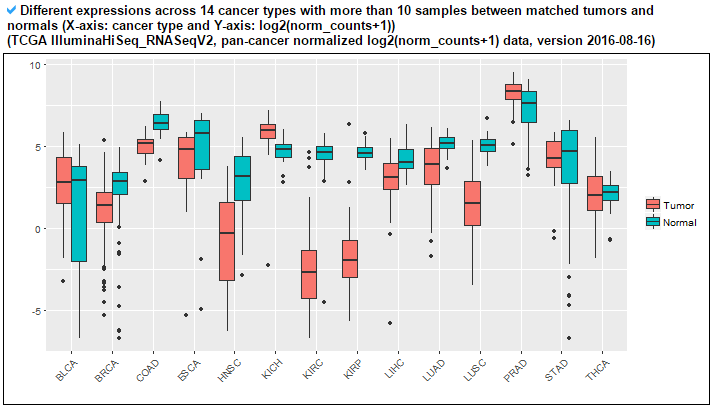
--- This image shows the differentially expressed genes (DEGs) across 14 cancer types with comparison to their matched normal samples.
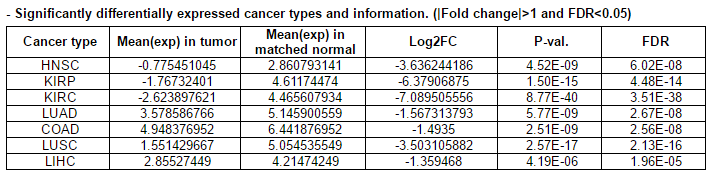
--- This table shows the significant DEG results.
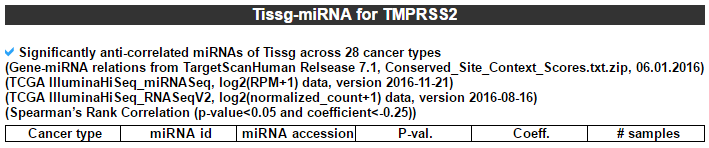
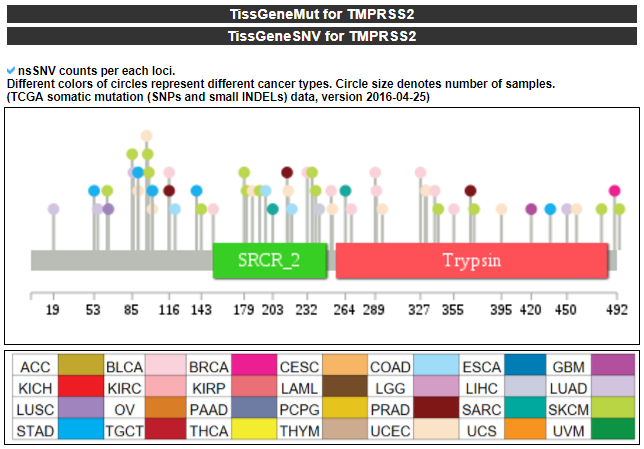
--- This table shows the significant anti-correlated miRNAs. --- This image shows the nsSNVs of TissGene on the amino acid sequence with a lollipop plot.
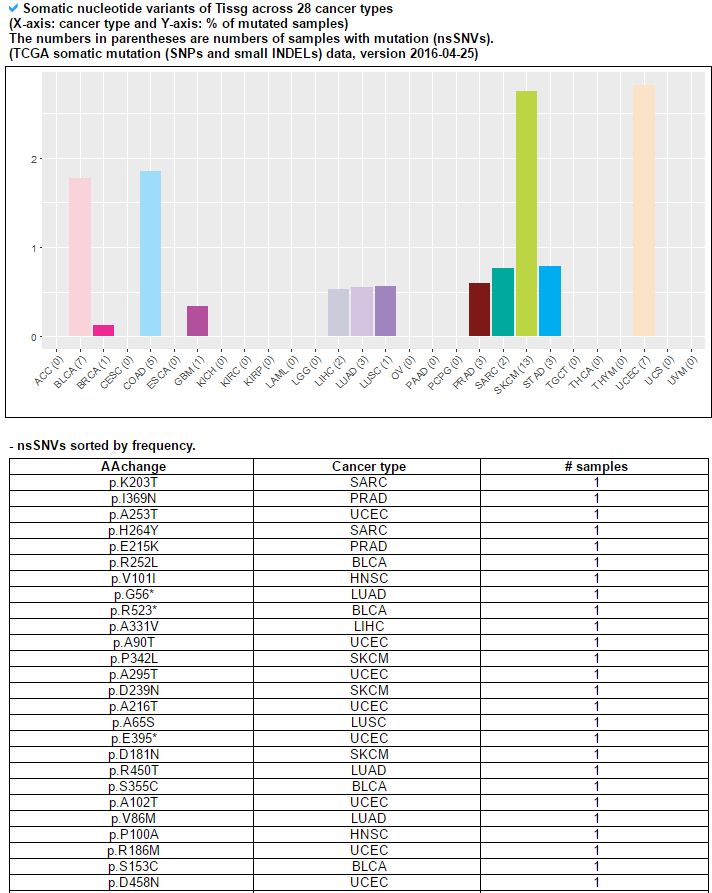
--- This figure and table show the frequency of nsSNVs across 28 cancer types.
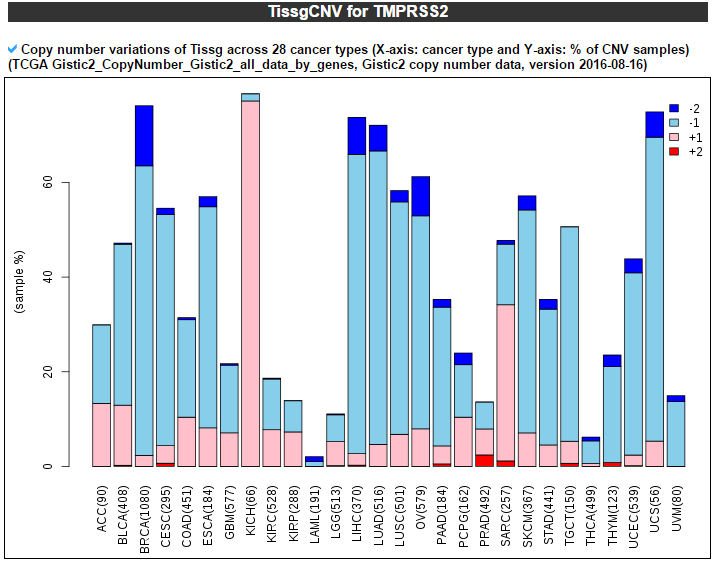
--- This image shows the copy number variation frequency across 28 cancer types.
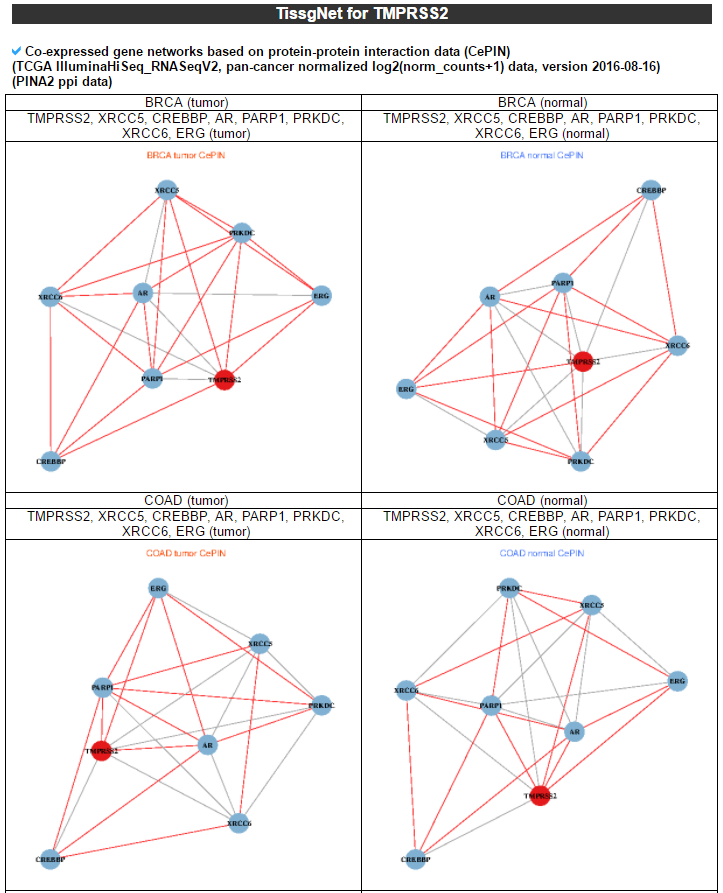
--- To compare the active genes between ligand binding site mutation samples and the other samples, we analyzed their expressions using co-expressed genes with protein-protein interaction network (PPI network).
--- Using these co-expressed genes between each cancer type and the matched normal samples, users can infer the different module activity surrounding specific TissGene.
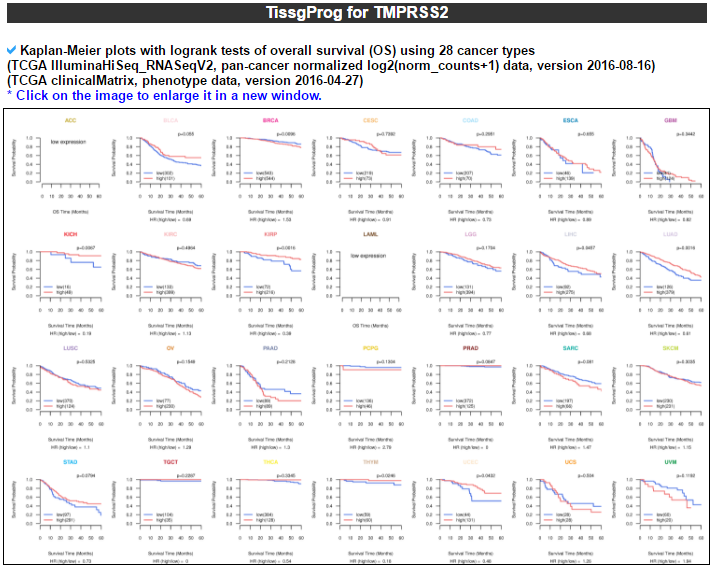
--- These plots show the overall survival difference between high- and low-expressed TissGene samples across 28 cancer types.
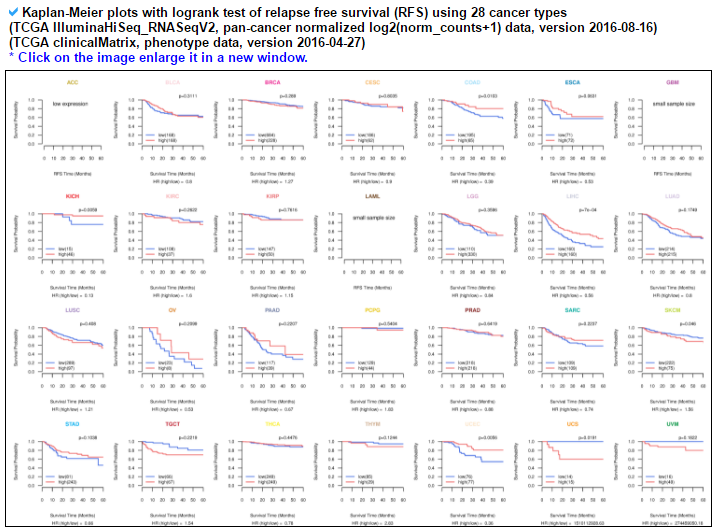
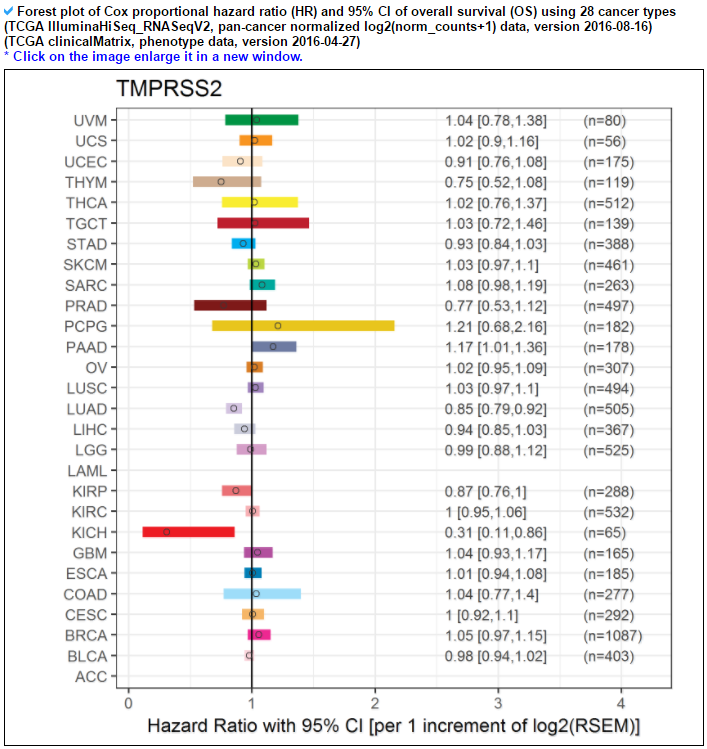
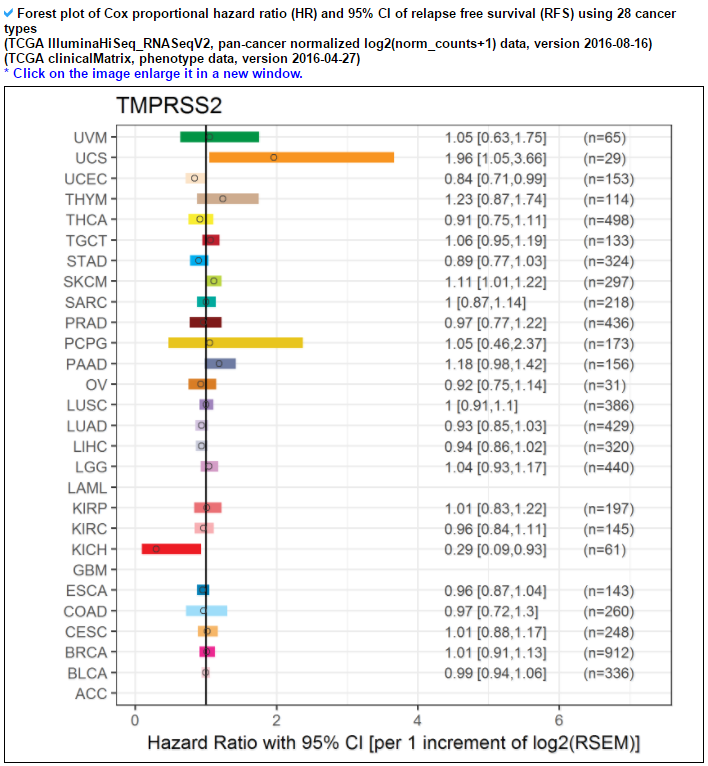
--- These plots show the relapse free survival difference between high- and low-expressed TissGene samples across 28 cancer types. --- This plots show the hazard ratio distribution using overall survival information across 28 cancer types.
--- This plots show the hazard ratio distribution using relapse free survival information across 28 cancer types. 
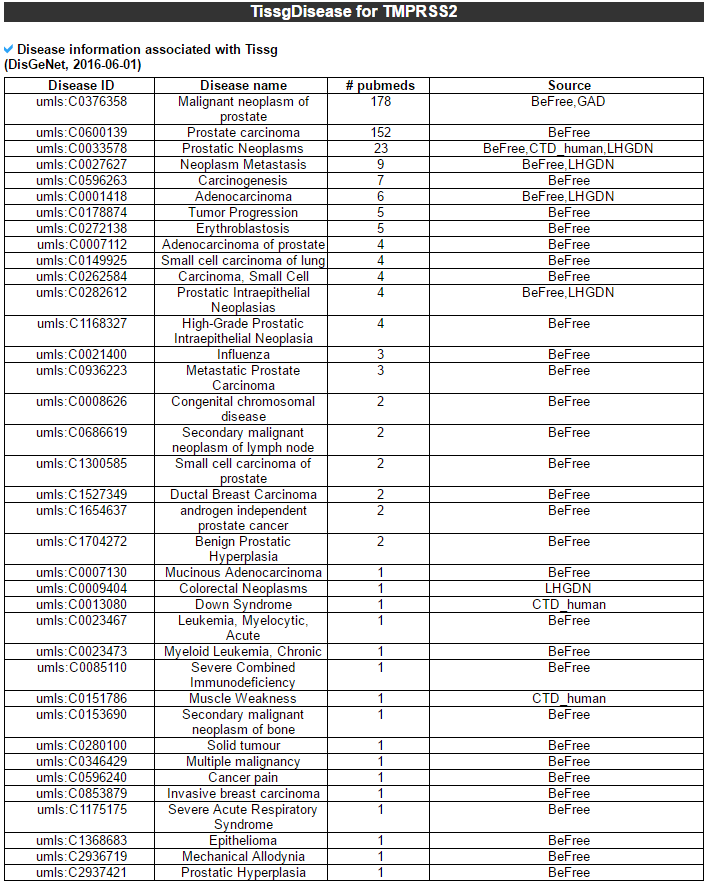
--- This table shows the related drug information for the TissGene from DrugBank. --- This table shows the associated disease information for the TissGene.
|
|
Please go to download page and contact page. |
Copyright 2008-Present - The University of Texas Health Science Center at Houston (UTHealth)
Web File Viewing | How to Report, Fraud, Waste and Abuse | State of Texas | Statewide Search | Texas Homeland Security | Site Policies