 |
| |
| |
| |
| |
| |
| |
|

| TissGeneSummary for CTH |
 Gene summary Gene summary |
| Basic gene information | Gene symbol | CTH |
| Gene name | cystathionine gamma-lyase | |
| Synonyms | - | |
| Cytomap | UCSC genome browser: 1p31.1 | |
| Type of gene | protein-coding | |
| RefGenes | NM_001190463.1, NM_001902.5,NM_153742.4, | |
| Description | cystathionase (cystathionine gamma-lyase)cysteine desulfhydrasecysteine-protein sulfhydrasegamma-cystathionasehomoserine deaminasehomoserine dehydratase | |
| Modification date | 20141222 | |
| dbXrefs | MIM : 607657 | |
| HGNC : HGNC | ||
| Ensembl : ENSG00000116761 | ||
| HPRD : 09633 | ||
| Vega : OTTHUMG00000009352 | ||
| Protein | UniProt: go to UniProt's Cross Reference DB Table | |
| Expression | CleanEX: HS_CTH | |
| BioGPS: 1491 | ||
| Pathway | NCI Pathway Interaction Database: CTH | |
| KEGG: CTH | ||
| REACTOME: CTH | ||
| Pathway Commons: CTH | ||
| Context | iHOP: CTH | |
| ligand binding site mutation search in PubMed: CTH | ||
| UCL Cancer Institute: CTH | ||
| Assigned class in TissGDB* | C | |
| Included tissue-specific gene expression resources | TiGER,GTEx | |
| Specific-tissues in normal samples (assigned by TissGDB using HPA, TiGER, and GTEx) | Liver | |
| Cancer types related to the specific-tissues in cancer samples (assigned by TissGDB using TCGA) | LIHC | |
| Reference showing the relevant tissue of CTH | ||
| Description by TissGene annotations | Have significant anti-correlated miRNA | |
| * Class A consists of genes with literature evidence and is part of the cTissGenes. Class B consists of only cTissGenes without additional evidence. The remaining genes belong to Class C. |
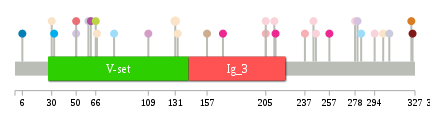
| Gene ontology having evidence of Inferred from Direct Assay (IDA) from Entrez |
| GO ID | GO term | PubMed ID | GO:0018272 | protein-pyridoxal-5-phosphate linkage via peptidyl-N6-pyridoxal phosphate-L-lysine | 19019829 | GO:0019344 | cysteine biosynthetic process | 10212249 | GO:0070814 | hydrogen sulfide biosynthetic process | 19019829 | GO:0018272 | protein-pyridoxal-5-phosphate linkage via peptidyl-N6-pyridoxal phosphate-L-lysine | 19019829 | GO:0019344 | cysteine biosynthetic process | 10212249 | GO:0070814 | hydrogen sulfide biosynthetic process | 19019829 |
| Top |
| TissGeneExp for CTH |
| Gene expressions across 28 cancer types (X-axis: cancer type and Y-axis: log2(norm_counts+1)) (TCGA IlluminaHiSeq_RNASeqV2, pan-cancer normalized log2(norm_counts+1) data, version 2016-08-16) |
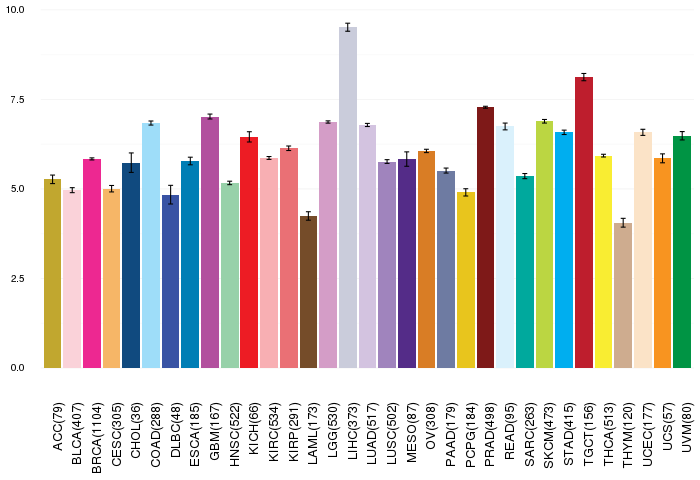 |
| Gene isoform expressions across 28 cancer types (X-axis: cancer type and Y-axis: log2(norm_counts+1)) (TCGA pan-cancer tcga_rsem_isoform_tpm, version 2016-09-01) |
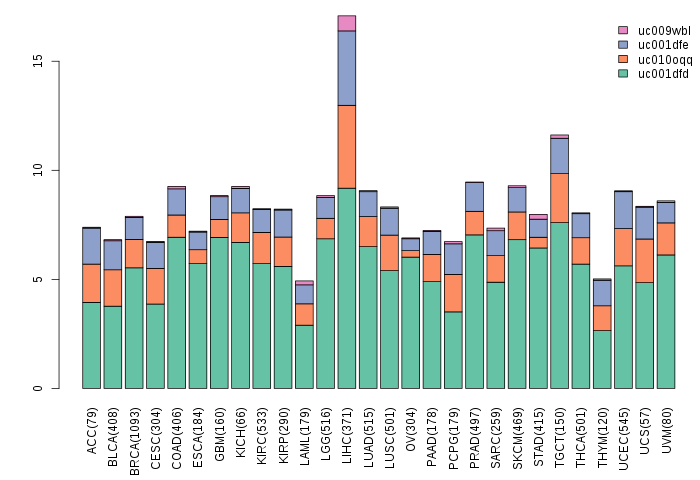 |
| Gene expressions across normal tissues of GTEx data (GTEx GTEx_Analysis_v6_RNA-seq_RNA-SeQCv1.1.8_gene_rpkm.gct) - Here, we shows the matched tissue types only among our 28 cancer types. |
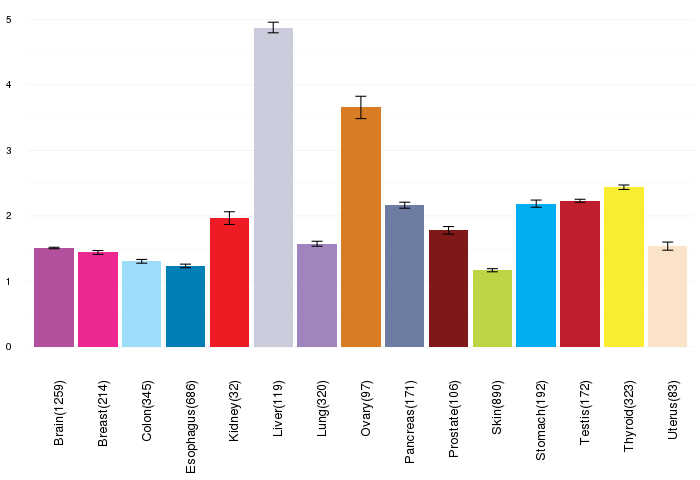 |
| Different expressions across 14 cancer types with more than 10 samples between matched tumors and normals (X-axis: cancer type and Y-axis: log2(norm_counts+1)) (TCGA IlluminaHiSeq_RNASeqV2, pan-cancer normalized log2(norm_counts+1) data, version 2016-08-16) |
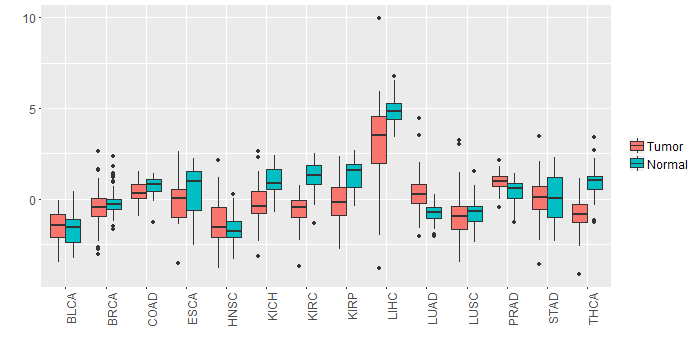 |
| - Significantly differentially expressed cancer types and information. (|Fold change|>1 and FDR<0.05) |
| Cancer type | Mean(exp) in tumor | Mean(exp) in matched normal | Log2FC | P-val. | FDR |
| LUAD | 0.294492583 | -0.781788452 | 1.076281034 | 1.73E-09 | 8.92E-09 |
| KIRP | -0.09983565 | 1.34907685 | -1.4489125 | 9.21E-08 | 5.58E-07 |
| KIRC | -0.544269678 | 1.277112267 | -1.821381944 | 2.60E-29 | 4.62E-28 |
| LIHC | 3.1568901 | 4.9816541 | -1.824764 | 7.56E-07 | 4.17E-06 |
| THCA | -0.797412239 | 0.962979286 | -1.760391525 | 1.14E-18 | 3.24E-17 |
| KICH | -0.2861599 | 1.0007961 | -1.286956 | 0.000127 | 0.000323968 |
| Top |
| TissGene-miRNA for CTH |
| Significantly anti-correlated miRNAs of TissGene across 28 cancer types (Gene-miRNA relations from TargetScanHuman Relsease 7.1, Conserved_Site_Context_Scores.txt.zip, 06.01.2016) (TCGA IlluminaHiSeq_miRNASeq, log2(RPM+1) data, version 2016-11-21) (TCGA IlluminaHiSeq_RNASeqV2, log2(normalized_count+1) data, version 2016-08-16) (Spearman’s Rank Correlation (p-value<0.05 and coefficient<-0.25)) |
| Cancer type | miRNA id | miRNA accession | P-val. | Coeff. | # samples |
| UCS | hsa-miR-27a-3p | MIMAT0000084 | 0.031 | -0.29 | 56 |
| UCS | hsa-miR-26b-5p | MIMAT0000083 | 0.022 | -0.31 | 56 |
| UCS | hsa-miR-30d-5p | MIMAT0000245 | 0.0095 | -0.35 | 56 |
| UCS | hsa-miR-30b-5p | MIMAT0000420 | 0.0007 | -0.44 | 56 |
| Top |
| TissGeneMut for CTH |
| TissGeneSNV for CTH |
| nsSNV counts per each loci. Different colors of circles represent different cancer types. Circle size denotes number of samples. (TCGA somatic mutation (SNPs and small INDELs) data, version 2016-04-25) * Click on the image to enlarge it in a new window. |
 |
 |
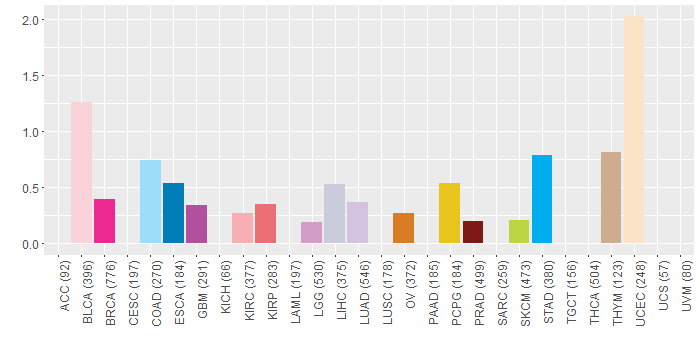
| Somatic nucleotide variants of TissGene across 28 cancer types (X-axis: cancer type and Y-axis: % of mutated samples) The numbers in parentheses are numbers of samples with mutation (nsSNVs). (TCGA somatic mutation (SNPs and small INDELs) data, version 2016-04-25) |
 |
| - nsSNVs sorted by frequency. |
| AAchange | Cancer type | # samples |
| p.K131N | UCEC | 2 |
| p.W32* | STAD | 1 |
| p.E301* | UCEC | 1 |
| p.A6S | ESCA | 1 |
| p.E339D | HNSC | 1 |
| p.Y213* | BRCA | 1 |
| p.P66A | HNSC | 1 |
| p.E294K | BLCA | 1 |
| p.R205H | KIRC | 1 |
| p.G244V | BLCA | 1 |
| p.G212E | HNSC | 1 |
| p.E170* | BRCA | 1 |
| p.H324R | OV | 1 |
| p.E349Q | PCPG | 1 |
| p.T67A | UCEC | 1 |
| p.L390P | STAD | 1 |
| p.R375Q | STAD | 1 |
| p.Y60C | LIHC | 1 |
| p.G50W | LUAD | 1 |
| p.E157X | THYM | 1 |
| p.R343Q | STAD | 1 |
| p.P66S | SKCM | 1 |
| p.G280V | LUAD | 1 |
| p.R237H | KIRC | 1 |
| p.A325V | PRAD | 1 |
| p.C109Y | LGG | 1 |
| p.E30D | UCEC | 1 |
| p.E313K | READ | 1 |
| p.Q246E | BLCA | 1 |
| p.E351Q | BLCA | 1 |
| p.R205C | BLCA | 1 |
| p.R62L | GBM | 1 |
| p.Q306L | LIHC | 1 |
| p.Q278E | BLCA | 1 |
| p.G212V | BLCA | 1 |
| p.E307D | HNSC | 1 |
| p.A81T | COAD | 1 |
| p.S133Y | UCEC | 1 |
| p.E381Q | PCPG | 1 |
| p.R257* | BRCA | 1 |
| p.G50A | KIRP | 1 |
| p.I283L | COAD | 1 |
| Top |
| TissGeneCNV for CTH |
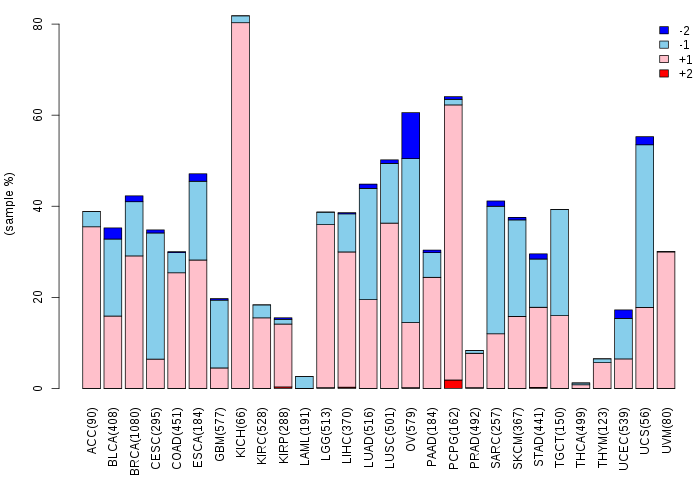
| Copy number variations of TissGene across 28 cancer types (X-axis: cancer type and Y-axis: % of CNV samples) (TCGA Gistic2_CopyNumber_Gistic2_all_data_by_genes, Gistic2 copy number data, version 2016-08-16) |
 |
| Top |
| TissGeneFusions for CTH |
| Fusion genes including TissGene (ChimerDB 3.0, 2016-12-01 and TCGA fusion Portal 2015-12-01) |
| Database | Src | Cancer type | Sample | Fusion gene | ORF | 5'-gene BP | 3'-gene BP |
| Chimerdb3.0 | ChiTaRs | NA | H72721 | CTH-CTH | chr1:70879919 | chr1:70879222 | |
| Chimerdb3.0 | ChiTaRs | NA | BX106222 | CTH-CTH | chr1:70879836 | chr1:70879812 |
| Top |
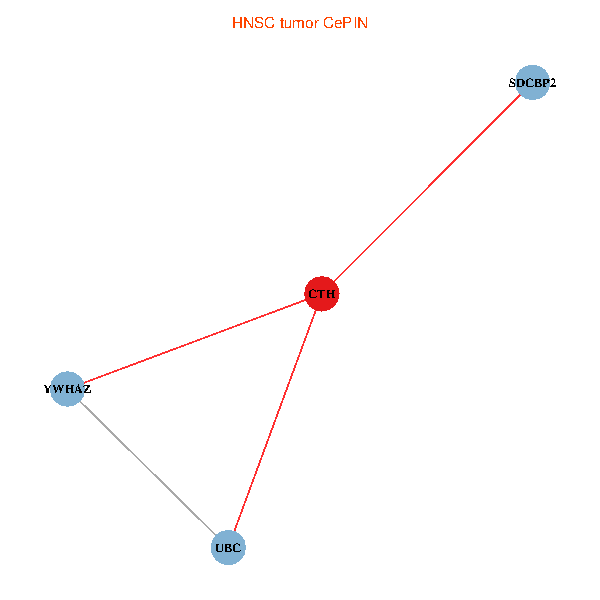
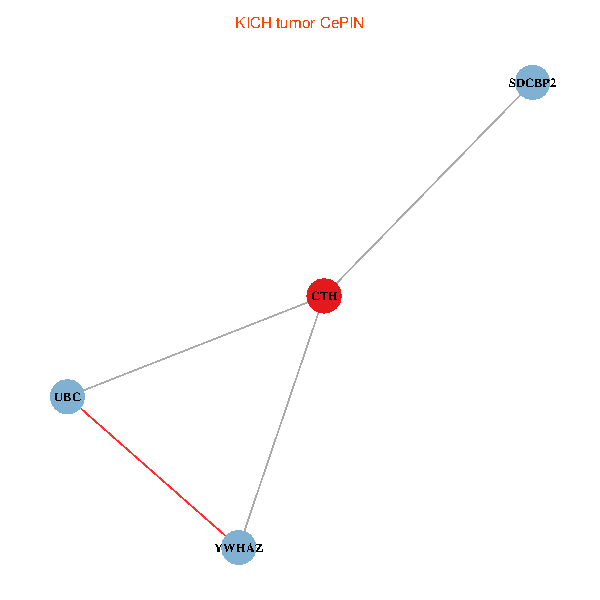
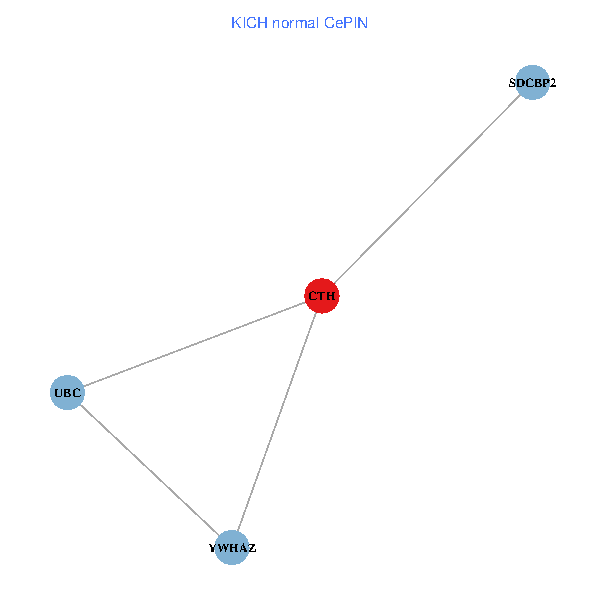
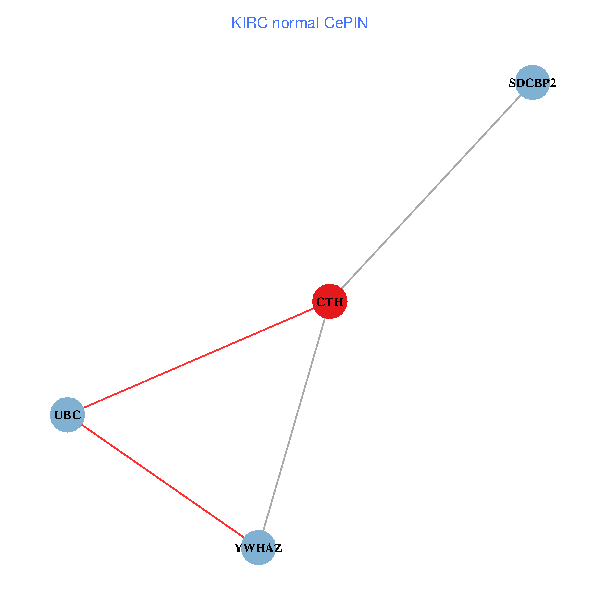
| TissGeneNet for CTH |
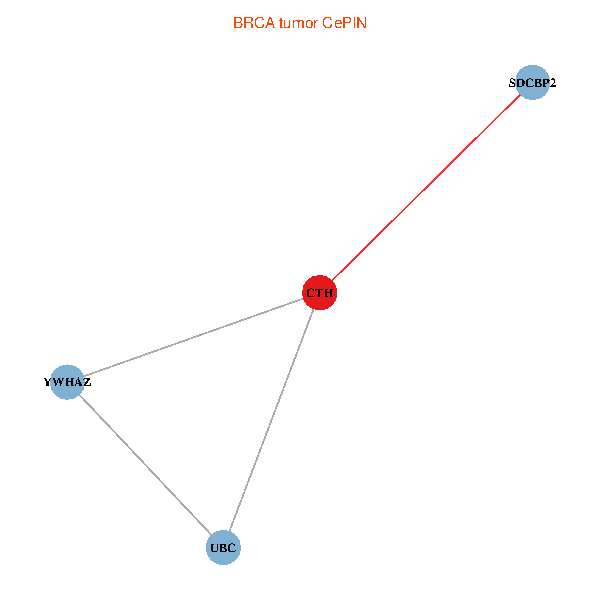
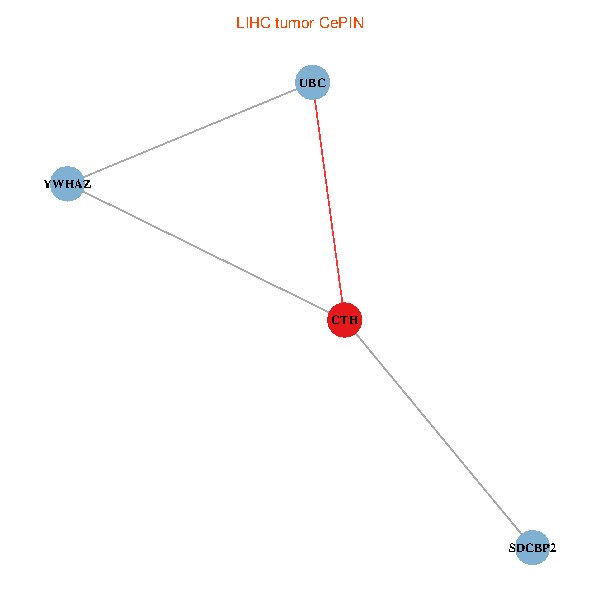
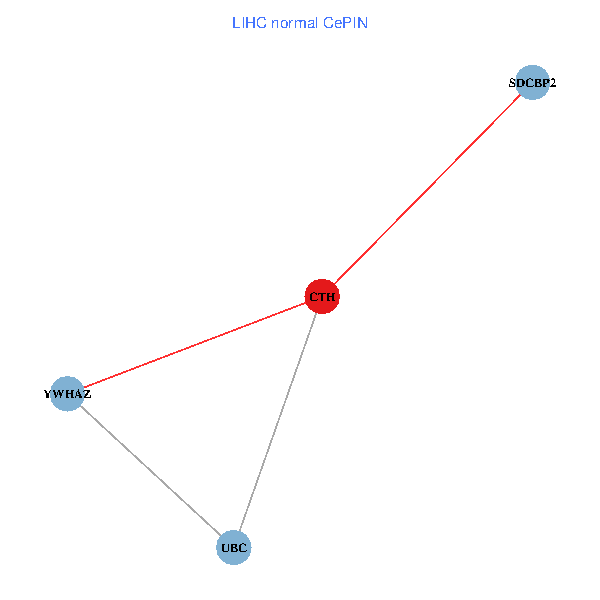
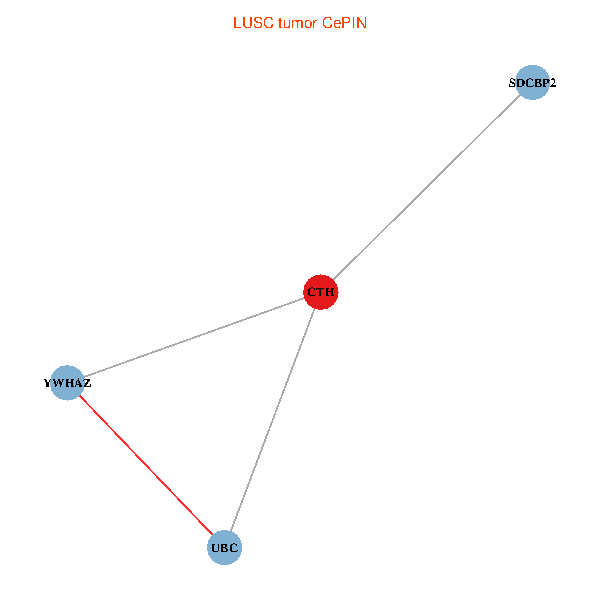
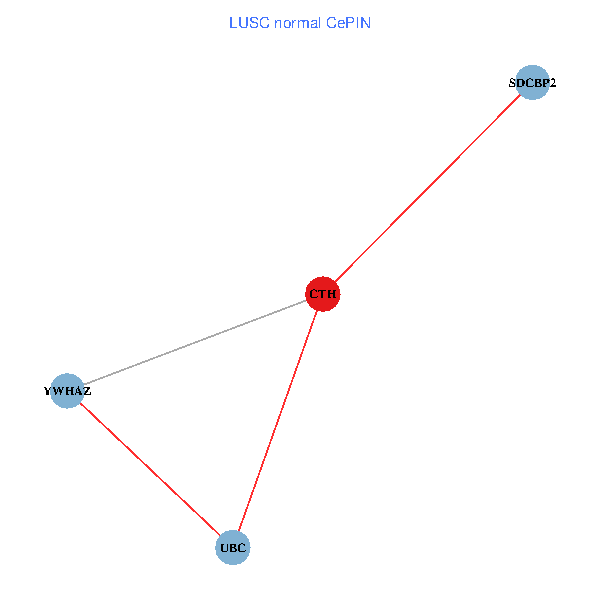
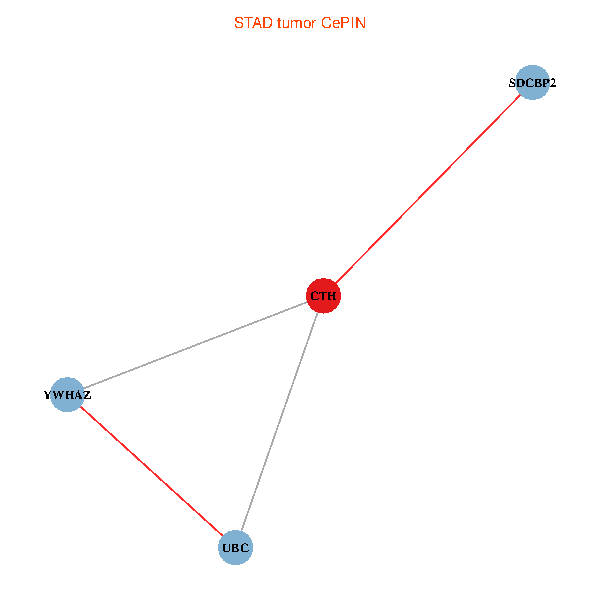
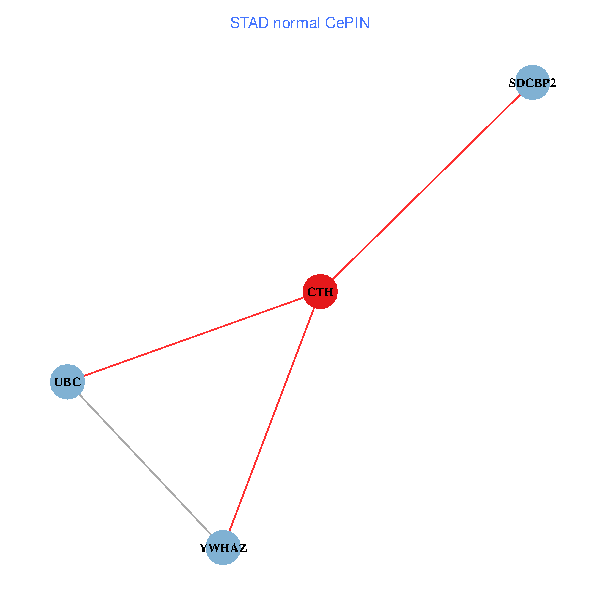
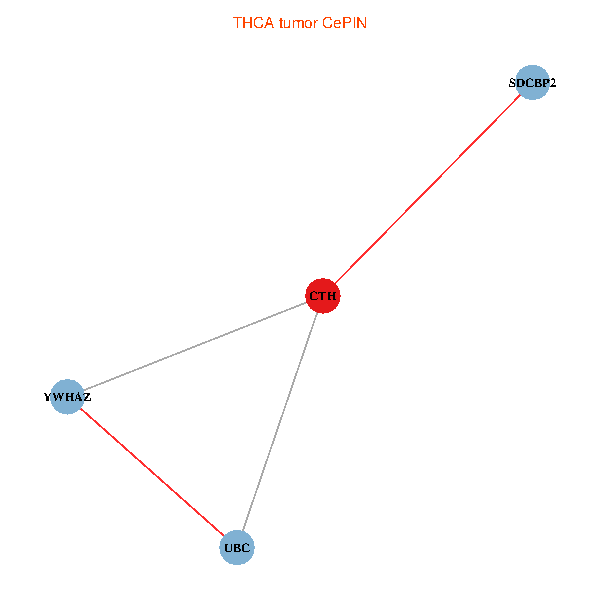
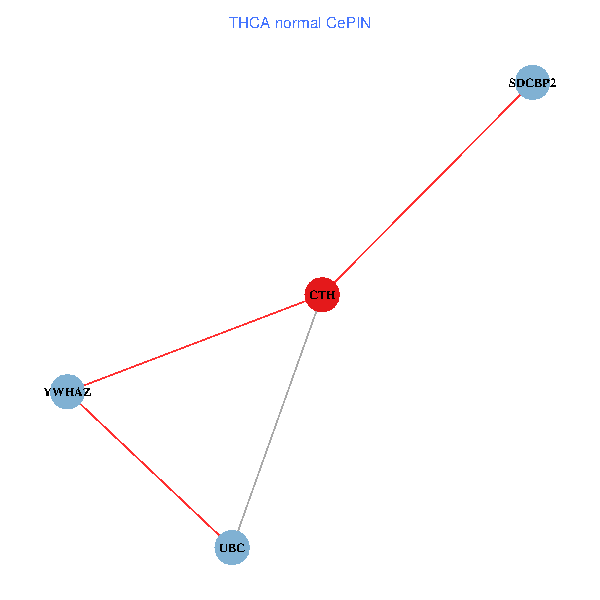
| Co-expressed gene networks based on protein-protein interaction data (CePIN) (TCGA IlluminaHiSeq_RNASeqV2, pan-cancer normalized log2(norm_counts+1) data, version 2016-08-16) (PINA2 ppi data) |
| BRCA (tumor) | BRCA (normal) |
| CTH, UBC, YWHAZ, SDCBP2 (tumor) | CTH, UBC, YWHAZ, SDCBP2 (normal) |
 |  |
| COAD (tumor) | COAD (normal) |
| CTH, UBC, YWHAZ, SDCBP2 (tumor) | CTH, UBC, YWHAZ, SDCBP2 (normal) |
 |  |
| HNSC (tumor) | HNSC (normal) |
| CTH, UBC, YWHAZ, SDCBP2 (tumor) | CTH, UBC, YWHAZ, SDCBP2 (normal) |
 |  |
| KICH (tumor) | KICH (normal) |
| CTH, UBC, YWHAZ, SDCBP2 (tumor) | CTH, UBC, YWHAZ, SDCBP2 (normal) |
 |  |
| KIRC (tumor) | KIRC (normal) |
| CTH, UBC, YWHAZ, SDCBP2 (tumor) | CTH, UBC, YWHAZ, SDCBP2 (normal) |
 |  |
| KIRP (tumor) | KIRP (normal) |
| CTH, UBC, YWHAZ, SDCBP2 (tumor) | CTH, UBC, YWHAZ, SDCBP2 (normal) |
 |  |
| LIHC (tumor) | LIHC (normal) |
| CTH, UBC, YWHAZ, SDCBP2 (tumor) | CTH, UBC, YWHAZ, SDCBP2 (normal) |
 |  |
| LUAD (tumor) | LUAD (normal) |
| CTH, UBC, YWHAZ, SDCBP2 (tumor) | CTH, UBC, YWHAZ, SDCBP2 (normal) |
 |  |
| LUSC (tumor) | LUSC (normal) |
| CTH, UBC, YWHAZ, SDCBP2 (tumor) | CTH, UBC, YWHAZ, SDCBP2 (normal) |
 |  |
| PRAD (tumor) | PRAD (normal) |
| CTH, UBC, YWHAZ, SDCBP2 (tumor) | CTH, UBC, YWHAZ, SDCBP2 (normal) |
 |  |
| STAD (tumor) | STAD (normal) |
| CTH, UBC, YWHAZ, SDCBP2 (tumor) | CTH, UBC, YWHAZ, SDCBP2 (normal) |
 |  |
| THCA (tumor) | THCA (normal) |
| CTH, UBC, YWHAZ, SDCBP2 (tumor) | CTH, UBC, YWHAZ, SDCBP2 (normal) |
 |  |
| Top |
| TissGeneProg for CTH |
| Kaplan-Meier plots with logrank tests of overall survival (OS) using 28 cancer types (TCGA IlluminaHiSeq_RNASeqV2, pan-cancer normalized log2(norm_counts+1) data, version 2016-08-16) (TCGA clinicalMatrix, phenotype data, version 2016-04-27) * Click on the image to enlarge it in a new window. |
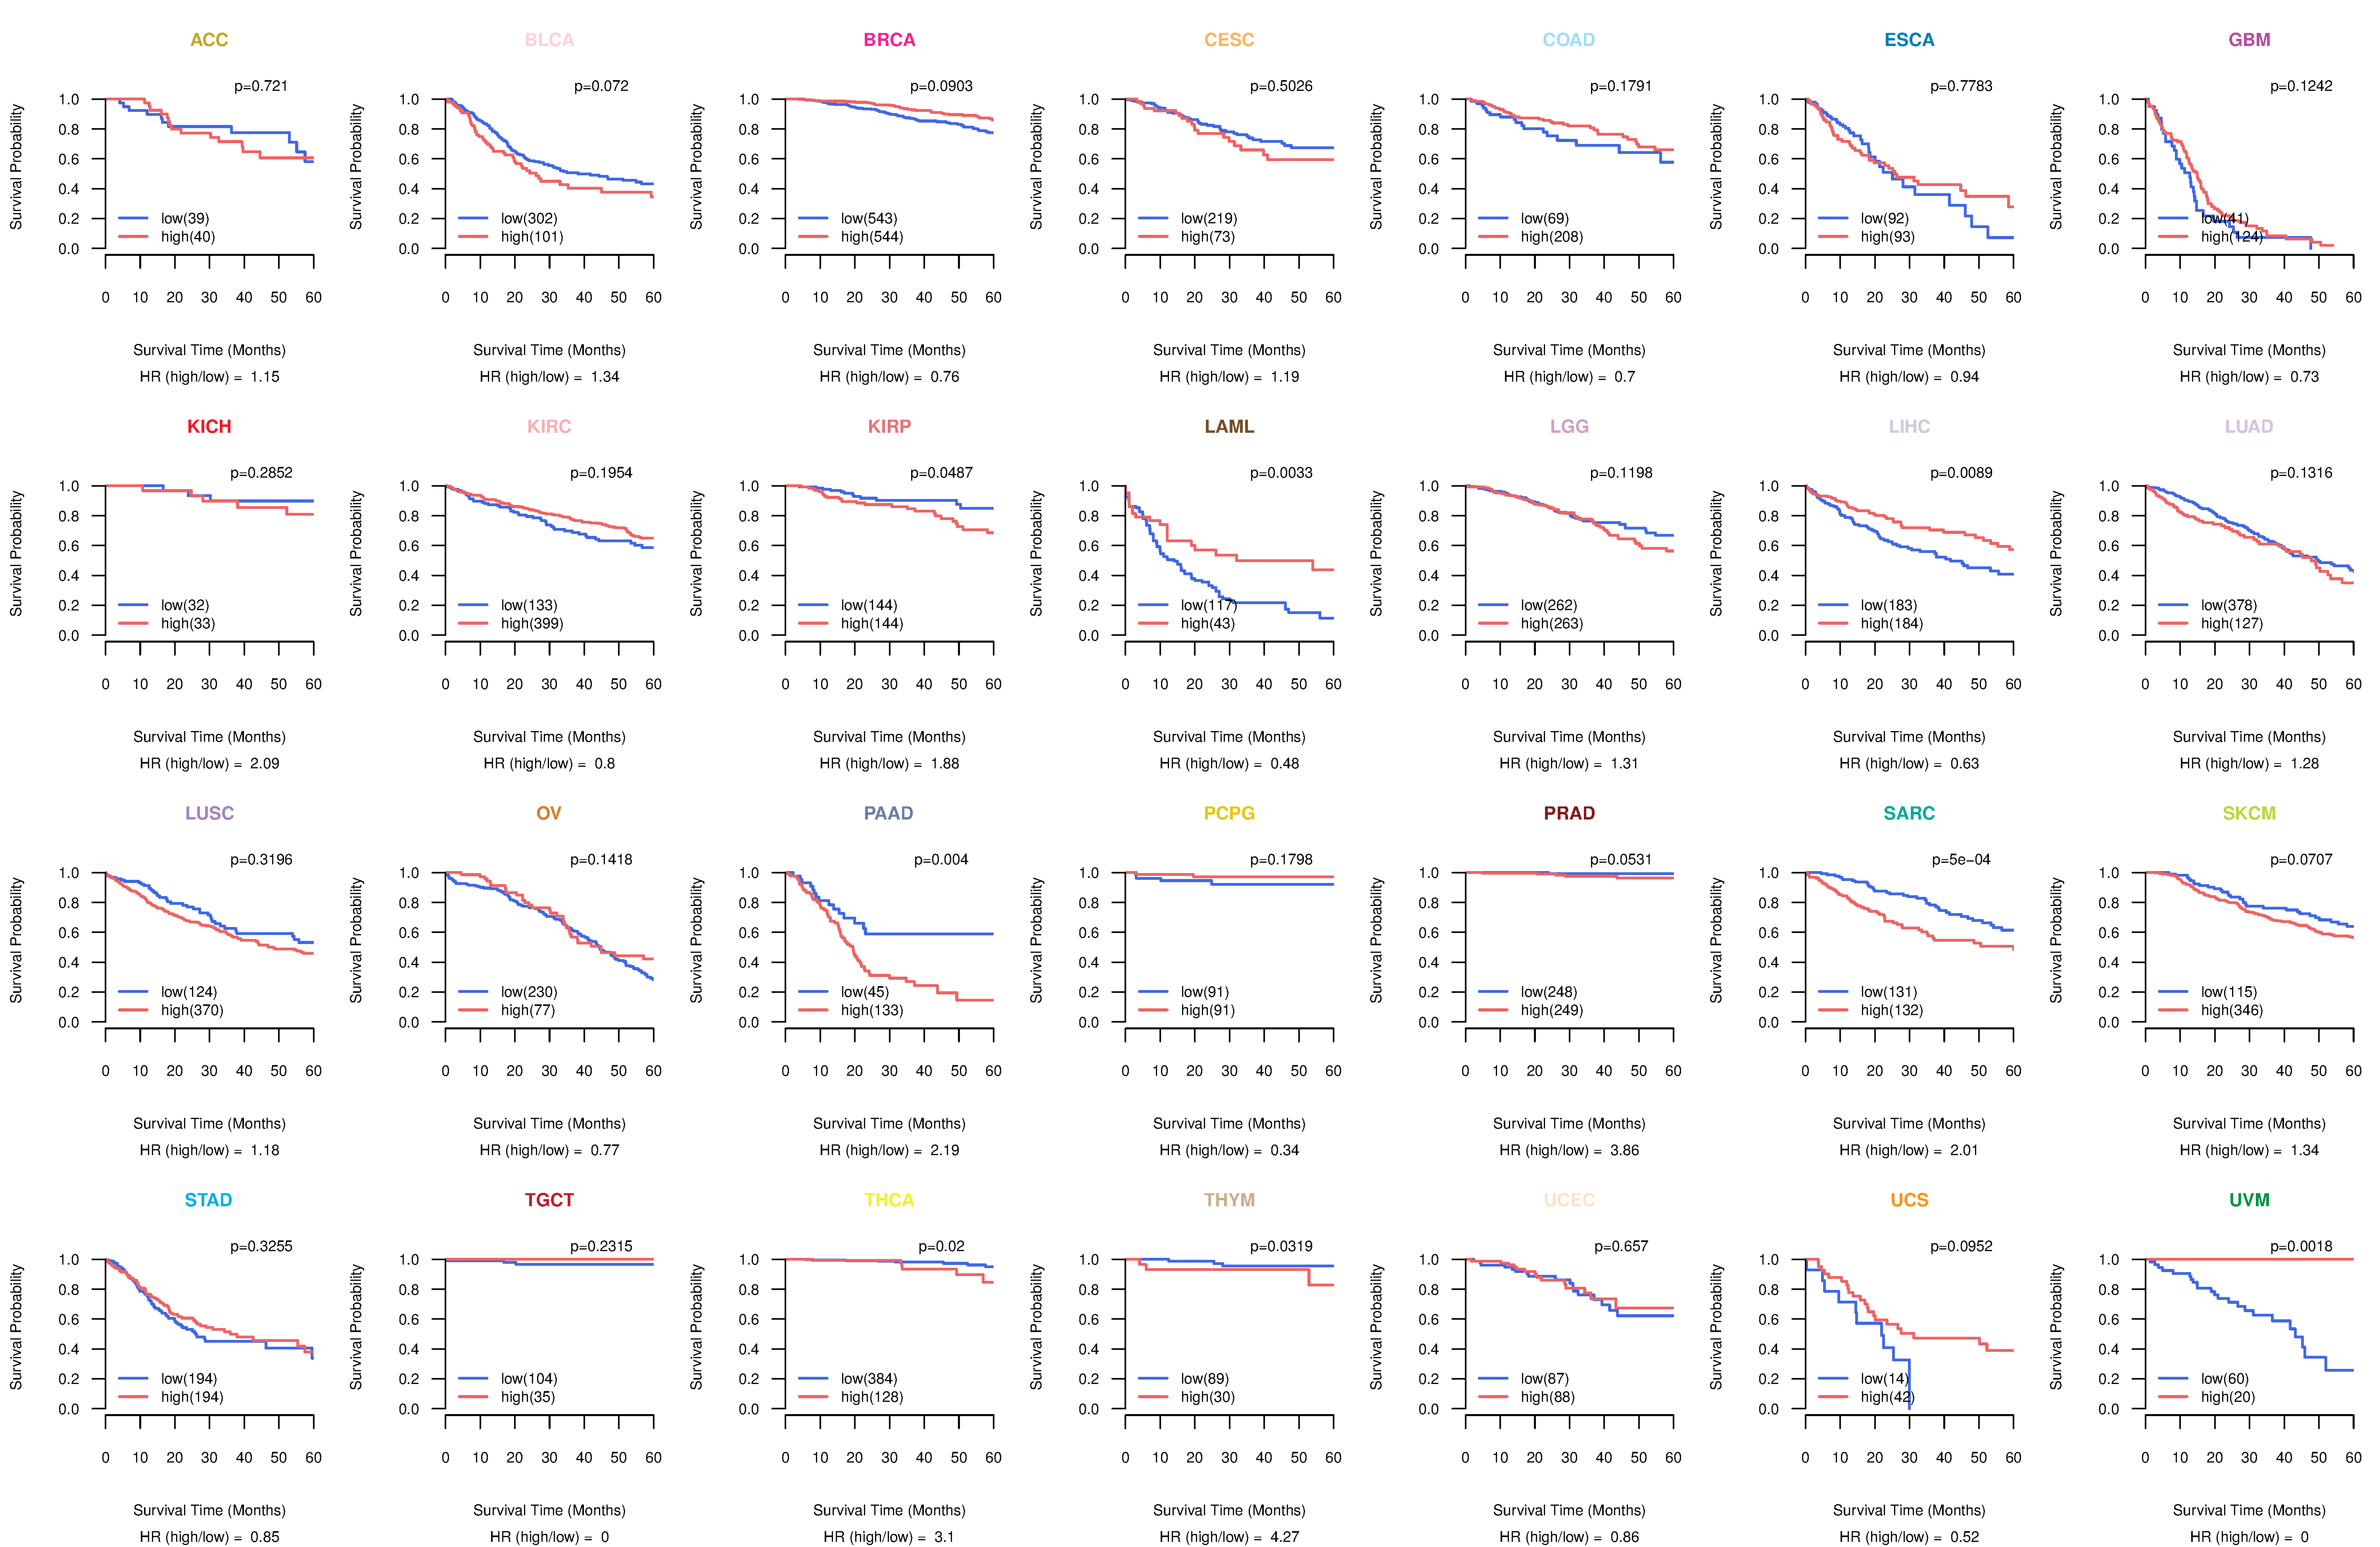 |
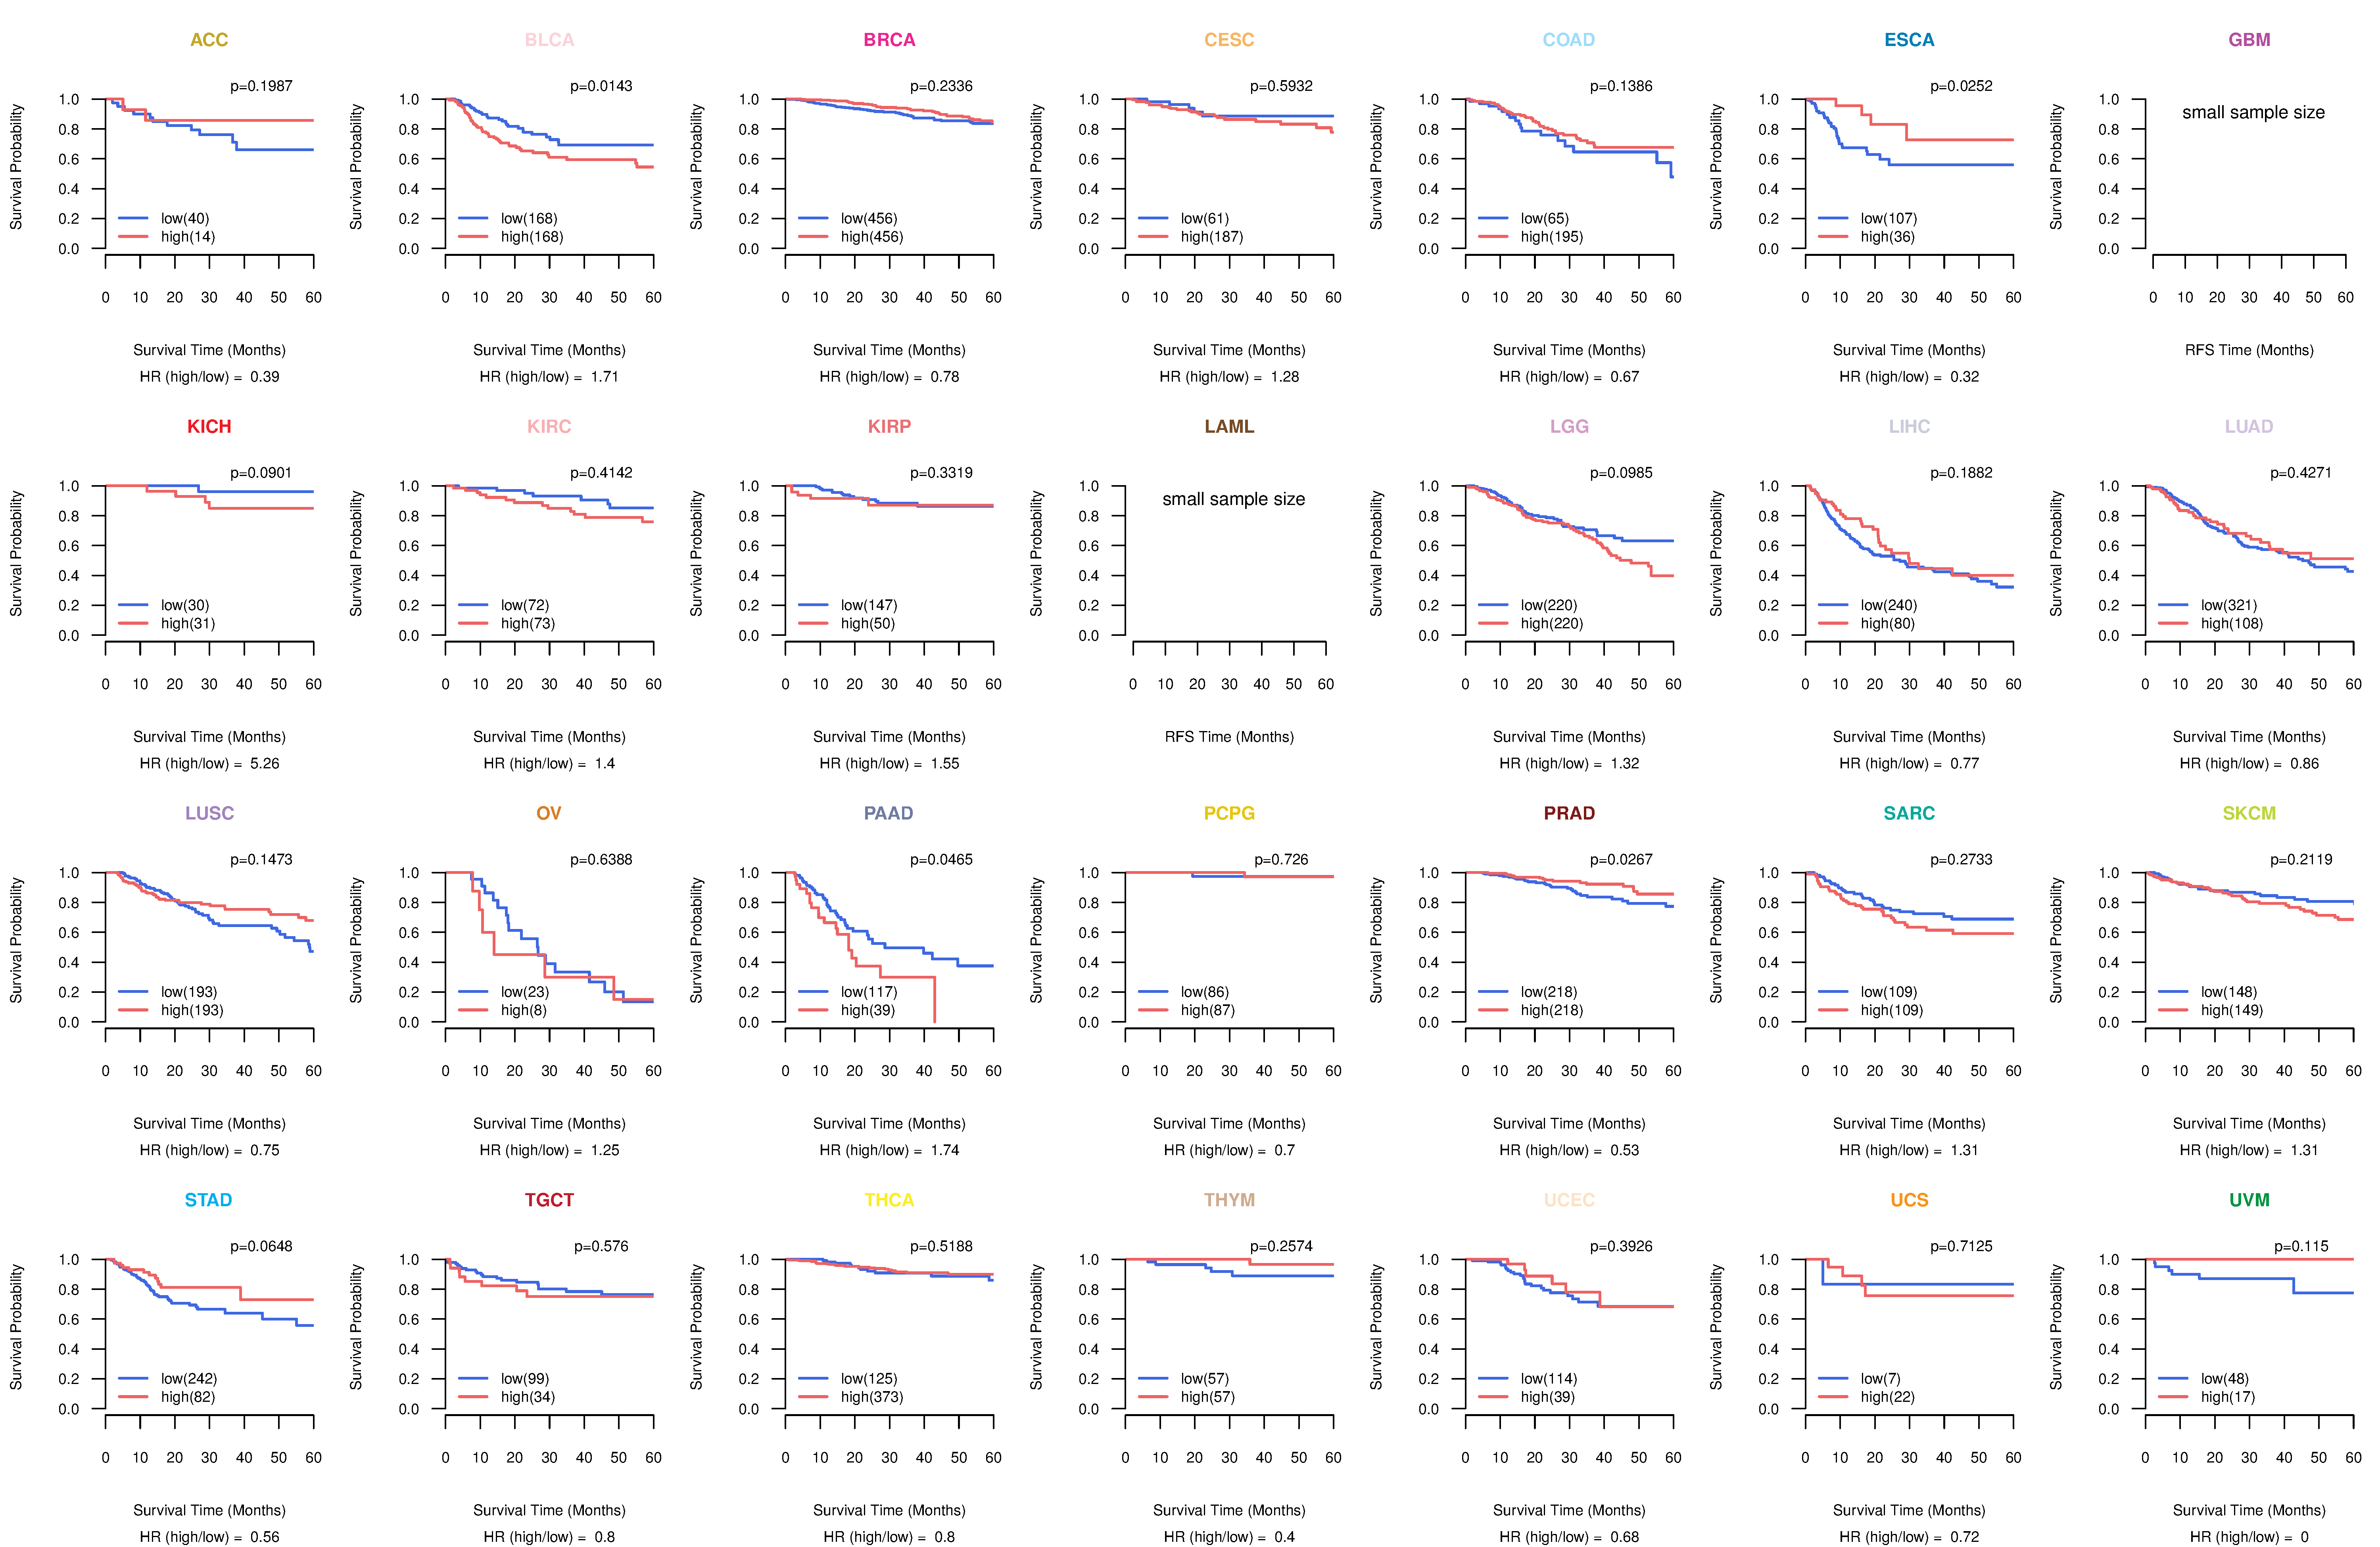
| Kaplan-Meier plots with logrank test of relapse free survival (RFS) using 28 cancer types (TCGA IlluminaHiSeq_RNASeqV2, pan-cancer normalized log2(norm_counts+1) data, version 2016-08-16) (TCGA clinicalMatrix, phenotype data, version 2016-04-27) * Click on the image enlarge it in a new window. |
 |
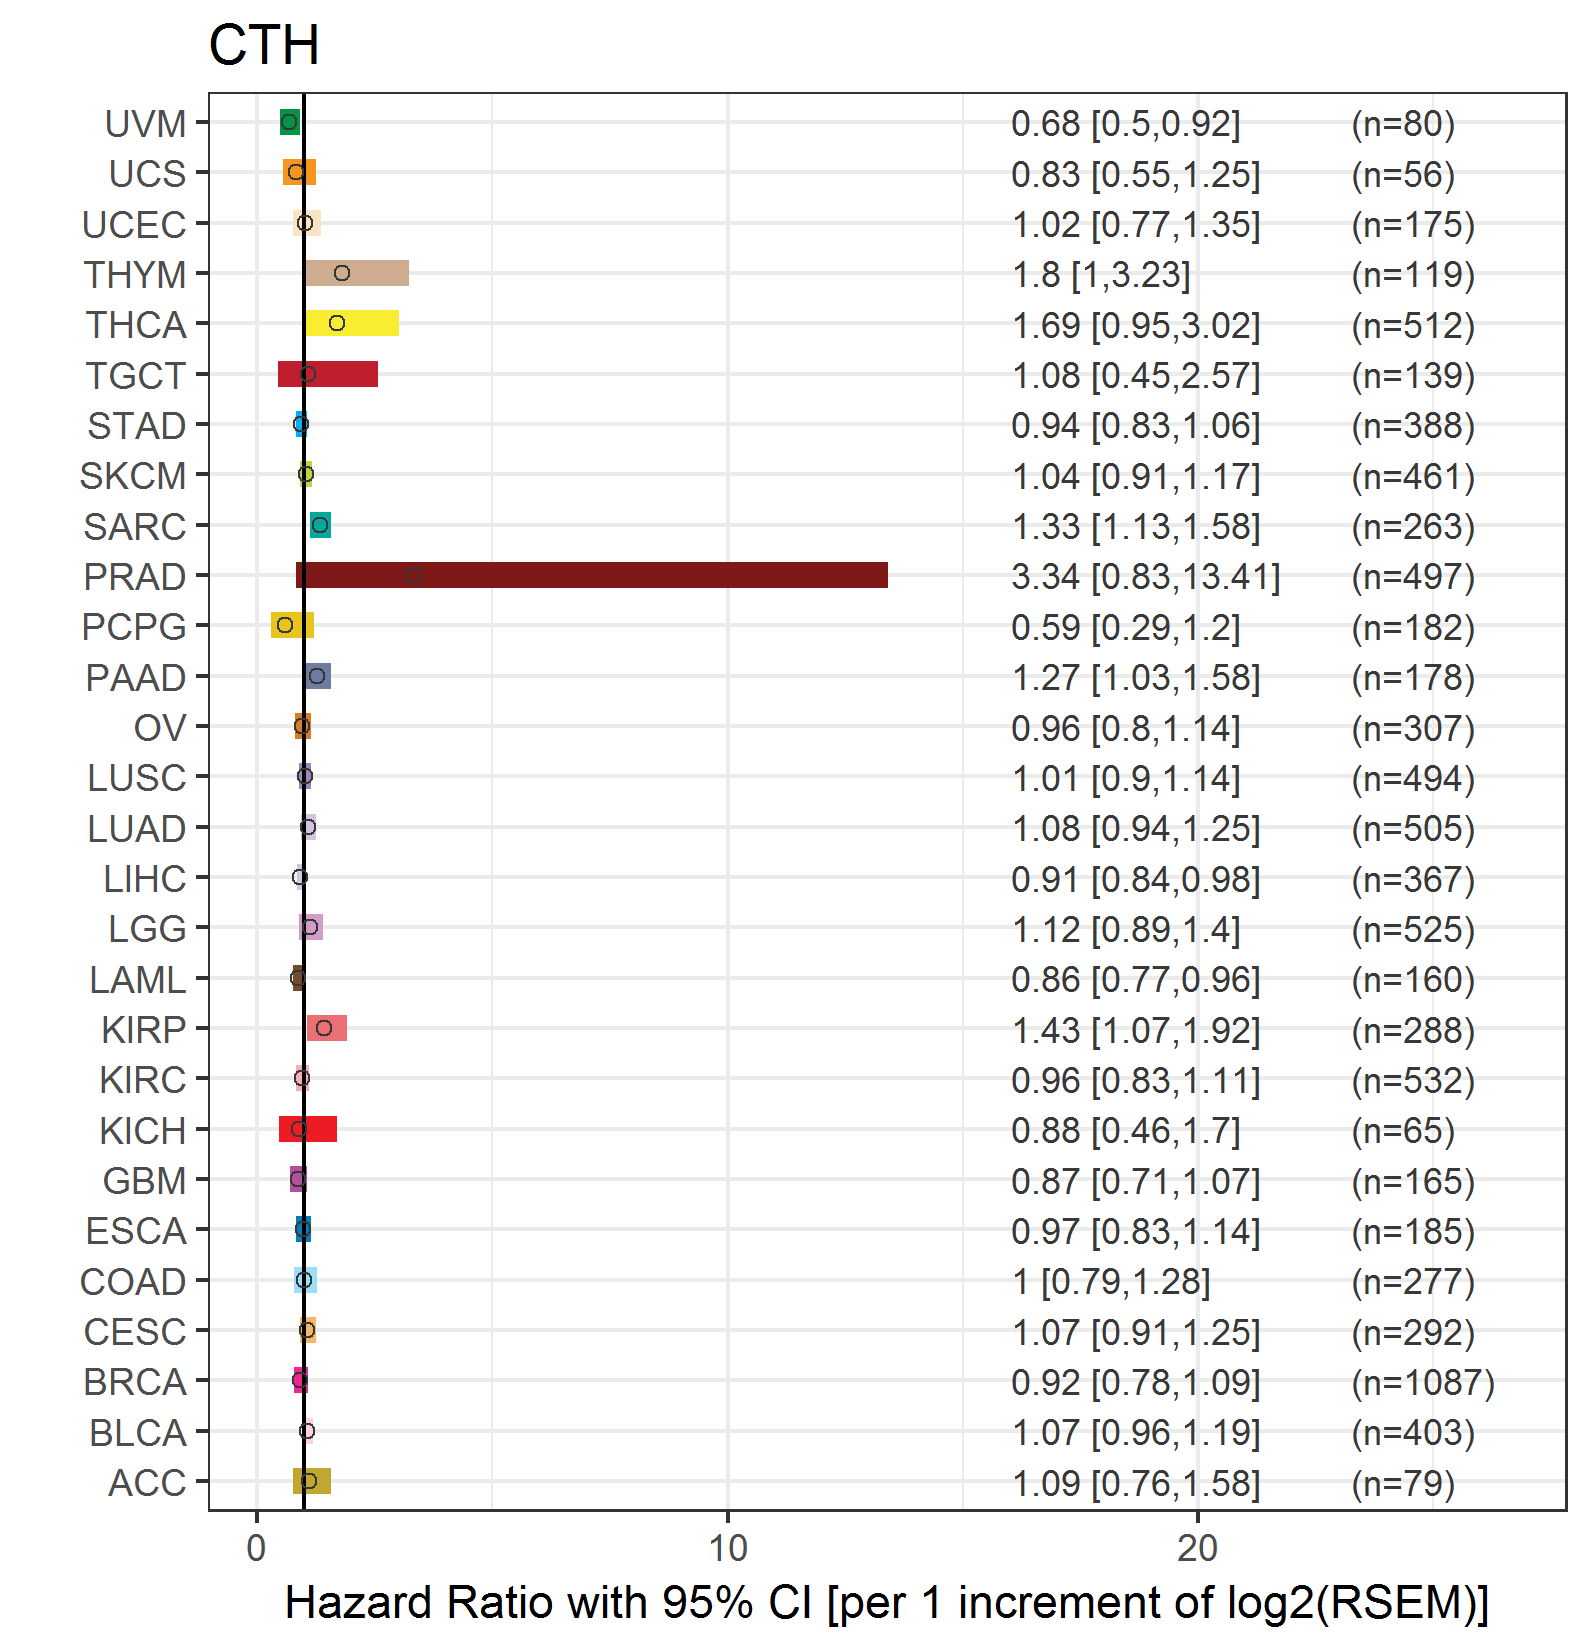
| Forest plot of Cox proportional hazard ratio (HR) and 95% CI of overall survival (OS) using 28 cancer types (TCGA IlluminaHiSeq_RNASeqV2, pan-cancer normalized log2(norm_counts+1) data, version 2016-08-16) (TCGA clinicalMatrix, phenotype data, version 2016-04-27) * Click on the image enlarge it in a new window. |
 |
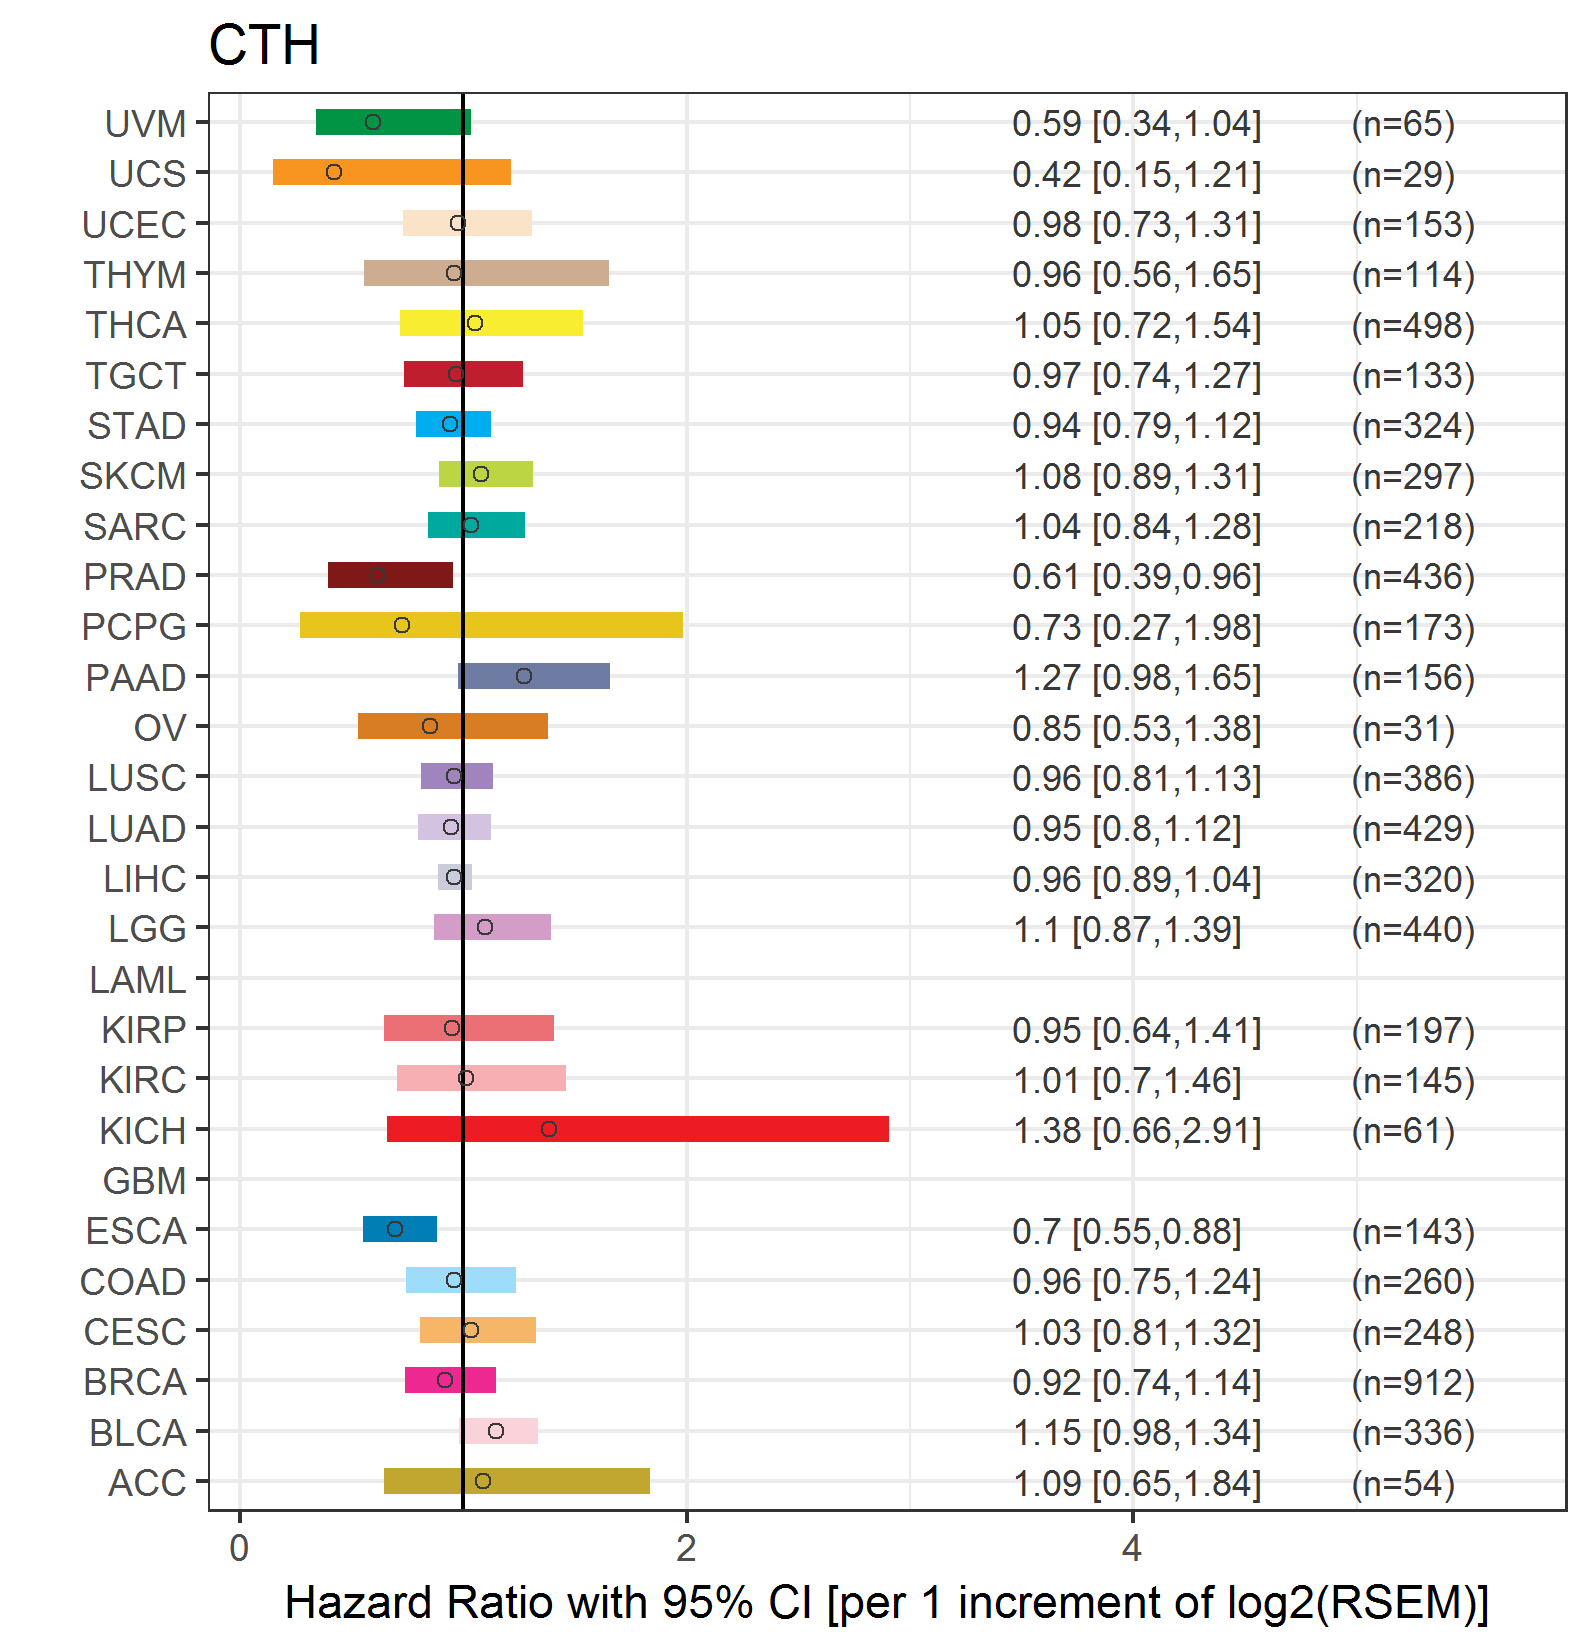
| Forest plot of Cox proportional hazard ratio (HR) and 95% CI of relapse free survival (RFS) using 28 cancer types (TCGA IlluminaHiSeq_RNASeqV2, pan-cancer normalized log2(norm_counts+1) data, version 2016-08-16) (TCGA clinicalMatrix, phenotype data, version 2016-04-27) * Click on the image enlarge it in a new window. |
 |
| Top |
| TissGeneClin for CTH |
| TissGeneDrug for CTH |
| Drug information targeting TissGene (DrugBank Version 5.0.6, 2017-04-01) |
| DrugBank ID | Drug name | Drug activity | Drug type | Drug status |
| DB00151 | L-Cysteine | Small molecule | Approved|Nutraceutical |
| Top |
| TissGeneDisease for CTH |
| Disease information associated with TissGene (DisGeNet, 2016-06-01) |
| Disease ID | Disease name | # pubmeds | Source |
| umls:C0220993 | Cystathioninuria | 4 | BeFree,CLINVAR,MGD,ORPHANET,UNIPROT |
| umls:C0268616 | Gamma-cystathionase deficiency | 3 | BeFree,CTD_human,ORPHANET |
| umls:C0005684 | Malignant neoplasm of urinary bladder | 2 | BeFree,GAD |
| umls:C0002986 | Fabry Disease | 1 | BeFree |
| umls:C0004153 | Atherosclerosis | 1 | GAD |
| umls:C0007102 | Malignant tumor of colon | 1 | BeFree |
| umls:C0008924 | Cleft Lip | 1 | GAD |
| umls:C0008925 | Cleft Palate | 1 | GAD |
| umls:C0017636 | Glioblastoma | 1 | BeFree |
| umls:C0020538 | Hypertensive disease | 1 | BeFree |
| umls:C0021361 | Female infertility | 1 | GAD |
| umls:C0021655 | Insulin Resistance | 1 | GAD |
| umls:C0024117 | Chronic Obstructive Airway Disease | 1 | GAD |
| umls:C0025202 | melanoma | 1 | BeFree |
| umls:C0027819 | Neuroblastoma | 1 | BeFree |
| umls:C0035235 | Respiratory Syncytial Virus Infections | 1 | BeFree |
| umls:C0042373 | Vascular Diseases | 1 | BeFree |
| umls:C0080178 | Spina Bifida | 1 | GAD |
| umls:C0086543 | Cataract | 1 | RGD |
| umls:C0242379 | Malignant neoplasm of lung | 1 | GAD |
| umls:C0376358 | Malignant neoplasm of prostate | 1 | BeFree |
| umls:C0600139 | Prostate carcinoma | 1 | BeFree |
| umls:C0699790 | Colon Carcinoma | 1 | BeFree |
| umls:C0699885 | Carcinoma of bladder | 1 | BeFree |
| umls:C0700095 | Central neuroblastoma | 1 | BeFree |
| umls:C0920646 | Renal ischaemia | 1 | BeFree |
| umls:C2239176 | Liver carcinoma | 1 | BeFree |
|
Copyright 2016-Present - The University of Texas Health Science Center at Houston (UTHealth) Web File Viewing | How to Report, Fraud, Waste and Abuse | State of Texas | Statewide Search | Texas Homeland Security | Site Policies |