 |
| |
| |
| |
| |
| |
| |
|

| TissGeneSummary for EPHB3 |
 Gene summary Gene summary |
| Basic gene information | Gene symbol | EPHB3 |
| Gene name | EPH receptor B3 | |
| Synonyms | ETK2|HEK2|TYRO6 | |
| Cytomap | UCSC genome browser: 3q27.1 | |
| Type of gene | protein-coding | |
| RefGenes | NM_004443.3, | |
| Description | EK2EPH-like kinase 2EPH-like tyrosine kinase 2EPH-like tyrosine kinase-2embryonic kinase 2ephrin type-B receptor 3human embryo kinase 2tyrosine-protein kinase TYRO6 | |
| Modification date | 20141207 | |
| dbXrefs | MIM : 601839 | |
| HGNC : HGNC | ||
| Ensembl : ENSG00000182580 | ||
| HPRD : 03502 | ||
| Vega : OTTHUMG00000156710 | ||
| Protein | UniProt: go to UniProt's Cross Reference DB Table | |
| Expression | CleanEX: HS_EPHB3 | |
| BioGPS: 2049 | ||
| Pathway | NCI Pathway Interaction Database: EPHB3 | |
| KEGG: EPHB3 | ||
| REACTOME: EPHB3 | ||
| Pathway Commons: EPHB3 | ||
| Context | iHOP: EPHB3 | |
| ligand binding site mutation search in PubMed: EPHB3 | ||
| UCL Cancer Institute: EPHB3 | ||
| Assigned class in TissGDB* | C | |
| Included tissue-specific gene expression resources | TiGER,GTEx | |
| Specific-tissues in normal samples (assigned by TissGDB using HPA, TiGER, and GTEx) | ColonSkin | |
| Cancer types related to the specific-tissues in cancer samples (assigned by TissGDB using TCGA) | COADSKCM | |
| Reference showing the relevant tissue of EPHB3 | ||
| Description by TissGene annotations | Cancer gene | |
| * Class A consists of genes with literature evidence and is part of the cTissGenes. Class B consists of only cTissGenes without additional evidence. The remaining genes belong to Class C. |
| Gene ontology having evidence of Inferred from Direct Assay (IDA) from Entrez |
| GO ID | GO term | PubMed ID | GO:0016477 | cell migration | 15536074 | GO:0022407 | regulation of cell-cell adhesion | 8397371 | GO:0032314 | regulation of Rac GTPase activity | 15536074 | GO:0034446 | substrate adhesion-dependent cell spreading | 15536074 | GO:0043088 | regulation of Cdc42 GTPase activity | 15536074 | GO:0046777 | protein autophosphorylation | 15536074 | GO:0048013 | ephrin receptor signaling pathway | 15536074 | GO:0016477 | cell migration | 15536074 | GO:0022407 | regulation of cell-cell adhesion | 8397371 | GO:0032314 | regulation of Rac GTPase activity | 15536074 | GO:0034446 | substrate adhesion-dependent cell spreading | 15536074 | GO:0043088 | regulation of Cdc42 GTPase activity | 15536074 | GO:0046777 | protein autophosphorylation | 15536074 | GO:0048013 | ephrin receptor signaling pathway | 15536074 |
| Top |
| TissGeneExp for EPHB3 |
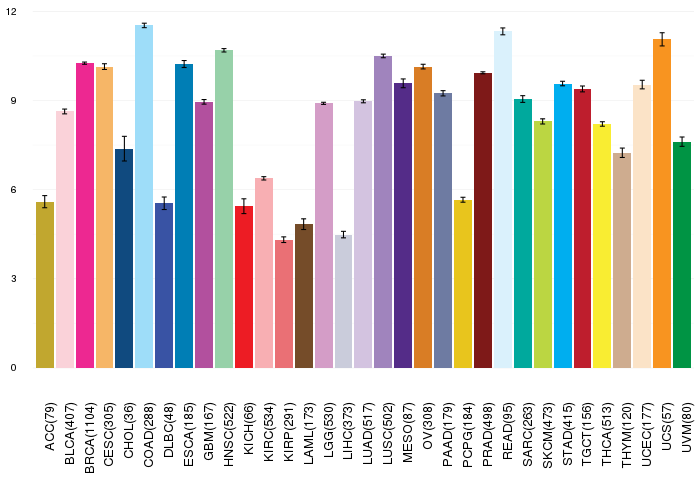
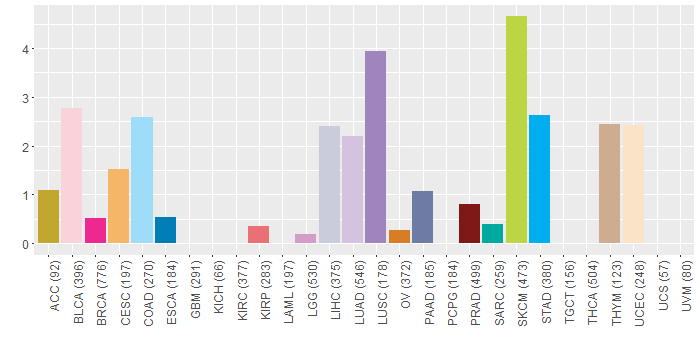
| Gene expressions across 28 cancer types (X-axis: cancer type and Y-axis: log2(norm_counts+1)) (TCGA IlluminaHiSeq_RNASeqV2, pan-cancer normalized log2(norm_counts+1) data, version 2016-08-16) |
 |
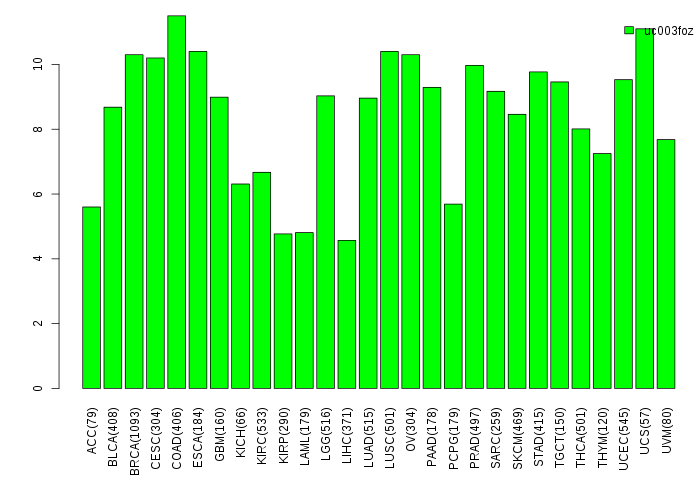
| Gene isoform expressions across 28 cancer types (X-axis: cancer type and Y-axis: log2(norm_counts+1)) (TCGA pan-cancer tcga_rsem_isoform_tpm, version 2016-09-01) |
 |
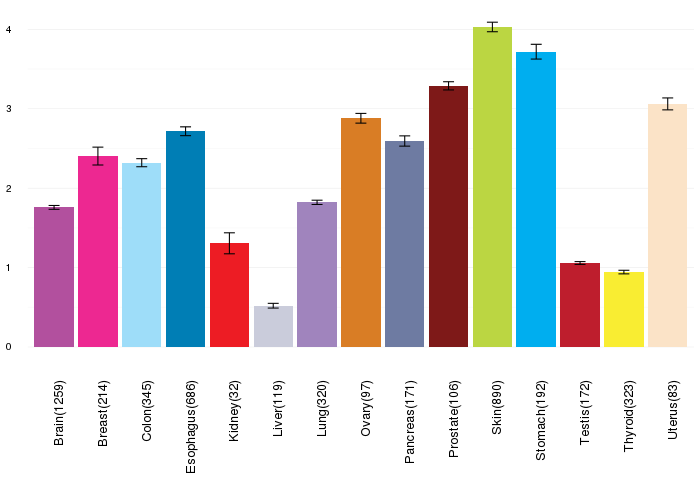
| Gene expressions across normal tissues of GTEx data (GTEx GTEx_Analysis_v6_RNA-seq_RNA-SeQCv1.1.8_gene_rpkm.gct) - Here, we shows the matched tissue types only among our 28 cancer types. |
 |
| Different expressions across 14 cancer types with more than 10 samples between matched tumors and normals (X-axis: cancer type and Y-axis: log2(norm_counts+1)) (TCGA IlluminaHiSeq_RNASeqV2, pan-cancer normalized log2(norm_counts+1) data, version 2016-08-16) |
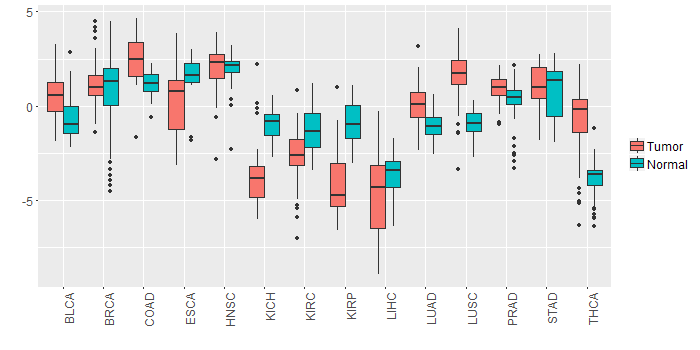 |
| - Significantly differentially expressed cancer types and information. (|Fold change|>1 and FDR<0.05) |
| Cancer type | Mean(exp) in tumor | Mean(exp) in matched normal | Log2FC | P-val. | FDR |
| KIRC | -2.655389206 | -1.318511428 | -1.336877778 | 2.58E-09 | 8.31E-09 |
| KICH | -3.442938984 | -0.969550984 | -2.473388 | 2.21E-06 | 7.82E-06 |
| LUAD | 0.11426405 | -1.04579457 | 1.160058621 | 1.18E-10 | 6.95E-10 |
| THCA | -0.748502577 | -3.841316137 | 3.092813559 | 2.16E-18 | 5.63E-17 |
| KIRP | -4.142323234 | -0.880388859 | -3.261934375 | 1.23E-11 | 1.69E-10 |
| LUSC | 1.587844781 | -0.955196396 | 2.543041176 | 1.16E-17 | 1.00E-16 |
| BLCA | 0.572885648 | -0.653598563 | 1.226484211 | 0.00653 | 0.032272711 |
| COAD | 2.447563785 | 1.159356093 | 1.288207692 | 8.62E-05 | 0.000320652 |
| Top |
| TissGene-miRNA for EPHB3 |
| Significantly anti-correlated miRNAs of TissGene across 28 cancer types (Gene-miRNA relations from TargetScanHuman Relsease 7.1, Conserved_Site_Context_Scores.txt.zip, 06.01.2016) (TCGA IlluminaHiSeq_miRNASeq, log2(RPM+1) data, version 2016-11-21) (TCGA IlluminaHiSeq_RNASeqV2, log2(normalized_count+1) data, version 2016-08-16) (Spearman’s Rank Correlation (p-value<0.05 and coefficient<-0.25)) |
| Cancer type | miRNA id | miRNA accession | P-val. | Coeff. | # samples |
| Top |
| TissGeneMut for EPHB3 |
| TissGeneSNV for EPHB3 |
| nsSNV counts per each loci. Different colors of circles represent different cancer types. Circle size denotes number of samples. (TCGA somatic mutation (SNPs and small INDELs) data, version 2016-04-25) * Click on the image to enlarge it in a new window. |
 |
 |
| Somatic nucleotide variants of TissGene across 28 cancer types (X-axis: cancer type and Y-axis: % of mutated samples) The numbers in parentheses are numbers of samples with mutation (nsSNVs). (TCGA somatic mutation (SNPs and small INDELs) data, version 2016-04-25) |
 |
| - nsSNVs sorted by frequency. |
| AAchange | Cancer type | # samples |
| p.R813W | SKCM | 2 |
| p.R420H | HNSC | 2 |
| p.R967L | BLCA | 2 |
| p.S795F | SKCM | 2 |
| p.W473C | BLCA | 1 |
| p.V876G | LIHC | 1 |
| p.P300S | SKCM | 1 |
| p.G404C | LUAD | 1 |
| p.S591L | HNSC | 1 |
| p.D370N | HNSC | 1 |
| p.Q997K | ACC | 1 |
| p.R93C | UCEC | 1 |
| p.I709L | STAD | 1 |
| p.K894E | LUSC | 1 |
| p.N618K | LUSC | 1 |
| p.P58L | SKCM | 1 |
| p.S788F | SKCM | 1 |
| p.D195N | SKCM | 1 |
| p.R762C | COAD | 1 |
| p.T926I | SKCM | 1 |
| p.E495K | LUSC | 1 |
| p.C116S | LIHC | 1 |
| p.Y292C | COAD | 1 |
| p.Y834C | COAD | 1 |
| p.R368W | PRAD | 1 |
| p.S819T | BRCA | 1 |
| p.T993M | PAAD | 1 |
| p.V107L | UCEC | 1 |
| p.R622W | BLCA | 1 |
| p.I888N | LIHC | 1 |
| p.R657H | LUAD | 1 |
| p.W840L | THYM | 1 |
| p.G549W | LIHC | 1 |
| p.N726K | STAD | 1 |
| p.A566T | SKCM | 1 |
| p.D758G | STAD | 1 |
| p.E636K | BLCA | 1 |
| p.D727N | PRAD | 1 |
| p.R941W | COAD | 1 |
| p.M738L | LUSC | 1 |
| p.D259G | COAD | 1 |
| p.T419A | LUAD | 1 |
| p.E407K | SKCM | 1 |
| p.E643D | HNSC | 1 |
| p.S775L | SKCM | 1 |
| p.E407* | LUAD | 1 |
| p.D789N | STAD | 1 |
| p.R391H | READ | 1 |
| p.A908T | STAD | 1 |
| p.V947L | BLCA | 1 |
| p.R705W | SKCM | 1 |
| p.S704I | UCEC | 1 |
| p.R440H | PRAD | 1 |
| p.Q402H | LUAD | 1 |
| p.A192T | UCEC | 1 |
| p.R460C | PRAD | 1 |
| p.Y924C | ESCA | 1 |
| p.V947F | BRCA | 1 |
| p.G218V | LIHC | 1 |
| p.D485Y | STAD | 1 |
| p.S681N | LGG | 1 |
| p.R649C | HNSC | 1 |
| p.E627Q | LUAD | 1 |
| p.N991K | KIRP | 1 |
| p.P453T | THYM | 1 |
| p.D820N | BRCA | 1 |
| p.E487* | LUAD | 1 |
| p.R326H | BLCA | 1 |
| p.P479S | COAD | 1 |
| p.R877Q | STAD | 1 |
| p.M505I | BLCA | 1 |
| p.A217T | PAAD | 1 |
| p.E247D | UCEC | 1 |
| p.S387L | BLCA | 1 |
| p.S953F | SKCM | 1 |
| p.A517T | THYM | 1 |
| p.R179L | LUAD | 1 |
| p.L749Q | LIHC | 1 |
| p.R696W | SKCM | 1 |
| p.L739F | OV | 1 |
| p.P436T | LIHC | 1 |
| p.R114H | STAD | 1 |
| p.K606N | LUSC | 1 |
| p.L749M | UCEC | 1 |
| p.E492Q | CESC | 1 |
| p.E358K | LUSC | 1 |
| p.G950R | SKCM | 1 |
| p.E455Q | BLCA | 1 |
| p.T94M | LIHC | 1 |
| p.M861T | COAD | 1 |
| p.A718T | BLCA | 1 |
| p.W804C | LUAD | 1 |
| p.E541G | STAD | 1 |
| p.R813Q | PAAD | 1 |
| p.V155A | LIHC | 1 |
| p.L513F | SKCM | 1 |
| p.P787S | SKCM | 1 |
| p.A417T | CESC | 1 |
| p.W149C | LUAD | 1 |
| p.G778C | LUAD | 1 |
| p.M752I | SKCM | 1 |
| p.R649P | BRCA | 1 |
| p.Q909* | HNSC | 1 |
| p.E619K | CESC | 1 |
| p.R173C | LUAD | 1 |
| p.R622Q | STAD | 1 |
| p.A451V | SKCM | 1 |
| p.F951C | SKCM | 1 |
| p.A718S | LUSC | 1 |
| p.P706L | LUAD | 1 |
| p.A538S | SARC | 1 |
| p.R897C | PAAD | 1 |
| p.E358A | STAD | 1 |
| p.A171V | SKCM | 1 |
| p.A386V | SKCM | 1 |
| p.L881H | BRCA | 1 |
| Top |
| TissGeneCNV for EPHB3 |
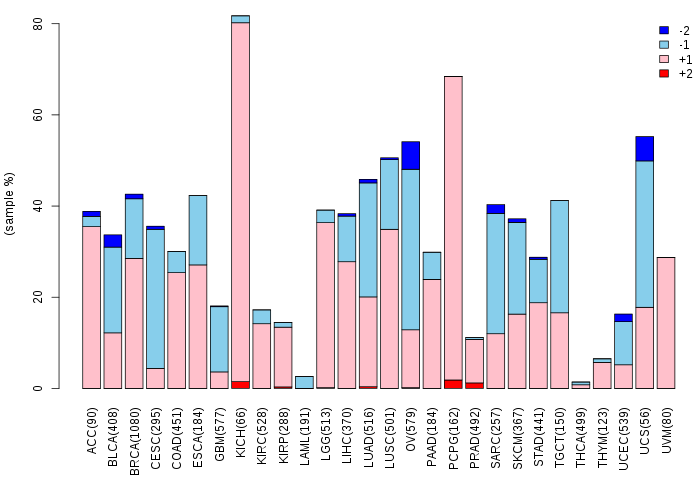
| Copy number variations of TissGene across 28 cancer types (X-axis: cancer type and Y-axis: % of CNV samples) (TCGA Gistic2_CopyNumber_Gistic2_all_data_by_genes, Gistic2 copy number data, version 2016-08-16) |
 |
| Top |
| TissGeneFusions for EPHB3 |
| Fusion genes including TissGene (ChimerDB 3.0, 2016-12-01 and TCGA fusion Portal 2015-12-01) |
| Database | Src | Cancer type | Sample | Fusion gene | ORF | 5'-gene BP | 3'-gene BP |
| TCGAfusionPortal | PRADA | BRCA | TCGA-AQ-A04J-01A | PIGZ-EPHB3 | In-frame | Chr3:196678692 | Chr3:184289106 |
| Top |
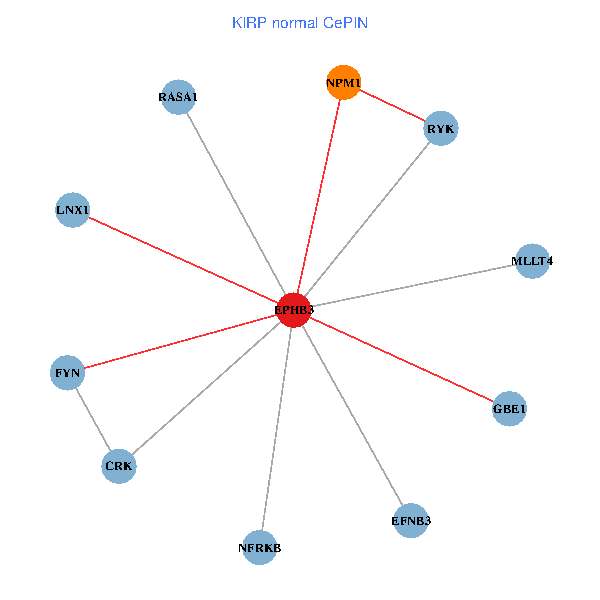
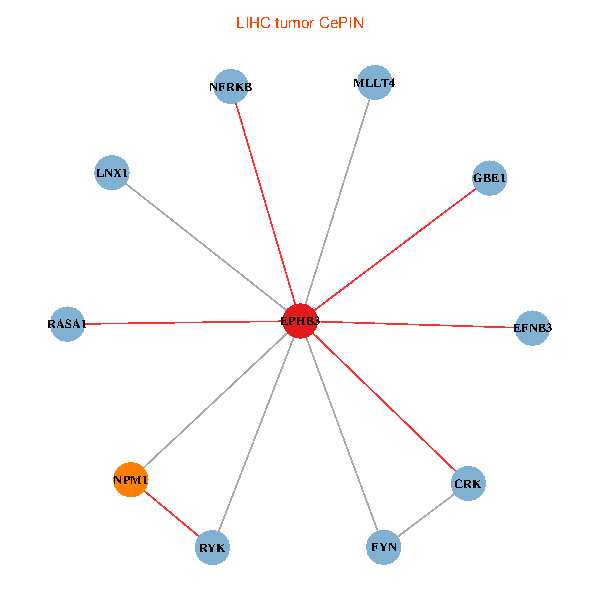
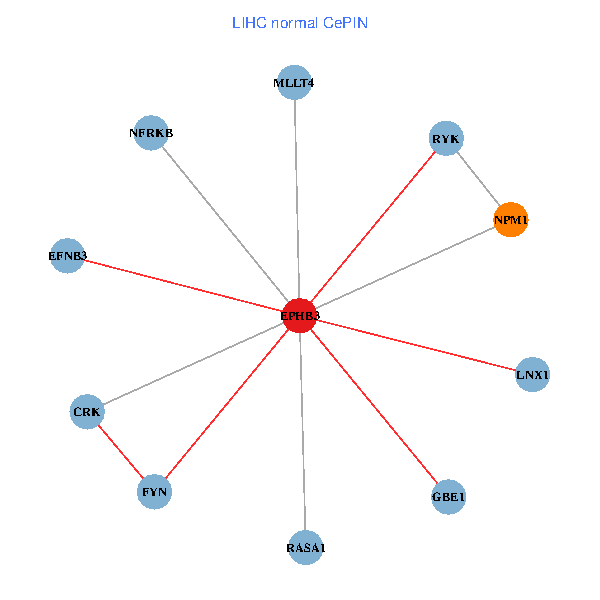
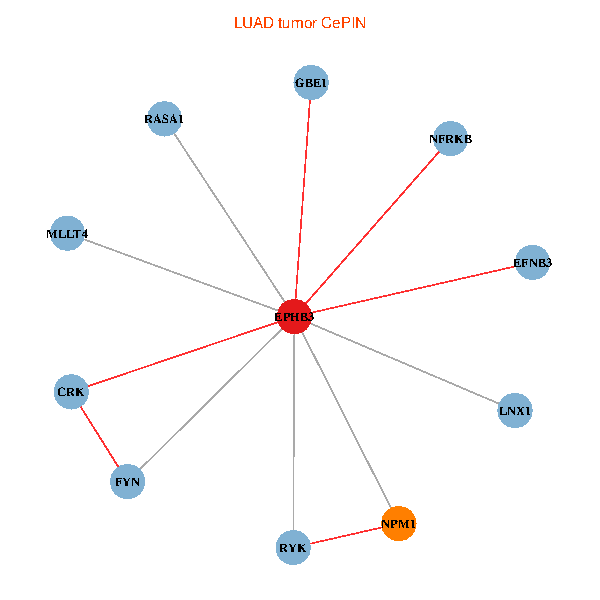
| TissGeneNet for EPHB3 |
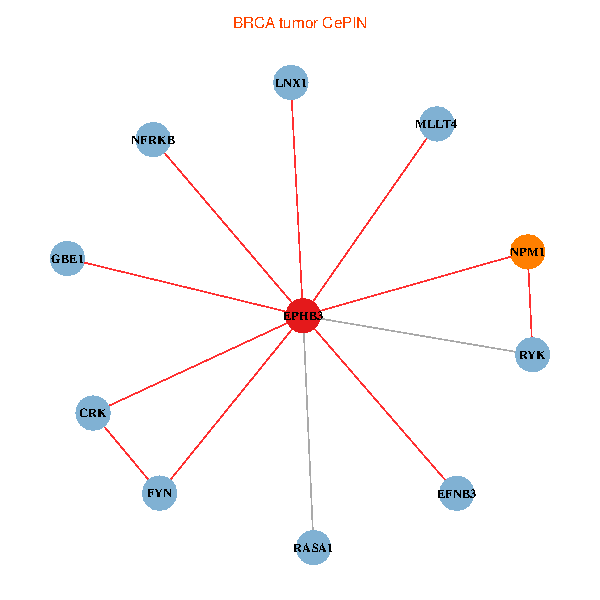
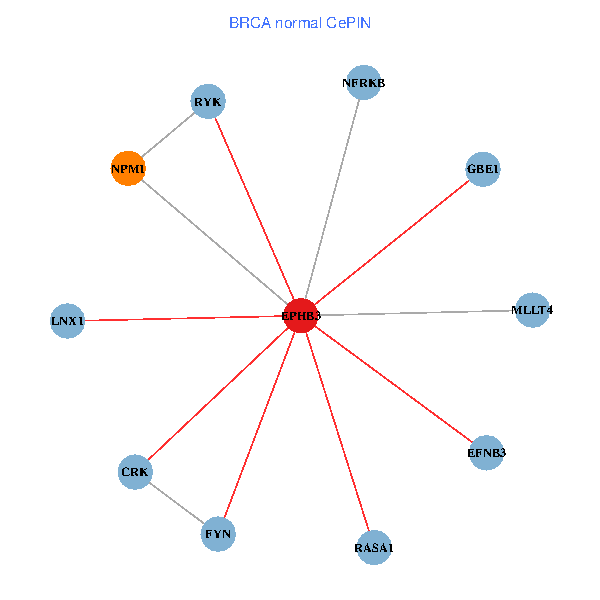
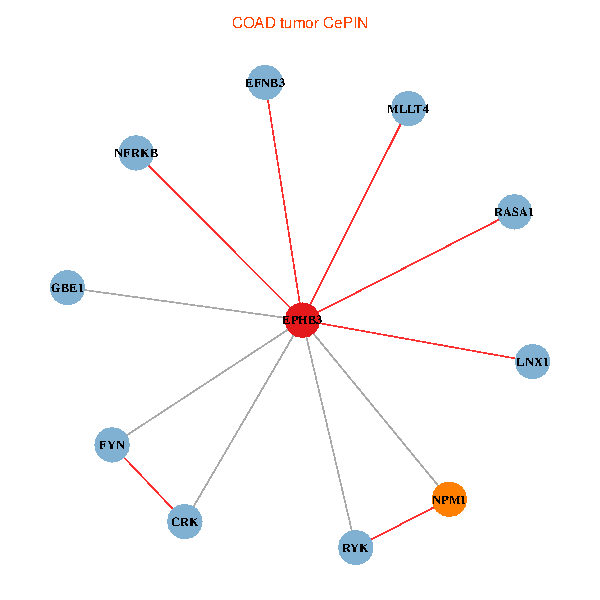
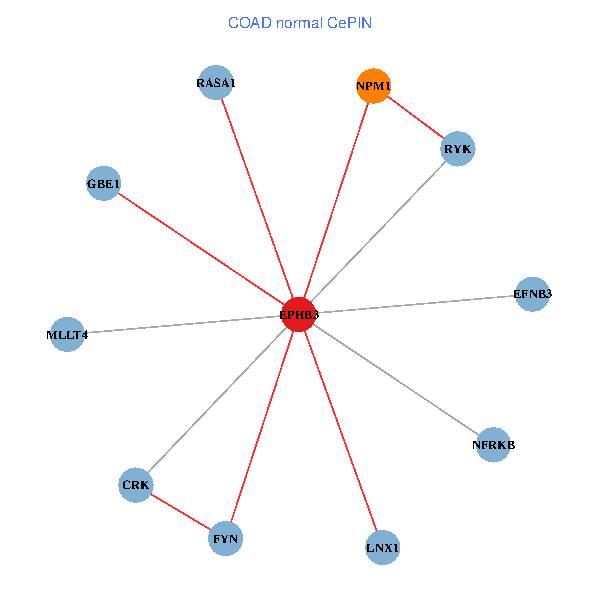
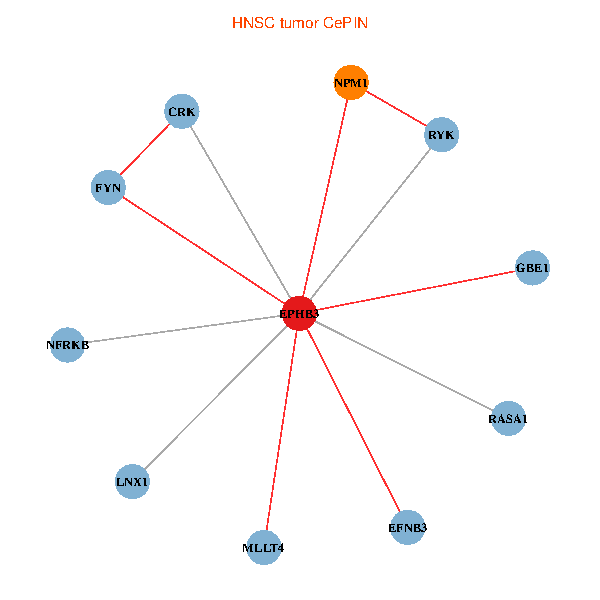
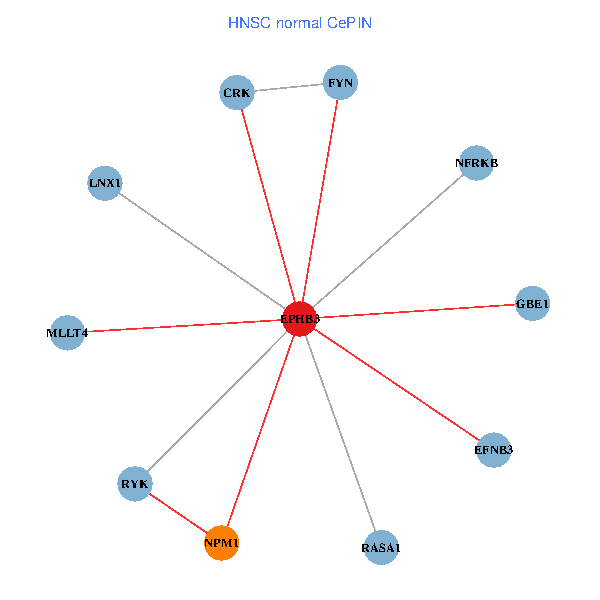
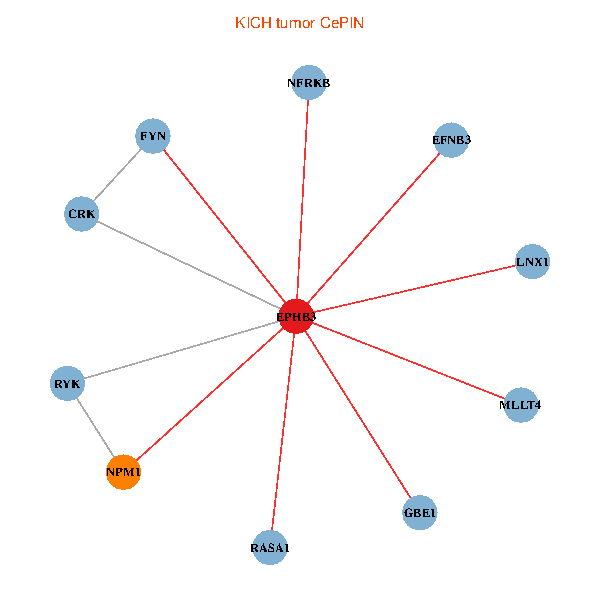
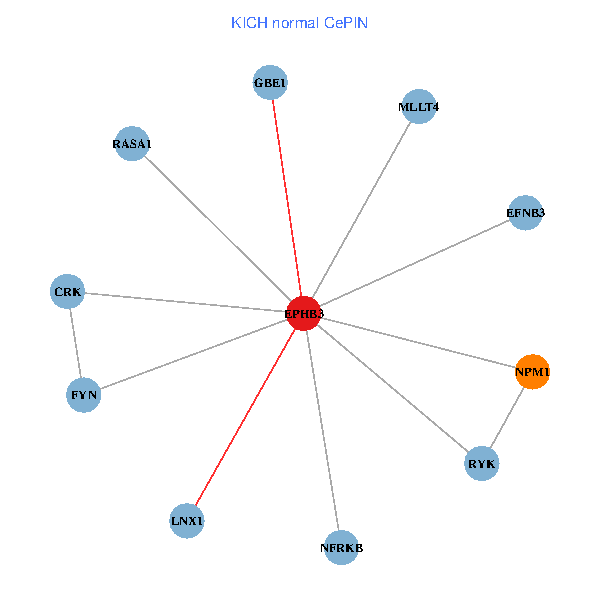
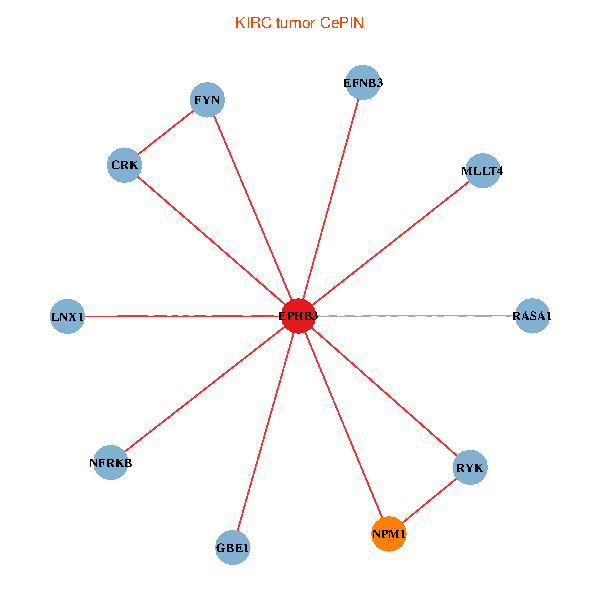
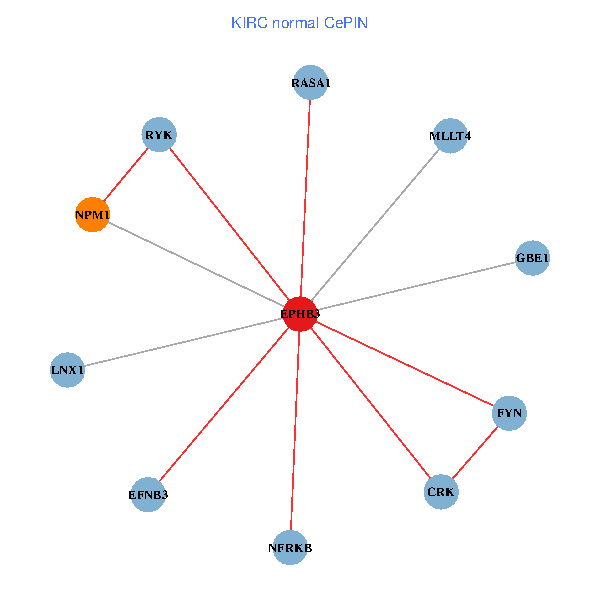
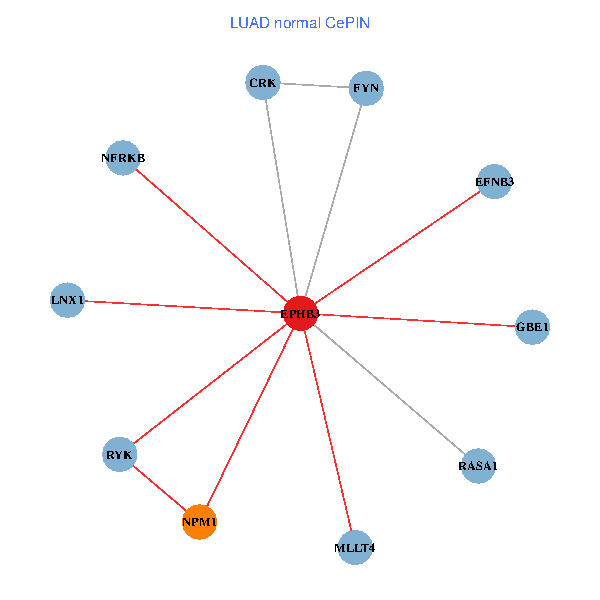
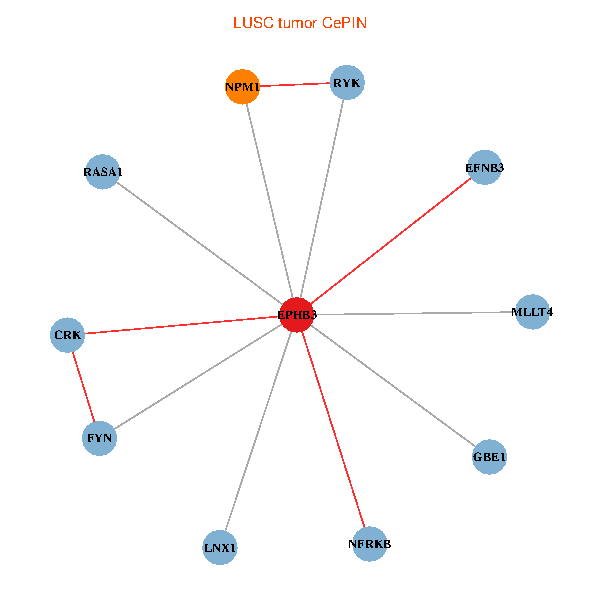
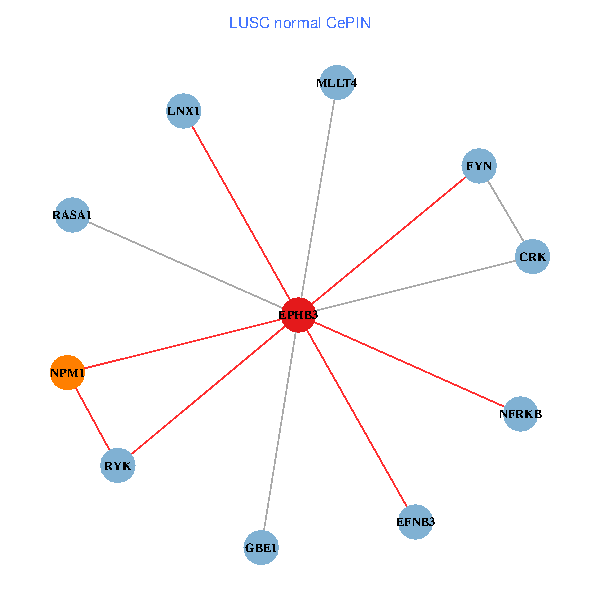
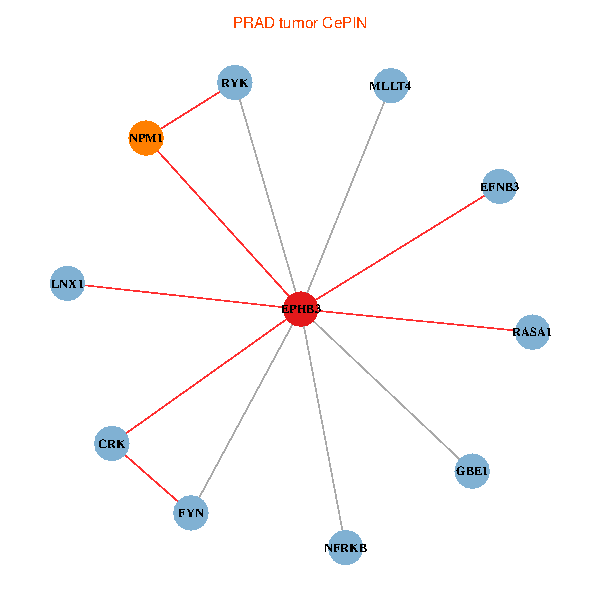
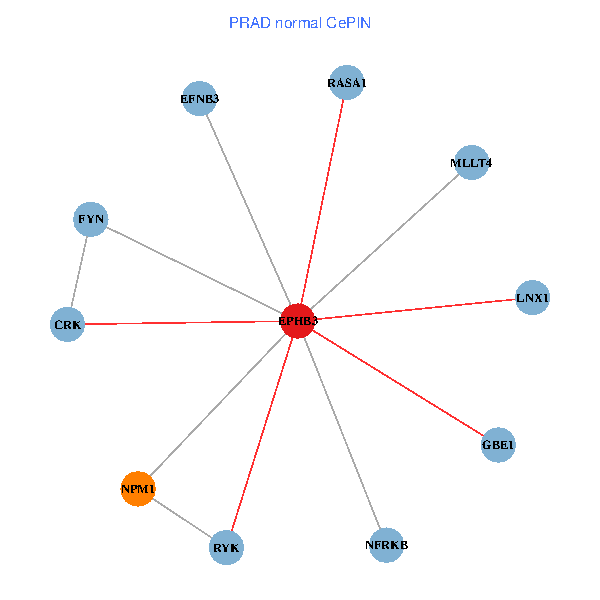
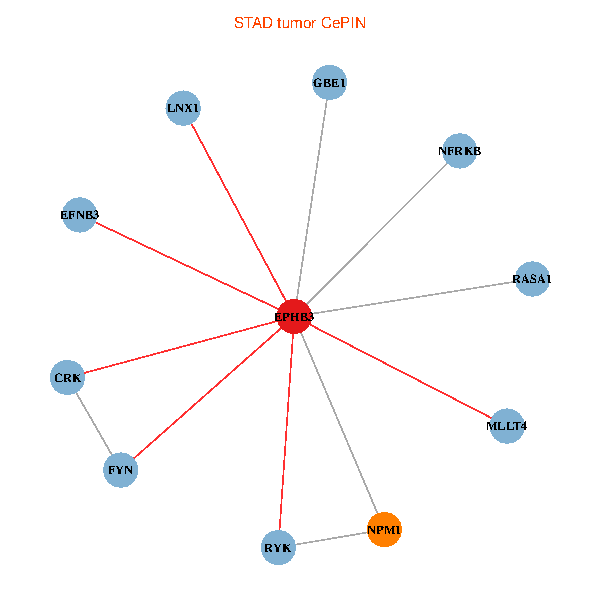
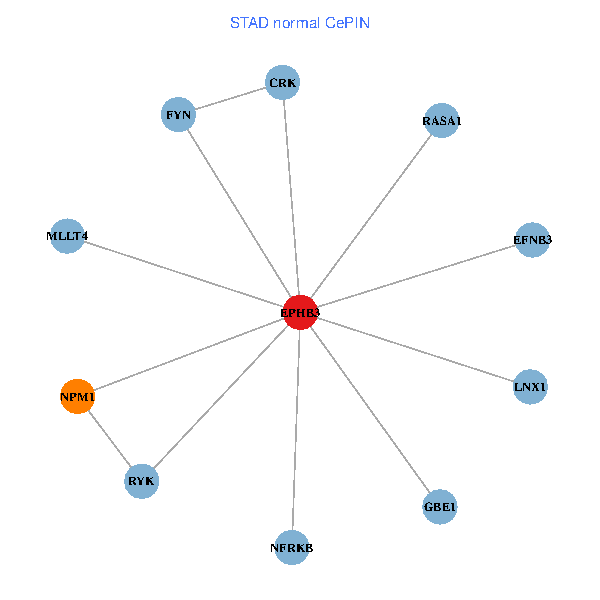
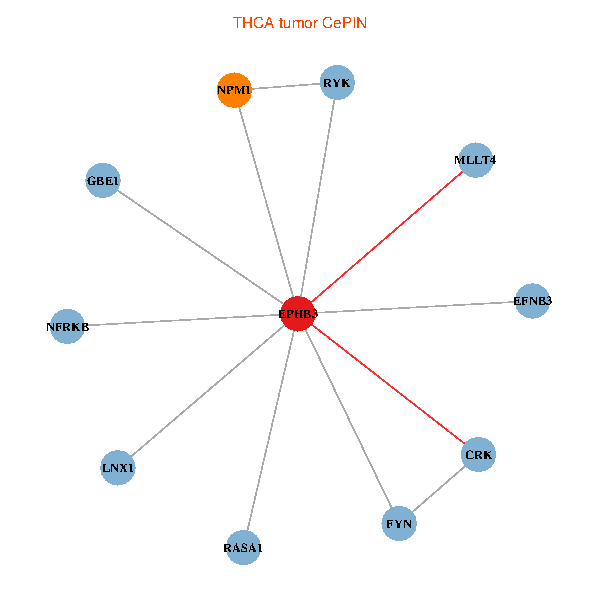
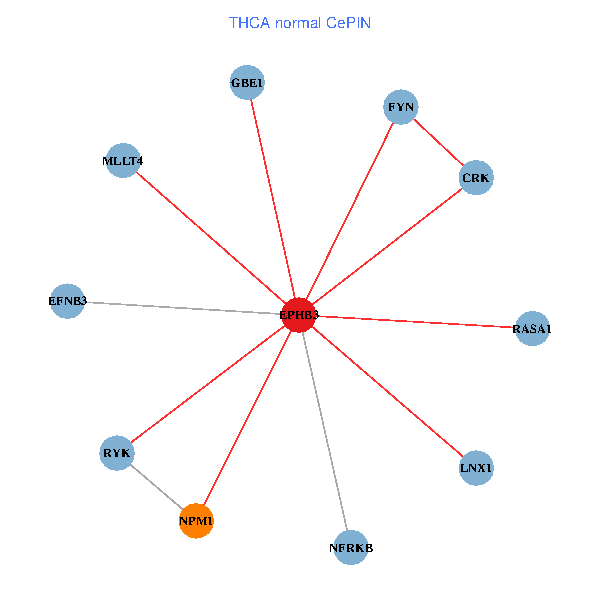
| Co-expressed gene networks based on protein-protein interaction data (CePIN) (TCGA IlluminaHiSeq_RNASeqV2, pan-cancer normalized log2(norm_counts+1) data, version 2016-08-16) (PINA2 ppi data) |
| BRCA (tumor) | BRCA (normal) |
| EPHB3, FYN, NPM1, CRK, MLLT4, LNX1, RASA1, RYK, NFRKB, GBE1, EFNB3 (tumor) | EPHB3, FYN, NPM1, CRK, MLLT4, LNX1, RASA1, RYK, NFRKB, GBE1, EFNB3 (normal) |
 |  |
| COAD (tumor) | COAD (normal) |
| EPHB3, FYN, NPM1, CRK, MLLT4, LNX1, RASA1, RYK, NFRKB, GBE1, EFNB3 (tumor) | EPHB3, FYN, NPM1, CRK, MLLT4, LNX1, RASA1, RYK, NFRKB, GBE1, EFNB3 (normal) |
 |  |
| HNSC (tumor) | HNSC (normal) |
| EPHB3, FYN, NPM1, CRK, MLLT4, LNX1, RASA1, RYK, NFRKB, GBE1, EFNB3 (tumor) | EPHB3, FYN, NPM1, CRK, MLLT4, LNX1, RASA1, RYK, NFRKB, GBE1, EFNB3 (normal) |
 |  |
| KICH (tumor) | KICH (normal) |
| EPHB3, FYN, NPM1, CRK, MLLT4, LNX1, RASA1, RYK, NFRKB, GBE1, EFNB3 (tumor) | EPHB3, FYN, NPM1, CRK, MLLT4, LNX1, RASA1, RYK, NFRKB, GBE1, EFNB3 (normal) |
 |  |
| KIRC (tumor) | KIRC (normal) |
| EPHB3, FYN, NPM1, CRK, MLLT4, LNX1, RASA1, RYK, NFRKB, GBE1, EFNB3 (tumor) | EPHB3, FYN, NPM1, CRK, MLLT4, LNX1, RASA1, RYK, NFRKB, GBE1, EFNB3 (normal) |
 |  |
| KIRP (tumor) | KIRP (normal) |
| EPHB3, FYN, NPM1, CRK, MLLT4, LNX1, RASA1, RYK, NFRKB, GBE1, EFNB3 (tumor) | EPHB3, FYN, NPM1, CRK, MLLT4, LNX1, RASA1, RYK, NFRKB, GBE1, EFNB3 (normal) |
 |  |
| LIHC (tumor) | LIHC (normal) |
| EPHB3, FYN, NPM1, CRK, MLLT4, LNX1, RASA1, RYK, NFRKB, GBE1, EFNB3 (tumor) | EPHB3, FYN, NPM1, CRK, MLLT4, LNX1, RASA1, RYK, NFRKB, GBE1, EFNB3 (normal) |
 |  |
| LUAD (tumor) | LUAD (normal) |
| EPHB3, FYN, NPM1, CRK, MLLT4, LNX1, RASA1, RYK, NFRKB, GBE1, EFNB3 (tumor) | EPHB3, FYN, NPM1, CRK, MLLT4, LNX1, RASA1, RYK, NFRKB, GBE1, EFNB3 (normal) |
 |  |
| LUSC (tumor) | LUSC (normal) |
| EPHB3, FYN, NPM1, CRK, MLLT4, LNX1, RASA1, RYK, NFRKB, GBE1, EFNB3 (tumor) | EPHB3, FYN, NPM1, CRK, MLLT4, LNX1, RASA1, RYK, NFRKB, GBE1, EFNB3 (normal) |
 |  |
| PRAD (tumor) | PRAD (normal) |
| EPHB3, FYN, NPM1, CRK, MLLT4, LNX1, RASA1, RYK, NFRKB, GBE1, EFNB3 (tumor) | EPHB3, FYN, NPM1, CRK, MLLT4, LNX1, RASA1, RYK, NFRKB, GBE1, EFNB3 (normal) |
 |  |
| STAD (tumor) | STAD (normal) |
| EPHB3, FYN, NPM1, CRK, MLLT4, LNX1, RASA1, RYK, NFRKB, GBE1, EFNB3 (tumor) | EPHB3, FYN, NPM1, CRK, MLLT4, LNX1, RASA1, RYK, NFRKB, GBE1, EFNB3 (normal) |
 |  |
| THCA (tumor) | THCA (normal) |
| EPHB3, FYN, NPM1, CRK, MLLT4, LNX1, RASA1, RYK, NFRKB, GBE1, EFNB3 (tumor) | EPHB3, FYN, NPM1, CRK, MLLT4, LNX1, RASA1, RYK, NFRKB, GBE1, EFNB3 (normal) |
 |  |
| Top |
| TissGeneProg for EPHB3 |
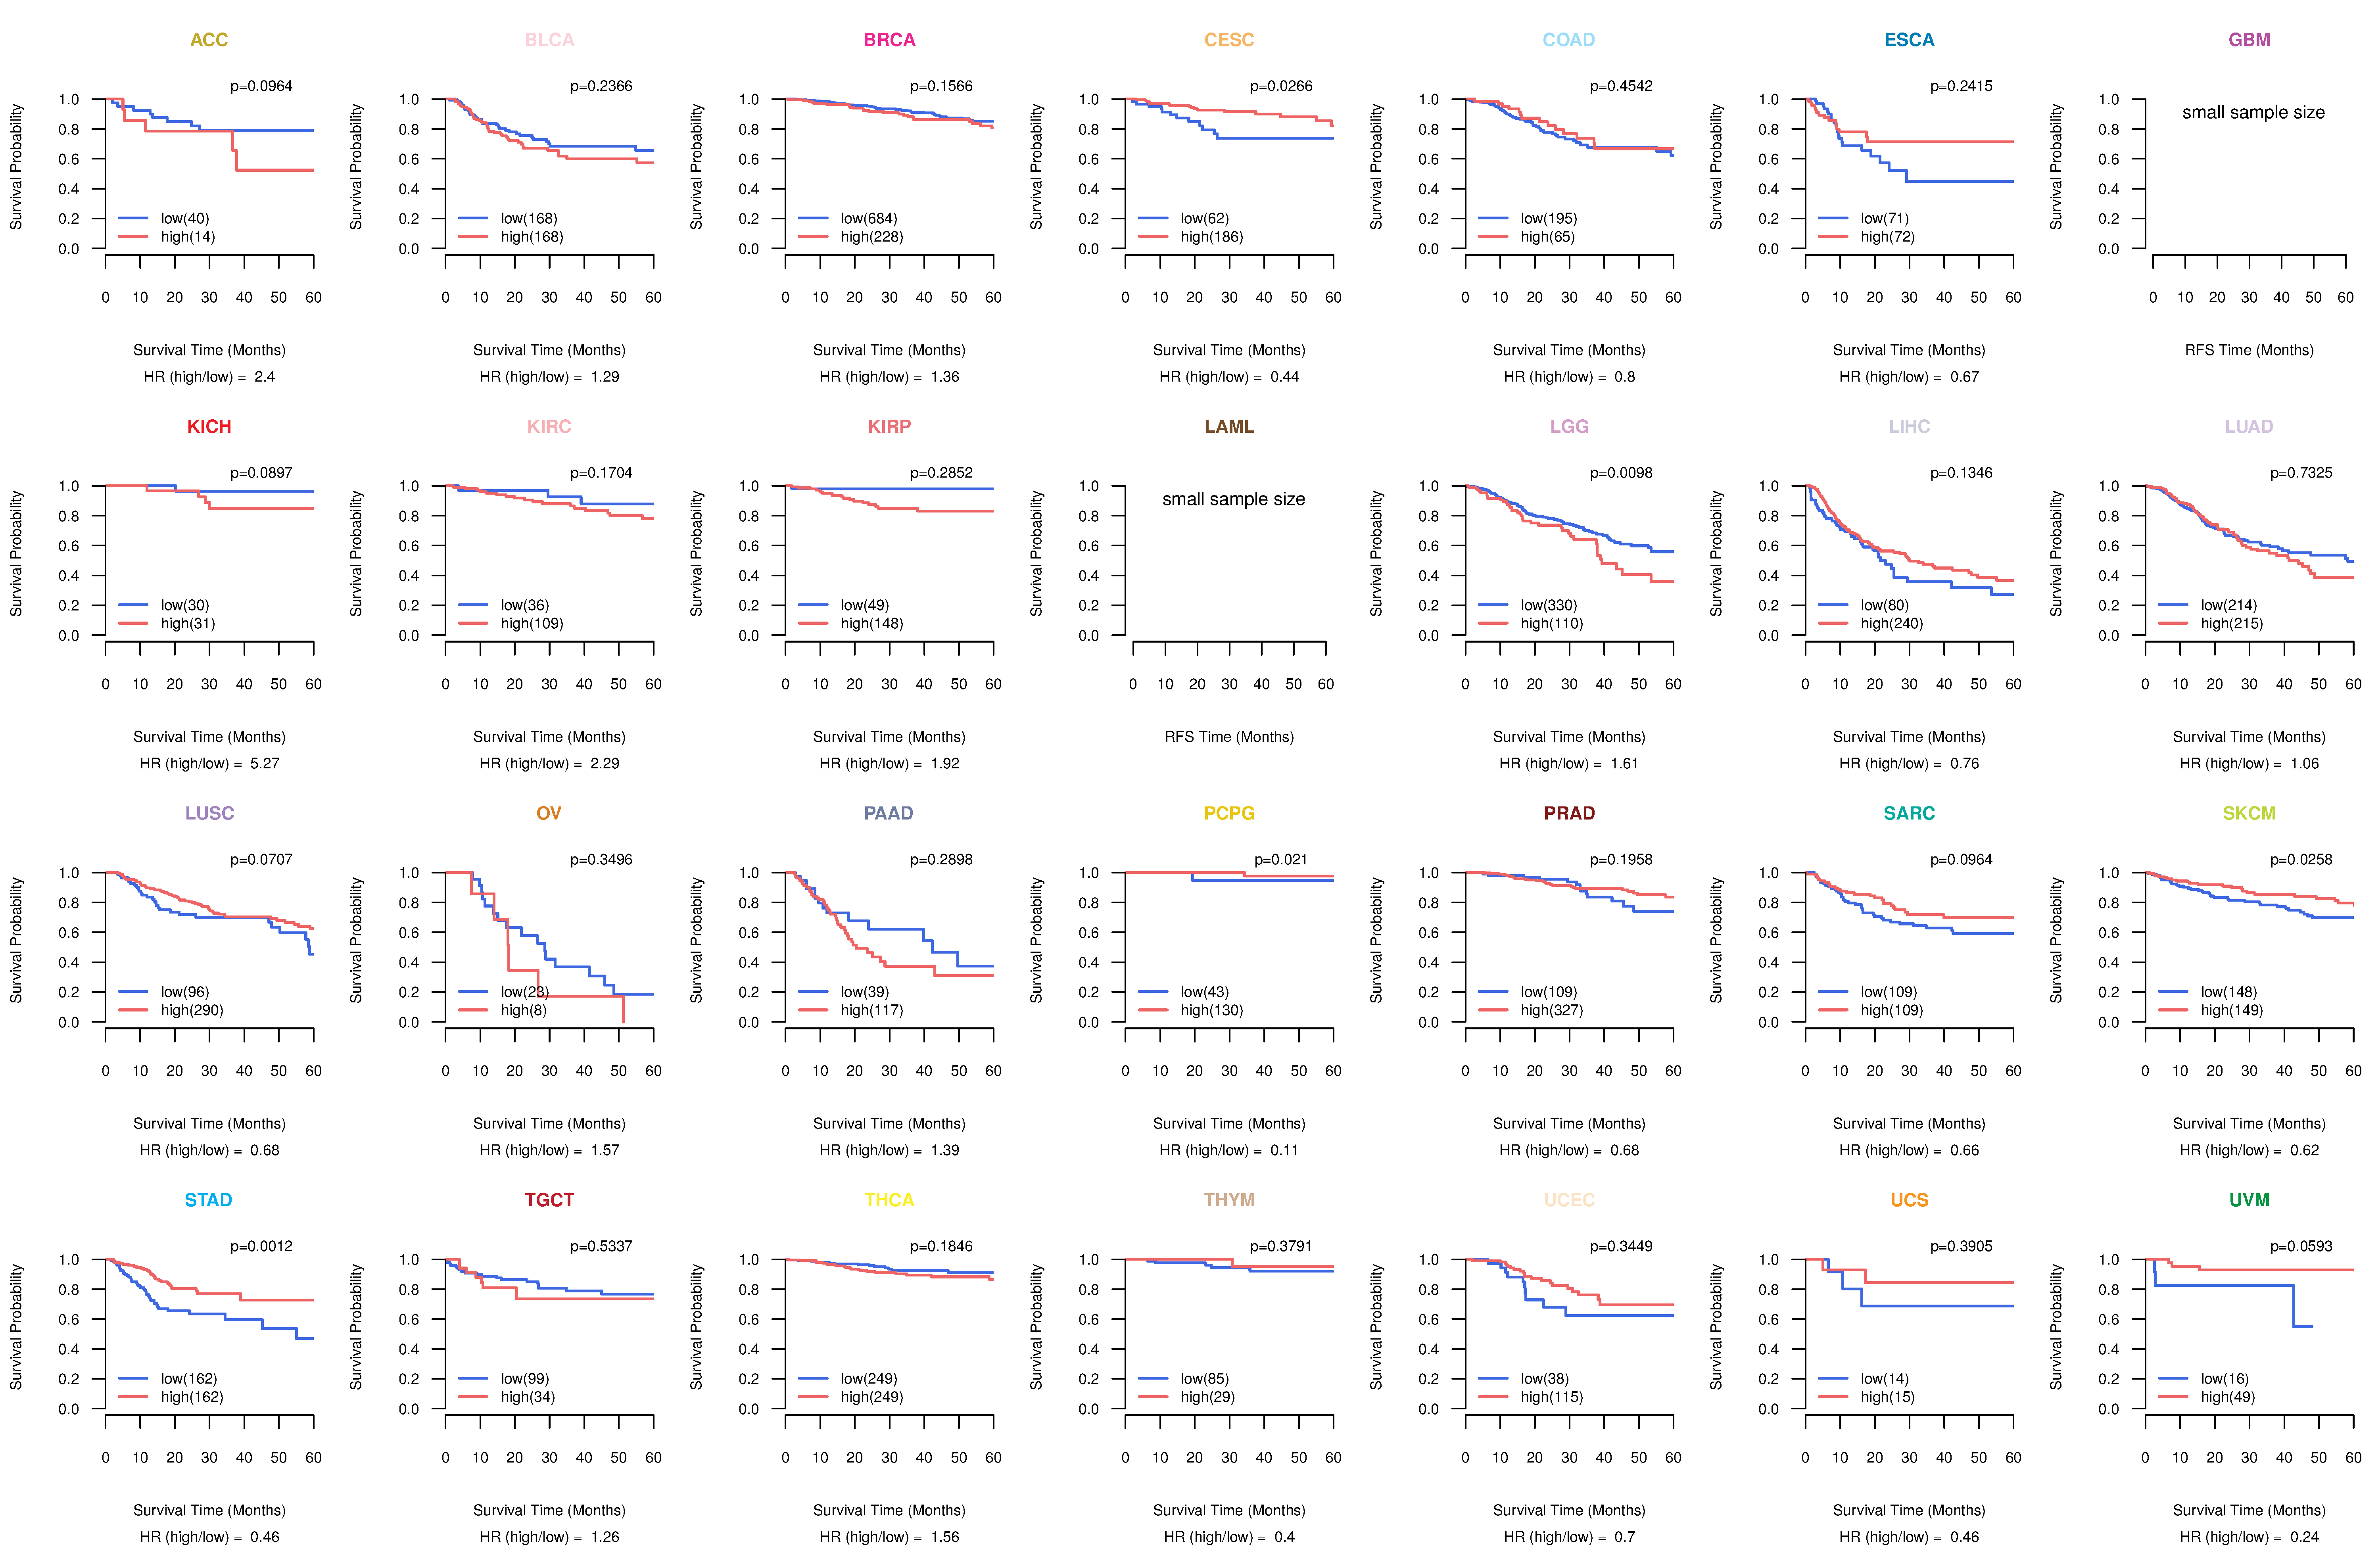
| Kaplan-Meier plots with logrank tests of overall survival (OS) using 28 cancer types (TCGA IlluminaHiSeq_RNASeqV2, pan-cancer normalized log2(norm_counts+1) data, version 2016-08-16) (TCGA clinicalMatrix, phenotype data, version 2016-04-27) * Click on the image to enlarge it in a new window. |
 |
| Kaplan-Meier plots with logrank test of relapse free survival (RFS) using 28 cancer types (TCGA IlluminaHiSeq_RNASeqV2, pan-cancer normalized log2(norm_counts+1) data, version 2016-08-16) (TCGA clinicalMatrix, phenotype data, version 2016-04-27) * Click on the image enlarge it in a new window. |
 |
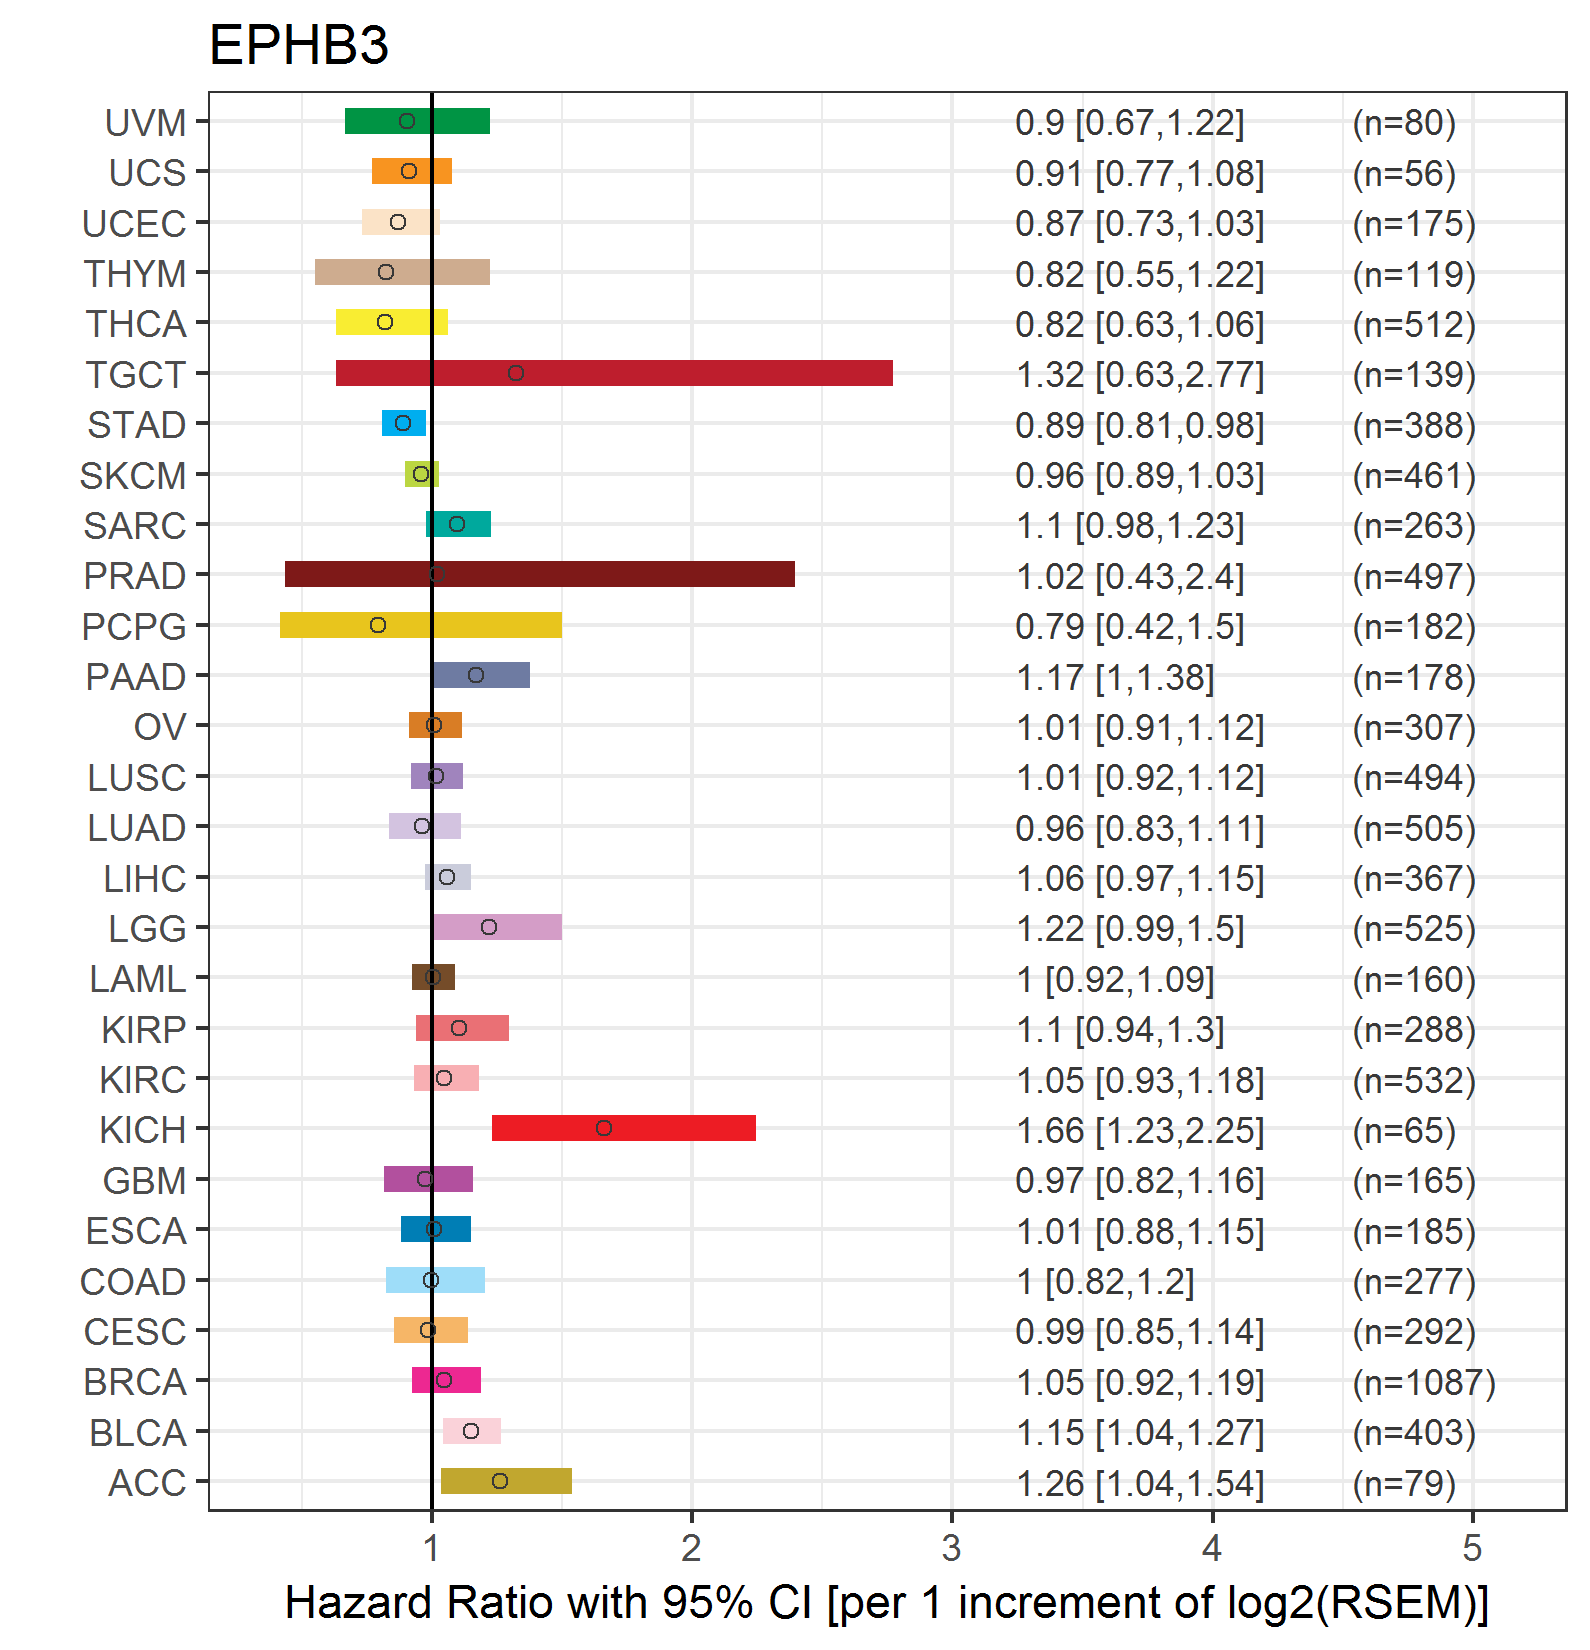
| Forest plot of Cox proportional hazard ratio (HR) and 95% CI of overall survival (OS) using 28 cancer types (TCGA IlluminaHiSeq_RNASeqV2, pan-cancer normalized log2(norm_counts+1) data, version 2016-08-16) (TCGA clinicalMatrix, phenotype data, version 2016-04-27) * Click on the image enlarge it in a new window. |
 |
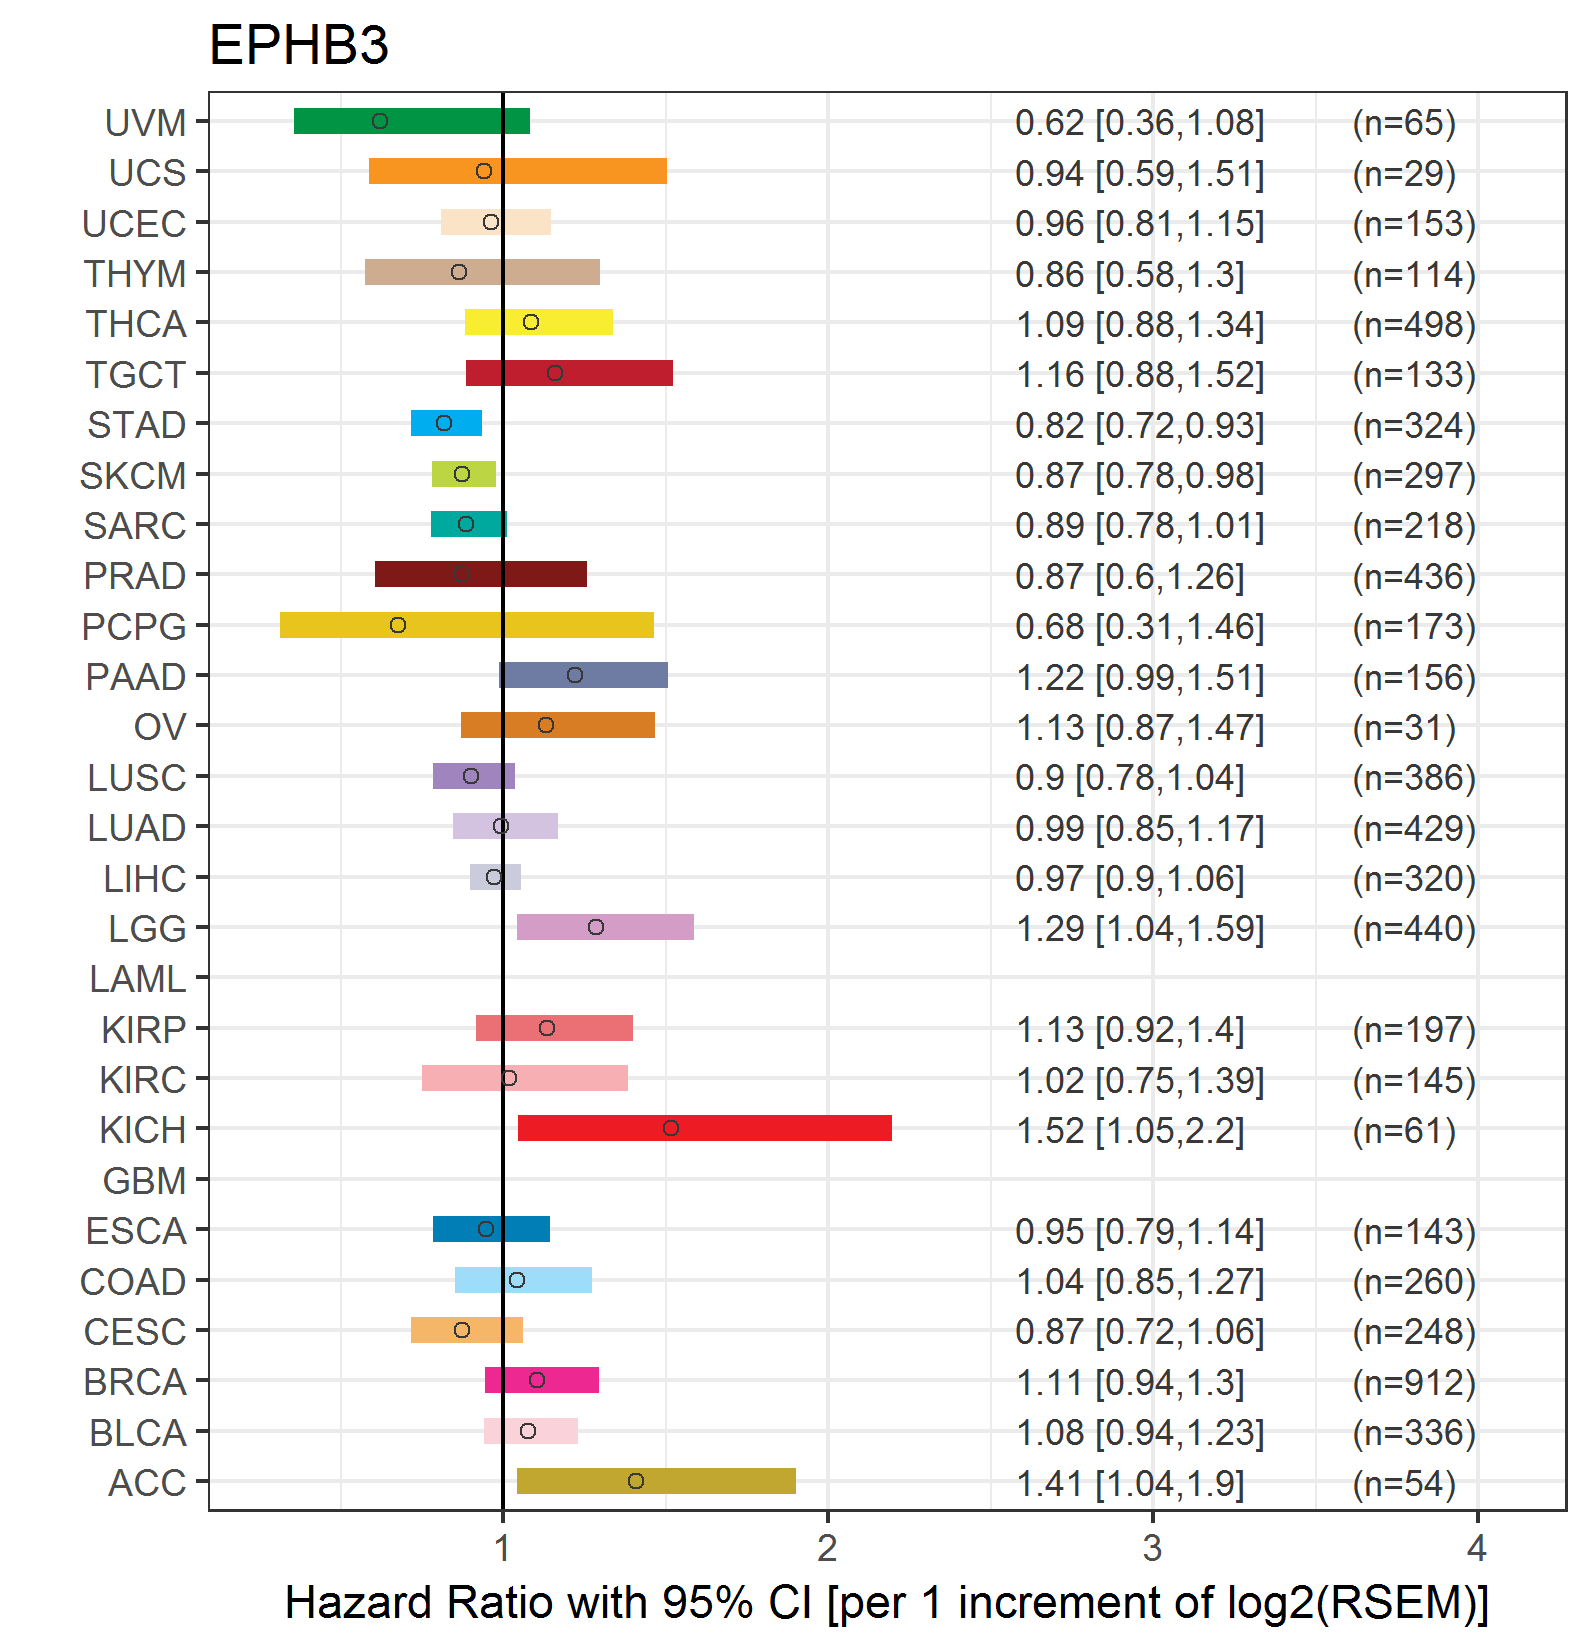
| Forest plot of Cox proportional hazard ratio (HR) and 95% CI of relapse free survival (RFS) using 28 cancer types (TCGA IlluminaHiSeq_RNASeqV2, pan-cancer normalized log2(norm_counts+1) data, version 2016-08-16) (TCGA clinicalMatrix, phenotype data, version 2016-04-27) * Click on the image enlarge it in a new window. |
 |
| Top |
| TissGeneClin for EPHB3 |
| TissGeneDrug for EPHB3 |
| Drug information targeting TissGene (DrugBank Version 5.0.6, 2017-04-01) |
| DrugBank ID | Drug name | Drug activity | Drug type | Drug status |
| Top |
| TissGeneDisease for EPHB3 |
| Disease information associated with TissGene (DisGeNet, 2016-06-01) |
| Disease ID | Disease name | # pubmeds | Source |
| umls:C0009402 | Colorectal Carcinoma | 5 | BeFree |
| umls:C1527249 | Colorectal Cancer | 5 | BeFree |
| umls:C0001430 | Adenoma | 3 | BeFree |
| umls:C0007131 | Non-Small Cell Lung Carcinoma | 1 | BeFree |
| umls:C0007137 | Squamous cell carcinoma | 1 | BeFree |
| umls:C0027627 | Neoplasm Metastasis | 1 | BeFree |
| umls:C0032580 | Adenomatous Polyposis Coli | 1 | BeFree |
| umls:C0079218 | Fibromatosis, Aggressive | 1 | BeFree |
| umls:C0149782 | Squamous cell carcinoma of lung | 1 | BeFree |
| umls:C0410005 | Nodular fasciitis | 1 | BeFree |
| umls:C0518014 | Hematocrit level | 1 | GAD |
|
Copyright 2016-Present - The University of Texas Health Science Center at Houston (UTHealth) Web File Viewing | How to Report, Fraud, Waste and Abuse | State of Texas | Statewide Search | Texas Homeland Security | Site Policies |