 |
| |
| |
| |
| |
| |
| |
|

| TissGeneSummary for FLRT3 |
 Gene summary Gene summary |
| Basic gene information | Gene symbol | FLRT3 |
| Gene name | fibronectin leucine rich transmembrane protein 3 | |
| Synonyms | HH21 | |
| Cytomap | UCSC genome browser: 20p11 | |
| Type of gene | protein-coding | |
| RefGenes | NM_013281.3, NM_198391.2, | |
| Description | fibronectin-like domain-containing leucine-rich transmembrane protein 3leucine-rich repeat transmembrane protein FLRT3 | |
| Modification date | 20141207 | |
| dbXrefs | MIM : 604808 | |
| HGNC : HGNC | ||
| Ensembl : ENSG00000125848 | ||
| HPRD : 05313 | ||
| Vega : OTTHUMG00000031914 | ||
| Protein | UniProt: go to UniProt's Cross Reference DB Table | |
| Expression | CleanEX: HS_FLRT3 | |
| BioGPS: 23767 | ||
| Pathway | NCI Pathway Interaction Database: FLRT3 | |
| KEGG: FLRT3 | ||
| REACTOME: FLRT3 | ||
| Pathway Commons: FLRT3 | ||
| Context | iHOP: FLRT3 | |
| ligand binding site mutation search in PubMed: FLRT3 | ||
| UCL Cancer Institute: FLRT3 | ||
| Assigned class in TissGDB* | C | |
| Included tissue-specific gene expression resources | TiGER,GTEx | |
| Specific-tissues in normal samples (assigned by TissGDB using HPA, TiGER, and GTEx) | KidneyLung | |
| Cancer types related to the specific-tissues in cancer samples (assigned by TissGDB using TCGA) | KIRC,KIRP,KICHLUAD,LUSC | |
| Reference showing the relevant tissue of FLRT3 | ||
| Description by TissGene annotations | Risk TissGene in OS Have significant anti-correlated miRNA | |
| * Class A consists of genes with literature evidence and is part of the cTissGenes. Class B consists of only cTissGenes without additional evidence. The remaining genes belong to Class C. |
| Gene ontology having evidence of Inferred from Direct Assay (IDA) from Entrez |
| GO ID | GO term | PubMed ID |
| Top |
| TissGeneExp for FLRT3 |
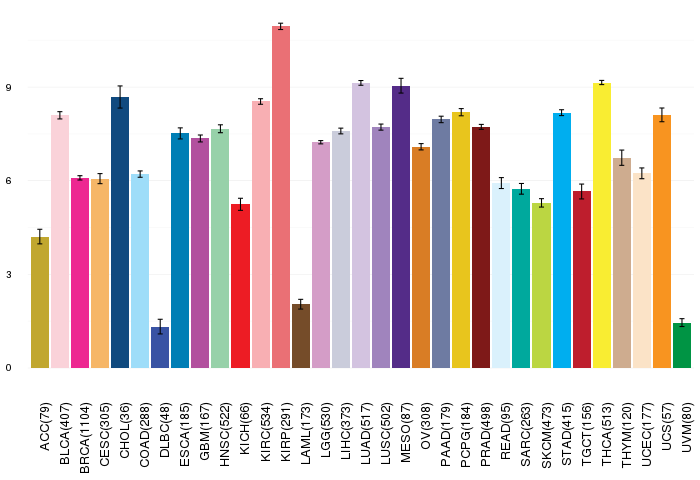
| Gene expressions across 28 cancer types (X-axis: cancer type and Y-axis: log2(norm_counts+1)) (TCGA IlluminaHiSeq_RNASeqV2, pan-cancer normalized log2(norm_counts+1) data, version 2016-08-16) |
 |
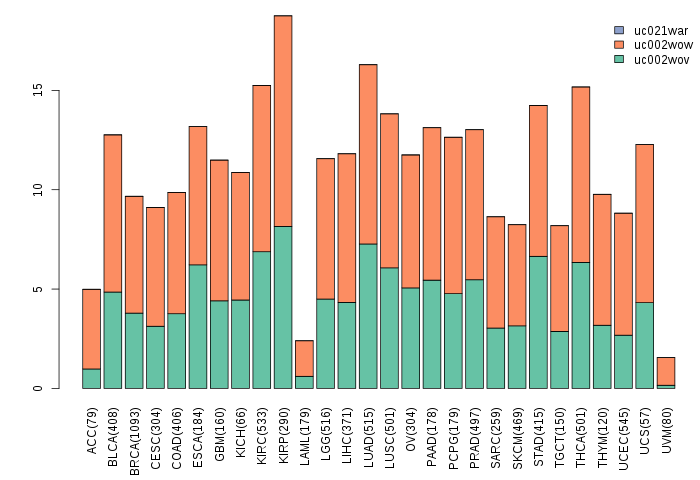
| Gene isoform expressions across 28 cancer types (X-axis: cancer type and Y-axis: log2(norm_counts+1)) (TCGA pan-cancer tcga_rsem_isoform_tpm, version 2016-09-01) |
 |
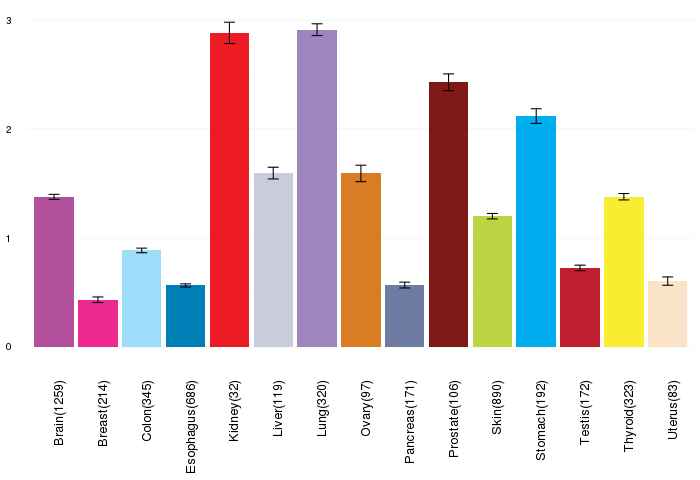
| Gene expressions across normal tissues of GTEx data (GTEx GTEx_Analysis_v6_RNA-seq_RNA-SeQCv1.1.8_gene_rpkm.gct) - Here, we shows the matched tissue types only among our 28 cancer types. |
 |
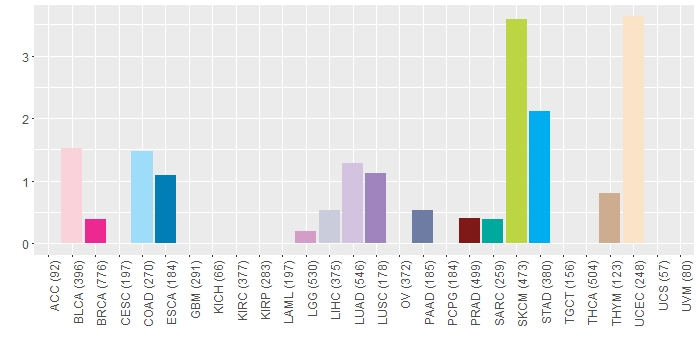
| Different expressions across 14 cancer types with more than 10 samples between matched tumors and normals (X-axis: cancer type and Y-axis: log2(norm_counts+1)) (TCGA IlluminaHiSeq_RNASeqV2, pan-cancer normalized log2(norm_counts+1) data, version 2016-08-16) |
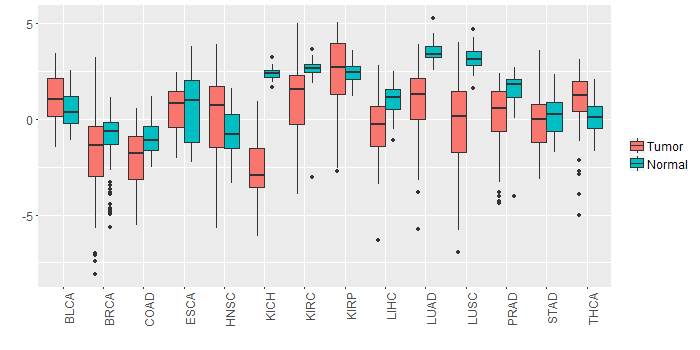 |
| - Significantly differentially expressed cancer types and information. (|Fold change|>1 and FDR<0.05) |
| Cancer type | Mean(exp) in tumor | Mean(exp) in matched normal | Log2FC | P-val. | FDR |
| PRAD | 0.136394089 | 1.505699858 | -1.369305769 | 6.71E-06 | 3.94E-05 |
| KIRC | 1.026560008 | 2.577097508 | -1.5505375 | 1.30E-08 | 3.89E-08 |
| LUAD | 0.927301052 | 3.470782086 | -2.543481034 | 3.04E-14 | 2.85E-13 |
| KICH | -2.822018603 | 2.372721397 | -5.19474 | 1.33E-14 | 2.36E-13 |
| LIHC | -0.370668603 | 1.093281397 | -1.46395 | 4.44E-06 | 2.05E-05 |
| LUSC | -0.239101348 | 3.205477083 | -3.444578431 | 2.64E-14 | 1.47E-13 |
| Top |
| TissGene-miRNA for FLRT3 |
| Significantly anti-correlated miRNAs of TissGene across 28 cancer types (Gene-miRNA relations from TargetScanHuman Relsease 7.1, Conserved_Site_Context_Scores.txt.zip, 06.01.2016) (TCGA IlluminaHiSeq_miRNASeq, log2(RPM+1) data, version 2016-11-21) (TCGA IlluminaHiSeq_RNASeqV2, log2(normalized_count+1) data, version 2016-08-16) (Spearman’s Rank Correlation (p-value<0.05 and coefficient<-0.25)) |
| Cancer type | miRNA id | miRNA accession | P-val. | Coeff. | # samples |
| UCS | hsa-miR-9-5p | MIMAT0000441 | 0.014 | -0.33 | 56 |
| Top |
| TissGeneMut for FLRT3 |
| TissGeneSNV for FLRT3 |
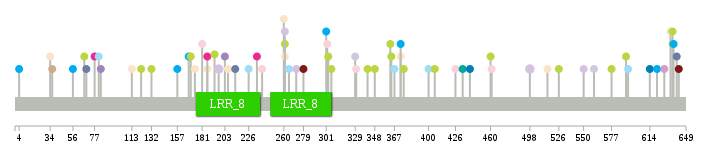
| nsSNV counts per each loci. Different colors of circles represent different cancer types. Circle size denotes number of samples. (TCGA somatic mutation (SNPs and small INDELs) data, version 2016-04-25) * Click on the image to enlarge it in a new window. |
 |
 |
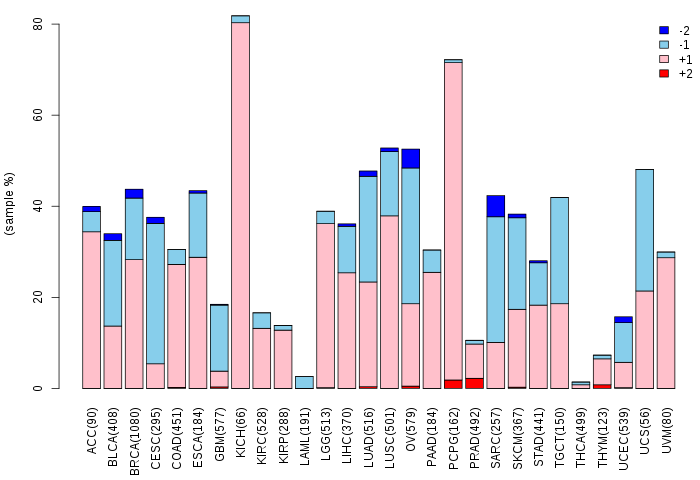
| Somatic nucleotide variants of TissGene across 28 cancer types (X-axis: cancer type and Y-axis: % of mutated samples) The numbers in parentheses are numbers of samples with mutation (nsSNVs). (TCGA somatic mutation (SNPs and small INDELs) data, version 2016-04-25) |
 |
| - nsSNVs sorted by frequency. |
| AAchange | Cancer type | # samples |
| p.G197C | LUAD | 2 |
| p.E498K | LUAD | 2 |
| p.V329M | LIHC | 1 |
| p.R186H | BRCA | 1 |
| p.I364T | SKCM | 1 |
| p.C334Y | HNSC | 1 |
| p.T373P | UCEC | 1 |
| p.R261W | UCEC | 1 |
| p.R637I | STAD | 1 |
| p.L302V | BLCA | 1 |
| p.R461H | BLCA | 1 |
| p.L348F | SKCM | 1 |
| p.P174S | UCEC | 1 |
| p.E591K | SKCM | 1 |
| p.N226H | COAD | 1 |
| p.R261L | LUAD | 1 |
| p.D122N | SKCM | 1 |
| p.R303C | SKCM | 1 |
| p.G640D | PAAD | 1 |
| p.L83Q | LUSC | 1 |
| p.M433V | SARC | 1 |
| p.E577K | SKCM | 1 |
| p.S560L | HNSC | 1 |
| p.R634Q | READ | 1 |
| p.R234W | BRCA | 1 |
| p.Y636* | SKCM | 1 |
| p.N265D | COAD | 1 |
| p.S279Y | PRAD | 1 |
| p.R203H | HNSC | 1 |
| p.L206I | UCEC | 1 |
| p.T373I | STAD | 1 |
| p.R303S | CHOL | 1 |
| p.A4T | STAD | 1 |
| p.S593Y | COAD | 1 |
| p.S77* | BRCA | 1 |
| p.Y636X | SKCM | 1 |
| p.A239T | BLCA | 1 |
| p.E132K | SKCM | 1 |
| p.C496S | HNSC | 1 |
| p.N621D | STAD | 1 |
| p.E460K | SKCM | 1 |
| p.V34A | UCEC | 1 |
| p.S560T | LIHC | 1 |
| p.E113* | UCEC | 1 |
| p.H400Q | COAD | 1 |
| p.R157Q | STAD | 1 |
| p.I614M | ESCA | 1 |
| p.I301L | STAD | 1 |
| p.R36H | THYM | 1 |
| p.R515Q | UCEC | 1 |
| p.N67S | SKCM | 1 |
| p.Q69R | PAAD | 1 |
| p.I56T | STAD | 1 |
| p.T168A | STAD | 1 |
| p.R181C | BLCA | 1 |
| p.R261W | SKCM | 1 |
| p.D218E | READ | 1 |
| p.P376S | SKCM | 1 |
| p.S593C | HNSC | 1 |
| p.T367N | COAD | 1 |
| p.R330H | BLCA | 1 |
| p.P642Q | PRAD | 1 |
| p.W440L | ESCA | 1 |
| p.W550C | LUAD | 1 |
| p.N526K | SKCM | 1 |
| p.N260D | UCEC | 1 |
| p.R341C | SKCM | 1 |
| p.R203H | LUSC | 1 |
| p.N213T | PAAD | 1 |
| p.R634* | UCEC | 1 |
| p.S426C | BLCA | 1 |
| p.P193L | SKCM | 1 |
| p.S628G | LGG | 1 |
| p.P306L | SKCM | 1 |
| p.R186H | UCEC | 1 |
| p.P406L | SKCM | 1 |
| p.T363I | SKCM | 1 |
| p.E463Q | HNSC | 1 |
| p.N81T | COAD | 1 |
| p.P170S | SKCM | 1 |
| p.Q272R | LUAD | 1 |
| Top |
| TissGeneCNV for FLRT3 |
| Copy number variations of TissGene across 28 cancer types (X-axis: cancer type and Y-axis: % of CNV samples) (TCGA Gistic2_CopyNumber_Gistic2_all_data_by_genes, Gistic2 copy number data, version 2016-08-16) |
 |
| Top |
| TissGeneFusions for FLRT3 |
| Fusion genes including TissGene (ChimerDB 3.0, 2016-12-01 and TCGA fusion Portal 2015-12-01) |
| Database | Src | Cancer type | Sample | Fusion gene | ORF | 5'-gene BP | 3'-gene BP |
| Top |
| TissGeneNet for FLRT3 |
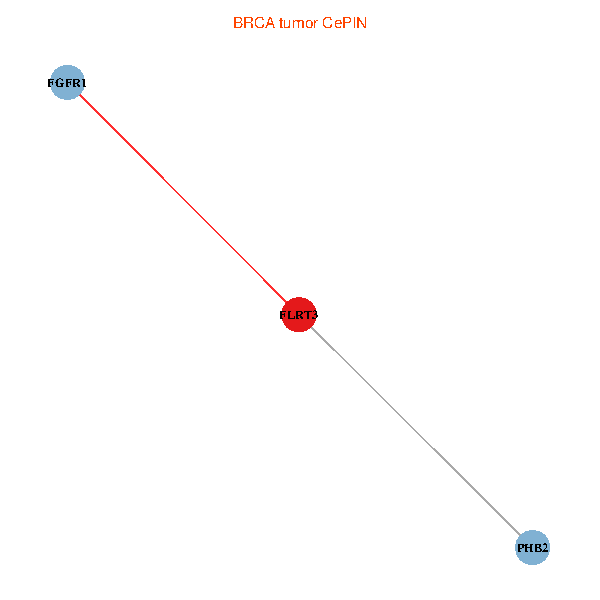
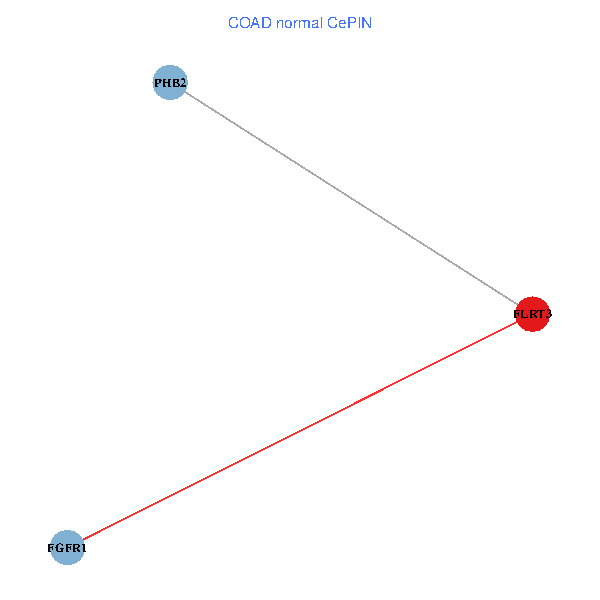
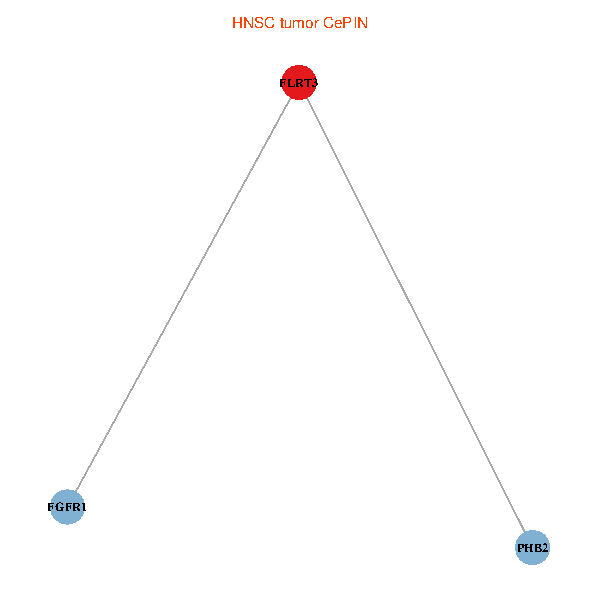
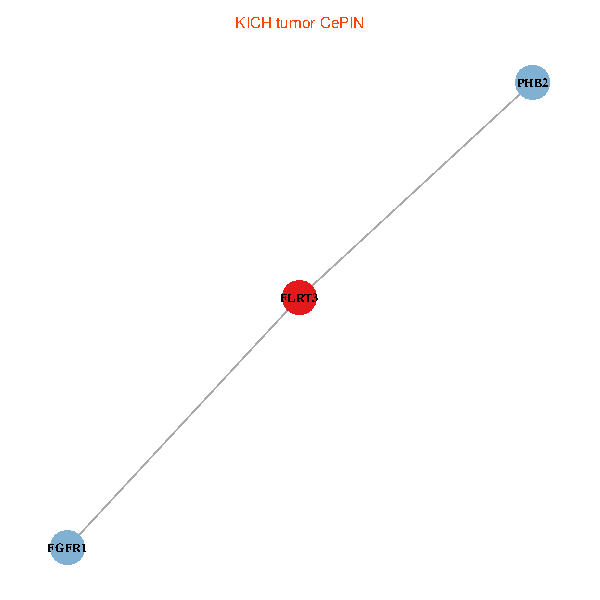
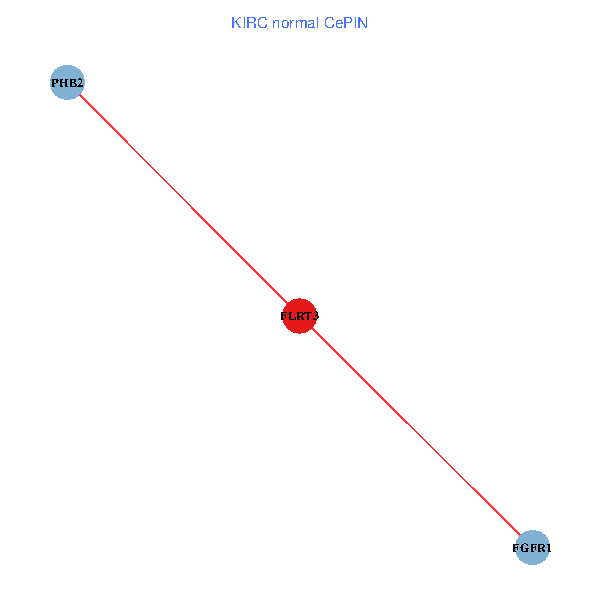
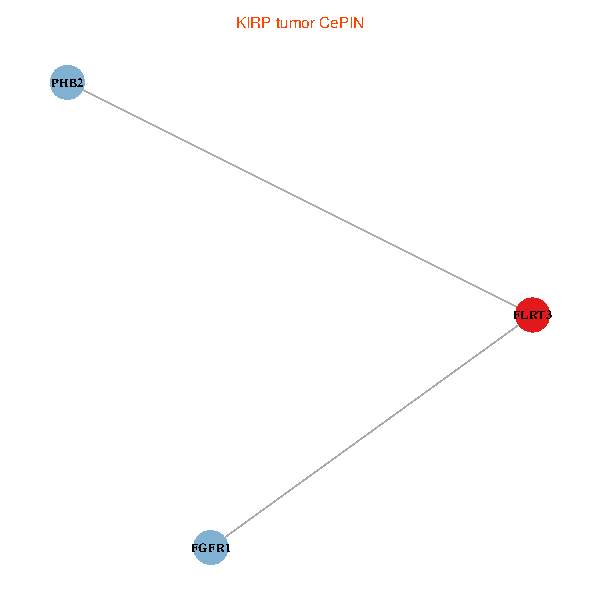
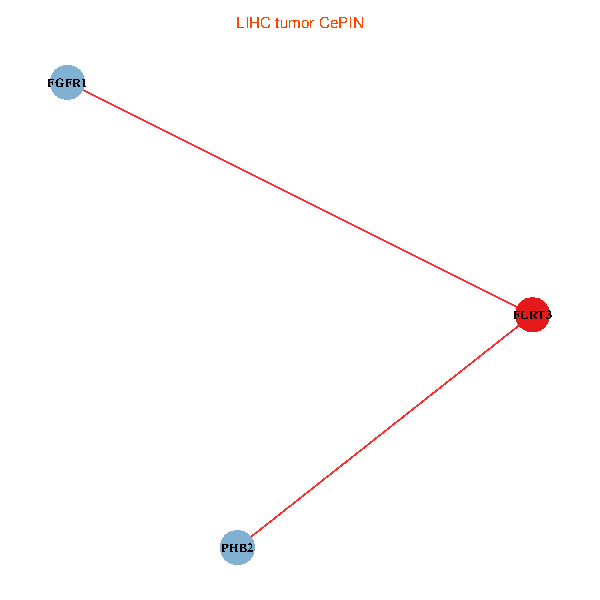
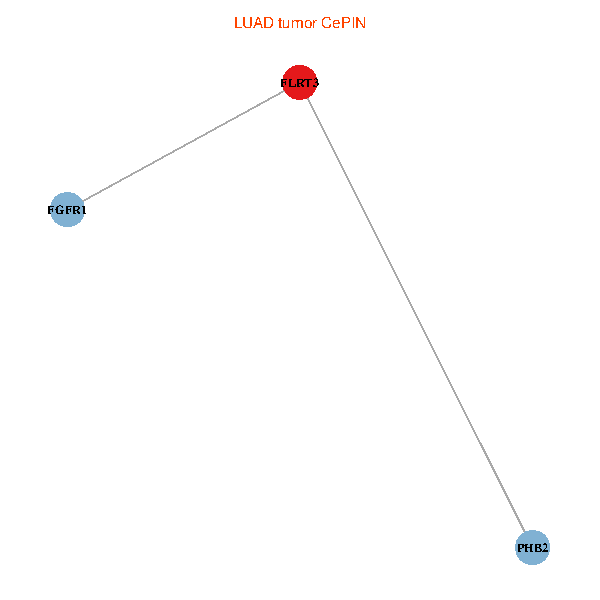
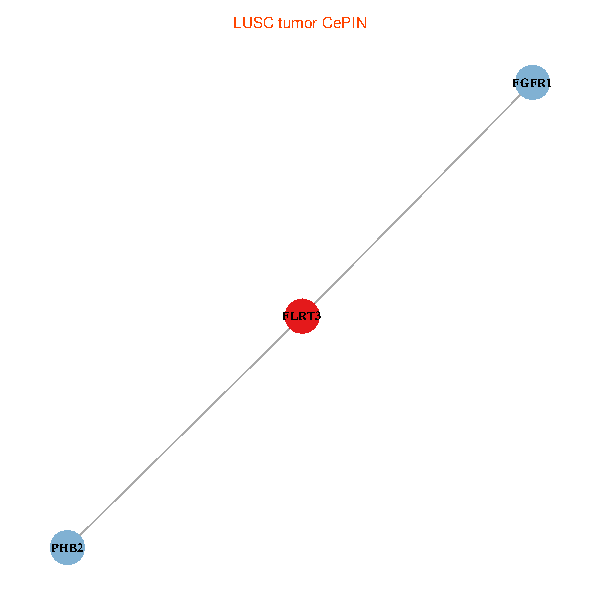
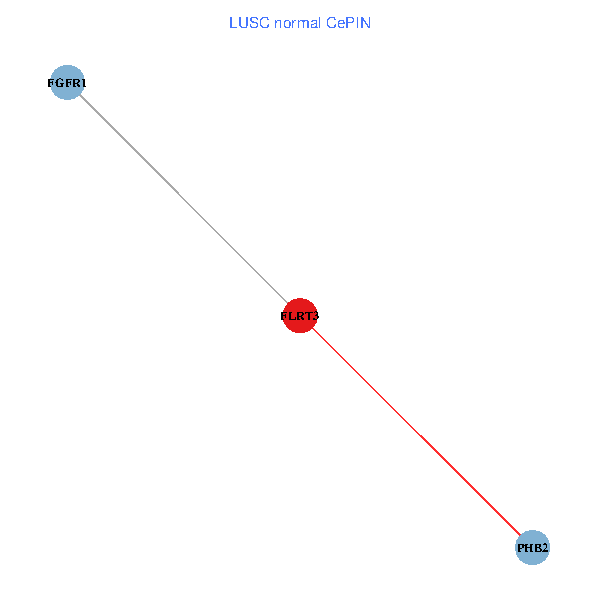
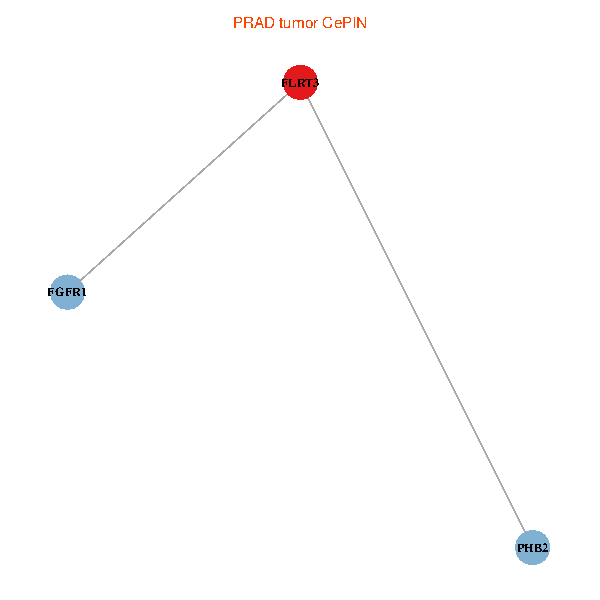
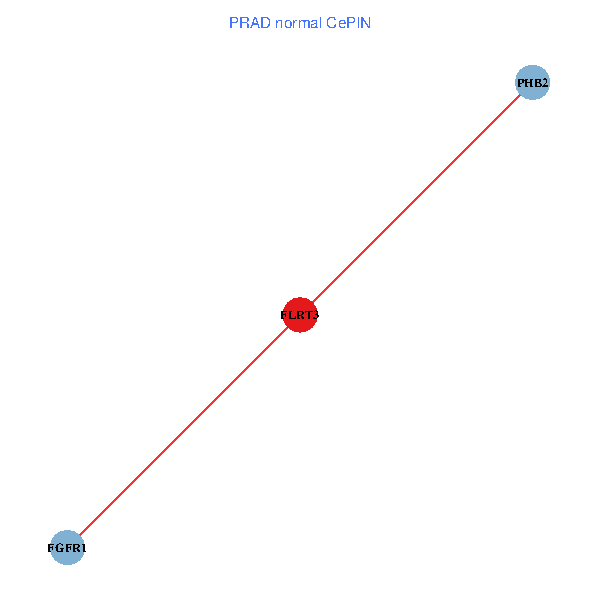
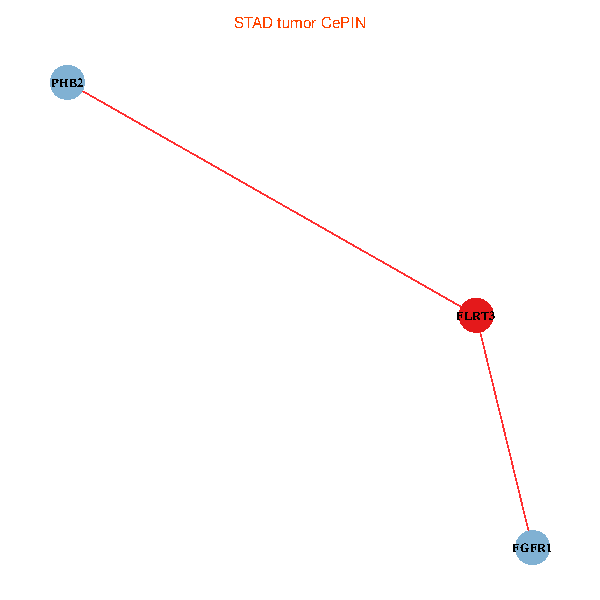
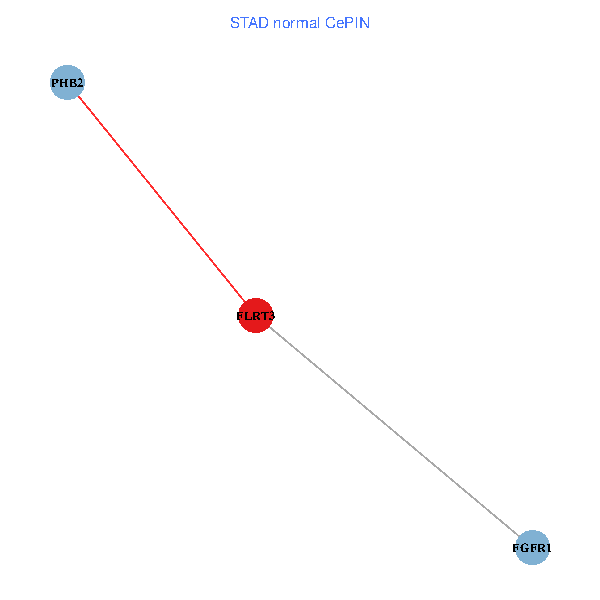
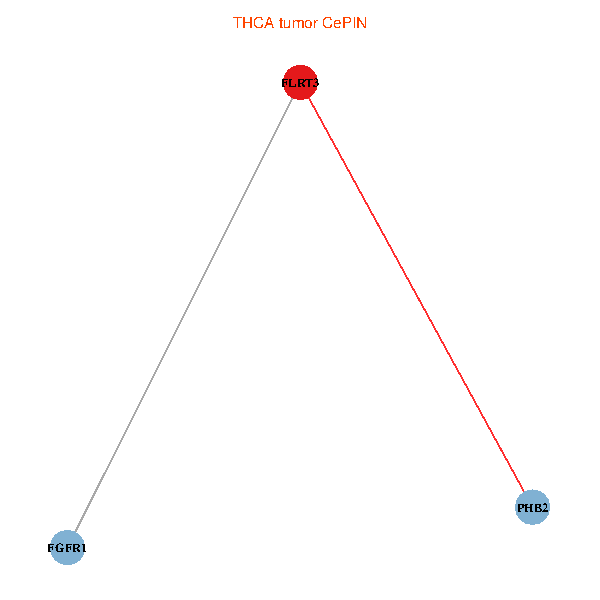
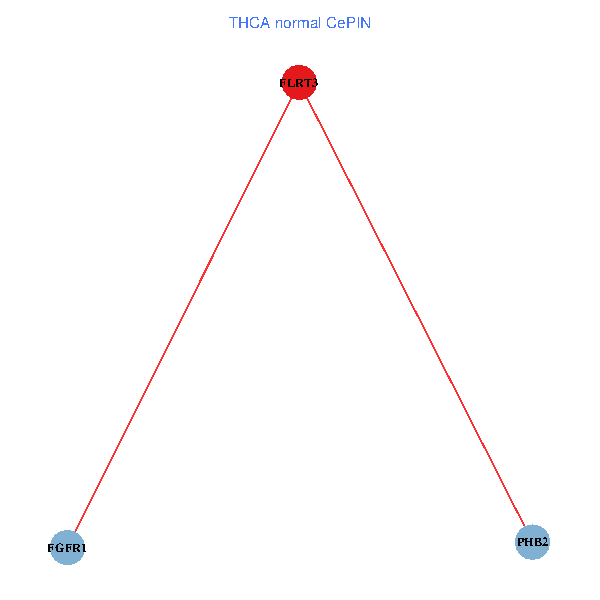
| Co-expressed gene networks based on protein-protein interaction data (CePIN) (TCGA IlluminaHiSeq_RNASeqV2, pan-cancer normalized log2(norm_counts+1) data, version 2016-08-16) (PINA2 ppi data) |
| BRCA (tumor) | BRCA (normal) |
| FLRT3, PHB2, FGFR1 (tumor) | FLRT3, PHB2, FGFR1 (normal) |
 |  |
| COAD (tumor) | COAD (normal) |
| FLRT3, PHB2, FGFR1 (tumor) | FLRT3, PHB2, FGFR1 (normal) |
 |  |
| HNSC (tumor) | HNSC (normal) |
| FLRT3, PHB2, FGFR1 (tumor) | FLRT3, PHB2, FGFR1 (normal) |
 |  |
| KICH (tumor) | KICH (normal) |
| FLRT3, PHB2, FGFR1 (tumor) | FLRT3, PHB2, FGFR1 (normal) |
 |  |
| KIRC (tumor) | KIRC (normal) |
| FLRT3, PHB2, FGFR1 (tumor) | FLRT3, PHB2, FGFR1 (normal) |
 |  |
| KIRP (tumor) | KIRP (normal) |
| FLRT3, PHB2, FGFR1 (tumor) | FLRT3, PHB2, FGFR1 (normal) |
 |  |
| LIHC (tumor) | LIHC (normal) |
| FLRT3, PHB2, FGFR1 (tumor) | FLRT3, PHB2, FGFR1 (normal) |
 |  |
| LUAD (tumor) | LUAD (normal) |
| FLRT3, PHB2, FGFR1 (tumor) | FLRT3, PHB2, FGFR1 (normal) |
 |  |
| LUSC (tumor) | LUSC (normal) |
| FLRT3, PHB2, FGFR1 (tumor) | FLRT3, PHB2, FGFR1 (normal) |
 |  |
| PRAD (tumor) | PRAD (normal) |
| FLRT3, PHB2, FGFR1 (tumor) | FLRT3, PHB2, FGFR1 (normal) |
 |  |
| STAD (tumor) | STAD (normal) |
| FLRT3, PHB2, FGFR1 (tumor) | FLRT3, PHB2, FGFR1 (normal) |
 |  |
| THCA (tumor) | THCA (normal) |
| FLRT3, PHB2, FGFR1 (tumor) | FLRT3, PHB2, FGFR1 (normal) |
 |  |
| Top |
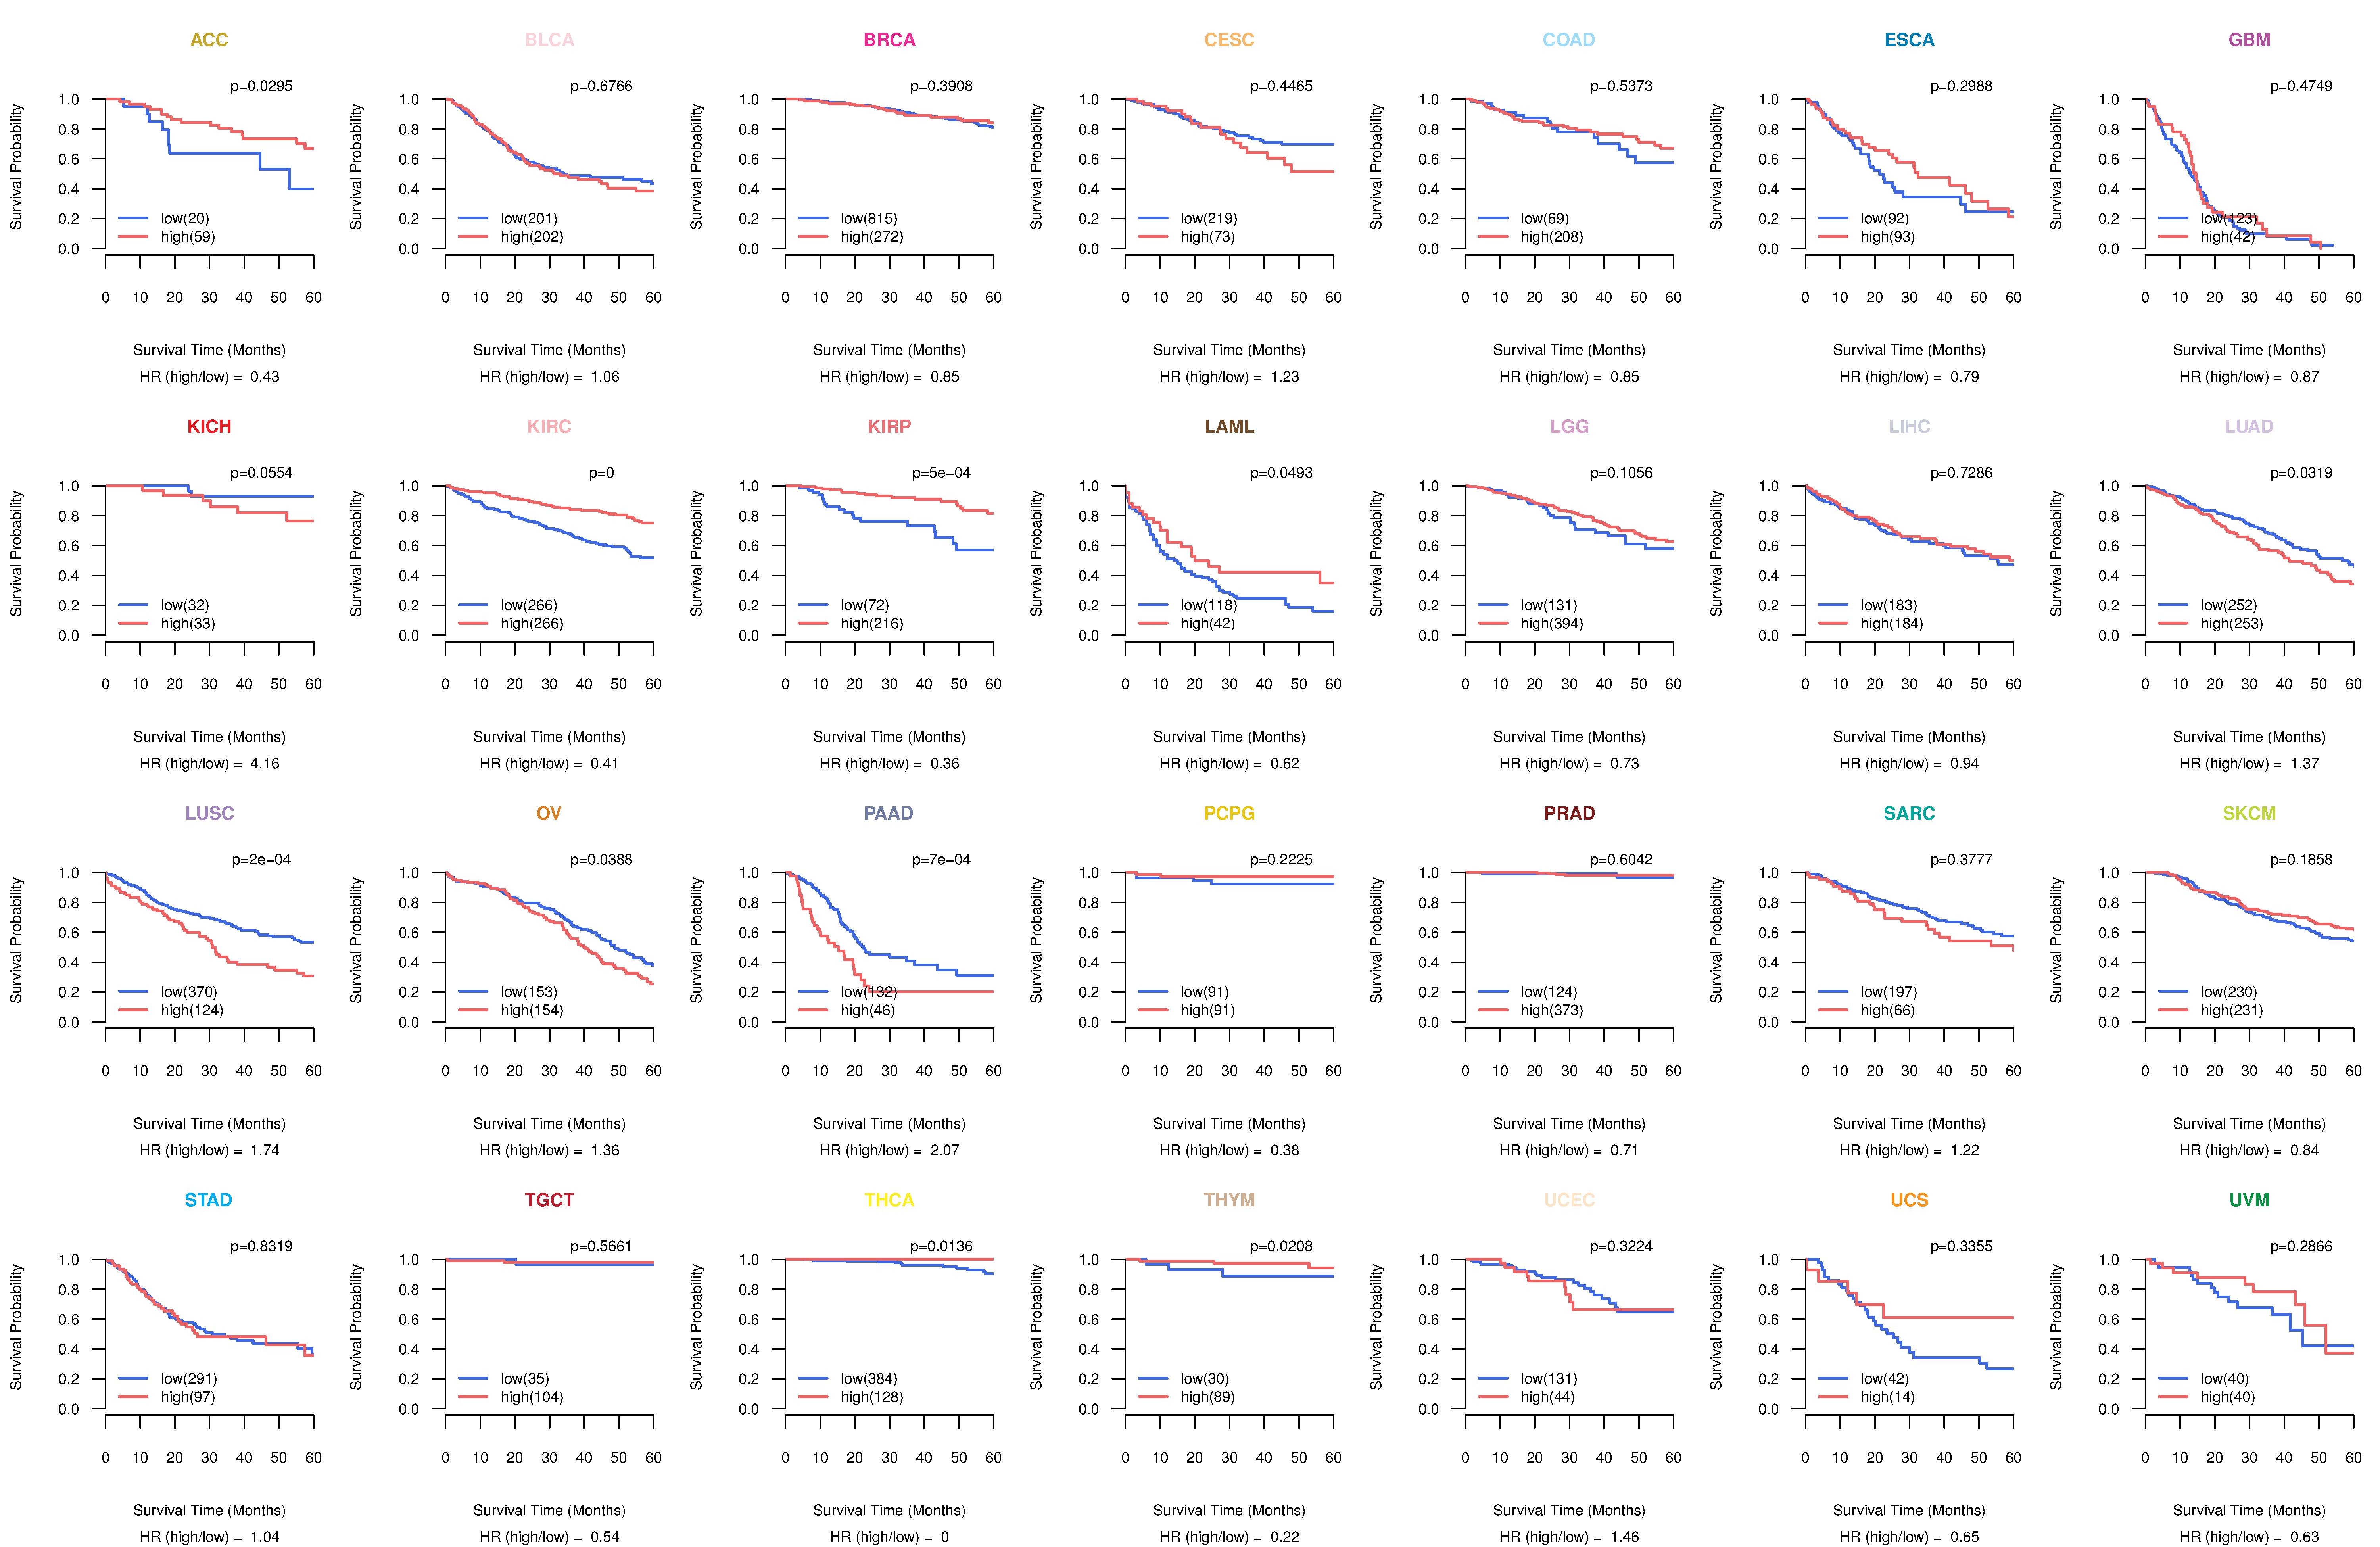
| TissGeneProg for FLRT3 |
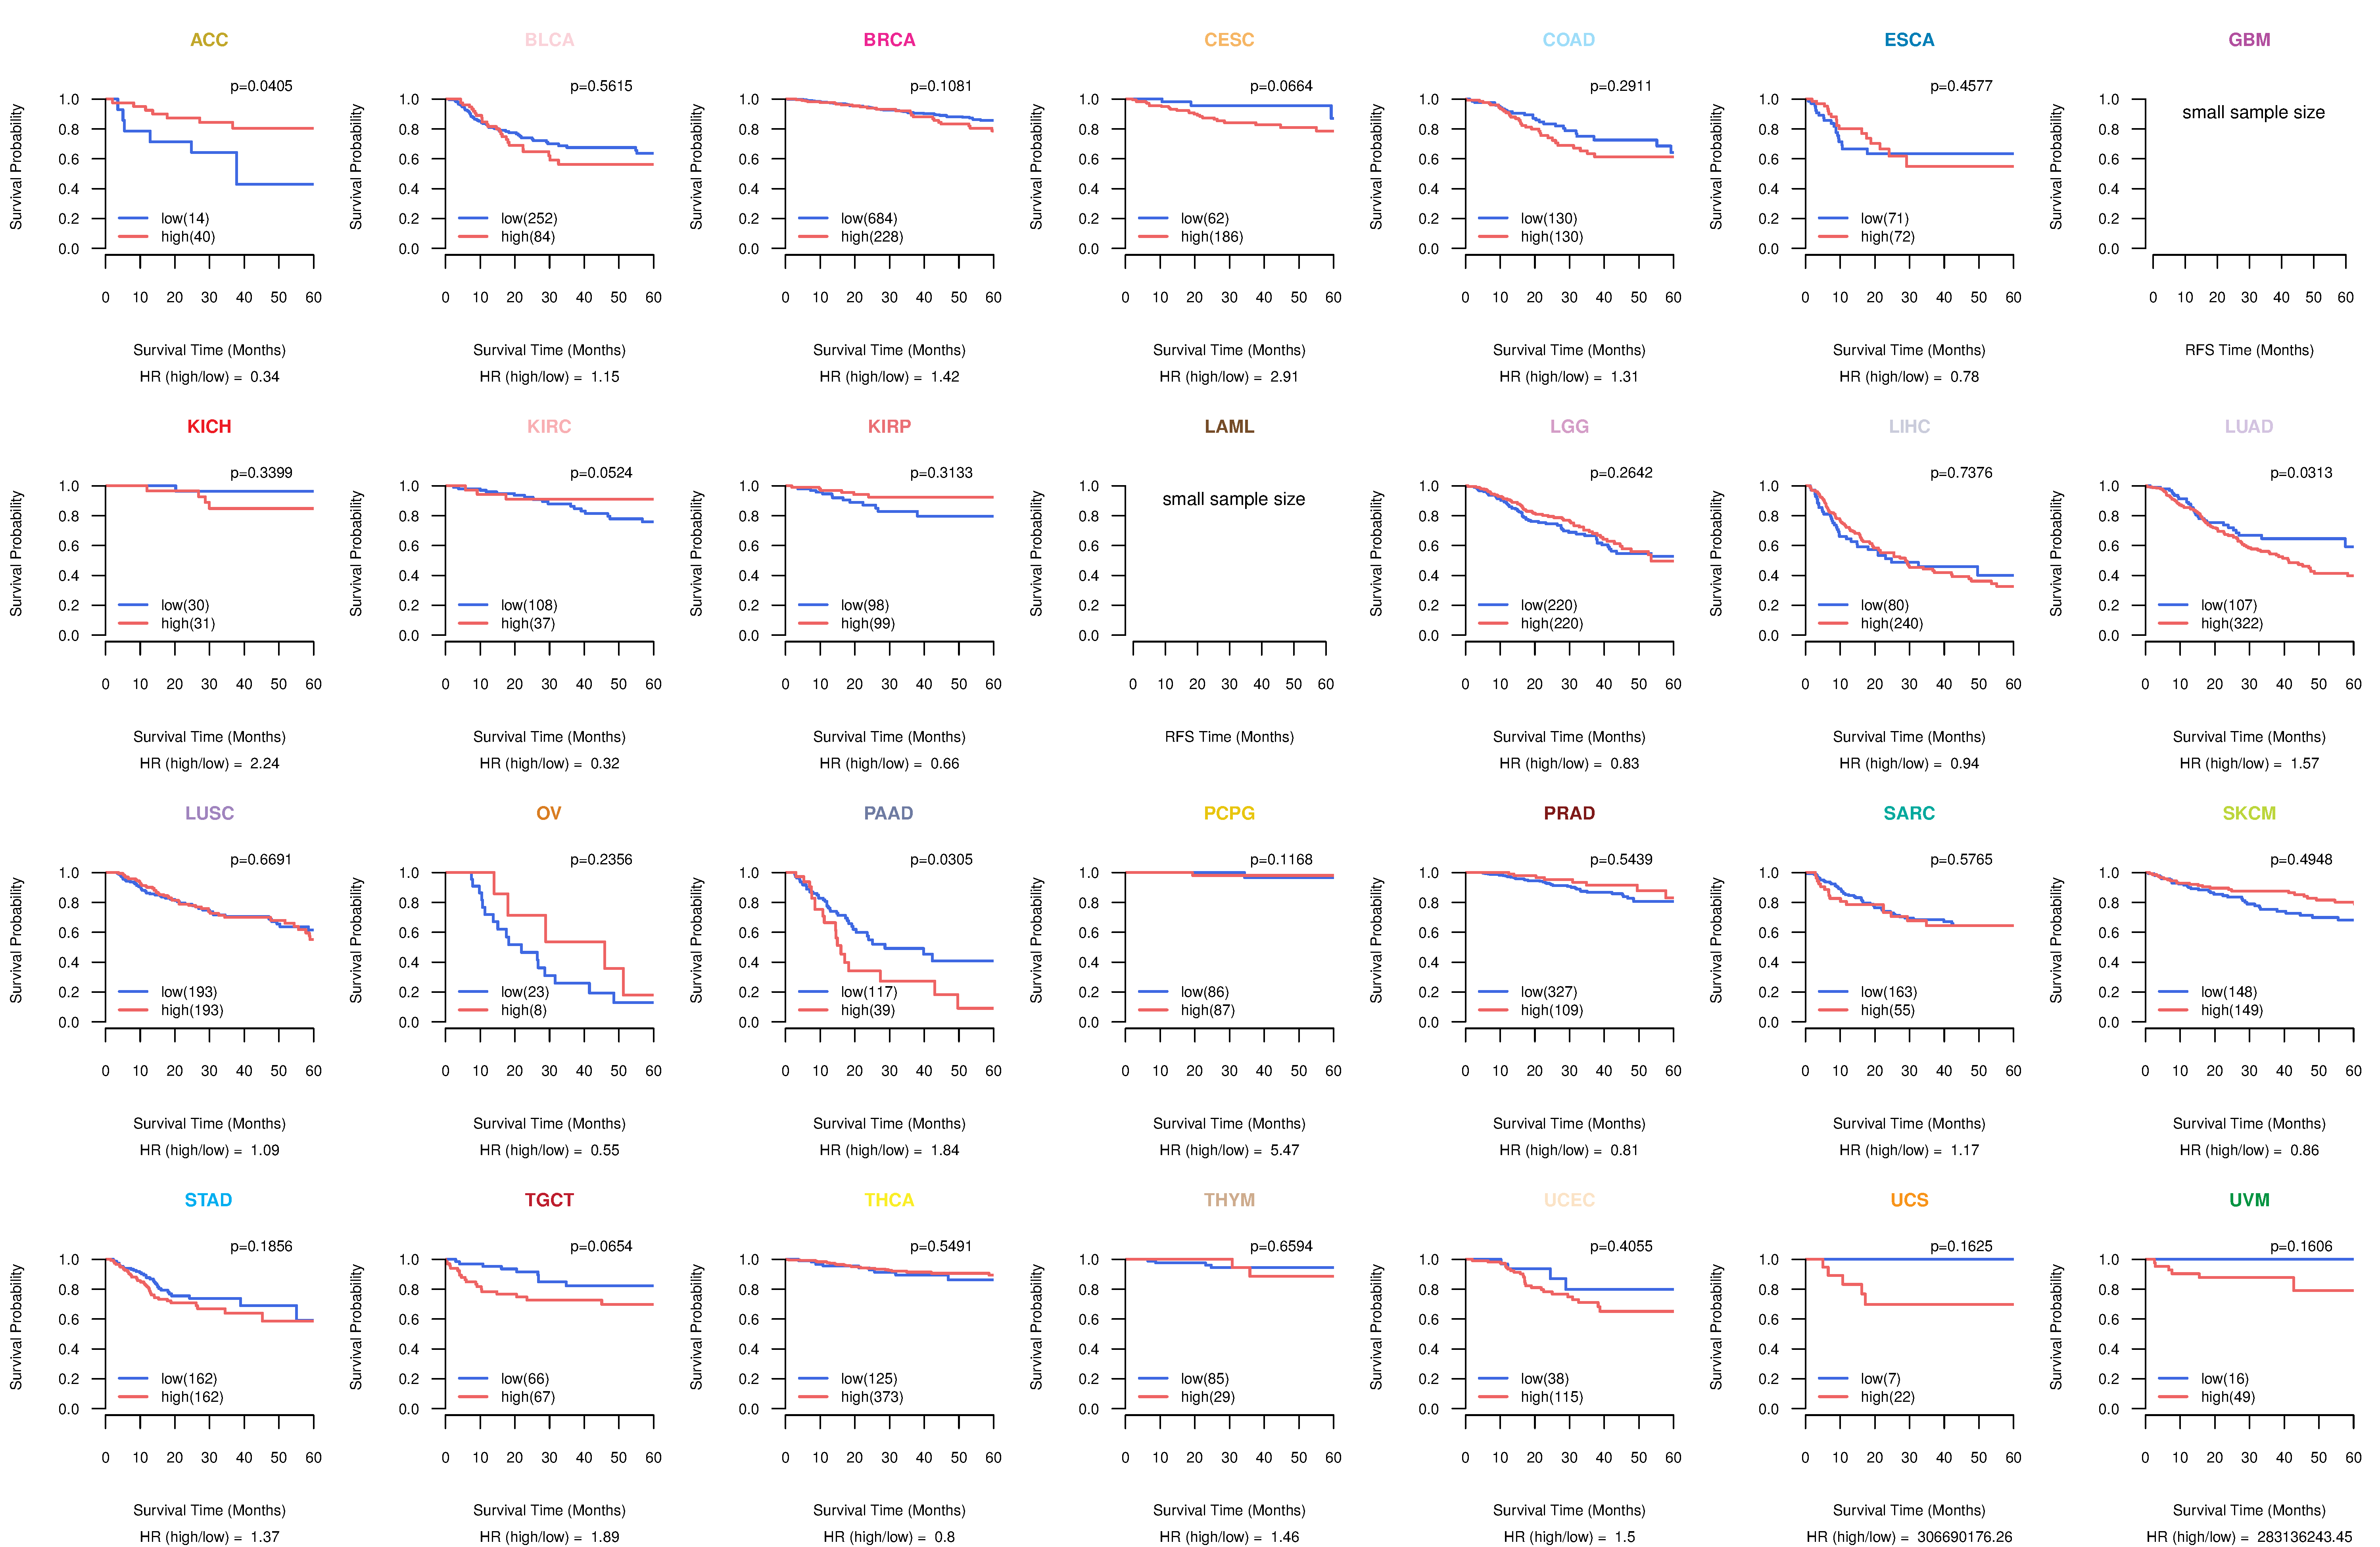
| Kaplan-Meier plots with logrank tests of overall survival (OS) using 28 cancer types (TCGA IlluminaHiSeq_RNASeqV2, pan-cancer normalized log2(norm_counts+1) data, version 2016-08-16) (TCGA clinicalMatrix, phenotype data, version 2016-04-27) * Click on the image to enlarge it in a new window. |
 |
| Kaplan-Meier plots with logrank test of relapse free survival (RFS) using 28 cancer types (TCGA IlluminaHiSeq_RNASeqV2, pan-cancer normalized log2(norm_counts+1) data, version 2016-08-16) (TCGA clinicalMatrix, phenotype data, version 2016-04-27) * Click on the image enlarge it in a new window. |
 |
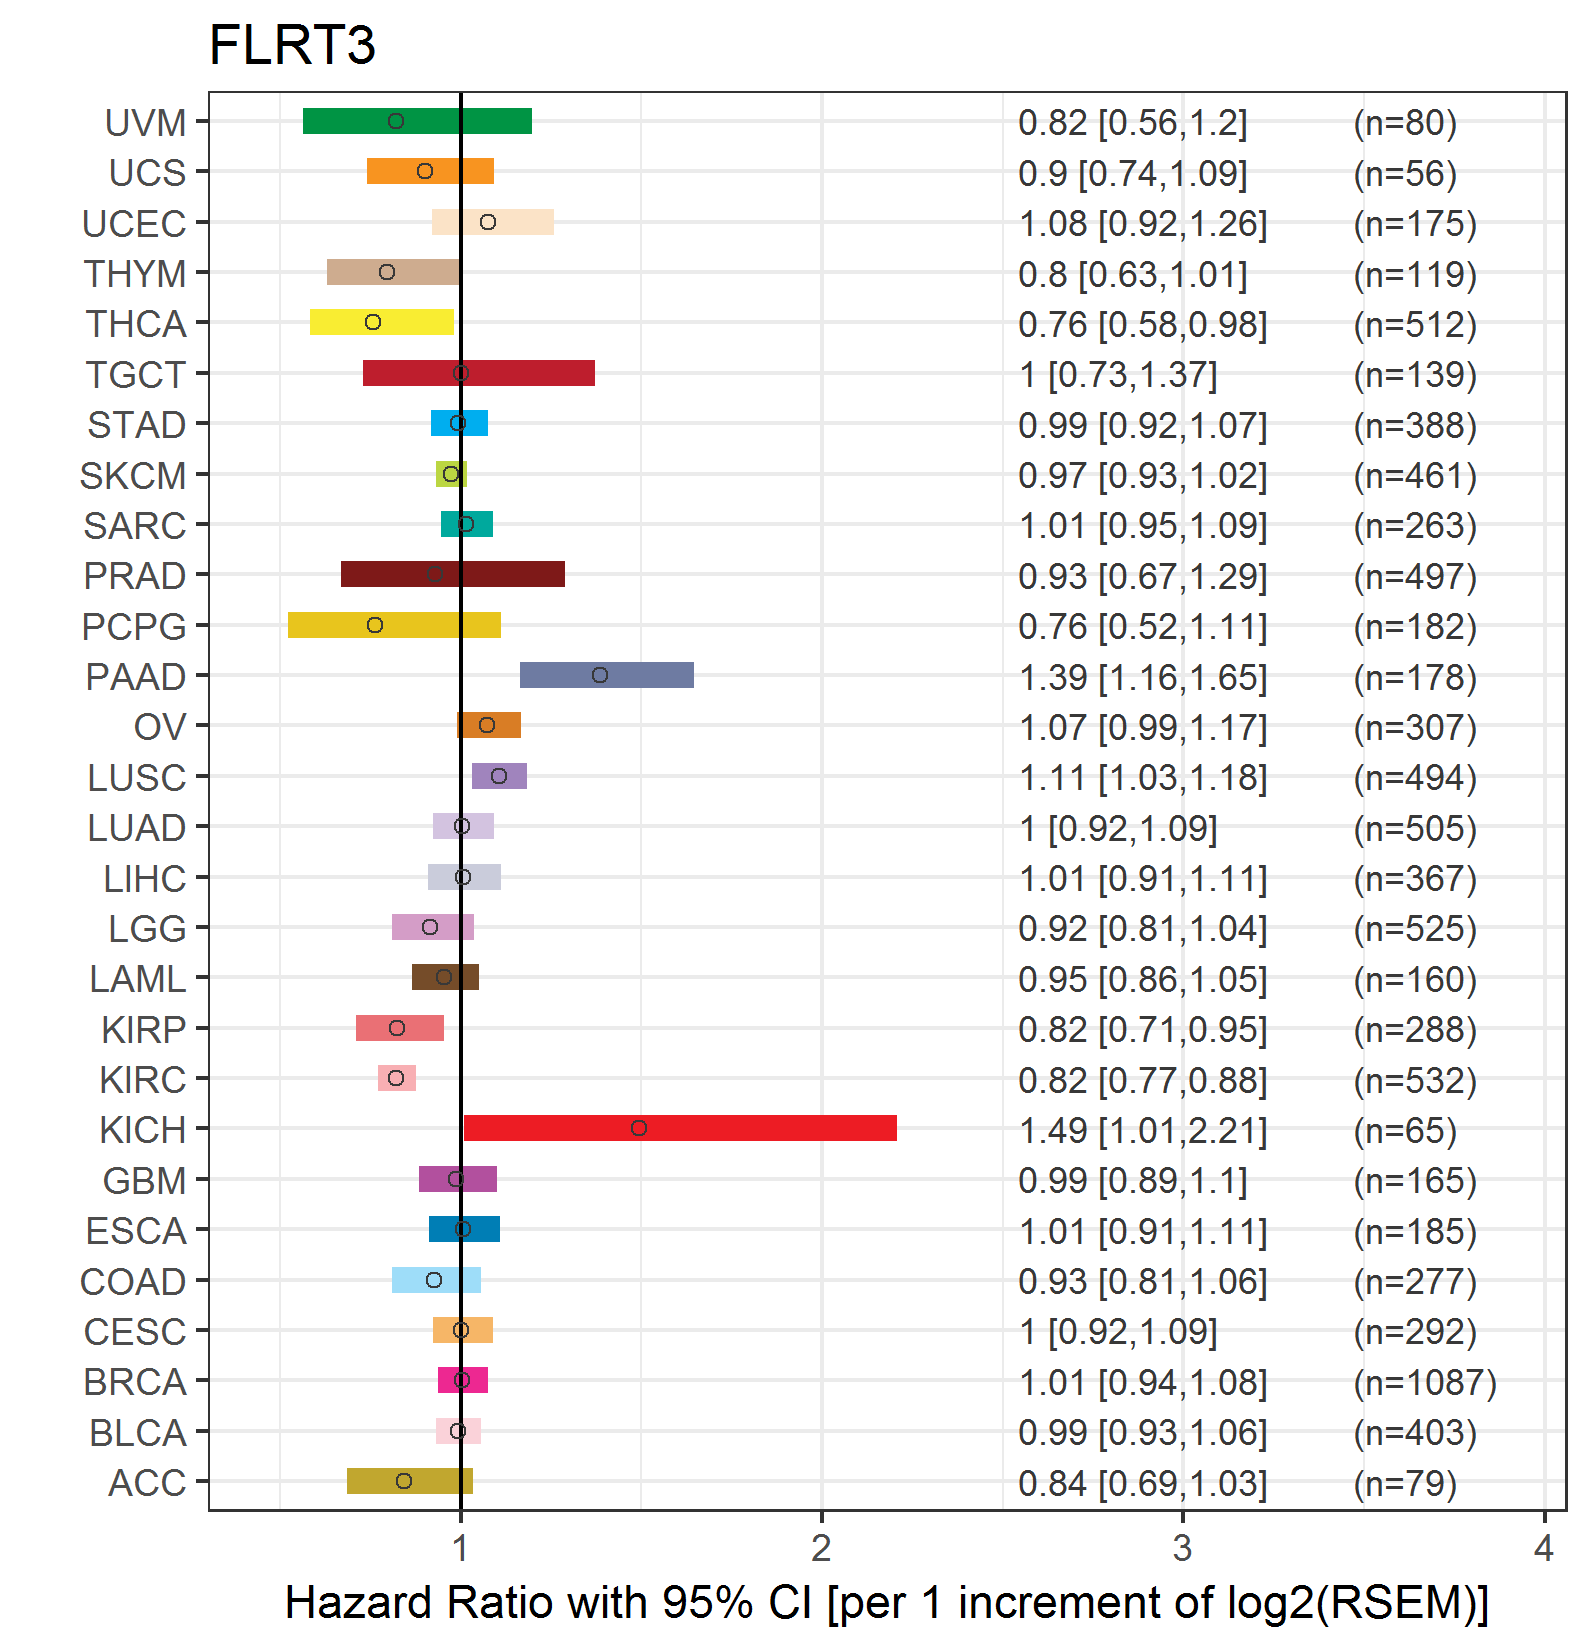
| Forest plot of Cox proportional hazard ratio (HR) and 95% CI of overall survival (OS) using 28 cancer types (TCGA IlluminaHiSeq_RNASeqV2, pan-cancer normalized log2(norm_counts+1) data, version 2016-08-16) (TCGA clinicalMatrix, phenotype data, version 2016-04-27) * Click on the image enlarge it in a new window. |
 |
| Forest plot of Cox proportional hazard ratio (HR) and 95% CI of relapse free survival (RFS) using 28 cancer types (TCGA IlluminaHiSeq_RNASeqV2, pan-cancer normalized log2(norm_counts+1) data, version 2016-08-16) (TCGA clinicalMatrix, phenotype data, version 2016-04-27) * Click on the image enlarge it in a new window. |
 |
| Top |
| TissGeneClin for FLRT3 |
| TissGeneDrug for FLRT3 |
| Drug information targeting TissGene (DrugBank Version 5.0.6, 2017-04-01) |
| DrugBank ID | Drug name | Drug activity | Drug type | Drug status |
| Top |
| TissGeneDisease for FLRT3 |
| Disease information associated with TissGene (DisGeNet, 2016-06-01) |
| Disease ID | Disease name | # pubmeds | Source |
| umls:C0000786 | Spontaneous abortion | 1 | CTD_human |
| umls:C0022735 | Klinefelter Syndrome | 1 | BeFree |
| umls:C0271623 | Hypogonadotropic hypogonadism | 1 | BeFree |
| umls:C3808986 | HYPOGONADOTROPIC HYPOGONADISM 21 WITH OR WITHOUT ANOSMIA | 1 | UNIPROT |
| umls:C0162809 | Kallmann Syndrome | 0 | ORPHANET |
|
Copyright 2016-Present - The University of Texas Health Science Center at Houston (UTHealth) Web File Viewing | How to Report, Fraud, Waste and Abuse | State of Texas | Statewide Search | Texas Homeland Security | Site Policies |