 |
| |
| |
| |
| |
| |
| |
|

| TissGeneSummary for STEAP2 |
 Gene summary Gene summary |
| Basic gene information | Gene symbol | STEAP2 |
| Gene name | STEAP family member 2, metalloreductase | |
| Synonyms | IPCA1|PCANAP1|PUMPCn|STAMP1|STMP | |
| Cytomap | UCSC genome browser: 7q21.13 | |
| Type of gene | protein-coding | |
| RefGenes | NM_001040665.1, NM_001040666.1,NM_001244944.1,NM_001244945.1,NM_001244946.1, NM_152999.3, | |
| Description | SixTransMembrane Protein of Prostate 1metalloreductase STEAP2prostate cancer associated protein 1prostate cancer-associated protein 1protein up-regulated in metastatic prostate cancerprotein upregulated in metastatic prostate cancersix transmembrane | |
| Modification date | 20141207 | |
| dbXrefs | MIM : 605094 | |
| HGNC : HGNC | ||
| Ensembl : ENSG00000157214 | ||
| HPRD : 05481 | ||
| Vega : OTTHUMG00000023341 | ||
| Protein | UniProt: go to UniProt's Cross Reference DB Table | |
| Expression | CleanEX: HS_STEAP2 | |
| BioGPS: 261729 | ||
| Pathway | NCI Pathway Interaction Database: STEAP2 | |
| KEGG: STEAP2 | ||
| REACTOME: STEAP2 | ||
| Pathway Commons: STEAP2 | ||
| Context | iHOP: STEAP2 | |
| ligand binding site mutation search in PubMed: STEAP2 | ||
| UCL Cancer Institute: STEAP2 | ||
| Assigned class in TissGDB* | A | |
| Included tissue-specific gene expression resources | HPA,TiGER,GTEx | |
| Specific-tissues in normal samples (assigned by TissGDB using HPA, TiGER, and GTEx) | ColonProstate | |
| Cancer types related to the specific-tissues in cancer samples (assigned by TissGDB using TCGA) | COADPRAD | |
| Reference showing the relevant tissue of STEAP2 | Six-transmembrane epithelial antigen of the prostate (STEAP1 and STEAP2)-differentially expressed by murine and human mesenchymal stem cells. Vaghjiani RJ, Talma S, Murphy CL. Tissue Eng Part A. 2009 Aug;15(8):2073-83. doi: 10.1089/ten.tea.2008.0519. (pmid:19196137) go to article | |
| Description by TissGene annotations | Fused withOncogene Fused withTSGene | |
| * Class A consists of genes with literature evidence and is part of the cTissGenes. Class B consists of only cTissGenes without additional evidence. The remaining genes belong to Class C. |
| Gene ontology having evidence of Inferred from Direct Assay (IDA) from Entrez |
| GO ID | GO term | PubMed ID | GO:0006893 | Golgi to plasma membrane transport | 12095985 | GO:0006897 | endocytosis | 12095985 | GO:0009725 | response to hormone | 12095985 | GO:0045055 | regulated secretory pathway | 12095985 | GO:0006893 | Golgi to plasma membrane transport | 12095985 | GO:0006897 | endocytosis | 12095985 | GO:0009725 | response to hormone | 12095985 | GO:0045055 | regulated secretory pathway | 12095985 |
| Top |
| TissGeneExp for STEAP2 |
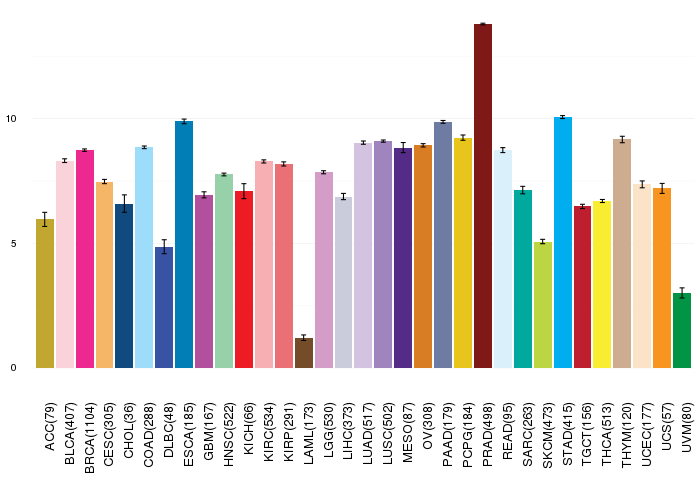
| Gene expressions across 28 cancer types (X-axis: cancer type and Y-axis: log2(norm_counts+1)) (TCGA IlluminaHiSeq_RNASeqV2, pan-cancer normalized log2(norm_counts+1) data, version 2016-08-16) |
 |
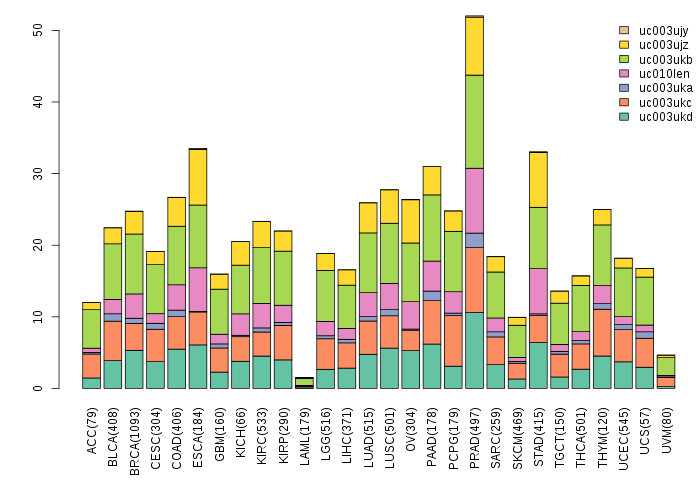
| Gene isoform expressions across 28 cancer types (X-axis: cancer type and Y-axis: log2(norm_counts+1)) (TCGA pan-cancer tcga_rsem_isoform_tpm, version 2016-09-01) |
 |
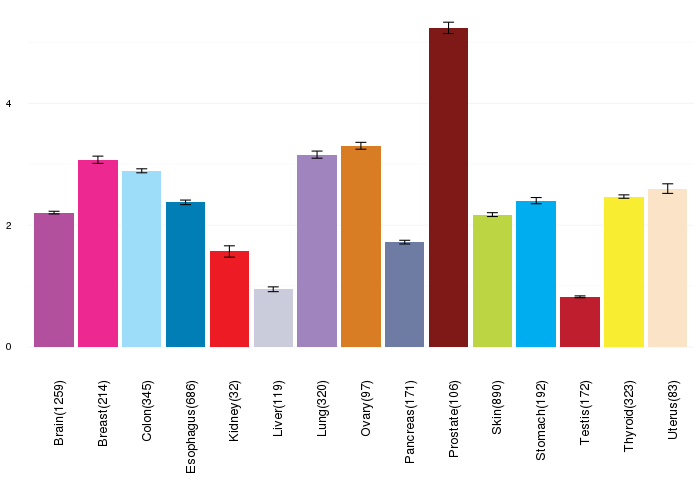
| Gene expressions across normal tissues of GTEx data (GTEx GTEx_Analysis_v6_RNA-seq_RNA-SeQCv1.1.8_gene_rpkm.gct) - Here, we shows the matched tissue types only among our 28 cancer types. |
 |
| Different expressions across 14 cancer types with more than 10 samples between matched tumors and normals (X-axis: cancer type and Y-axis: log2(norm_counts+1)) (TCGA IlluminaHiSeq_RNASeqV2, pan-cancer normalized log2(norm_counts+1) data, version 2016-08-16) |
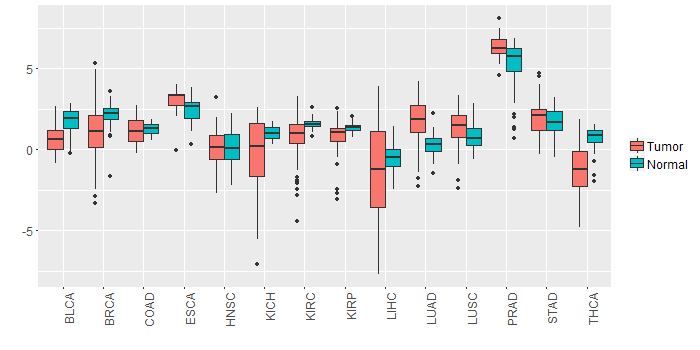 |
| - Significantly differentially expressed cancer types and information. (|Fold change|>1 and FDR<0.05) |
| Cancer type | Mean(exp) in tumor | Mean(exp) in matched normal | Log2FC | P-val. | FDR |
| PRAD | 6.30768028 | 5.15583028 | 1.15185 | 1.59E-05 | 8.25E-05 |
| LUAD | 1.752368013 | 0.299086978 | 1.453281034 | 4.51E-10 | 2.50E-09 |
| THCA | -1.311498761 | 0.722741917 | -2.034240678 | 1.59E-15 | 2.20E-14 |
| KICH | -0.357799643 | 1.017192357 | -1.374992 | 0.0139 | 0.024275436 |
| BLCA | 0.613002042 | 1.692954673 | -1.079952632 | 6.00E-04 | 0.00467351 |
| Top |
| TissGene-miRNA for STEAP2 |
| Significantly anti-correlated miRNAs of TissGene across 28 cancer types (Gene-miRNA relations from TargetScanHuman Relsease 7.1, Conserved_Site_Context_Scores.txt.zip, 06.01.2016) (TCGA IlluminaHiSeq_miRNASeq, log2(RPM+1) data, version 2016-11-21) (TCGA IlluminaHiSeq_RNASeqV2, log2(normalized_count+1) data, version 2016-08-16) (Spearman’s Rank Correlation (p-value<0.05 and coefficient<-0.25)) |
| Cancer type | miRNA id | miRNA accession | P-val. | Coeff. | # samples |
| LUAD | hsa-miR-196b-5p | MIMAT0001080 | 0.025 | -0.29 | 60 |
| Top |
| TissGeneMut for STEAP2 |
| TissGeneSNV for STEAP2 |
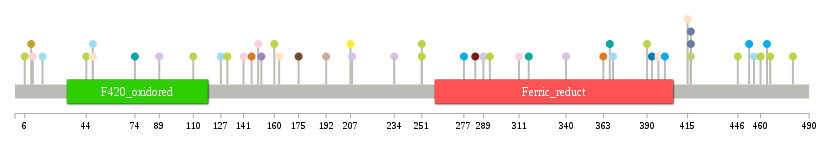
| nsSNV counts per each loci. Different colors of circles represent different cancer types. Circle size denotes number of samples. (TCGA somatic mutation (SNPs and small INDELs) data, version 2016-04-25) * Click on the image to enlarge it in a new window. |
 |
 |
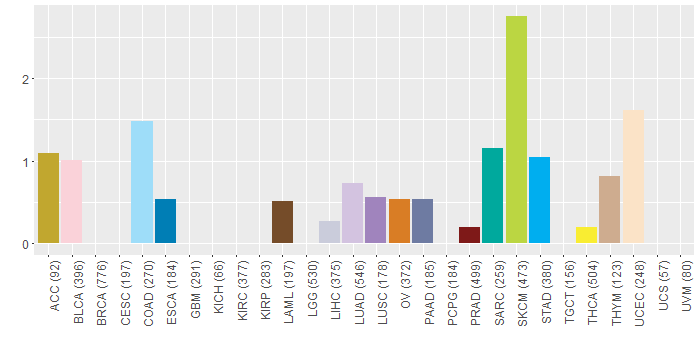
| Somatic nucleotide variants of TissGene across 28 cancer types (X-axis: cancer type and Y-axis: % of mutated samples) The numbers in parentheses are numbers of samples with mutation (nsSNVs). (TCGA somatic mutation (SNPs and small INDELs) data, version 2016-04-25) |
 |
| - nsSNVs sorted by frequency. |
| AAchange | Cancer type | # samples |
| p.G369D | COAD | 1 |
| p.S150L | BLCA | 1 |
| p.P453S | STAD | 1 |
| p.L192F | THYM | 1 |
| p.E96X | READ | 1 |
| p.M325I | HNSC | 1 |
| p.F393S | ESCA | 1 |
| p.L141F | BLCA | 1 |
| p.R289W | LIHC | 1 |
| p.R48* | UCEC | 1 |
| p.R456Q | COAD | 1 |
| p.F363I | OV | 1 |
| p.Q340* | LUAD | 1 |
| p.Y284C | PRAD | 1 |
| p.M6I | SKCM | 1 |
| p.V401G | STAD | 1 |
| p.L446F | SKCM | 1 |
| p.E127G | COAD | 1 |
| p.R48Q | COAD | 1 |
| p.D160N | SKCM | 1 |
| p.V74L | SARC | 1 |
| p.F146L | OV | 1 |
| p.I379V | HNSC | 1 |
| p.R207L | THCA | 1 |
| p.S367I | SARC | 1 |
| p.P251L | SKCM | 1 |
| p.I252T | HNSC | 1 |
| p.R417Q | SKCM | 1 |
| p.F311V | BLCA | 1 |
| p.P480S | SKCM | 1 |
| p.P251S | SKCM | 1 |
| p.W152R | LUSC | 1 |
| p.R460Q | SKCM | 1 |
| p.R417X | PAAD | 1 |
| p.R417* | PAAD | 1 |
| p.I89V | LUAD | 1 |
| p.G110S | SKCM | 1 |
| p.E131K | SKCM | 1 |
| p.E358G | HNSC | 1 |
| p.F17C | COAD | 1 |
| p.R175* | LAML | 1 |
| p.S44F | SKCM | 1 |
| p.L208H | LUAD | 1 |
| p.D234Y | LUAD | 1 |
| p.W415L | UCEC | 1 |
| p.A277S | STAD | 1 |
| p.I252V | HNSC | 1 |
| p.E466K | SKCM | 1 |
| p.F397S | UCEC | 1 |
| p.G464D | STAD | 1 |
| p.K11N | BLCA | 1 |
| p.R163Q | UCEC | 1 |
| p.V317A | SARC | 1 |
| p.P293S | SKCM | 1 |
| p.P10L | ACC | 1 |
| p.E390K | SKCM | 1 |
| Top |
| TissGeneCNV for STEAP2 |
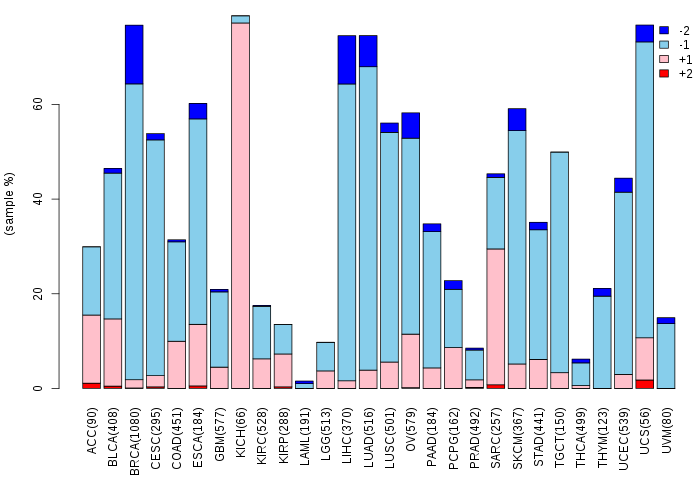
| Copy number variations of TissGene across 28 cancer types (X-axis: cancer type and Y-axis: % of CNV samples) (TCGA Gistic2_CopyNumber_Gistic2_all_data_by_genes, Gistic2 copy number data, version 2016-08-16) |
 |
| Top |
| TissGeneFusions for STEAP2 |
| Fusion genes including TissGene (ChimerDB 3.0, 2016-12-01 and TCGA fusion Portal 2015-12-01) |
| Database | Src | Cancer type | Sample | Fusion gene | ORF | 5'-gene BP | 3'-gene BP |
| Chimerdb3.0 | ChiTaRs | NA | DA568273 | STEAP2-COL6A2 | chr7:89865111 | chr21:47545844 | |
| Chimerdb3.0 | ChiTaRs | NA | AY008445 | STEAP2-PDCD4 | chr7:89863908 | chr10:112659513 | |
| Chimerdb3.0 | ChiTaRs | NA | AA523333 | STEAP2-STEAP2 | chr7:89864818 | chr7:89864813 | |
| Chimerdb3.0 | ChiTaRs | NA | AA774945 | STEAP2-SEC23A | chr7:89863764 | chr14:39524422 | |
| Chimerdb3.0 | ChiTaRs | NA | AA772562 | RNF185-STEAP2 | chr22:31602999 | chr7:89862595 | |
| Chimerdb3.0 | ChiTaRs | NA | AI768908 | SETDB2-STEAP2 | chr13:50064841 | chr7:89863253 |
| Top |
| TissGeneNet for STEAP2 |
| Co-expressed gene networks based on protein-protein interaction data (CePIN) (TCGA IlluminaHiSeq_RNASeqV2, pan-cancer normalized log2(norm_counts+1) data, version 2016-08-16) (PINA2 ppi data) |
| Top |
| TissGeneProg for STEAP2 |
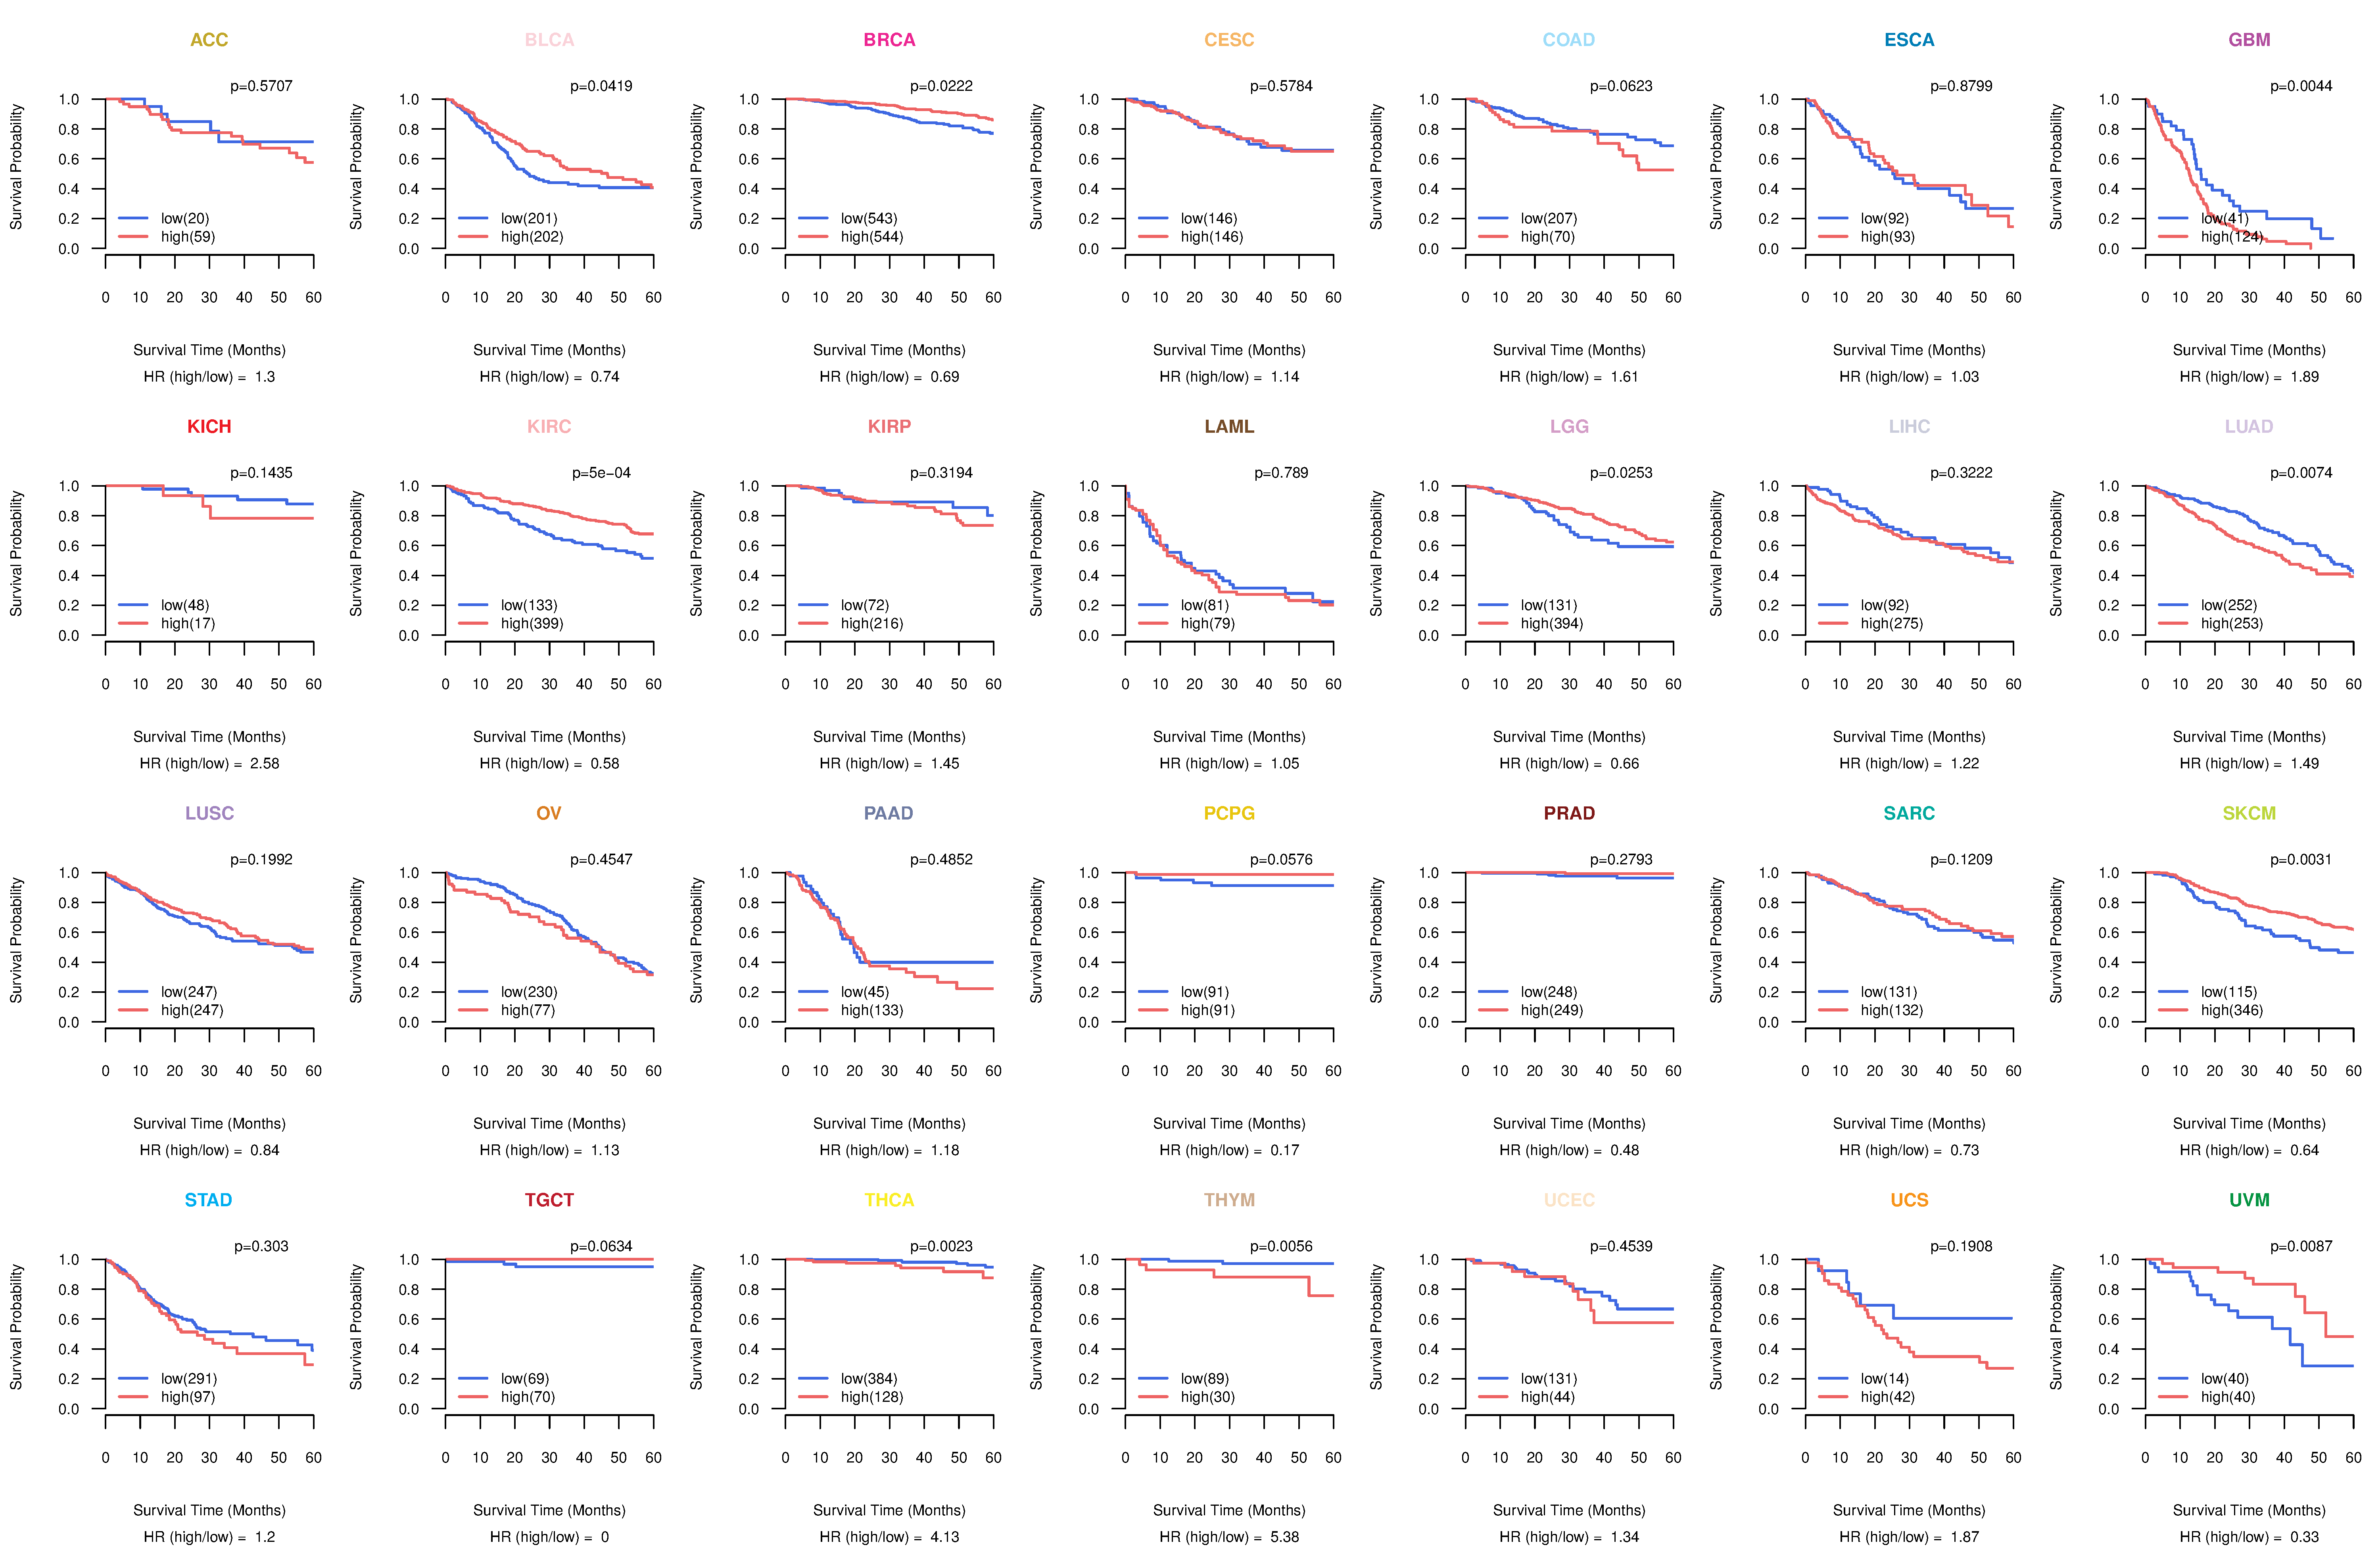
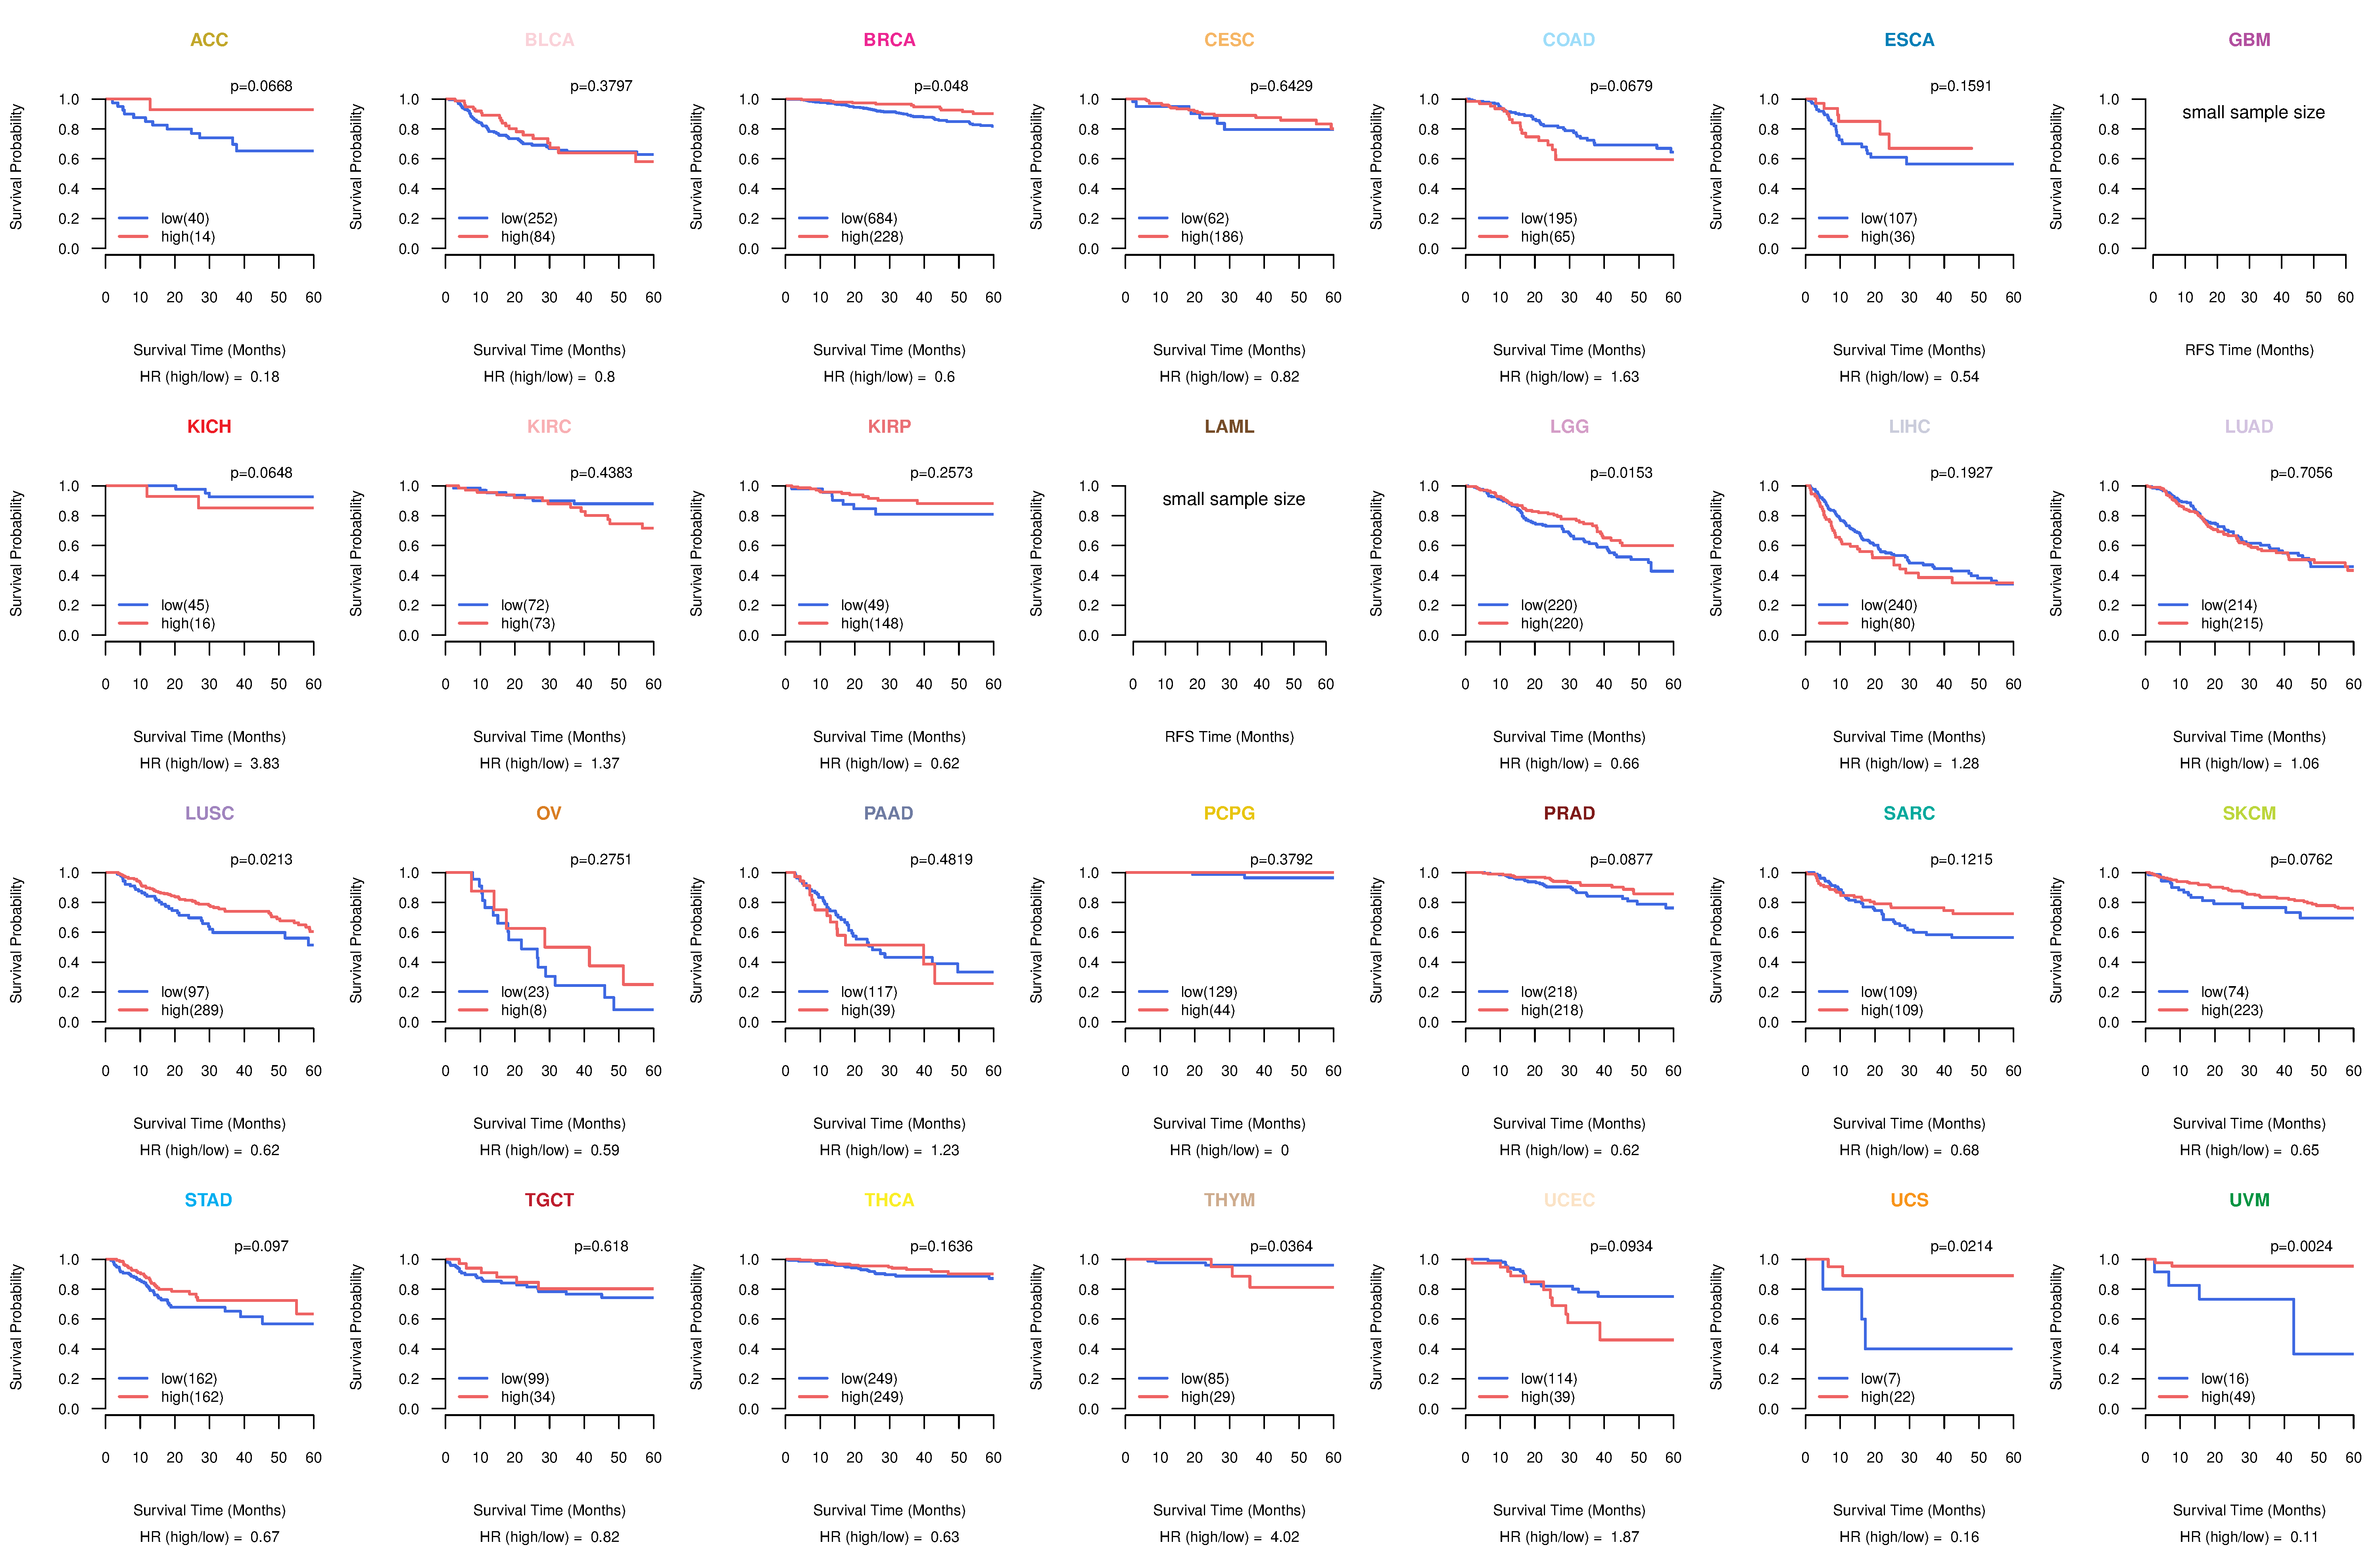
| Kaplan-Meier plots with logrank tests of overall survival (OS) using 28 cancer types (TCGA IlluminaHiSeq_RNASeqV2, pan-cancer normalized log2(norm_counts+1) data, version 2016-08-16) (TCGA clinicalMatrix, phenotype data, version 2016-04-27) * Click on the image to enlarge it in a new window. |
 |
| Kaplan-Meier plots with logrank test of relapse free survival (RFS) using 28 cancer types (TCGA IlluminaHiSeq_RNASeqV2, pan-cancer normalized log2(norm_counts+1) data, version 2016-08-16) (TCGA clinicalMatrix, phenotype data, version 2016-04-27) * Click on the image enlarge it in a new window. |
 |
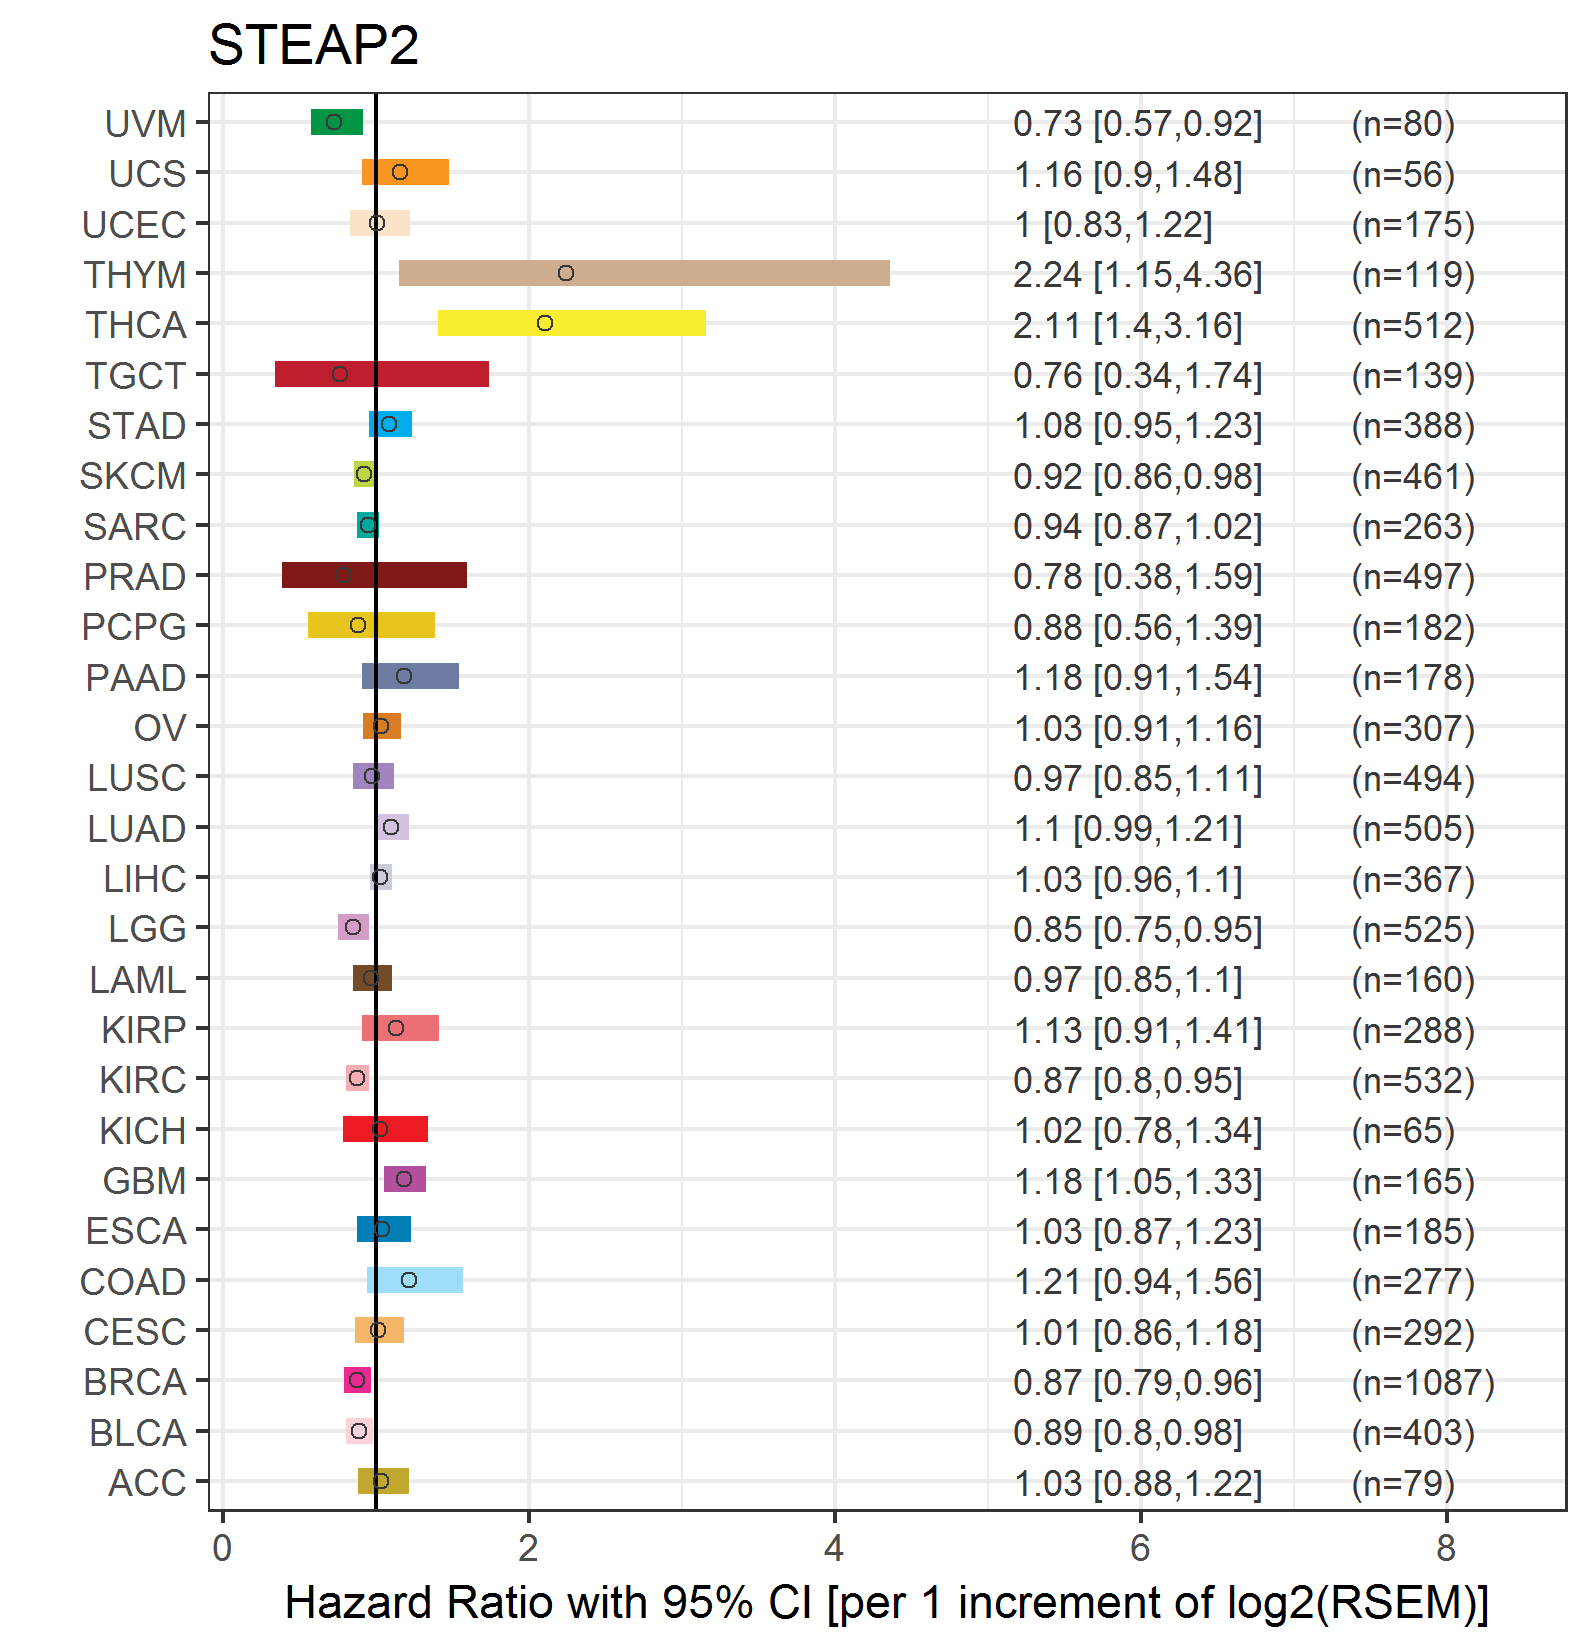
| Forest plot of Cox proportional hazard ratio (HR) and 95% CI of overall survival (OS) using 28 cancer types (TCGA IlluminaHiSeq_RNASeqV2, pan-cancer normalized log2(norm_counts+1) data, version 2016-08-16) (TCGA clinicalMatrix, phenotype data, version 2016-04-27) * Click on the image enlarge it in a new window. |
 |
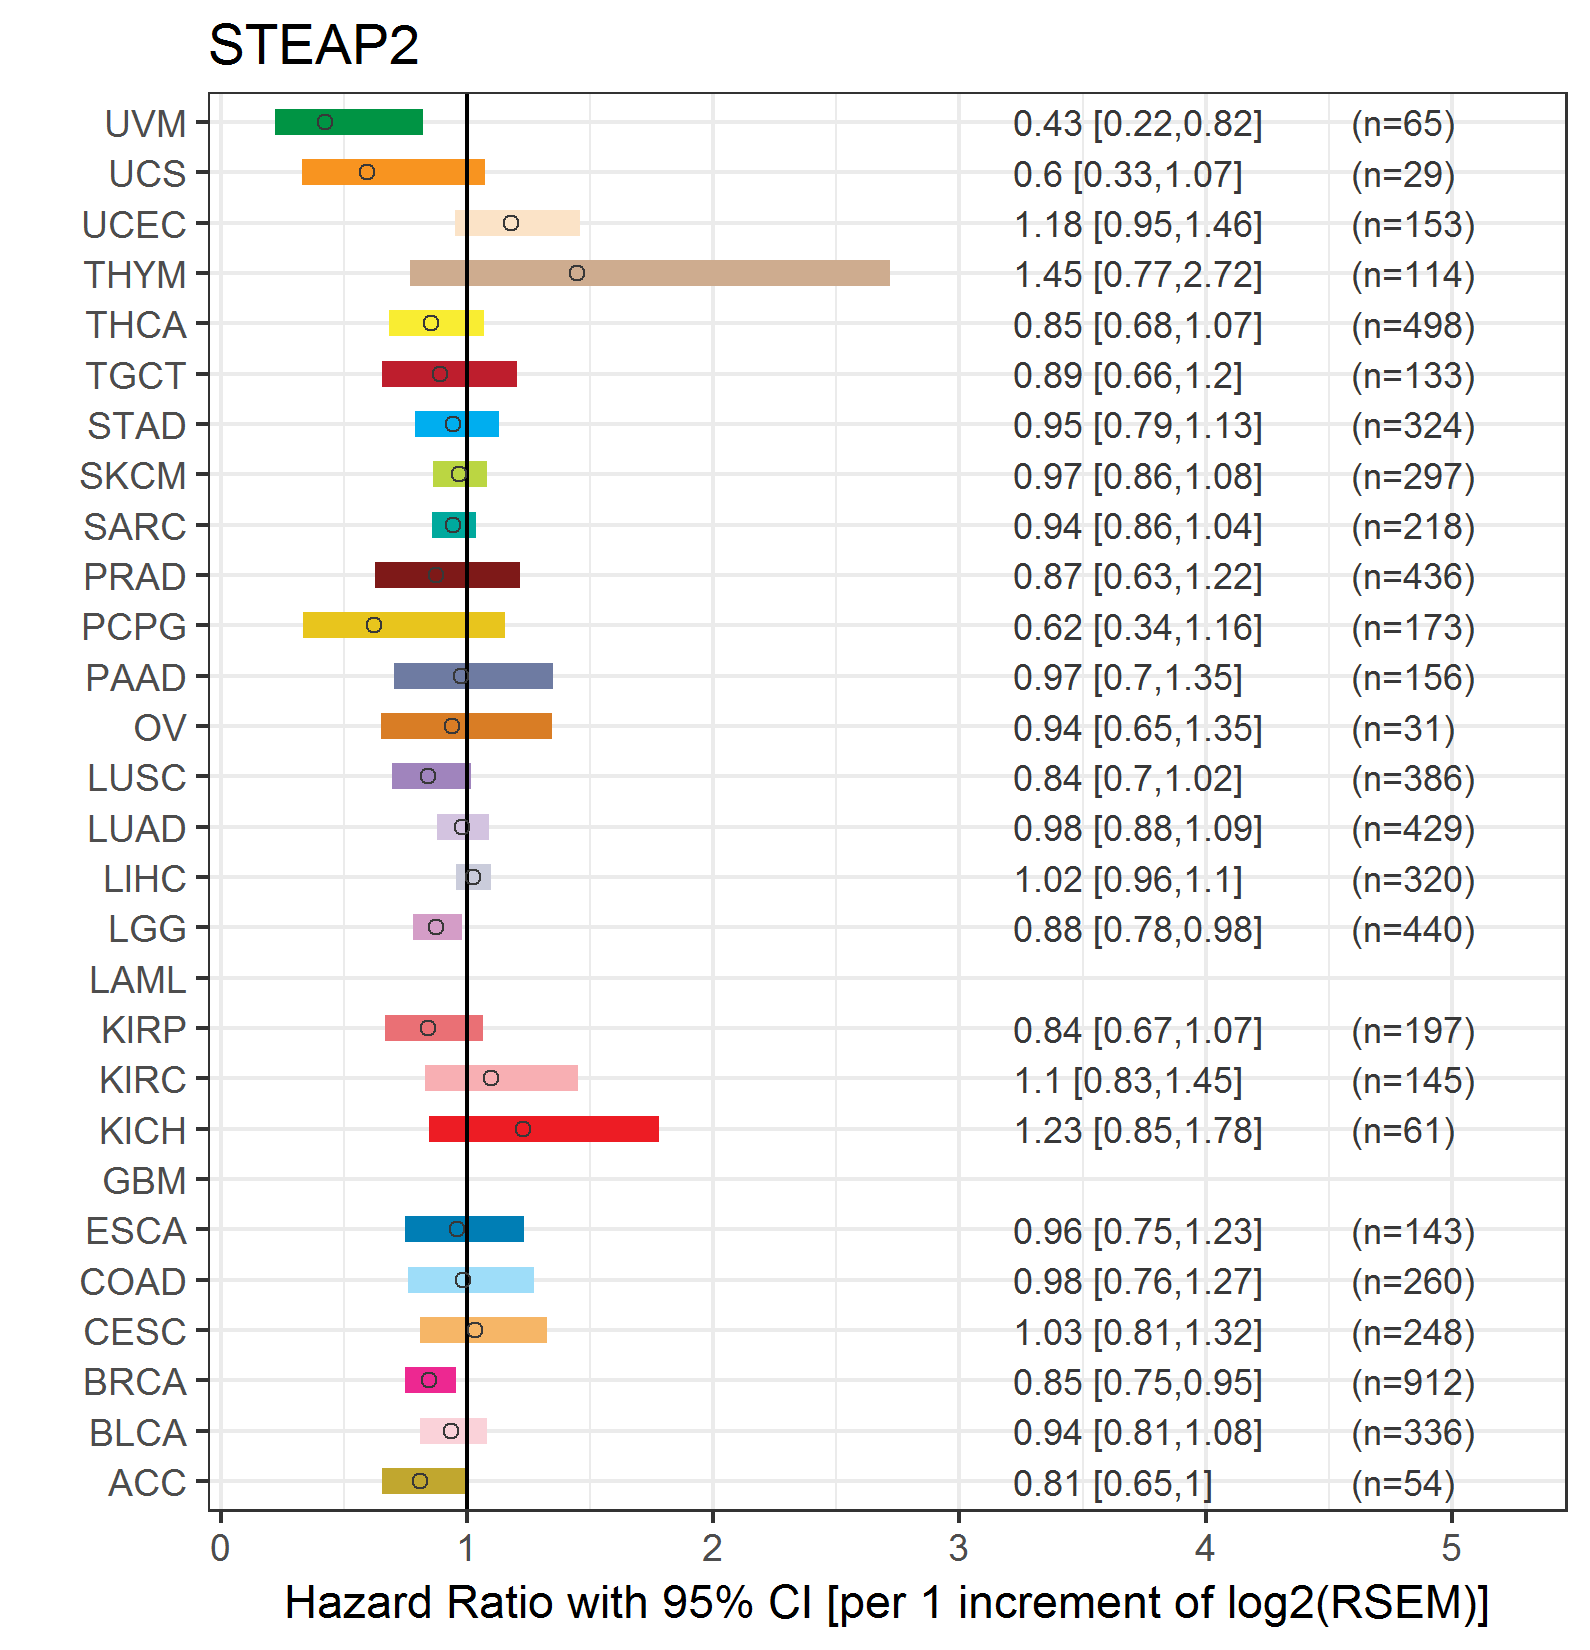
| Forest plot of Cox proportional hazard ratio (HR) and 95% CI of relapse free survival (RFS) using 28 cancer types (TCGA IlluminaHiSeq_RNASeqV2, pan-cancer normalized log2(norm_counts+1) data, version 2016-08-16) (TCGA clinicalMatrix, phenotype data, version 2016-04-27) * Click on the image enlarge it in a new window. |
 |
| Top |
| TissGeneClin for STEAP2 |
| TissGeneDrug for STEAP2 |
| Drug information targeting TissGene (DrugBank Version 5.0.6, 2017-04-01) |
| DrugBank ID | Drug name | Drug activity | Drug type | Drug status |
| Top |
| TissGeneDisease for STEAP2 |
| Disease information associated with TissGene (DisGeNet, 2016-06-01) |
| Disease ID | Disease name | # pubmeds | Source |
| umls:C0376358 | Malignant neoplasm of prostate | 4 | BeFree |
| umls:C0600139 | Prostate carcinoma | 4 | BeFree |
| umls:C0033578 | Prostatic Neoplasms | 3 | BeFree,LHGDN |
| umls:C0040336 | Tobacco Use Disorder | 1 | GAD |
| umls:C0553580 | Ewings sarcoma | 1 | BeFree |
| umls:C1704272 | Benign Prostatic Hyperplasia | 1 | BeFree |
|
Copyright 2016-Present - The University of Texas Health Science Center at Houston (UTHealth) Web File Viewing | How to Report, Fraud, Waste and Abuse | State of Texas | Statewide Search | Texas Homeland Security | Site Policies |