 |
| |
| |
| |
| |
| |
| |
|

| TissGeneSummary for ING2 |
 Gene summary Gene summary |
| Basic gene information | Gene symbol | ING2 |
| Gene name | inhibitor of growth family, member 2 | |
| Synonyms | ING1L|p33ING2 | |
| Cytomap | UCSC genome browser: 4q35.1 | |
| Type of gene | protein-coding | |
| RefGenes | NM_001291959.1, NM_001564.3, | |
| Description | ING1Lpinhibitor of growth 1-like proteininhibitor of growth protein 2p32 | |
| Modification date | 20141207 | |
| dbXrefs | MIM : 604215 | |
| HGNC : HGNC | ||
| Ensembl : ENSG00000168556 | ||
| HPRD : 05021 | ||
| Vega : OTTHUMG00000150502 | ||
| Protein | UniProt: go to UniProt's Cross Reference DB Table | |
| Expression | CleanEX: HS_ING2 | |
| BioGPS: 3622 | ||
| Pathway | NCI Pathway Interaction Database: ING2 | |
| KEGG: ING2 | ||
| REACTOME: ING2 | ||
| Pathway Commons: ING2 | ||
| Context | iHOP: ING2 | |
| ligand binding site mutation search in PubMed: ING2 | ||
| UCL Cancer Institute: ING2 | ||
| Assigned class in TissGDB* | C | |
| Included tissue-specific gene expression resources | TiGER,GTEx | |
| Specific-tissues in normal samples (assigned by TissGDB using HPA, TiGER, and GTEx) | ProstateTestis | |
| Cancer types related to the specific-tissues in cancer samples (assigned by TissGDB using TCGA) | PRADTGCT | |
| Reference showing the relevant tissue of ING2 | ||
| Description by TissGene annotations | Have significant anti-correlated miRNA Fused withTSGene | |
| * Class A consists of genes with literature evidence and is part of the cTissGenes. Class B consists of only cTissGenes without additional evidence. The remaining genes belong to Class C. |
| Gene ontology having evidence of Inferred from Direct Assay (IDA) from Entrez |
| GO ID | GO term | PubMed ID | GO:0006355 | regulation of transcription, DNA-templated | 15243141 | GO:0030511 | positive regulation of transforming growth factor beta receptor signaling pathway | 18334480 | GO:0045893 | positive regulation of transcription, DNA-templated | 18334480 | GO:0006355 | regulation of transcription, DNA-templated | 15243141 | GO:0030511 | positive regulation of transforming growth factor beta receptor signaling pathway | 18334480 | GO:0045893 | positive regulation of transcription, DNA-templated | 18334480 |
| Top |
| TissGeneExp for ING2 |
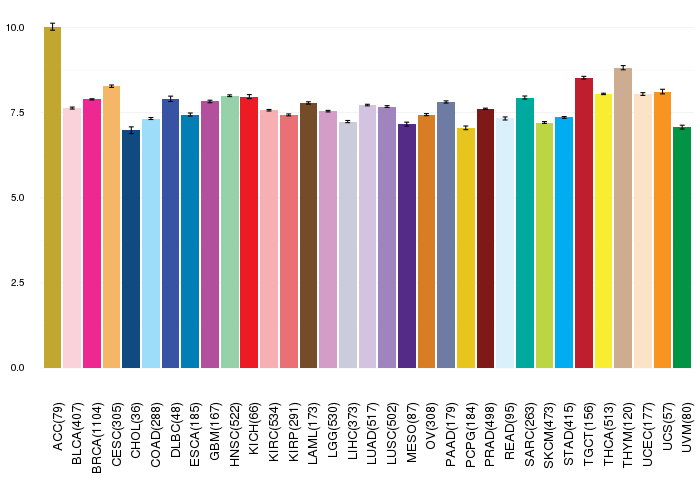
| Gene expressions across 28 cancer types (X-axis: cancer type and Y-axis: log2(norm_counts+1)) (TCGA IlluminaHiSeq_RNASeqV2, pan-cancer normalized log2(norm_counts+1) data, version 2016-08-16) |
 |
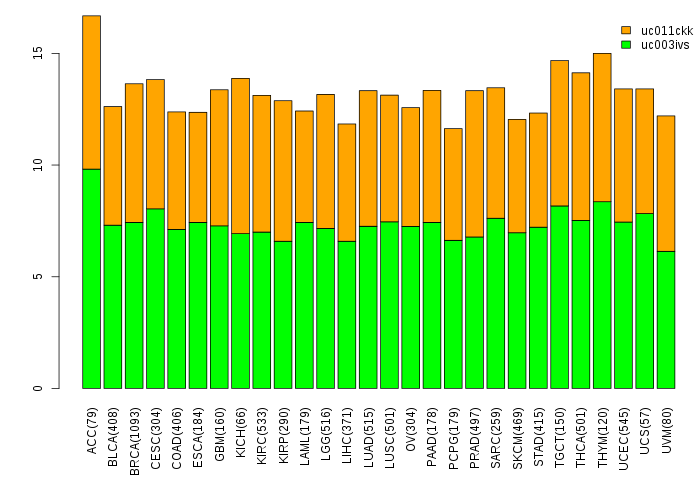
| Gene isoform expressions across 28 cancer types (X-axis: cancer type and Y-axis: log2(norm_counts+1)) (TCGA pan-cancer tcga_rsem_isoform_tpm, version 2016-09-01) |
 |
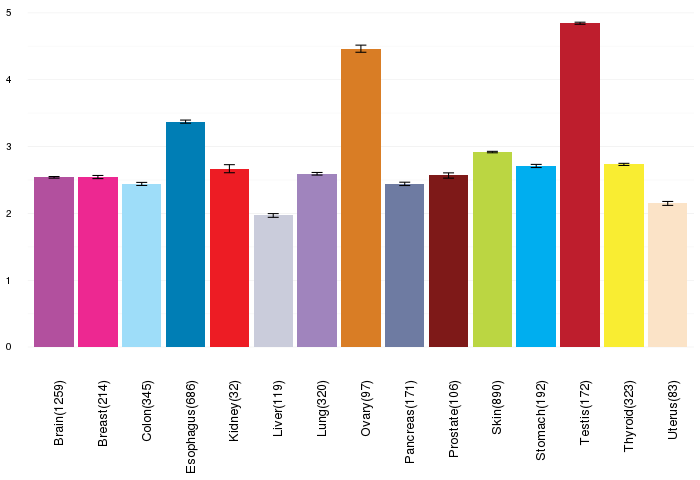
| Gene expressions across normal tissues of GTEx data (GTEx GTEx_Analysis_v6_RNA-seq_RNA-SeQCv1.1.8_gene_rpkm.gct) - Here, we shows the matched tissue types only among our 28 cancer types. |
 |
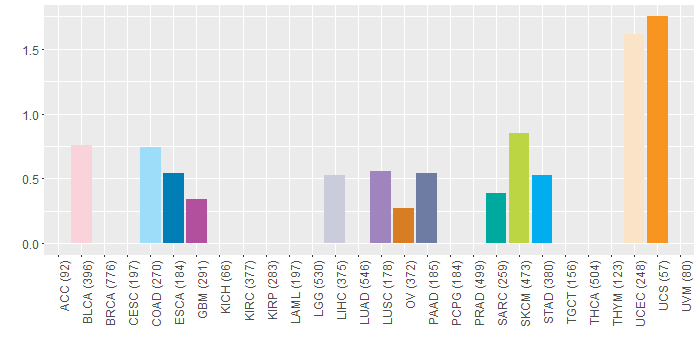
| Different expressions across 14 cancer types with more than 10 samples between matched tumors and normals (X-axis: cancer type and Y-axis: log2(norm_counts+1)) (TCGA IlluminaHiSeq_RNASeqV2, pan-cancer normalized log2(norm_counts+1) data, version 2016-08-16) |
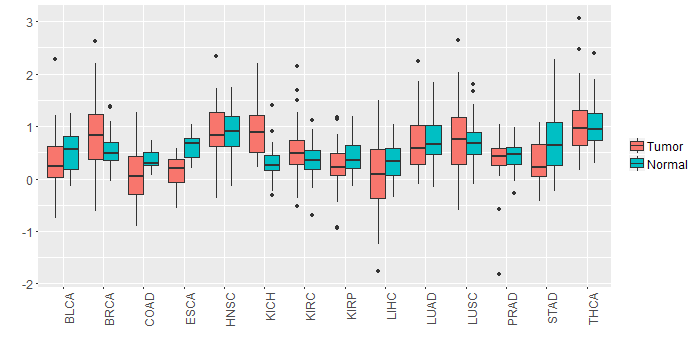 |
| - Significantly differentially expressed cancer types and information. (|Fold change|>1 and FDR<0.05) |
| Cancer type | Mean(exp) in tumor | Mean(exp) in matched normal | Log2FC | P-val. | FDR |
| Top |
| TissGene-miRNA for ING2 |
| Significantly anti-correlated miRNAs of TissGene across 28 cancer types (Gene-miRNA relations from TargetScanHuman Relsease 7.1, Conserved_Site_Context_Scores.txt.zip, 06.01.2016) (TCGA IlluminaHiSeq_miRNASeq, log2(RPM+1) data, version 2016-11-21) (TCGA IlluminaHiSeq_RNASeqV2, log2(normalized_count+1) data, version 2016-08-16) (Spearman’s Rank Correlation (p-value<0.05 and coefficient<-0.25)) |
| Cancer type | miRNA id | miRNA accession | P-val. | Coeff. | # samples |
| LUAD | hsa-miR-186-5p | MIMAT0000456 | 0.035 | -0.27 | 60 |
| ACC | hsa-miR-1193 | MIMAT0015049 | 0.0073 | -0.36 | 78 |
| ACC | hsa-miR-1193 | MIMAT0015049 | 0.0073 | -0.36 | 78 |
| Top |
| TissGeneMut for ING2 |
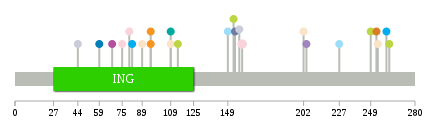
| TissGeneSNV for ING2 |
| nsSNV counts per each loci. Different colors of circles represent different cancer types. Circle size denotes number of samples. (TCGA somatic mutation (SNPs and small INDELs) data, version 2016-04-25) * Click on the image to enlarge it in a new window. |
 |
 |
| Somatic nucleotide variants of TissGene across 28 cancer types (X-axis: cancer type and Y-axis: % of mutated samples) The numbers in parentheses are numbers of samples with mutation (nsSNVs). (TCGA somatic mutation (SNPs and small INDELs) data, version 2016-04-25) |
 |
| - nsSNVs sorted by frequency. |
| AAchange | Cancer type | # samples |
| p.E159K | BLCA | 2 |
| p.K80E | BLCA | 1 |
| p.P249S | SKCM | 1 |
| p.W253C | OV | 1 |
| p.E109K | SARC | 1 |
| p.T157A | LIHC | 1 |
| p.G260* | STAD | 1 |
| p.N262K | SKCM | 1 |
| p.P202L | UCEC | 1 |
| p.R154M | PAAD | 1 |
| p.G227R | COAD | 1 |
| p.Y254H | UCEC | 1 |
| p.T59M | ESCA | 1 |
| p.E204Q | LUSC | 1 |
| p.E95* | UCS | 1 |
| p.R114W | SKCM | 1 |
| p.E68K | GBM | 1 |
| p.E95X | UCS | 1 |
| p.A89V | UCEC | 1 |
| p.R153G | SKCM | 1 |
| p.E109* | UCEC | 1 |
| p.W253C | HNSC | 1 |
| p.S149P | COAD | 1 |
| p.R44G | LIHC | 1 |
| p.L82P | STAD | 1 |
| p.D75N | BLCA | 1 |
| Top |
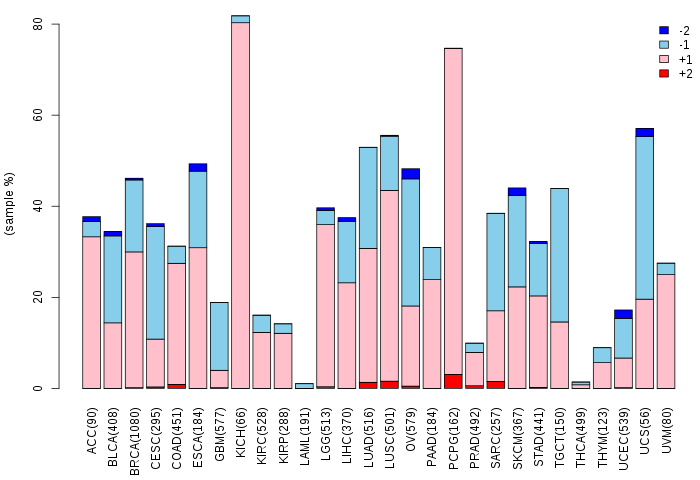
| TissGeneCNV for ING2 |
| Copy number variations of TissGene across 28 cancer types (X-axis: cancer type and Y-axis: % of CNV samples) (TCGA Gistic2_CopyNumber_Gistic2_all_data_by_genes, Gistic2 copy number data, version 2016-08-16) |
 |
| Top |
| TissGeneFusions for ING2 |
| Fusion genes including TissGene (ChimerDB 3.0, 2016-12-01 and TCGA fusion Portal 2015-12-01) |
| Database | Src | Cancer type | Sample | Fusion gene | ORF | 5'-gene BP | 3'-gene BP |
| Chimerdb3.0 | ChiTaRs | NA | AI745293 | ING2-ING2 | chr4:184431456 | chr4:184431767 |
| Top |
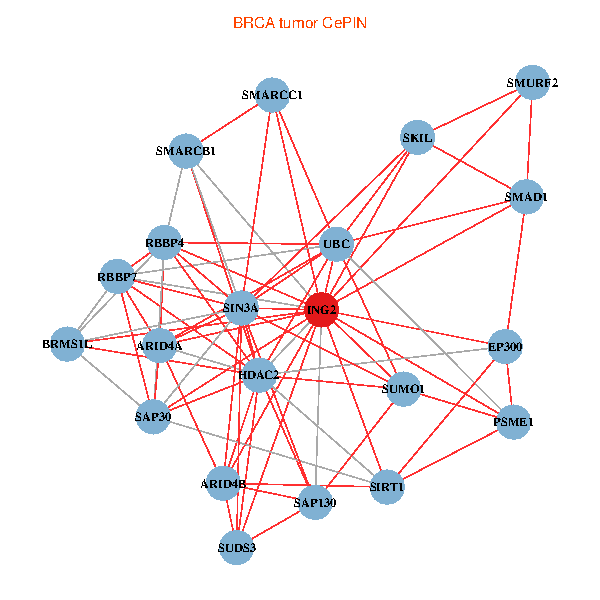
| TissGeneNet for ING2 |
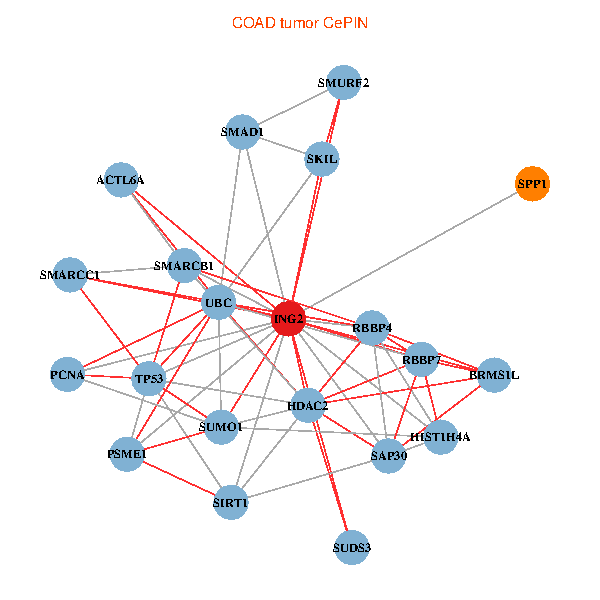
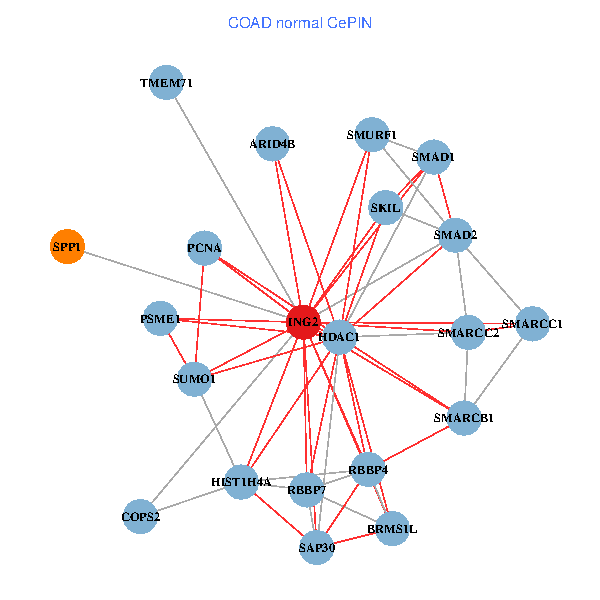
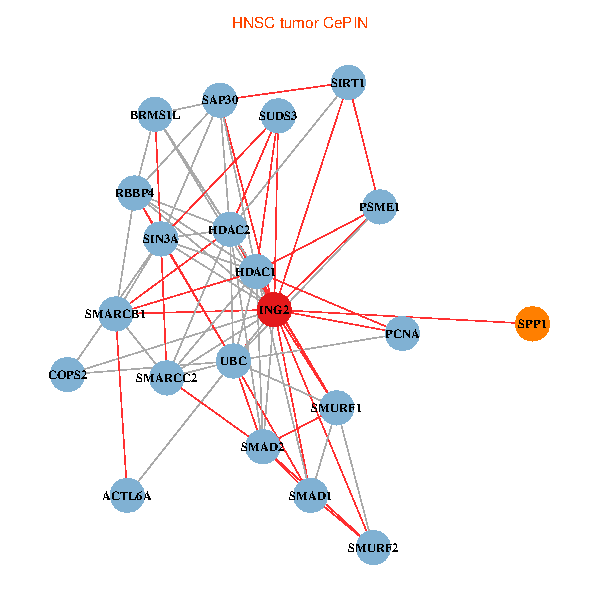
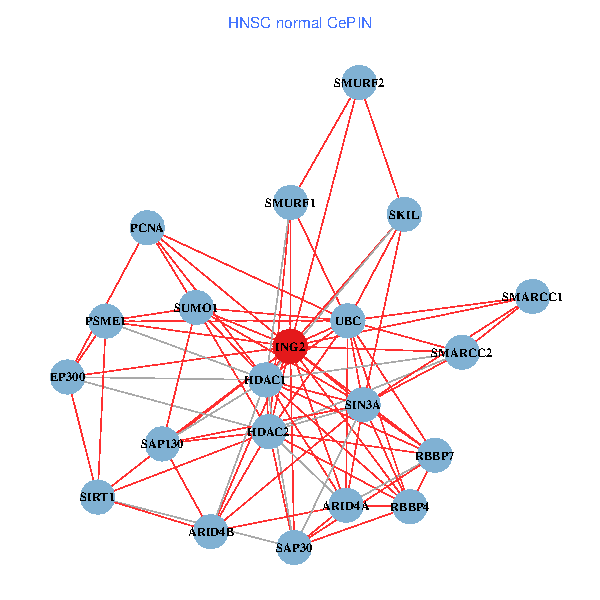
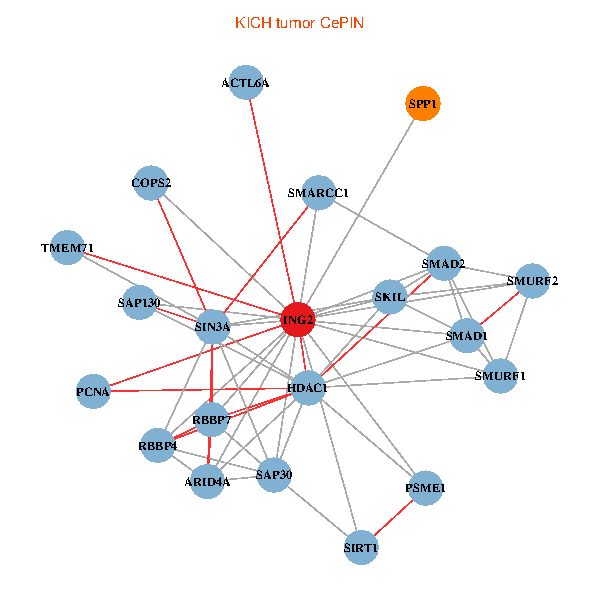
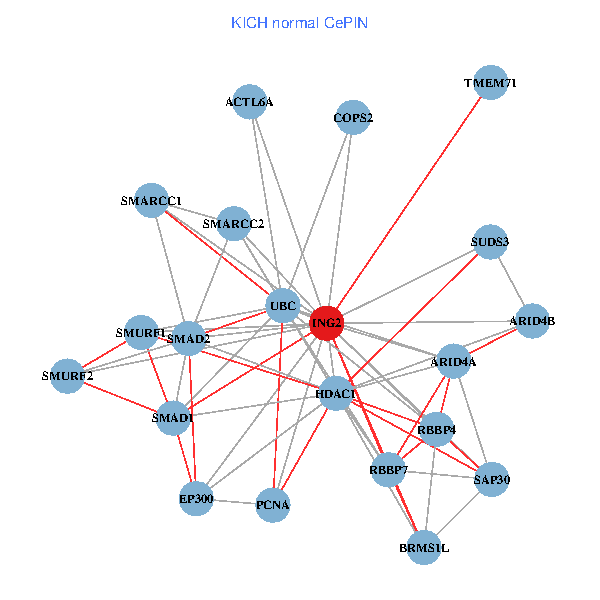
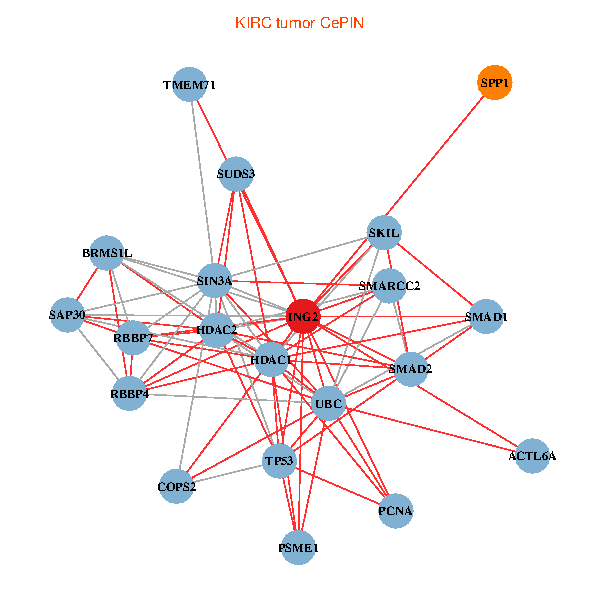
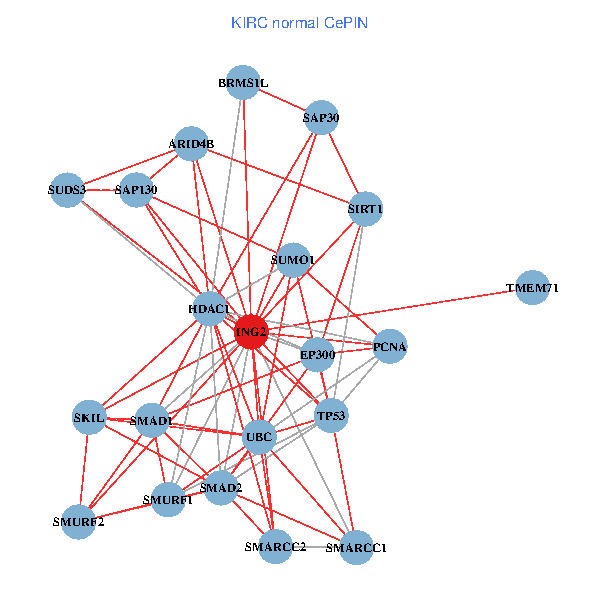
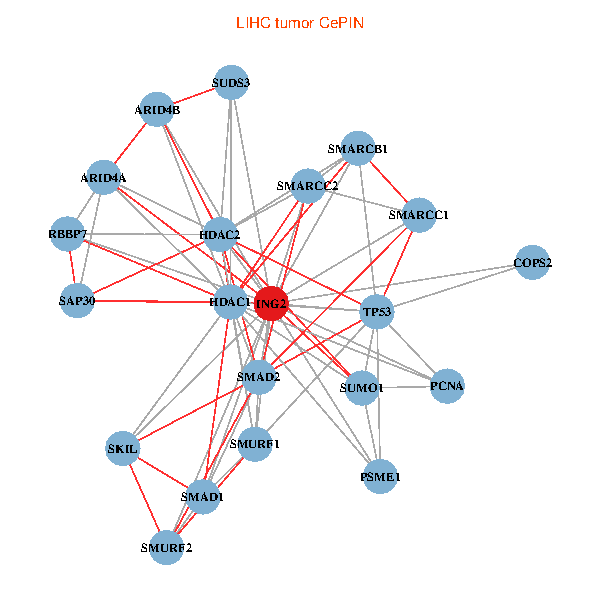
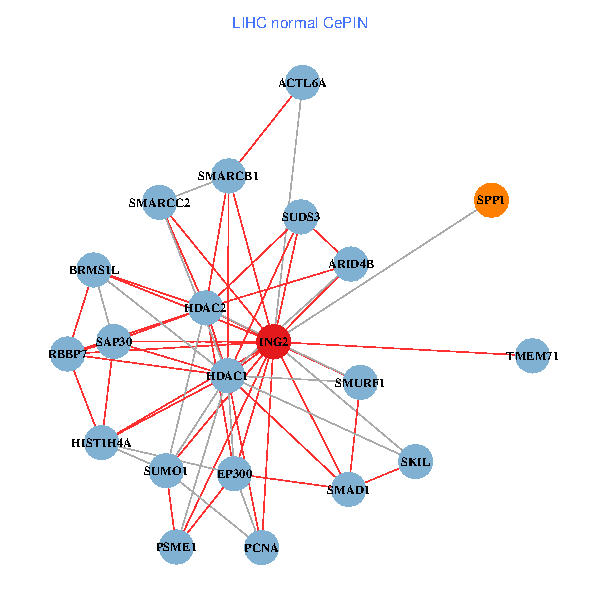
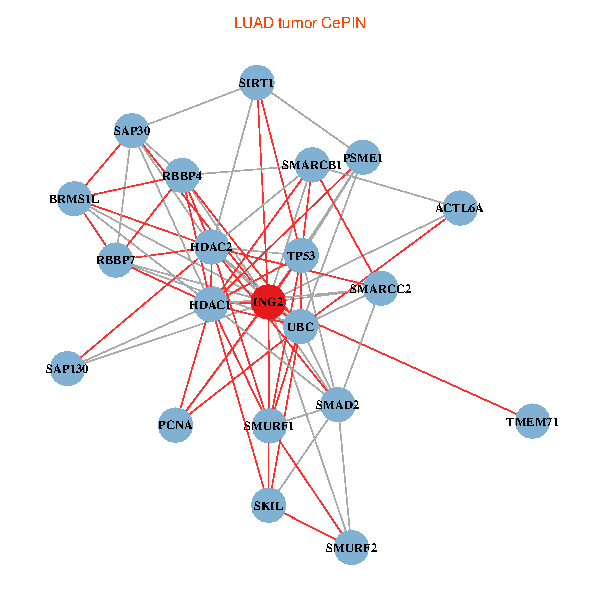
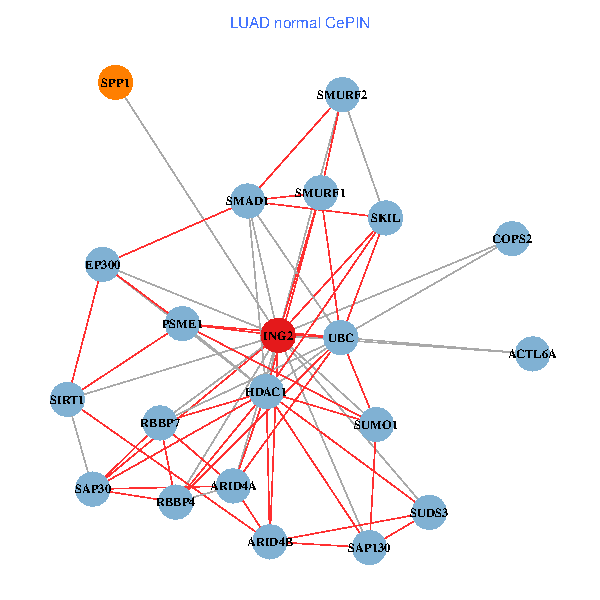
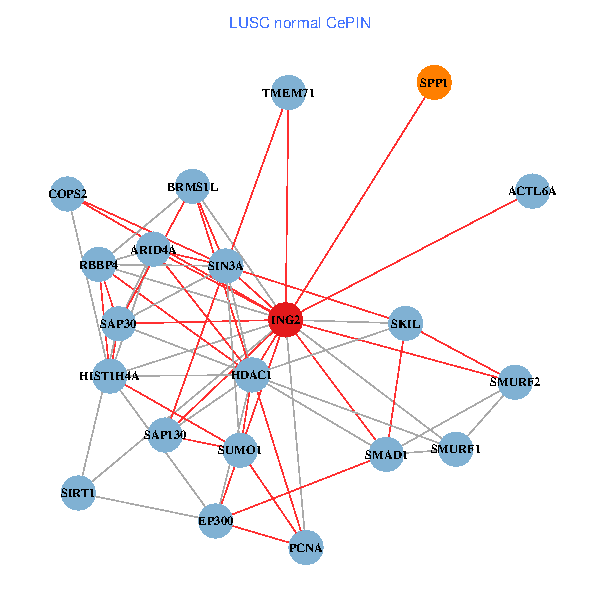
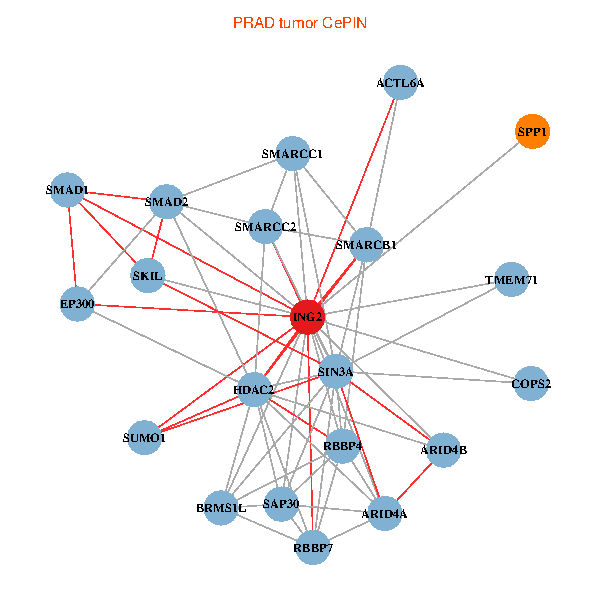
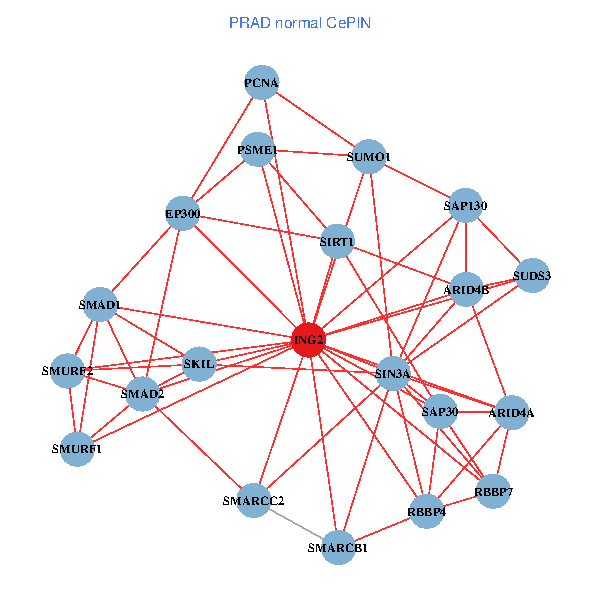
| Co-expressed gene networks based on protein-protein interaction data (CePIN) (TCGA IlluminaHiSeq_RNASeqV2, pan-cancer normalized log2(norm_counts+1) data, version 2016-08-16) (PINA2 ppi data) |
| BRCA (tumor) | BRCA (normal) |
| ING2, UBC, SMAD1, HDAC2, SUMO1, SMARCB1, SMURF2, RBBP7, EP300, SIRT1, RBBP4, ARID4A, SIN3A, PSME1, SAP30, SKIL, SMARCC1, SAP130, BRMS1L, SUDS3, ARID4B (tumor) | ING2, UBC, SPP1, HDAC2, SUMO1, HIST1H4A, SMURF2, RBBP7, EP300, SMURF1, SMARCC2, PCNA, ACTL6A, PSME1, SAP30, SKIL, SMARCC1, SAP130, BRMS1L, ARID4B, TMEM71 (normal) |
 |  |
| COAD (tumor) | COAD (normal) |
| ING2, TP53, UBC, SPP1, SMAD1, HDAC2, SUMO1, HIST1H4A, SMARCB1, SMURF2, RBBP7, SIRT1, RBBP4, PCNA, ACTL6A, PSME1, SAP30, SKIL, SMARCC1, BRMS1L, SUDS3 (tumor) | ING2, SPP1, SMAD1, HDAC1, SUMO1, SMAD2, HIST1H4A, SMARCB1, RBBP7, SMURF1, SMARCC2, RBBP4, PCNA, COPS2, PSME1, SAP30, SKIL, SMARCC1, BRMS1L, ARID4B, TMEM71 (normal) |
 |  |
| HNSC (tumor) | HNSC (normal) |
| ING2, UBC, SPP1, SMAD1, HDAC2, HDAC1, SMAD2, SMARCB1, SMURF2, SMURF1, SMARCC2, SIRT1, RBBP4, PCNA, ACTL6A, SIN3A, COPS2, PSME1, SAP30, BRMS1L, SUDS3 (tumor) | ING2, UBC, HDAC2, HDAC1, SUMO1, SMURF2, RBBP7, EP300, SMURF1, SMARCC2, SIRT1, RBBP4, PCNA, ARID4A, SIN3A, PSME1, SAP30, SKIL, SMARCC1, SAP130, ARID4B (normal) |
 |  |
| KICH (tumor) | KICH (normal) |
| ING2, SPP1, SMAD1, HDAC1, SMAD2, SMURF2, RBBP7, SMURF1, SIRT1, RBBP4, PCNA, ARID4A, ACTL6A, SIN3A, COPS2, PSME1, SAP30, SKIL, SMARCC1, SAP130, TMEM71 (tumor) | ING2, UBC, SMAD1, HDAC1, SMAD2, SMURF2, RBBP7, EP300, SMURF1, SMARCC2, RBBP4, PCNA, ARID4A, ACTL6A, COPS2, SAP30, SMARCC1, BRMS1L, SUDS3, ARID4B, TMEM71 (normal) |
 |  |
| KIRC (tumor) | KIRC (normal) |
| ING2, TP53, UBC, SPP1, SMAD1, HDAC2, HDAC1, SMAD2, RBBP7, SMARCC2, RBBP4, PCNA, ACTL6A, SIN3A, COPS2, PSME1, SAP30, SKIL, BRMS1L, SUDS3, TMEM71 (tumor) | ING2, TP53, UBC, SMAD1, HDAC1, SUMO1, SMAD2, SMURF2, EP300, SMURF1, SMARCC2, SIRT1, PCNA, SAP30, SKIL, SMARCC1, SAP130, BRMS1L, SUDS3, ARID4B, TMEM71 (normal) |
 |  |
| KIRP (tumor) | KIRP (normal) |
| ING2, TP53, UBC, SPP1, SMAD1, HDAC1, SUMO1, EP300, SMARCC2, SIRT1, RBBP4, PCNA, ACTL6A, SIN3A, COPS2, SKIL, SMARCC1, SAP130, BRMS1L, SUDS3, TMEM71 (tumor) | ING2, TP53, UBC, SPP1, SMAD1, HDAC2, SUMO1, SMARCB1, RBBP7, EP300, SMARCC2, SIRT1, ARID4A, SIN3A, PSME1, SAP30, SKIL, BRMS1L, SUDS3, ARID4B, TMEM71 (normal) |
 |  |
| LIHC (tumor) | LIHC (normal) |
| ING2, TP53, SMAD1, HDAC2, HDAC1, SUMO1, SMAD2, SMARCB1, SMURF2, RBBP7, SMURF1, SMARCC2, PCNA, ARID4A, COPS2, PSME1, SAP30, SKIL, SMARCC1, SUDS3, ARID4B (tumor) | ING2, SPP1, SMAD1, HDAC2, HDAC1, SUMO1, HIST1H4A, SMARCB1, RBBP7, EP300, SMURF1, SMARCC2, PCNA, ACTL6A, PSME1, SAP30, SKIL, BRMS1L, SUDS3, ARID4B, TMEM71 (normal) |
 |  |
| LUAD (tumor) | LUAD (normal) |
| ING2, TP53, UBC, HDAC2, HDAC1, SMAD2, SMARCB1, SMURF2, RBBP7, SMURF1, SMARCC2, SIRT1, RBBP4, PCNA, ACTL6A, PSME1, SAP30, SKIL, SAP130, BRMS1L, TMEM71 (tumor) | ING2, UBC, SPP1, SMAD1, HDAC1, SUMO1, SMURF2, RBBP7, EP300, SMURF1, SIRT1, RBBP4, ARID4A, ACTL6A, COPS2, PSME1, SAP30, SKIL, SAP130, SUDS3, ARID4B (normal) |
 |  |
| LUSC (tumor) | LUSC (normal) |
| ING2, TP53, UBC, SMAD1, HDAC2, HDAC1, SMAD2, SMARCB1, RBBP7, SMURF1, SMARCC2, RBBP4, PCNA, ACTL6A, SIN3A, PSME1, SAP30, SMARCC1, BRMS1L, SUDS3, ARID4B (tumor) | ING2, SPP1, SMAD1, HDAC1, SUMO1, HIST1H4A, SMURF2, EP300, SMURF1, SIRT1, RBBP4, PCNA, ARID4A, ACTL6A, SIN3A, COPS2, SAP30, SKIL, SAP130, BRMS1L, TMEM71 (normal) |
 |  |
| PRAD (tumor) | PRAD (normal) |
| ING2, SPP1, SMAD1, HDAC2, SUMO1, SMAD2, SMARCB1, RBBP7, EP300, SMARCC2, RBBP4, ARID4A, ACTL6A, SIN3A, COPS2, SAP30, SKIL, SMARCC1, BRMS1L, ARID4B, TMEM71 (tumor) | ING2, SMAD1, SUMO1, SMAD2, SMARCB1, SMURF2, RBBP7, EP300, SMURF1, SMARCC2, SIRT1, RBBP4, PCNA, ARID4A, SIN3A, PSME1, SAP30, SKIL, SAP130, SUDS3, ARID4B (normal) |
 |  |
| STAD (tumor) | STAD (normal) |
| ING2, SPP1, SMAD1, HDAC2, HDAC1, SUMO1, SMAD2, HIST1H4A, SMARCB1, SMURF2, RBBP7, SMURF1, SIRT1, RBBP4, ARID4A, ACTL6A, SIN3A, COPS2, PSME1, SAP30, TMEM71 (tumor) | ING2, TP53, SPP1, SMAD1, HDAC2, HDAC1, SUMO1, SMAD2, SMARCB1, SMURF2, EP300, SMARCC2, RBBP4, PCNA, ACTL6A, SIN3A, COPS2, PSME1, SAP30, SKIL, SAP130 (normal) |
 |  |
| THCA (tumor) | THCA (normal) |
| ING2, TP53, UBC, SMAD1, HDAC2, SUMO1, SMAD2, HIST1H4A, SMARCB1, RBBP7, EP300, SMARCC2, RBBP4, ARID4A, SIN3A, COPS2, SAP30, SMARCC1, SAP130, SUDS3, ARID4B (tumor) | ING2, TP53, UBC, SMAD1, HDAC2, HDAC1, SUMO1, SMAD2, SMURF2, RBBP7, EP300, SMURF1, SMARCC2, ARID4A, COPS2, PSME1, SAP30, SKIL, SMARCC1, SAP130, ARID4B (normal) |
 |  |
| Top |
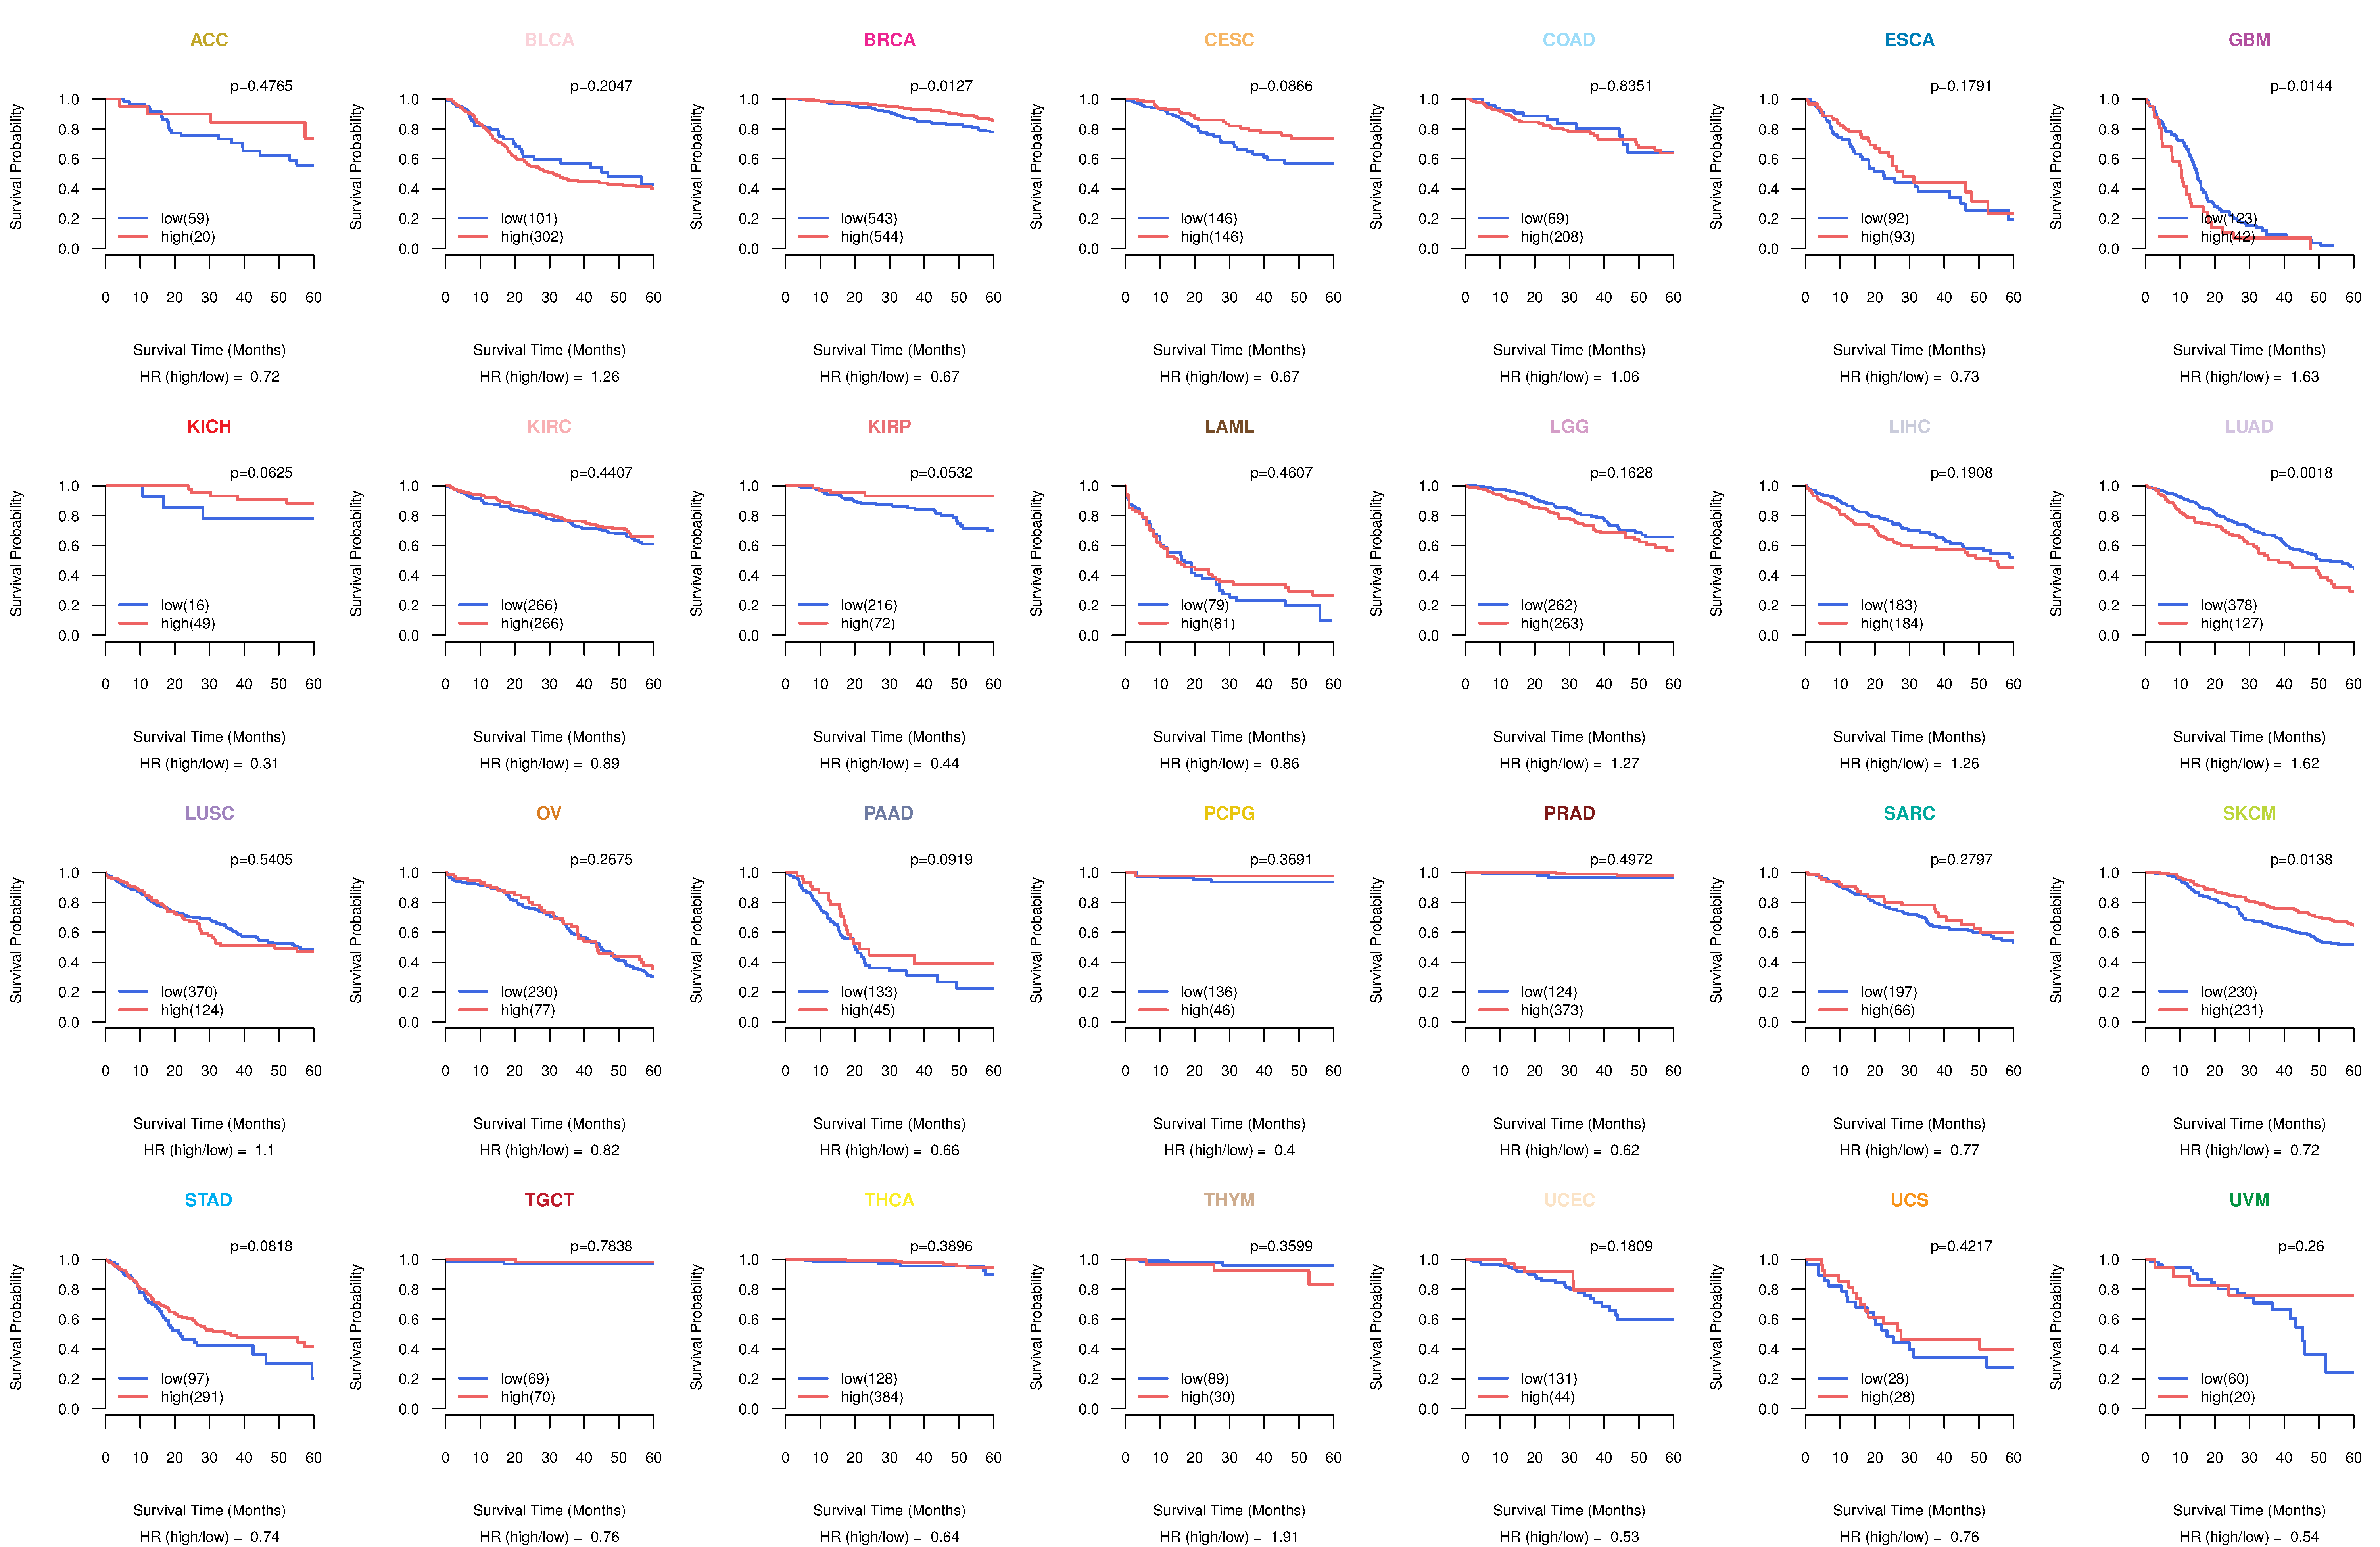
| TissGeneProg for ING2 |
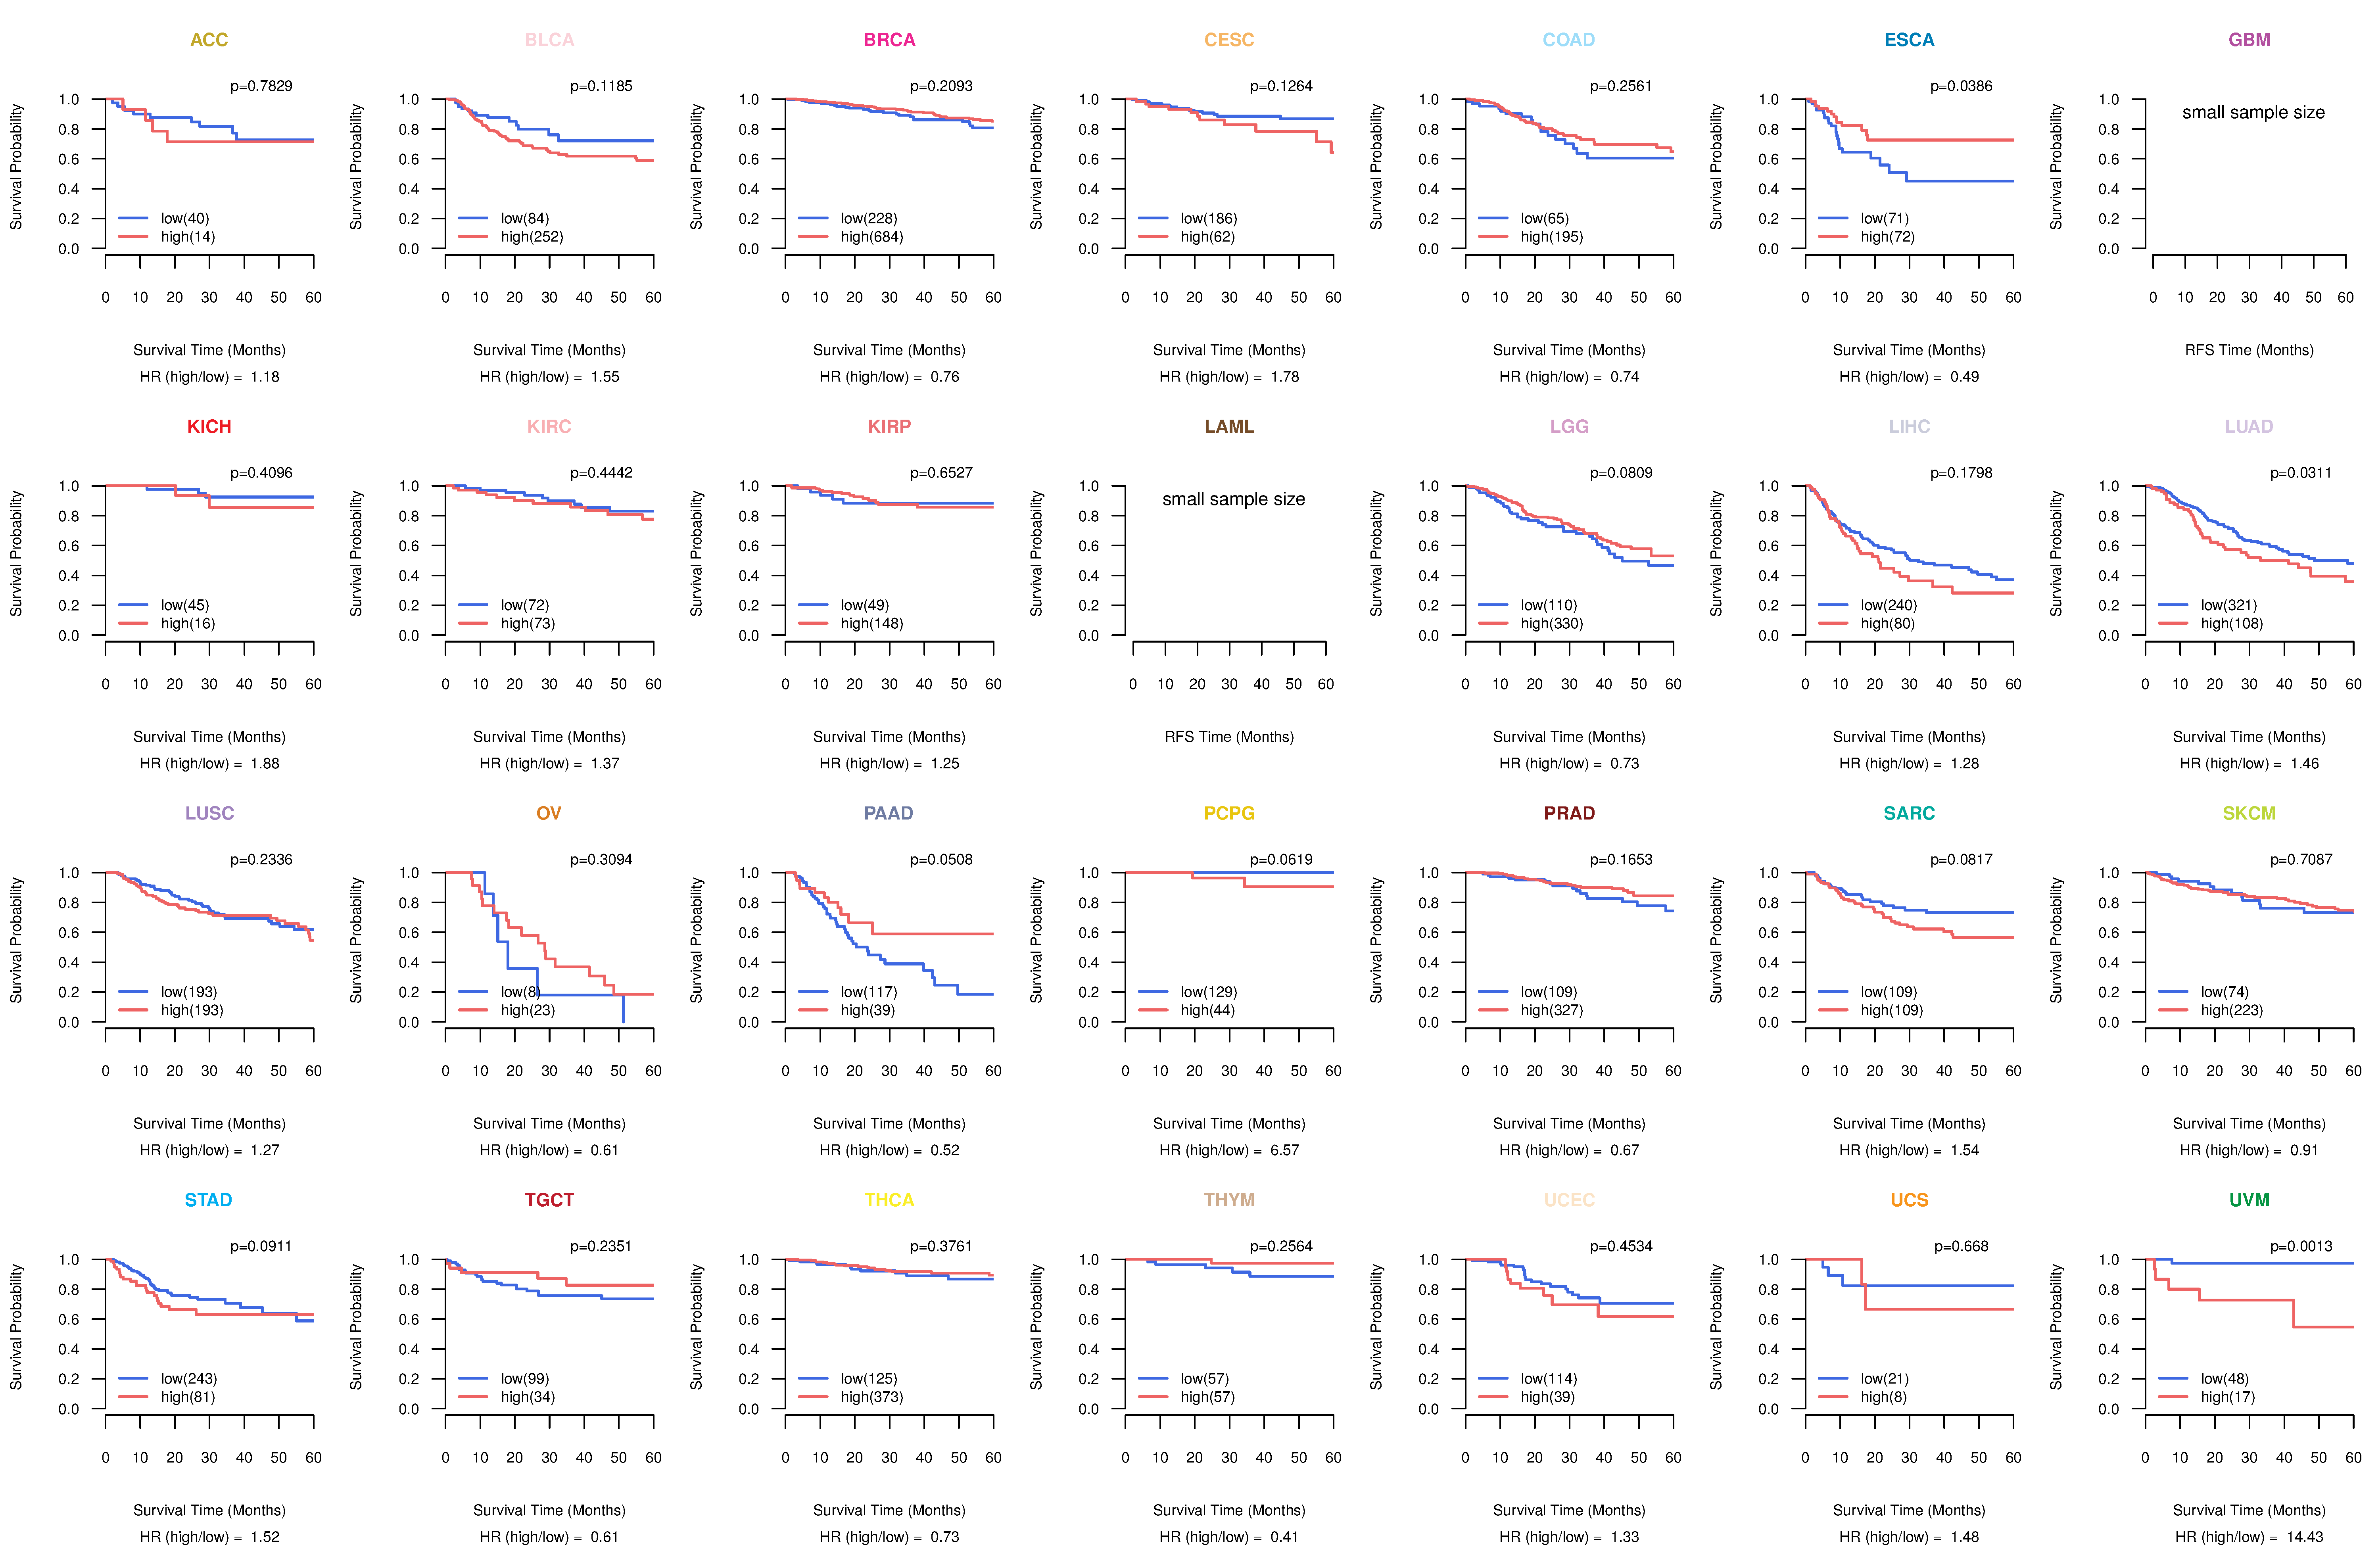
| Kaplan-Meier plots with logrank tests of overall survival (OS) using 28 cancer types (TCGA IlluminaHiSeq_RNASeqV2, pan-cancer normalized log2(norm_counts+1) data, version 2016-08-16) (TCGA clinicalMatrix, phenotype data, version 2016-04-27) * Click on the image to enlarge it in a new window. |
 |
| Kaplan-Meier plots with logrank test of relapse free survival (RFS) using 28 cancer types (TCGA IlluminaHiSeq_RNASeqV2, pan-cancer normalized log2(norm_counts+1) data, version 2016-08-16) (TCGA clinicalMatrix, phenotype data, version 2016-04-27) * Click on the image enlarge it in a new window. |
 |
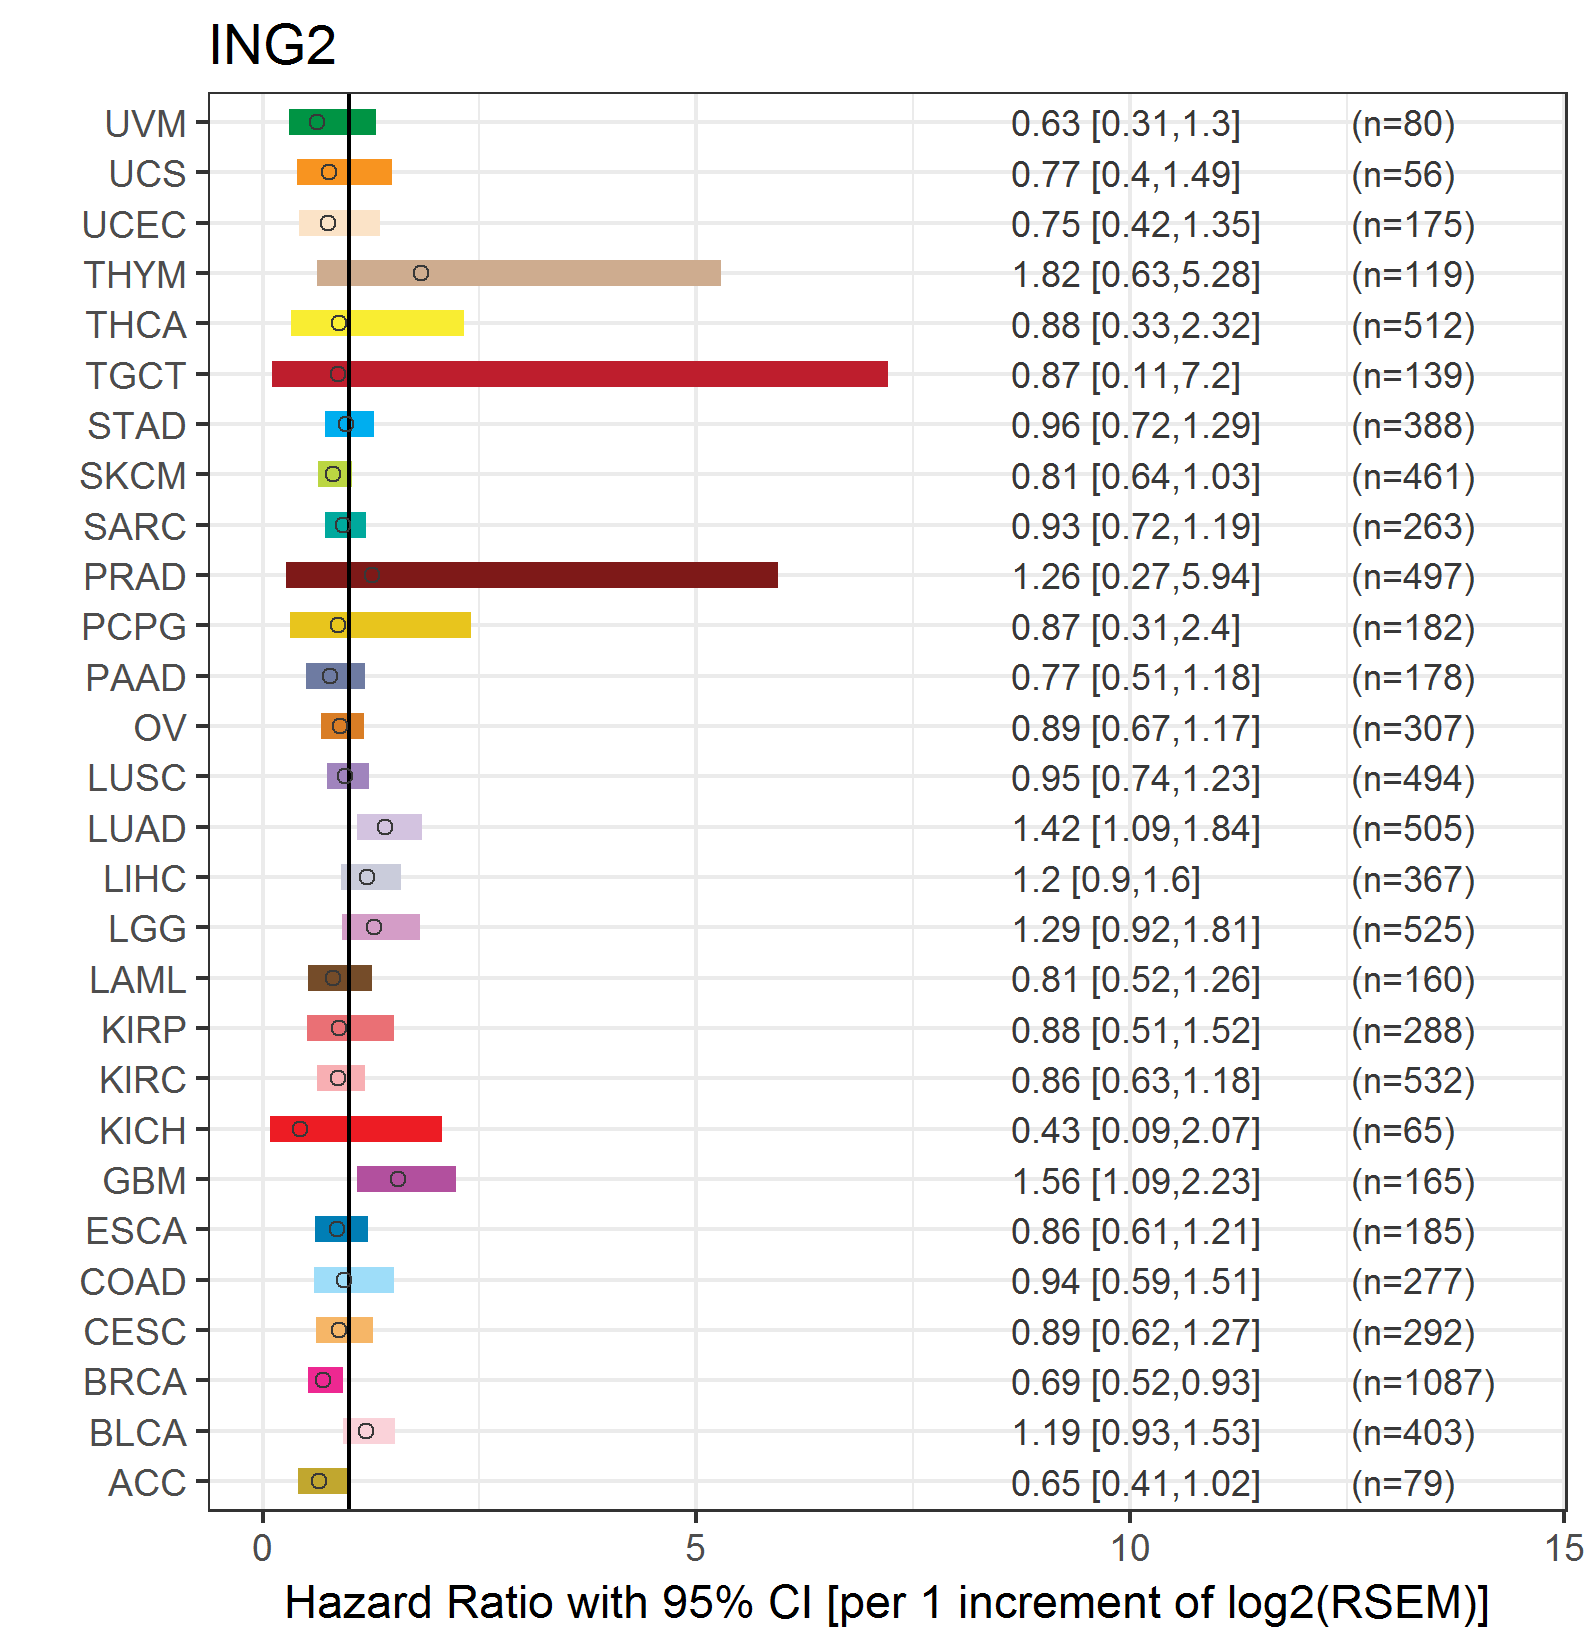
| Forest plot of Cox proportional hazard ratio (HR) and 95% CI of overall survival (OS) using 28 cancer types (TCGA IlluminaHiSeq_RNASeqV2, pan-cancer normalized log2(norm_counts+1) data, version 2016-08-16) (TCGA clinicalMatrix, phenotype data, version 2016-04-27) * Click on the image enlarge it in a new window. |
 |
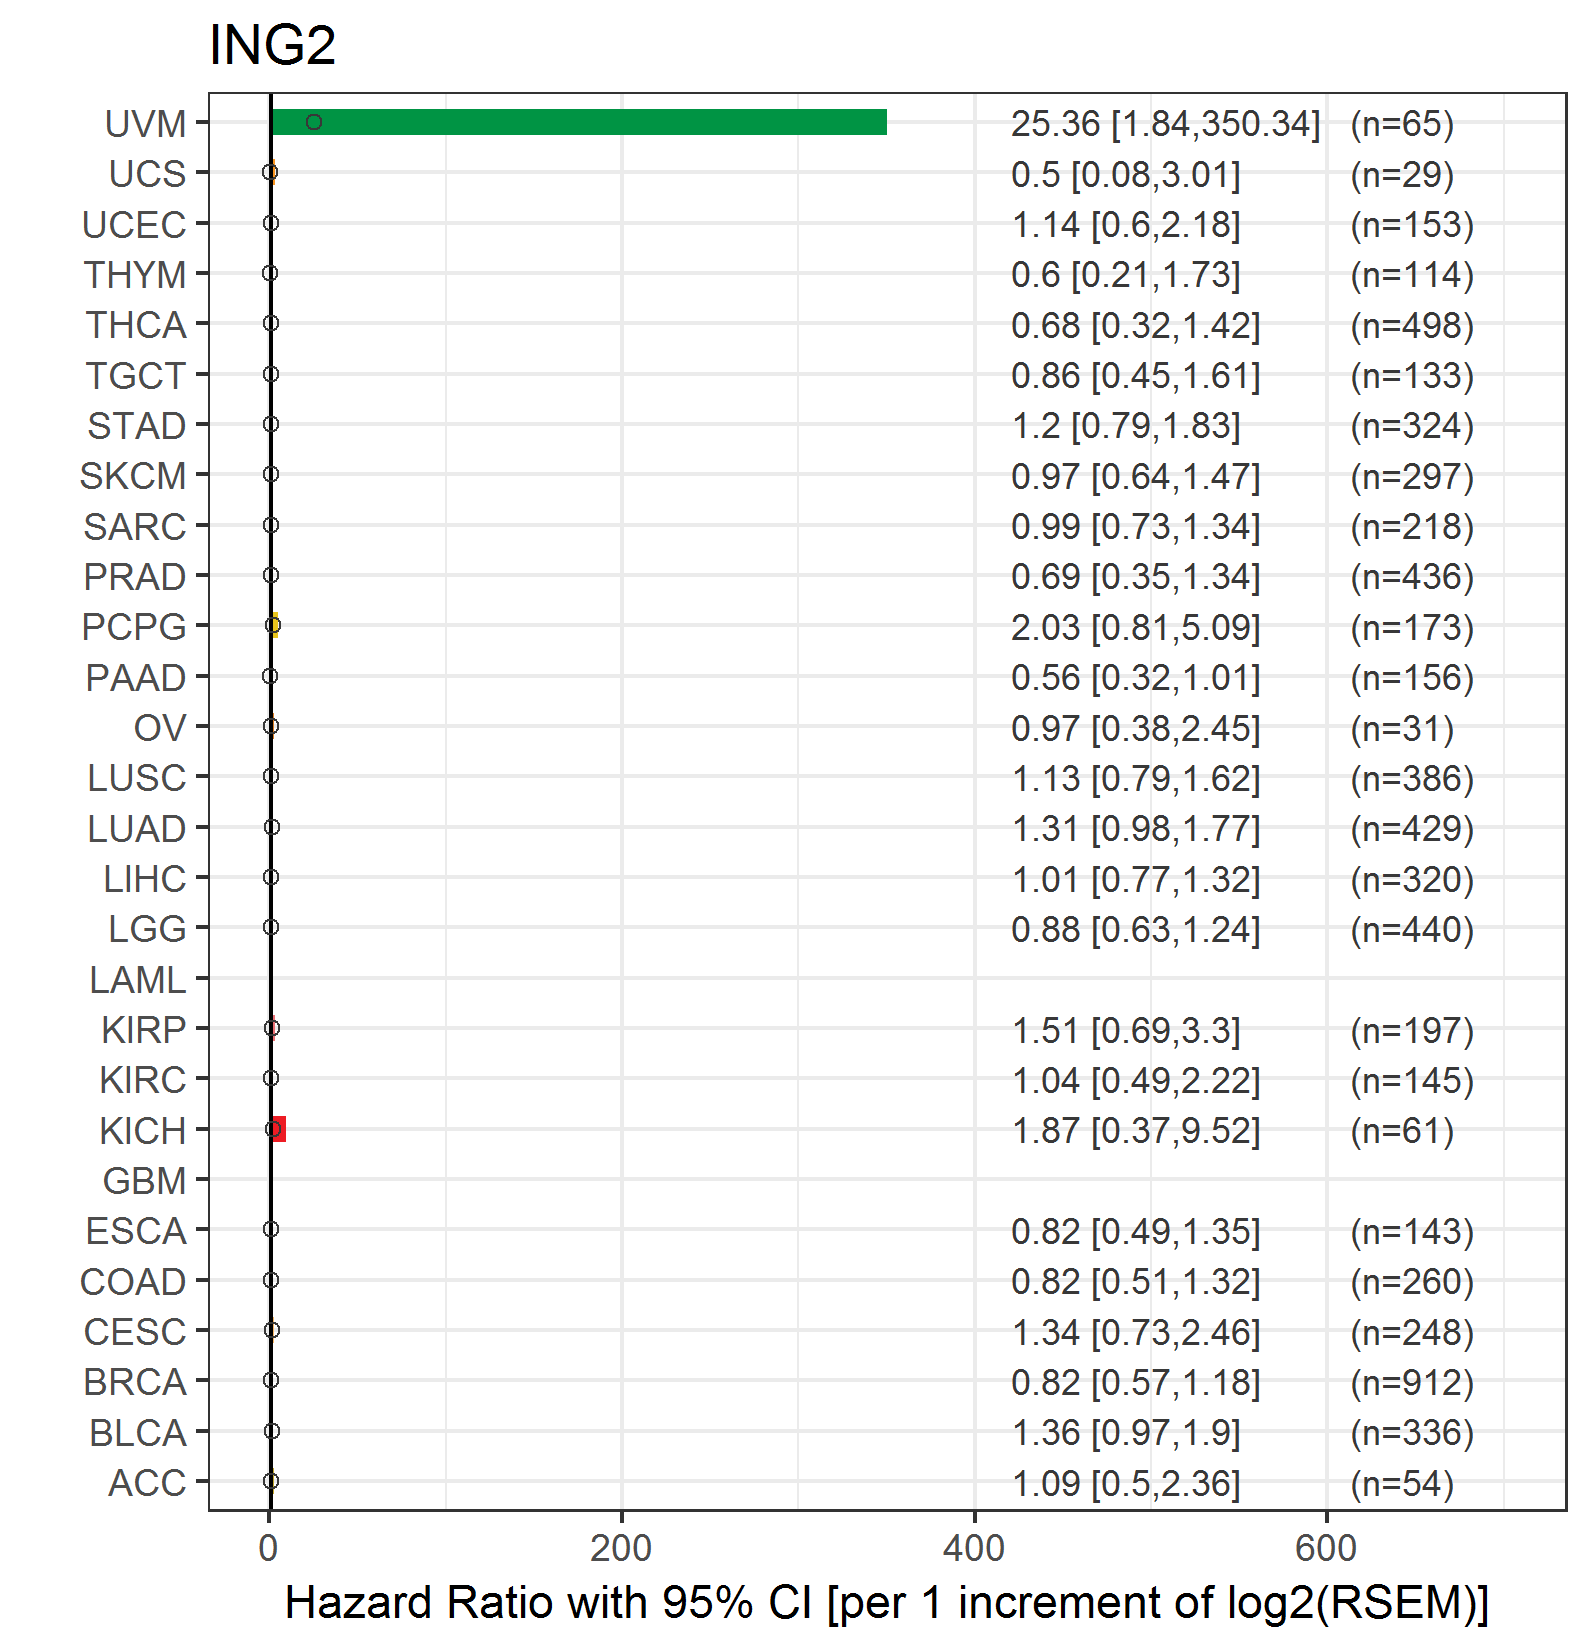
| Forest plot of Cox proportional hazard ratio (HR) and 95% CI of relapse free survival (RFS) using 28 cancer types (TCGA IlluminaHiSeq_RNASeqV2, pan-cancer normalized log2(norm_counts+1) data, version 2016-08-16) (TCGA clinicalMatrix, phenotype data, version 2016-04-27) * Click on the image enlarge it in a new window. |
 |
| Top |
| TissGeneClin for ING2 |
| TissGeneDrug for ING2 |
| Drug information targeting TissGene (DrugBank Version 5.0.6, 2017-04-01) |
| DrugBank ID | Drug name | Drug activity | Drug type | Drug status |
| Top |
| TissGeneDisease for ING2 |
| Disease information associated with TissGene (DisGeNet, 2016-06-01) |
| Disease ID | Disease name | # pubmeds | Source |
| umls:C0596263 | Carcinogenesis | 5 | BeFree |
| umls:C0006142 | Malignant neoplasm of breast | 3 | BeFree |
| umls:C0001418 | Adenocarcinoma | 2 | BeFree |
| umls:C0007131 | Non-Small Cell Lung Carcinoma | 2 | BeFree |
| umls:C0007137 | Squamous cell carcinoma | 2 | BeFree |
| umls:C0009402 | Colorectal Carcinoma | 2 | BeFree |
| umls:C0025202 | melanoma | 2 | BeFree,LHGDN |
| umls:C0678222 | Breast Carcinoma | 2 | BeFree |
| umls:C1261473 | Sarcoma | 2 | BeFree |
| umls:C1527249 | Colorectal Cancer | 2 | BeFree |
| umls:C2239176 | Liver carcinoma | 2 | BeFree,LHGDN |
| umls:C0000768 | Congenital Abnormality | 1 | BeFree |
| umls:C0005684 | Malignant neoplasm of urinary bladder | 1 | BeFree |
| umls:C0013295 | Duodenal Ulcer | 1 | BeFree |
| umls:C0013403 | Dysplastic Nevus Syndrome | 1 | LHGDN |
| umls:C0017638 | Glioma | 1 | BeFree |
| umls:C0019693 | HIV Infections | 1 | BeFree |
| umls:C0024121 | Lung Neoplasms | 1 | LHGDN |
| umls:C0024299 | Lymphoma | 1 | BeFree |
| umls:C0024623 | Malignant neoplasm of stomach | 1 | BeFree |
| umls:C0025286 | Meningioma | 1 | BeFree |
| umls:C0027819 | Neuroblastoma | 1 | BeFree |
| umls:C0029463 | Osteosarcoma | 1 | BeFree |
| umls:C0085695 | Chronic gastritis | 1 | BeFree |
| umls:C0153633 | Malignant neoplasm of brain | 1 | BeFree |
| umls:C0178874 | Tumor Progression | 1 | BeFree |
| umls:C0267187 | Intestinal metaplasia of gastric mucosa | 1 | BeFree |
| umls:C0520933 | Abnormal spermatogenesis | 1 | BeFree |
| umls:C0585442 | Osteosarcoma of bone | 1 | BeFree |
| umls:C0699791 | Stomach Carcinoma | 1 | BeFree |
| umls:C0699885 | Carcinoma of bladder | 1 | BeFree |
| umls:C0700095 | Central neuroblastoma | 1 | BeFree |
| umls:C1168401 | Squamous cell carcinoma of the head and neck | 1 | BeFree |
| umls:C1384583 | Congenital absence of germinal epithelium of testes | 1 | BeFree |
| umls:C1512409 | Hepatocarcinogenesis | 1 | BeFree |
| umls:C1516170 | Cancer Cell Growth | 1 | BeFree |
| umls:C3811653 | Experimental Organism Basal Cell Carcinoma | 1 | BeFree |
|
Copyright 2016-Present - The University of Texas Health Science Center at Houston (UTHealth) Web File Viewing | How to Report, Fraud, Waste and Abuse | State of Texas | Statewide Search | Texas Homeland Security | Site Policies |