 |
| |
| |
| |
| |
| |
| |
|

| TissGeneSummary for SLC38A4 |
 Gene summary Gene summary |
| Basic gene information | Gene symbol | SLC38A4 |
| Gene name | solute carrier family 38, member 4 | |
| Synonyms | ATA3|NAT3|PAAT|SNAT4 | |
| Cytomap | UCSC genome browser: 12q13 | |
| Type of gene | protein-coding | |
| RefGenes | NM_001143824.1, NM_018018.4, | |
| Description | N amino acid transporter 3Na(+)-coupled neutral amino acid transporter 4amino acid transporter A3amino acid transporter system A3sodium-coupled neutral amino acid transporter 4system A amino acid transporter 3system N amino acid transporter 3 | |
| Modification date | 20141210 | |
| dbXrefs | MIM : 608065 | |
| HGNC : HGNC | ||
| Ensembl : ENSG00000139209 | ||
| HPRD : 12159 | ||
| Vega : OTTHUMG00000169518 | ||
| Protein | UniProt: go to UniProt's Cross Reference DB Table | |
| Expression | CleanEX: HS_SLC38A4 | |
| BioGPS: 55089 | ||
| Pathway | NCI Pathway Interaction Database: SLC38A4 | |
| KEGG: SLC38A4 | ||
| REACTOME: SLC38A4 | ||
| Pathway Commons: SLC38A4 | ||
| Context | iHOP: SLC38A4 | |
| ligand binding site mutation search in PubMed: SLC38A4 | ||
| UCL Cancer Institute: SLC38A4 | ||
| Assigned class in TissGDB* | B | |
| Included tissue-specific gene expression resources | HPA,TiGER,GTEx | |
| Specific-tissues in normal samples (assigned by TissGDB using HPA, TiGER, and GTEx) | Liver | |
| Cancer types related to the specific-tissues in cancer samples (assigned by TissGDB using TCGA) | LIHC | |
| Reference showing the relevant tissue of SLC38A4 | ||
| Description by TissGene annotations | Significant down-regulated DEG Have significant anti-correlated miRNA TissgsKTS CNV lost TissGeneKTS | |
| * Class A consists of genes with literature evidence and is part of the cTissGenes. Class B consists of only cTissGenes without additional evidence. The remaining genes belong to Class C. |
| Gene ontology having evidence of Inferred from Direct Assay (IDA) from Entrez |
| GO ID | GO term | PubMed ID |
| Top |
| TissGeneExp for SLC38A4 |
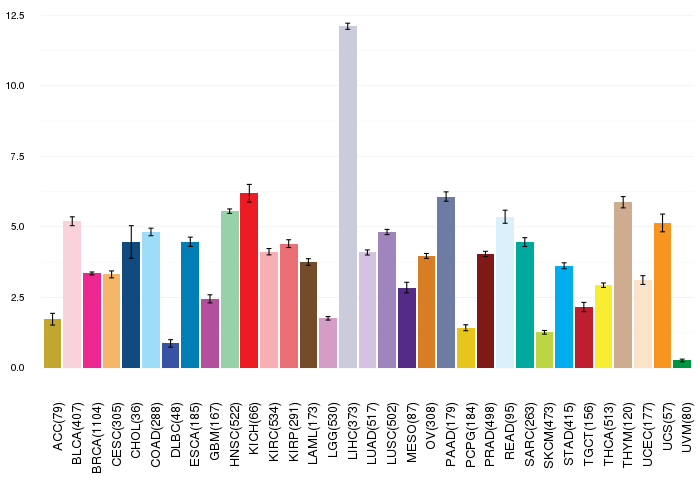
| Gene expressions across 28 cancer types (X-axis: cancer type and Y-axis: log2(norm_counts+1)) (TCGA IlluminaHiSeq_RNASeqV2, pan-cancer normalized log2(norm_counts+1) data, version 2016-08-16) |
 |
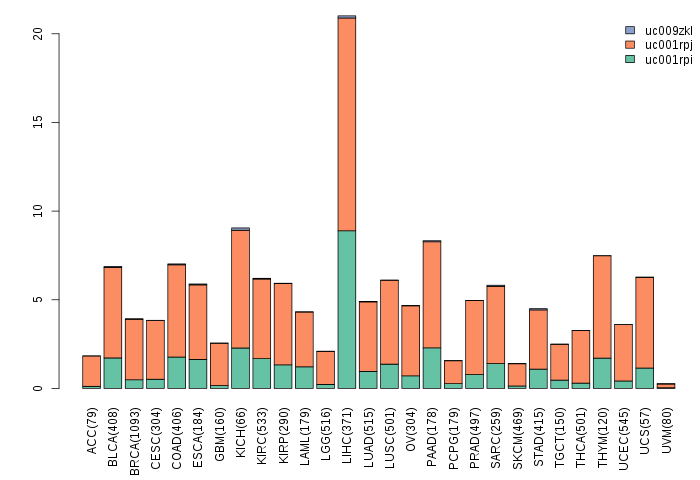
| Gene isoform expressions across 28 cancer types (X-axis: cancer type and Y-axis: log2(norm_counts+1)) (TCGA pan-cancer tcga_rsem_isoform_tpm, version 2016-09-01) |
 |
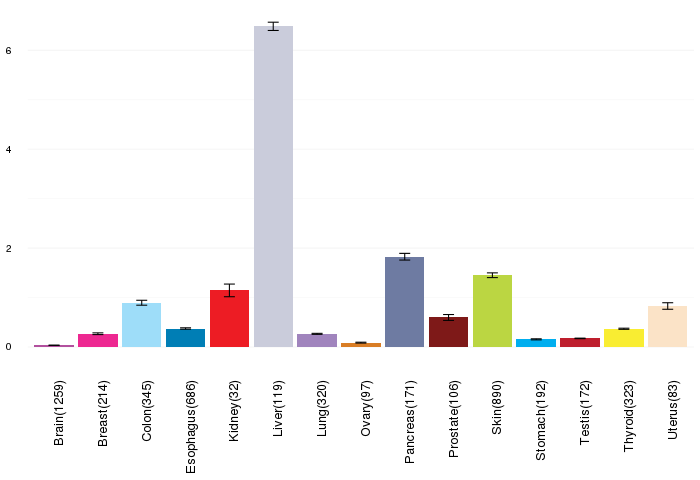
| Gene expressions across normal tissues of GTEx data (GTEx GTEx_Analysis_v6_RNA-seq_RNA-SeQCv1.1.8_gene_rpkm.gct) - Here, we shows the matched tissue types only among our 28 cancer types. |
 |
| Different expressions across 14 cancer types with more than 10 samples between matched tumors and normals (X-axis: cancer type and Y-axis: log2(norm_counts+1)) (TCGA IlluminaHiSeq_RNASeqV2, pan-cancer normalized log2(norm_counts+1) data, version 2016-08-16) |
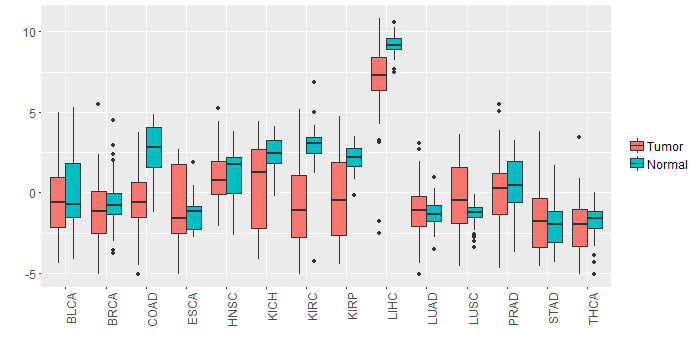 |
| - Significantly differentially expressed cancer types and information. (|Fold change|>1 and FDR<0.05) |
| Cancer type | Mean(exp) in tumor | Mean(exp) in matched normal | Log2FC | P-val. | FDR |
| LIHC | 6.904705974 | 9.204889974 | -2.300184 | 4.96E-08 | 3.75E-07 |
| COAD | -0.597179564 | 2.540451205 | -3.137630769 | 5.20E-07 | 3.11E-06 |
| KIRC | -0.705163859 | 2.922568085 | -3.627731944 | 4.05E-19 | 2.95E-18 |
| KICH | 0.547633974 | 2.430557974 | -1.882924 | 0.00294 | 0.005832367 |
| LUSC | -0.283088614 | -1.312137634 | 1.02904902 | 0.00245 | 0.004293696 |
| KIRP | -0.105864901 | 2.186975724 | -2.292840625 | 0.000166 | 0.000538599 |
| Top |
| TissGene-miRNA for SLC38A4 |
| Significantly anti-correlated miRNAs of TissGene across 28 cancer types (Gene-miRNA relations from TargetScanHuman Relsease 7.1, Conserved_Site_Context_Scores.txt.zip, 06.01.2016) (TCGA IlluminaHiSeq_miRNASeq, log2(RPM+1) data, version 2016-11-21) (TCGA IlluminaHiSeq_RNASeqV2, log2(normalized_count+1) data, version 2016-08-16) (Spearman’s Rank Correlation (p-value<0.05 and coefficient<-0.25)) |
| Cancer type | miRNA id | miRNA accession | P-val. | Coeff. | # samples |
| ACC | hsa-miR-200c-3p | MIMAT0000617 | 0.011 | -0.31 | 78 |
| ACC | hsa-miR-200c-3p | MIMAT0000617 | 0.011 | -0.31 | 78 |
| Top |
| TissGeneMut for SLC38A4 |
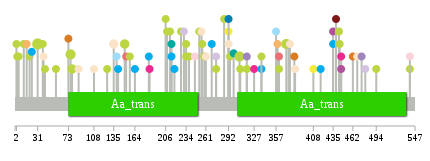
| TissGeneSNV for SLC38A4 |
| nsSNV counts per each loci. Different colors of circles represent different cancer types. Circle size denotes number of samples. (TCGA somatic mutation (SNPs and small INDELs) data, version 2016-04-25) * Click on the image to enlarge it in a new window. |
 |
 |
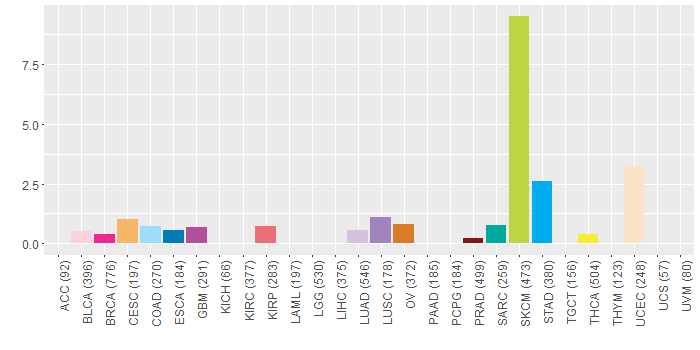
| Somatic nucleotide variants of TissGene across 28 cancer types (X-axis: cancer type and Y-axis: % of mutated samples) The numbers in parentheses are numbers of samples with mutation (nsSNVs). (TCGA somatic mutation (SNPs and small INDELs) data, version 2016-04-25) |
 |
| - nsSNVs sorted by frequency. |
| AAchange | Cancer type | # samples |
| p.G31E | SKCM | 5 |
| p.S76F | SKCM | 3 |
| p.S371F | SKCM | 3 |
| p.H307Y | SKCM | 3 |
| p.G78E | SKCM | 2 |
| p.S135Y | UCEC | 2 |
| p.G150E | SKCM | 2 |
| p.P494S | SKCM | 1 |
| p.Q41R | SKCM | 1 |
| p.F184S | BRCA | 1 |
| p.G374R | HNSC | 1 |
| p.K357E | COAD | 1 |
| p.A383T | UCEC | 1 |
| p.V234M | SKCM | 1 |
| p.D308A | SKCM | 1 |
| p.V468A | UCEC | 1 |
| p.S214L | STAD | 1 |
| p.A183S | STAD | 1 |
| p.P3S | SKCM | 1 |
| p.M286I | SKCM | 1 |
| p.I152F | KIRP | 1 |
| p.P337S | SKCM | 1 |
| p.A87T | UCEC | 1 |
| p.R292H | UCEC | 1 |
| p.E5K | SKCM | 1 |
| p.M38I | SKCM | 1 |
| p.I439M | PRAD | 1 |
| p.R361Q | KIRP | 1 |
| p.E16K | CESC | 1 |
| p.H256Y | SKCM | 1 |
| p.G73R | OV | 1 |
| p.P275R | LUAD | 1 |
| p.I474V | LUSC | 1 |
| p.R435H | GBM | 1 |
| p.D2N | SKCM | 1 |
| p.P252L | SKCM | 1 |
| p.A23D | STAD | 1 |
| p.R361Q | SKCM | 1 |
| p.T231N | LUAD | 1 |
| p.P337A | STAD | 1 |
| p.S39G | UCEC | 1 |
| p.G374R | SKCM | 1 |
| p.L408I | THCA | 1 |
| p.Q246R | BLCA | 1 |
| p.F108C | UCEC | 1 |
| p.G208E | SKCM | 1 |
| p.A462E | OV | 1 |
| p.G479R | LUAD | 1 |
| p.P275L | SKCM | 1 |
| p.M269I | STAD | 1 |
| p.G259E | SKCM | 1 |
| p.S317G | LUSC | 1 |
| p.V327L | BRCA | 1 |
| p.R292H | ESCA | 1 |
| p.S317N | SKCM | 1 |
| p.D540N | SKCM | 1 |
| p.R292H | THCA | 1 |
| p.L261M | UCEC | 1 |
| p.S238I | SKCM | 1 |
| p.E299G | SARC | 1 |
| p.L376R | UCEC | 1 |
| p.P444S | SKCM | 1 |
| p.E12K | SKCM | 1 |
| p.S214L | SARC | 1 |
| p.G56R | SKCM | 1 |
| p.D255N | UCEC | 1 |
| p.E139D | COAD | 1 |
| p.G164E | STAD | 1 |
| p.G20R | SKCM | 1 |
| p.G227R | SKCM | 1 |
| p.D540V | BLCA | 1 |
| p.R446* | BRCA | 1 |
| p.F443Y | SKCM | 1 |
| p.V234E | SKCM | 1 |
| p.A382V | OV | 1 |
| p.R359W | CESC | 1 |
| p.L126F | SKCM | 1 |
| p.L141S | STAD | 1 |
| p.R446* | GBM | 1 |
| p.S206F | SKCM | 1 |
| p.P212Q | SKCM | 1 |
| p.R435C | STAD | 1 |
| p.P294S | SKCM | 1 |
| p.A418T | STAD | 1 |
| p.S157F | SKCM | 1 |
| p.N218S | STAD | 1 |
| Top |
| TissGeneCNV for SLC38A4 |
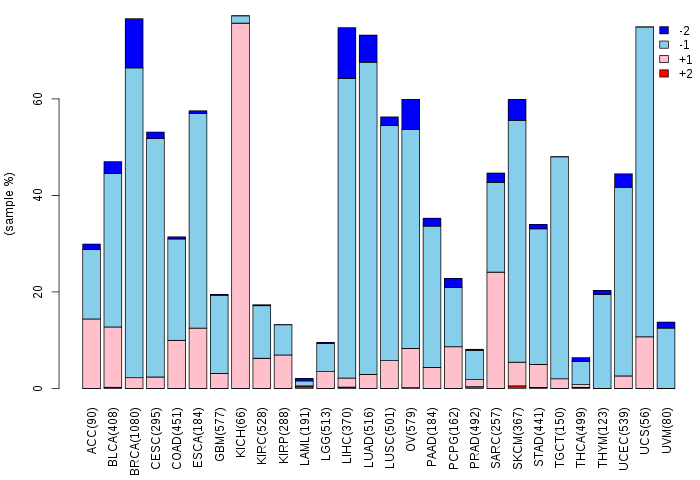
| Copy number variations of TissGene across 28 cancer types (X-axis: cancer type and Y-axis: % of CNV samples) (TCGA Gistic2_CopyNumber_Gistic2_all_data_by_genes, Gistic2 copy number data, version 2016-08-16) |
 |
| Top |
| TissGeneFusions for SLC38A4 |
| Fusion genes including TissGene (ChimerDB 3.0, 2016-12-01 and TCGA fusion Portal 2015-12-01) |
| Database | Src | Cancer type | Sample | Fusion gene | ORF | 5'-gene BP | 3'-gene BP |
| Top |
| TissGeneNet for SLC38A4 |
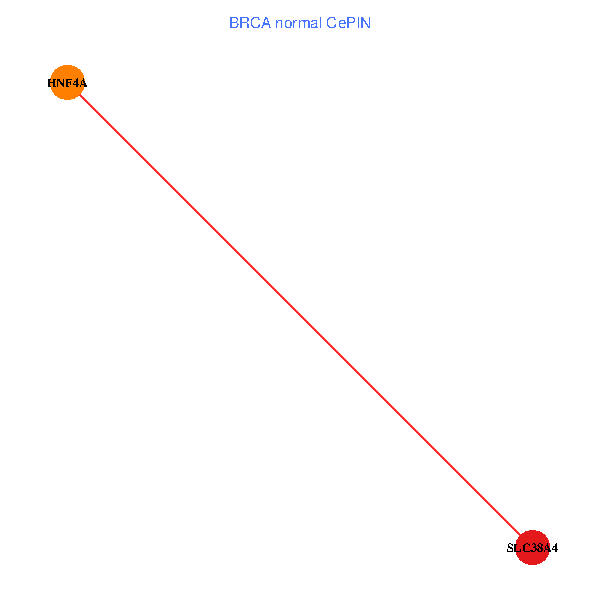
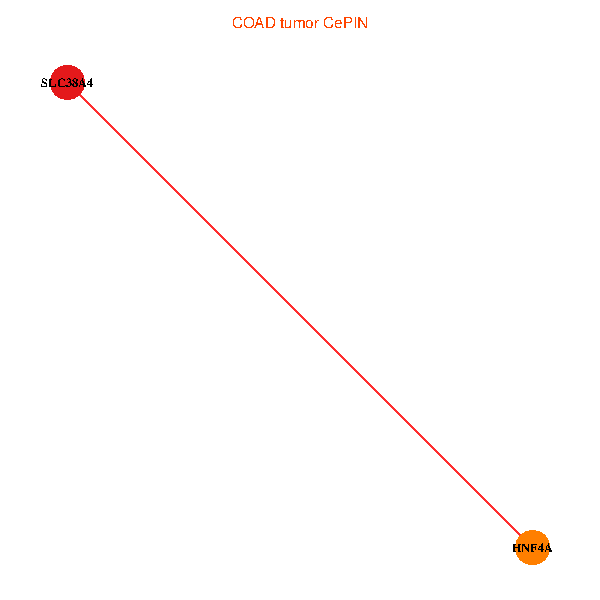
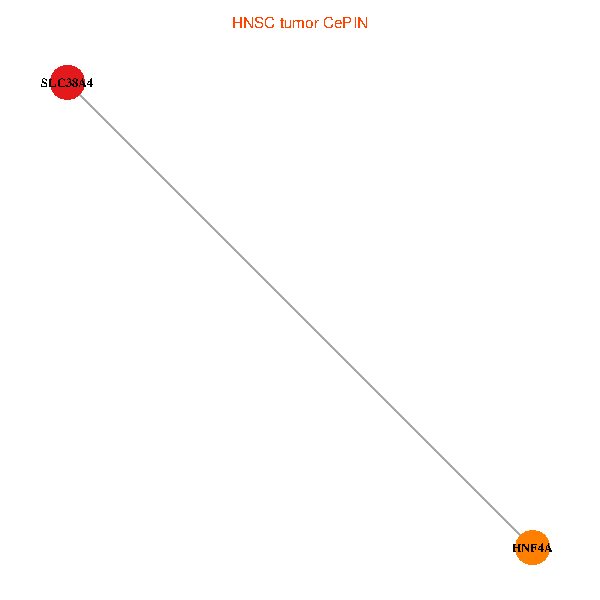
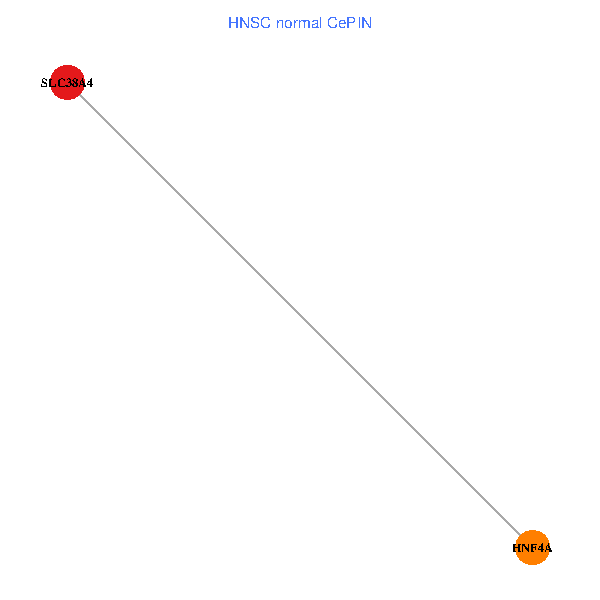
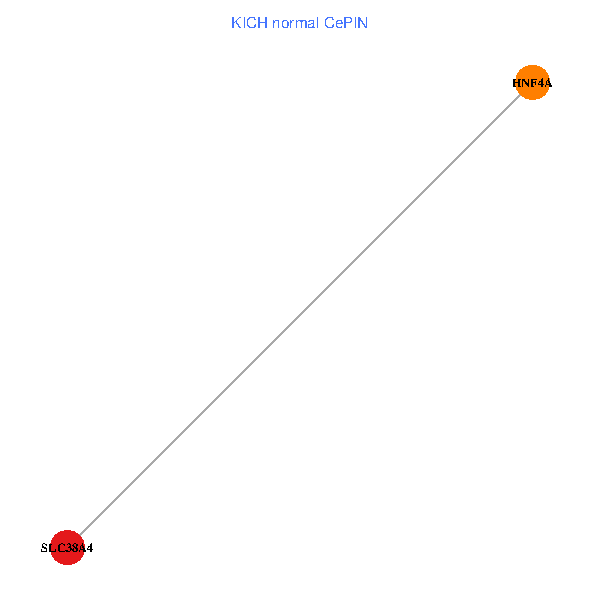
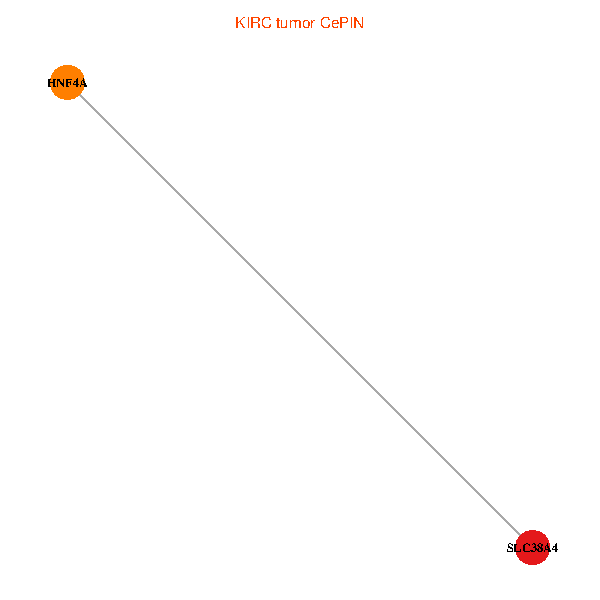
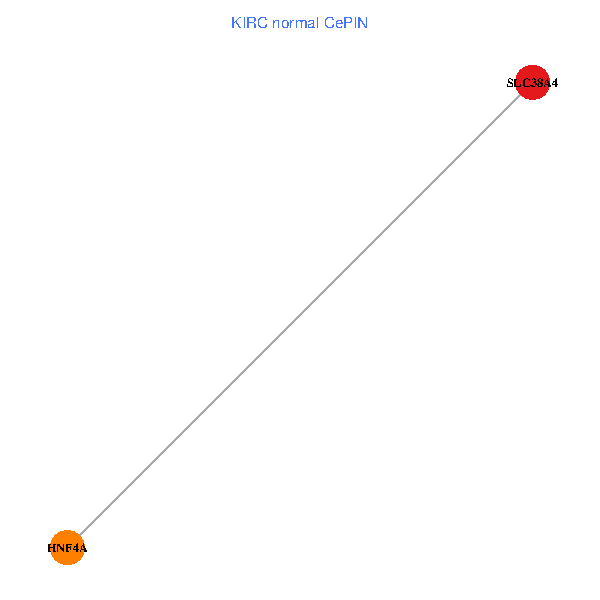
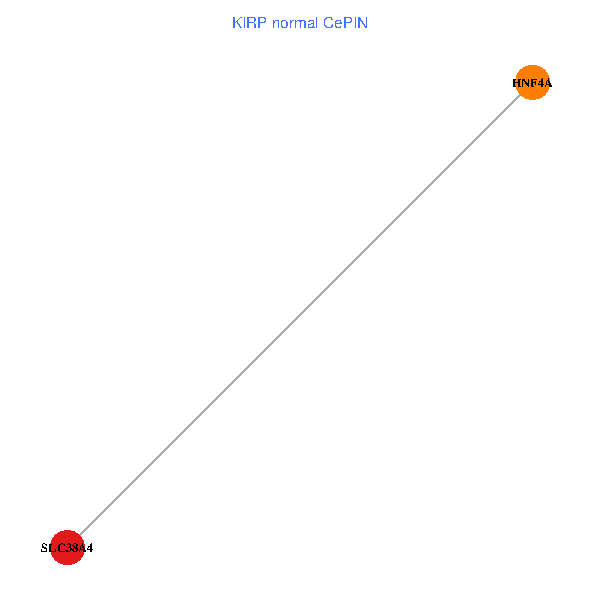
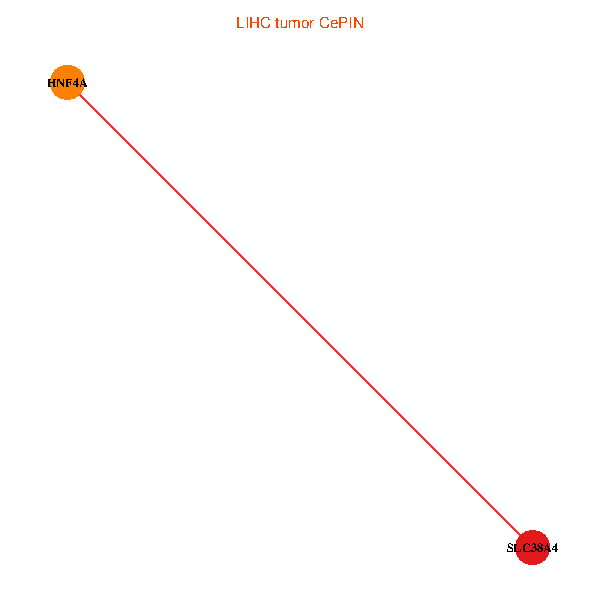
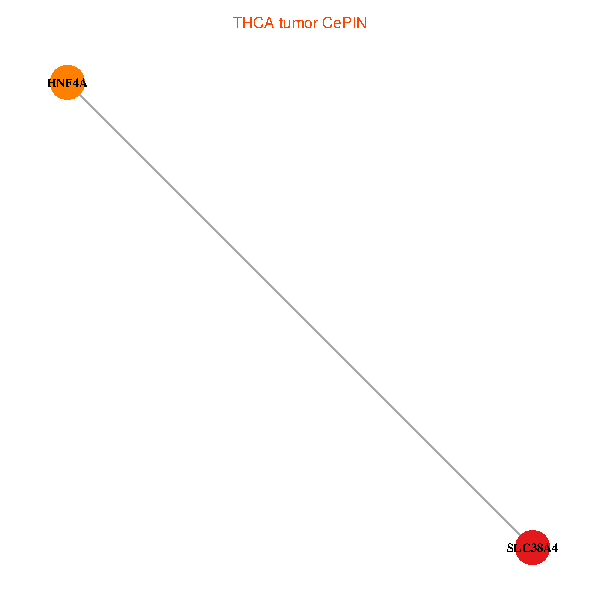
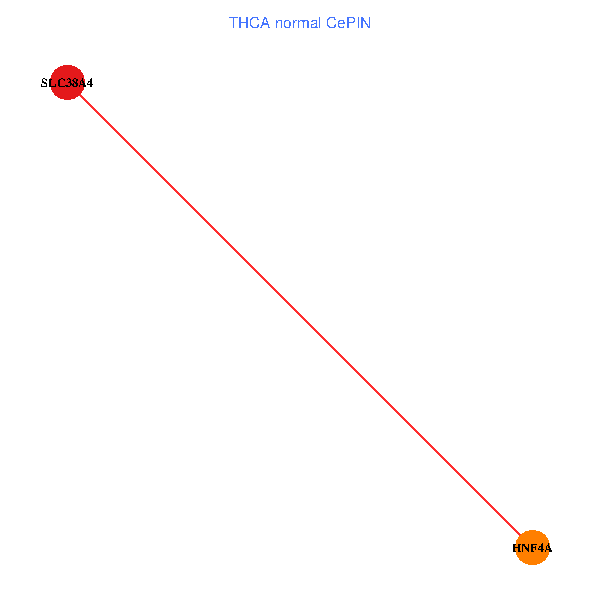
| Co-expressed gene networks based on protein-protein interaction data (CePIN) (TCGA IlluminaHiSeq_RNASeqV2, pan-cancer normalized log2(norm_counts+1) data, version 2016-08-16) (PINA2 ppi data) |
| BRCA (tumor) | BRCA (normal) |
| SLC38A4, HNF4A (tumor) | SLC38A4, HNF4A (normal) |
 |  |
| COAD (tumor) | COAD (normal) |
| SLC38A4, HNF4A (tumor) | SLC38A4, HNF4A (normal) |
 |  |
| HNSC (tumor) | HNSC (normal) |
| SLC38A4, HNF4A (tumor) | SLC38A4, HNF4A (normal) |
 |  |
| KICH (tumor) | KICH (normal) |
| SLC38A4, HNF4A (tumor) | SLC38A4, HNF4A (normal) |
 |  |
| KIRC (tumor) | KIRC (normal) |
| SLC38A4, HNF4A (tumor) | SLC38A4, HNF4A (normal) |
 |  |
| KIRP (tumor) | KIRP (normal) |
| SLC38A4, HNF4A (tumor) | SLC38A4, HNF4A (normal) |
 |  |
| LIHC (tumor) | LIHC (normal) |
| SLC38A4, HNF4A (tumor) | SLC38A4, HNF4A (normal) |
 |  |
| LUAD (tumor) | LUAD (normal) |
| SLC38A4, HNF4A (tumor) | SLC38A4, HNF4A (normal) |
 |  |
| LUSC (tumor) | LUSC (normal) |
| SLC38A4, HNF4A (tumor) | SLC38A4, HNF4A (normal) |
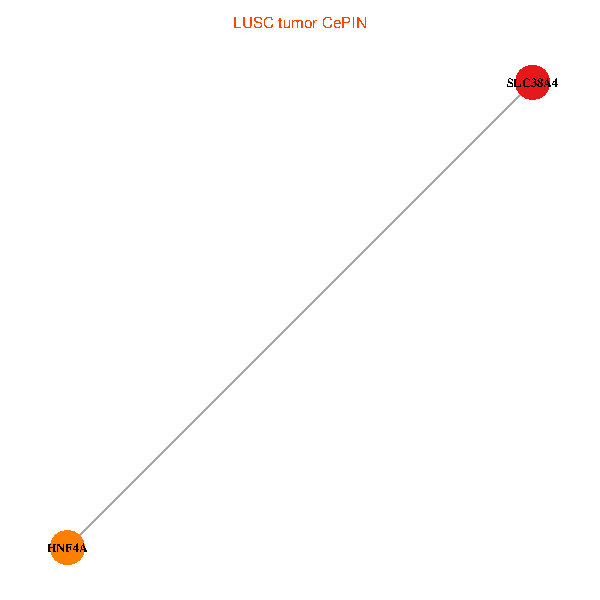 |  |
| PRAD (tumor) | PRAD (normal) |
| SLC38A4, HNF4A (tumor) | SLC38A4, HNF4A (normal) |
 |  |
| STAD (tumor) | STAD (normal) |
| SLC38A4, HNF4A (tumor) | SLC38A4, HNF4A (normal) |
 |  |
| THCA (tumor) | THCA (normal) |
| SLC38A4, HNF4A (tumor) | SLC38A4, HNF4A (normal) |
 |  |
| Top |
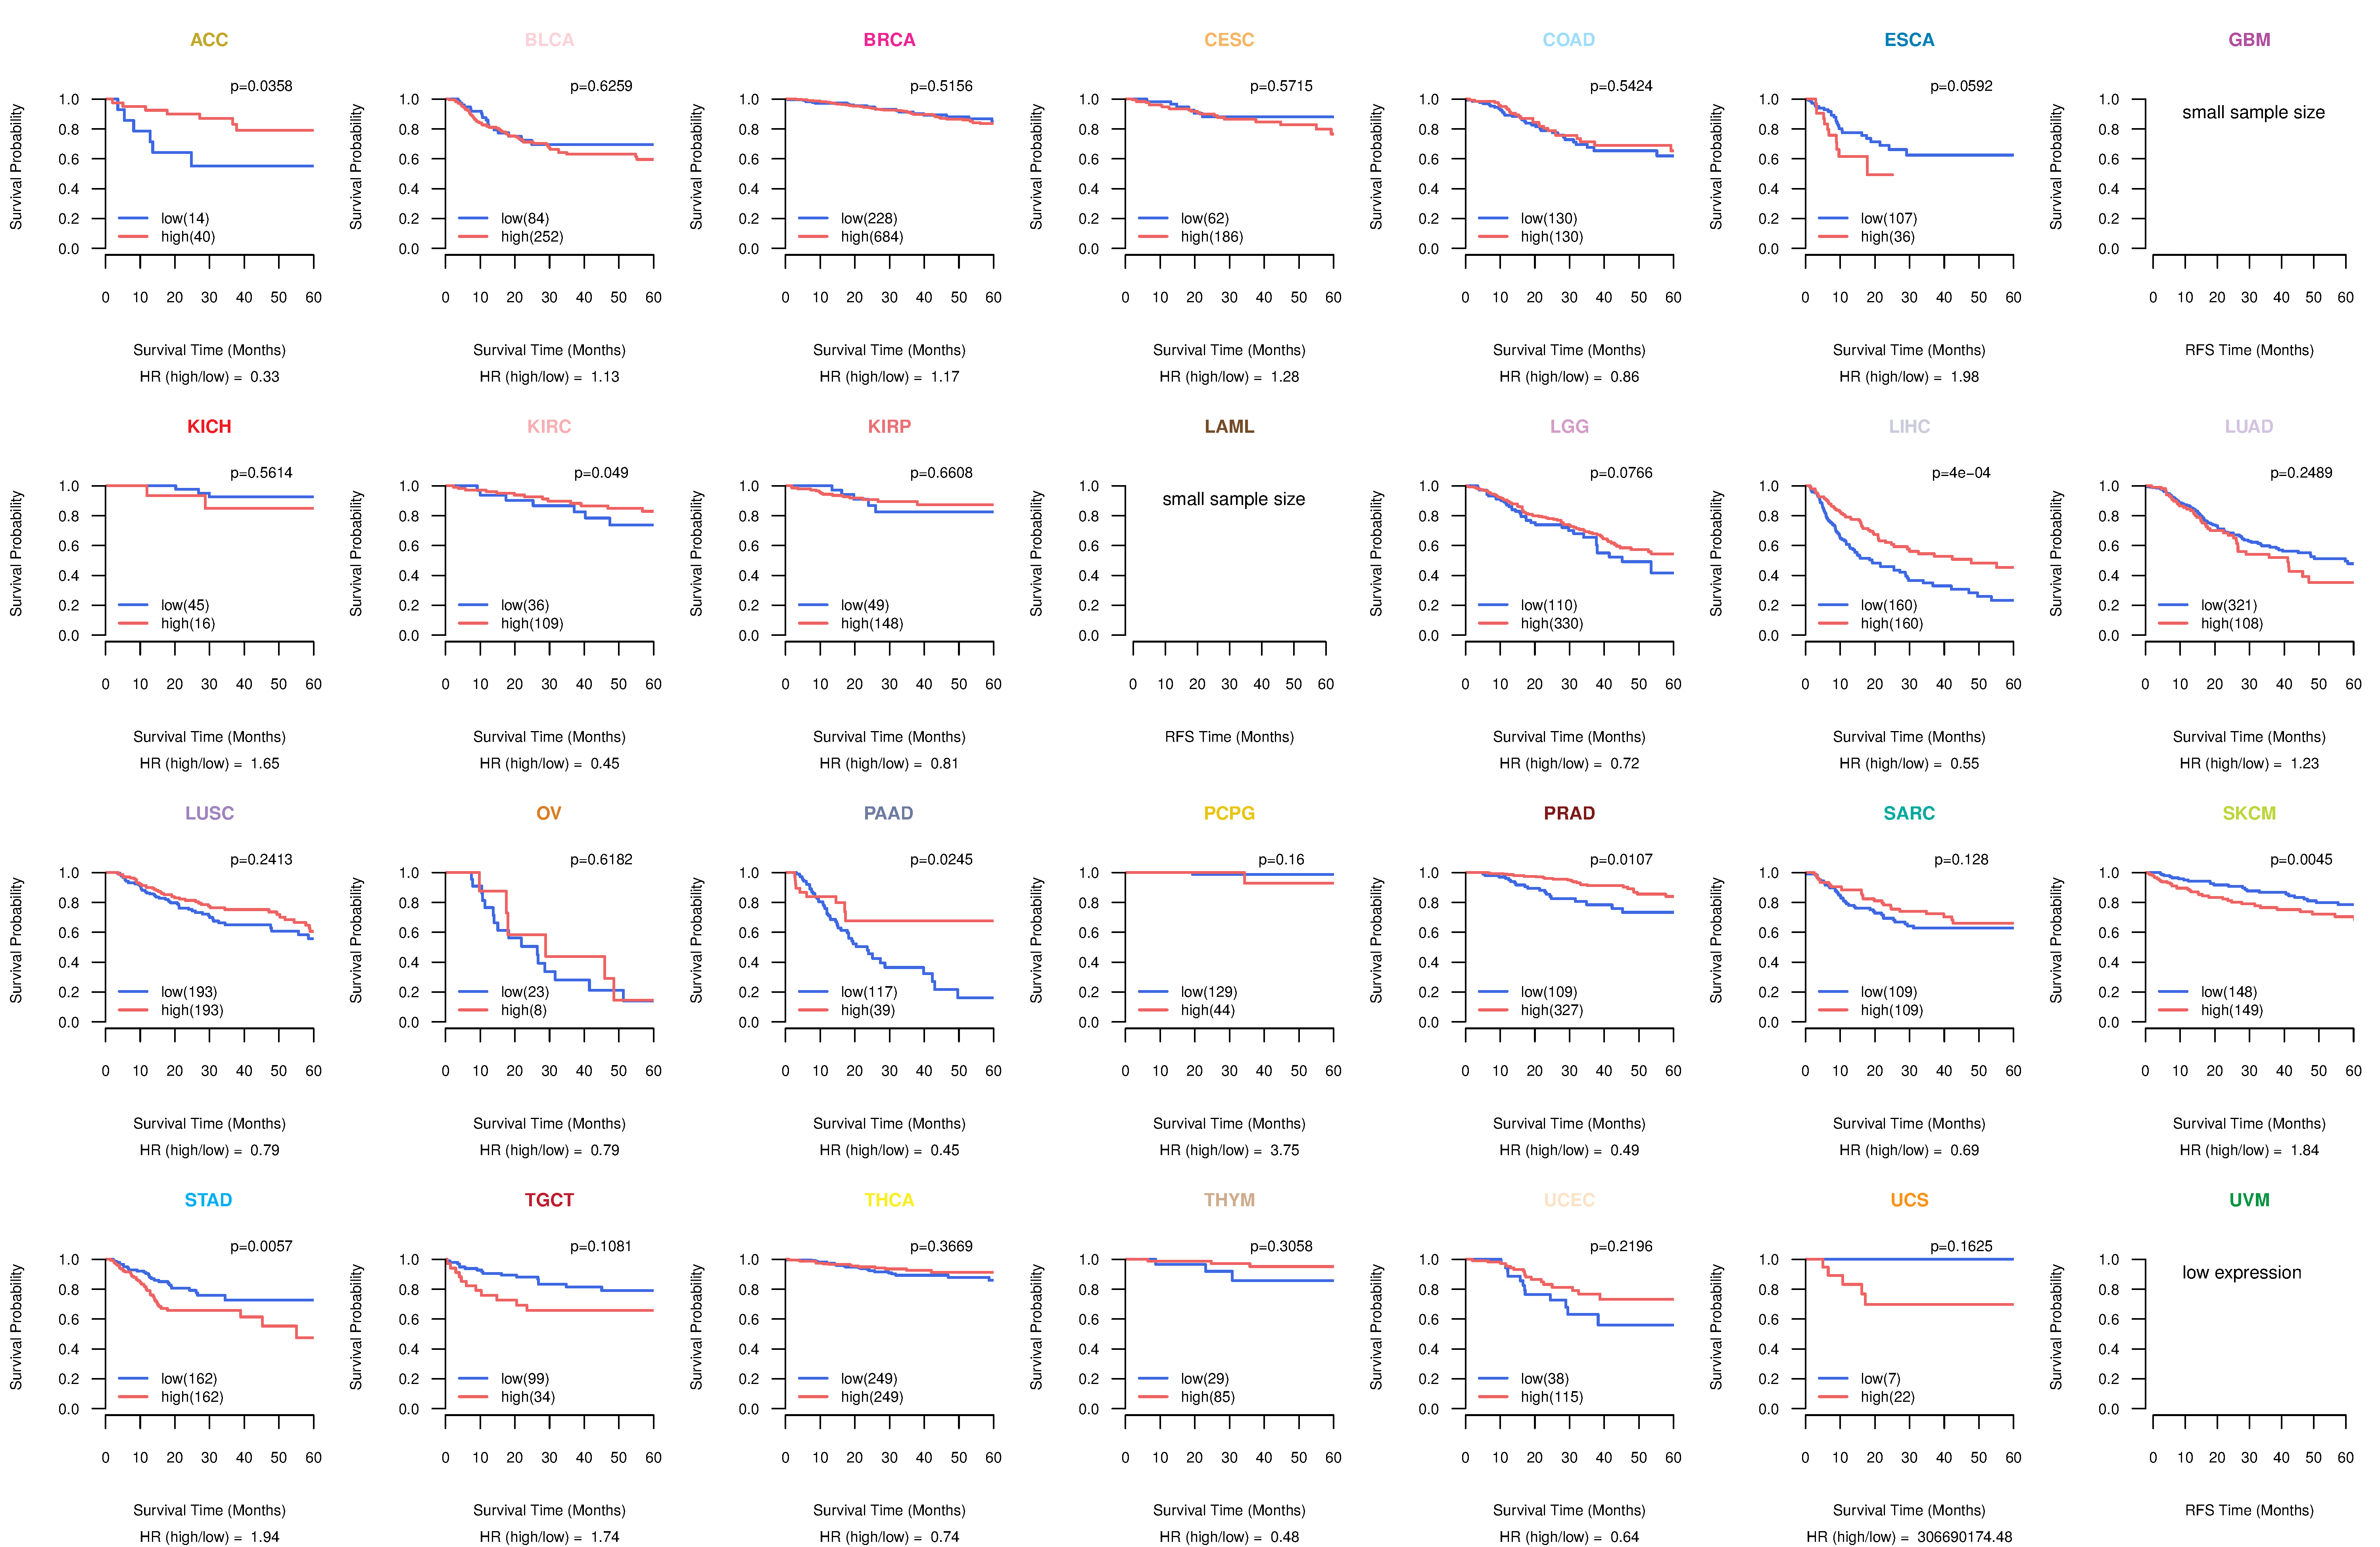
| TissGeneProg for SLC38A4 |
| Kaplan-Meier plots with logrank tests of overall survival (OS) using 28 cancer types (TCGA IlluminaHiSeq_RNASeqV2, pan-cancer normalized log2(norm_counts+1) data, version 2016-08-16) (TCGA clinicalMatrix, phenotype data, version 2016-04-27) * Click on the image to enlarge it in a new window. |
 |
| Kaplan-Meier plots with logrank test of relapse free survival (RFS) using 28 cancer types (TCGA IlluminaHiSeq_RNASeqV2, pan-cancer normalized log2(norm_counts+1) data, version 2016-08-16) (TCGA clinicalMatrix, phenotype data, version 2016-04-27) * Click on the image enlarge it in a new window. |
 |
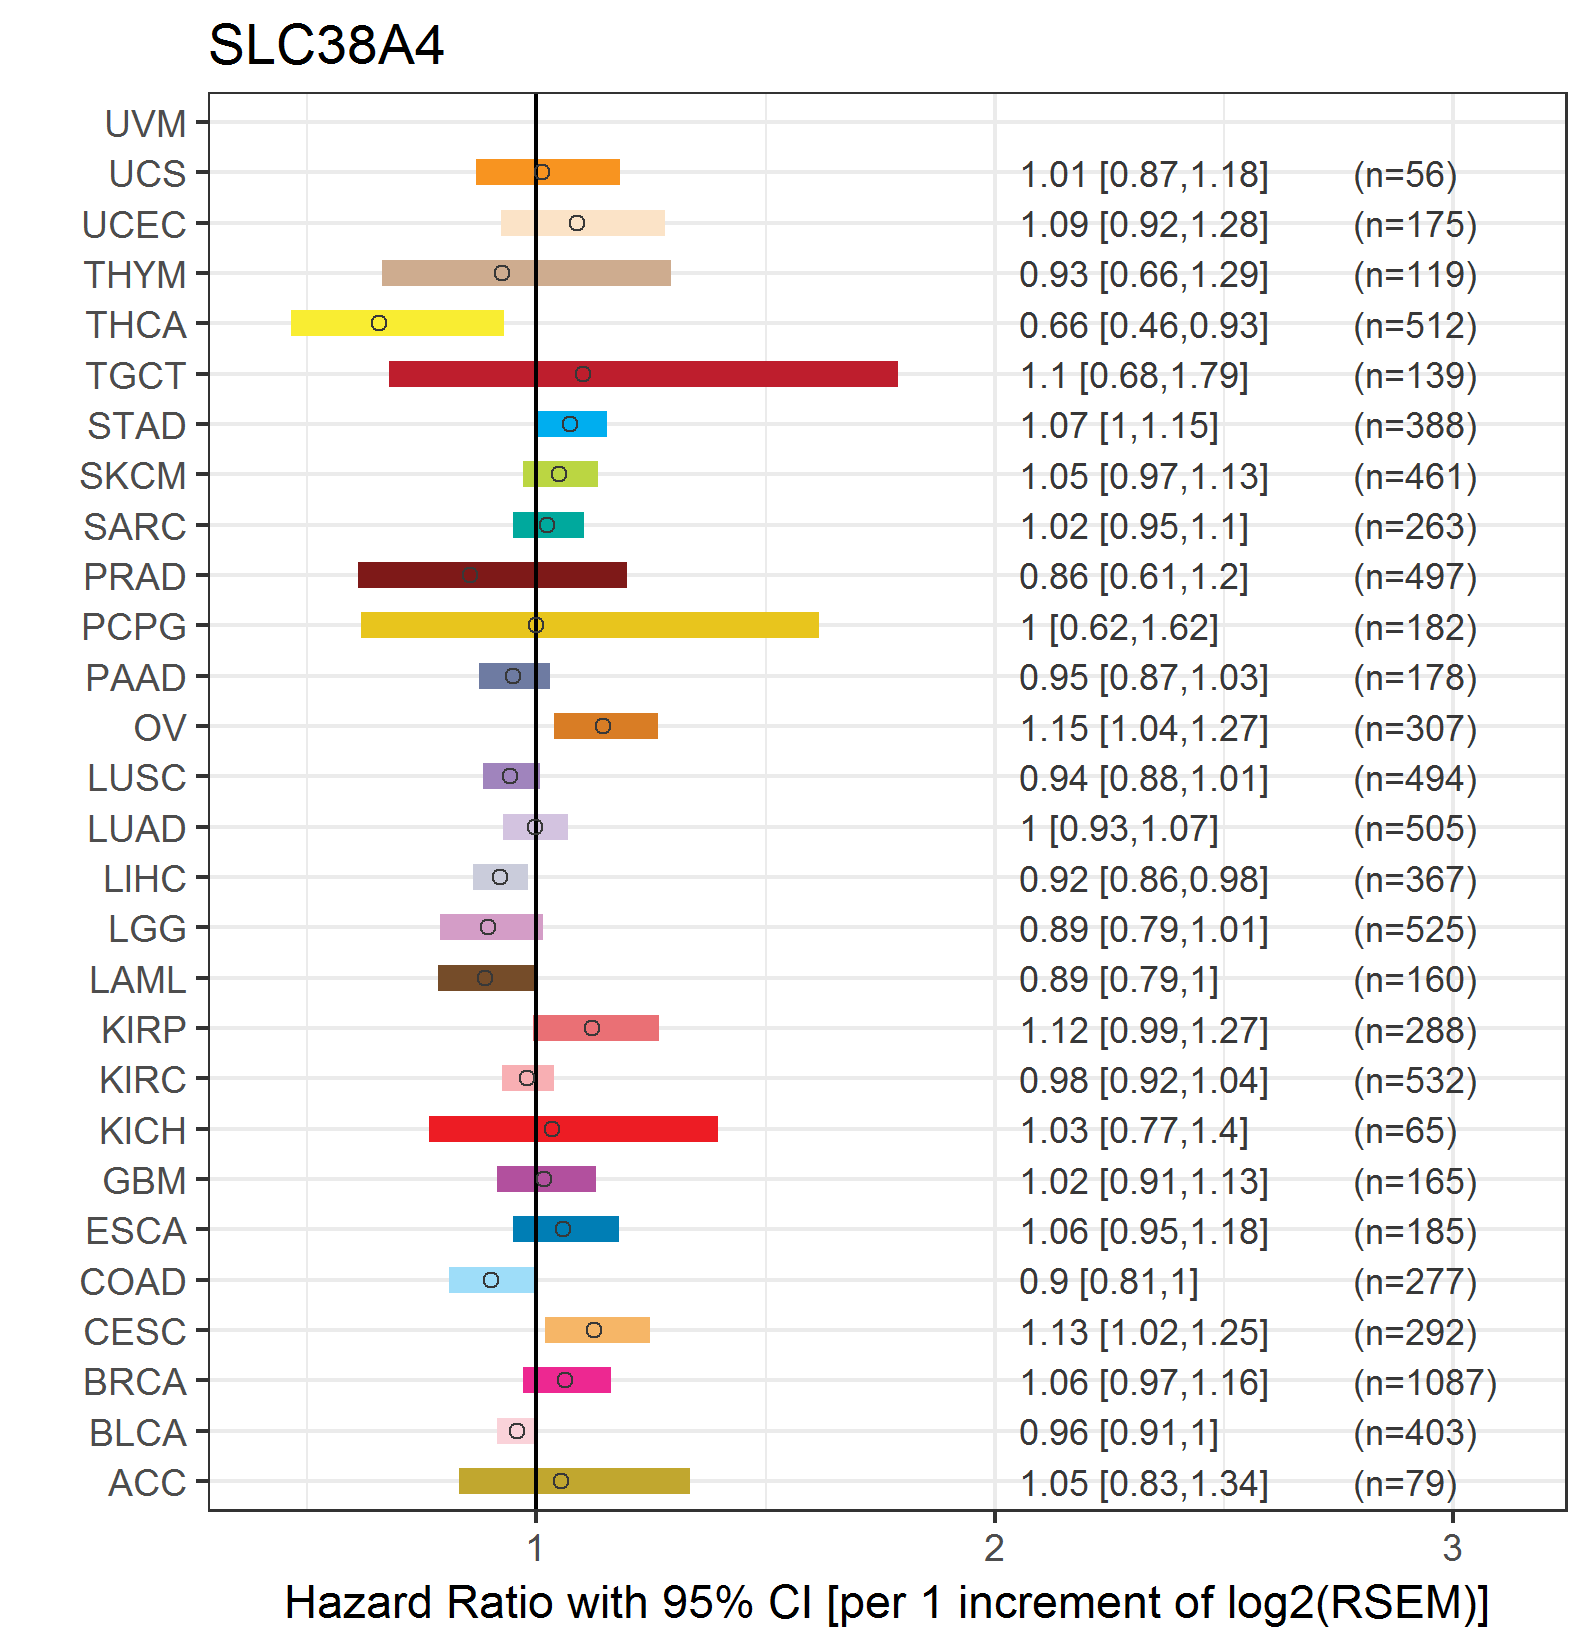
| Forest plot of Cox proportional hazard ratio (HR) and 95% CI of overall survival (OS) using 28 cancer types (TCGA IlluminaHiSeq_RNASeqV2, pan-cancer normalized log2(norm_counts+1) data, version 2016-08-16) (TCGA clinicalMatrix, phenotype data, version 2016-04-27) * Click on the image enlarge it in a new window. |
 |
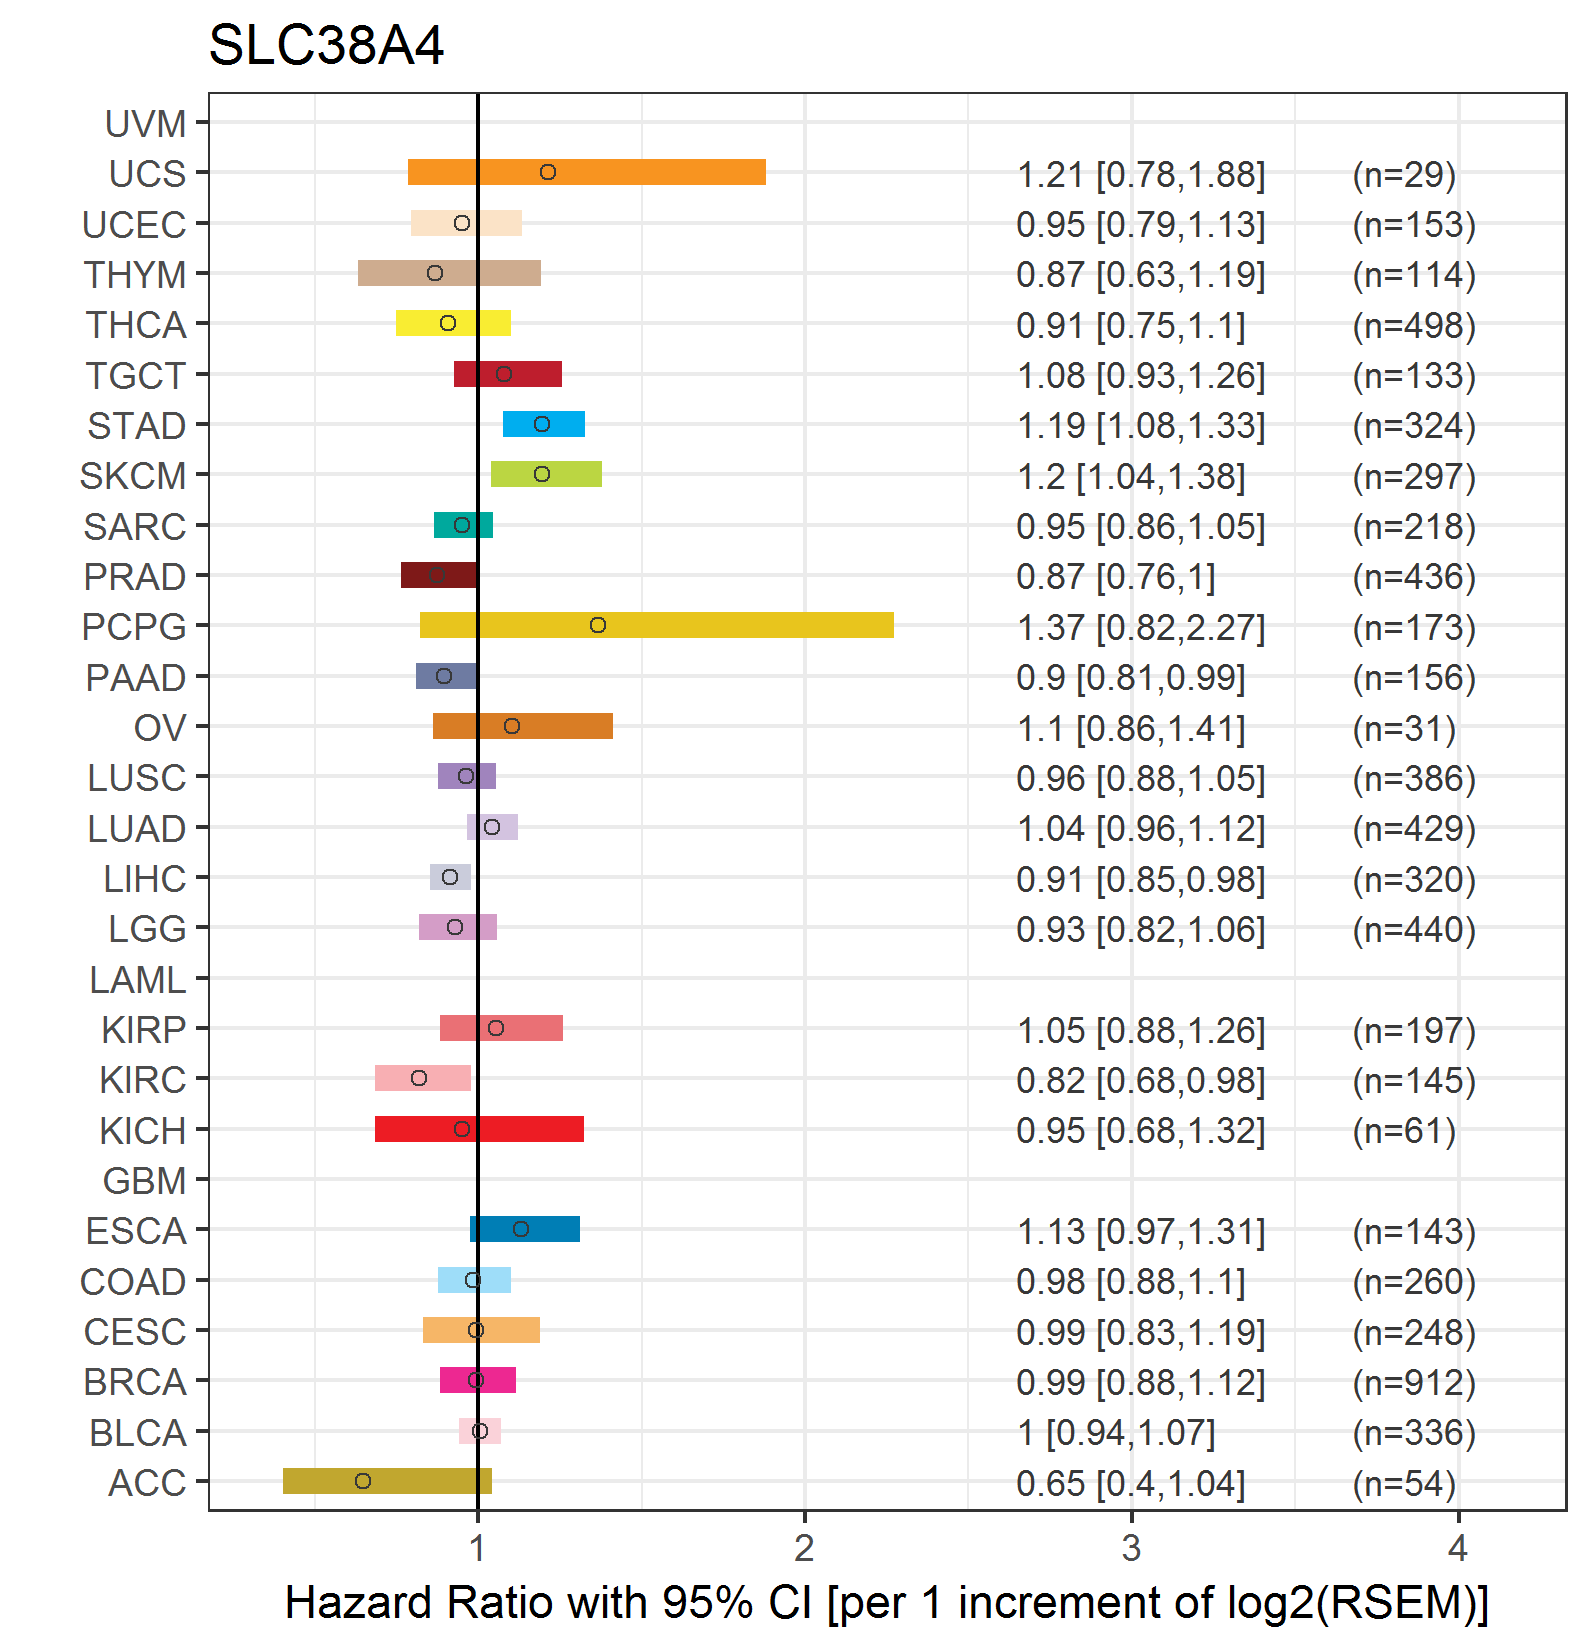
| Forest plot of Cox proportional hazard ratio (HR) and 95% CI of relapse free survival (RFS) using 28 cancer types (TCGA IlluminaHiSeq_RNASeqV2, pan-cancer normalized log2(norm_counts+1) data, version 2016-08-16) (TCGA clinicalMatrix, phenotype data, version 2016-04-27) * Click on the image enlarge it in a new window. |
 |
| Top |
| TissGeneClin for SLC38A4 |
| TissGeneDrug for SLC38A4 |
| Drug information targeting TissGene (DrugBank Version 5.0.6, 2017-04-01) |
| DrugBank ID | Drug name | Drug activity | Drug type | Drug status |
| Top |
| TissGeneDisease for SLC38A4 |
| Disease information associated with TissGene (DisGeNet, 2016-06-01) |
| Disease ID | Disease name | # pubmeds | Source |
| umls:C0020456 | Hyperglycemia | 1 | BeFree |
| umls:C0033578 | Prostatic Neoplasms | 1 | GAD |
| umls:C2239176 | Liver carcinoma | 1 | BeFree |
|
Copyright 2016-Present - The University of Texas Health Science Center at Houston (UTHealth) Web File Viewing | How to Report, Fraud, Waste and Abuse | State of Texas | Statewide Search | Texas Homeland Security | Site Policies |