 |
| |
| |
| |
| |
| |
| |
|

| TissGeneSummary for NECAB3 |
 Gene summary Gene summary |
| Basic gene information | Gene symbol | NECAB3 |
| Gene name | N-terminal EF-hand calcium binding protein 3 | |
| Synonyms | APBA2BP|EFCBP3|NIP1|STIP3|SYTIP2|XB51|dJ63M2.4|dJ63M2.5 | |
| Cytomap | UCSC genome browser: 20q11.22 | |
| Type of gene | protein-coding | |
| RefGenes | NM_031231.3, NM_031232.3, | |
| Description | EF-hand calcium binding protein 3N-terminal EF-hand calcium-binding protein 3Nek2-interacting protein 1X11L-binding protein 51amyloid beta (A4) precursor protein-binding, family A, member 2 binding proteinamyloid beta A4 protein-binding family A memb | |
| Modification date | 20141207 | |
| dbXrefs | MIM : 612478 | |
| HGNC : HGNC | ||
| Ensembl : ENSG00000125967 | ||
| HPRD : 07168 | ||
| Vega : OTTHUMG00000032264 | ||
| Protein | UniProt: go to UniProt's Cross Reference DB Table | |
| Expression | CleanEX: HS_NECAB3 | |
| BioGPS: 63941 | ||
| Pathway | NCI Pathway Interaction Database: NECAB3 | |
| KEGG: NECAB3 | ||
| REACTOME: NECAB3 | ||
| Pathway Commons: NECAB3 | ||
| Context | iHOP: NECAB3 | |
| ligand binding site mutation search in PubMed: NECAB3 | ||
| UCL Cancer Institute: NECAB3 | ||
| Assigned class in TissGDB* | C | |
| Included tissue-specific gene expression resources | TiGER,GTEx | |
| Specific-tissues in normal samples (assigned by TissGDB using HPA, TiGER, and GTEx) | CervixOvary | |
| Cancer types related to the specific-tissues in cancer samples (assigned by TissGDB using TCGA) | CESCOV | |
| Reference showing the relevant tissue of NECAB3 | ||
| Description by TissGene annotations | Have significant anti-correlated miRNA Fused withTSGene | |
| * Class A consists of genes with literature evidence and is part of the cTissGenes. Class B consists of only cTissGenes without additional evidence. The remaining genes belong to Class C. |
| Gene ontology having evidence of Inferred from Direct Assay (IDA) from Entrez |
| GO ID | GO term | PubMed ID | GO:0019538 | protein metabolic process | 12780348 | GO:0042984 | regulation of amyloid precursor protein biosynthetic process | 10833507 | GO:0019538 | protein metabolic process | 12780348 | GO:0042984 | regulation of amyloid precursor protein biosynthetic process | 10833507 |
| Top |
| TissGeneExp for NECAB3 |
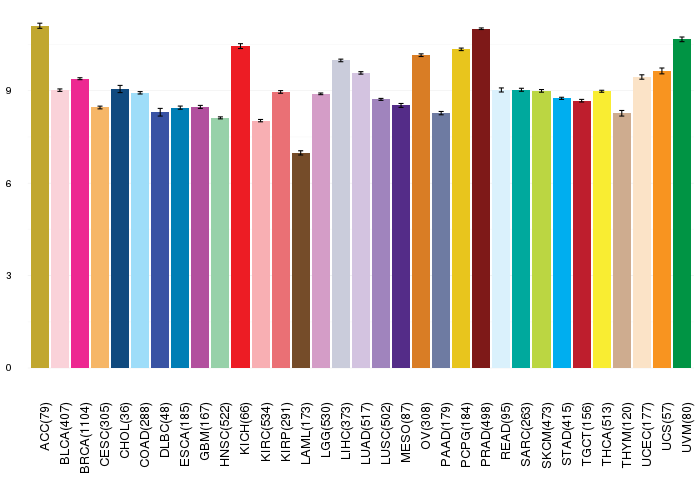
| Gene expressions across 28 cancer types (X-axis: cancer type and Y-axis: log2(norm_counts+1)) (TCGA IlluminaHiSeq_RNASeqV2, pan-cancer normalized log2(norm_counts+1) data, version 2016-08-16) |
 |
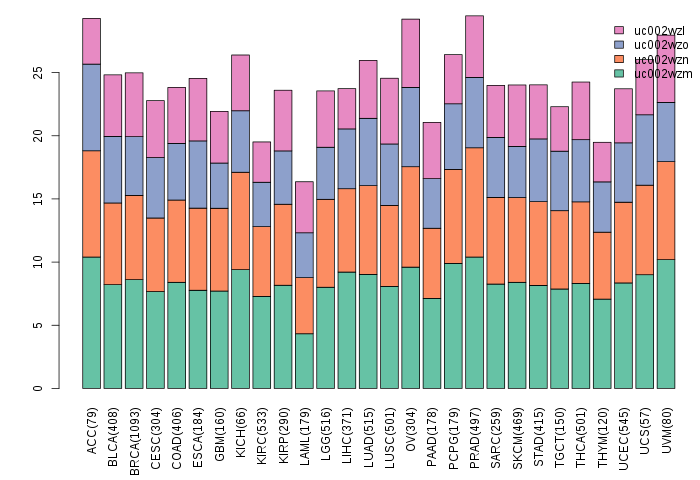
| Gene isoform expressions across 28 cancer types (X-axis: cancer type and Y-axis: log2(norm_counts+1)) (TCGA pan-cancer tcga_rsem_isoform_tpm, version 2016-09-01) |
 |
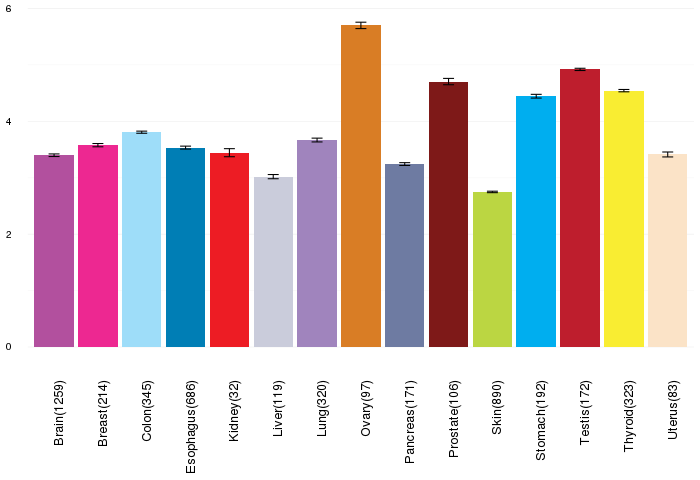
| Gene expressions across normal tissues of GTEx data (GTEx GTEx_Analysis_v6_RNA-seq_RNA-SeQCv1.1.8_gene_rpkm.gct) - Here, we shows the matched tissue types only among our 28 cancer types. |
 |
| Different expressions across 14 cancer types with more than 10 samples between matched tumors and normals (X-axis: cancer type and Y-axis: log2(norm_counts+1)) (TCGA IlluminaHiSeq_RNASeqV2, pan-cancer normalized log2(norm_counts+1) data, version 2016-08-16) |
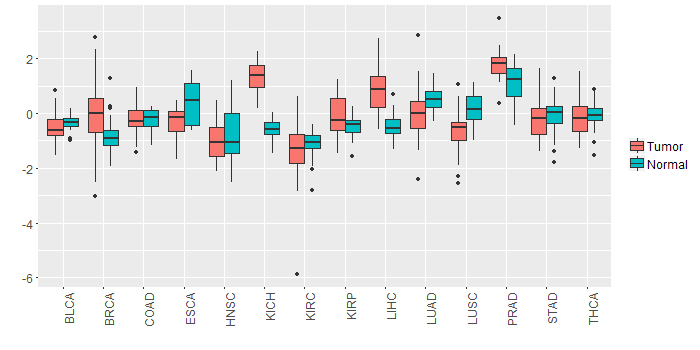 |
| - Significantly differentially expressed cancer types and information. (|Fold change|>1 and FDR<0.05) |
| Cancer type | Mean(exp) in tumor | Mean(exp) in matched normal | Log2FC | P-val. | FDR |
| KICH | 1.347116131 | -0.609447869 | 1.956564 | 9.33E-18 | 4.36E-16 |
| LIHC | 0.839194131 | -0.475669869 | 1.314864 | 1.22E-15 | 4.17E-14 |
| Top |
| TissGene-miRNA for NECAB3 |
| Significantly anti-correlated miRNAs of TissGene across 28 cancer types (Gene-miRNA relations from TargetScanHuman Relsease 7.1, Conserved_Site_Context_Scores.txt.zip, 06.01.2016) (TCGA IlluminaHiSeq_miRNASeq, log2(RPM+1) data, version 2016-11-21) (TCGA IlluminaHiSeq_RNASeqV2, log2(normalized_count+1) data, version 2016-08-16) (Spearman’s Rank Correlation (p-value<0.05 and coefficient<-0.25)) |
| Cancer type | miRNA id | miRNA accession | P-val. | Coeff. | # samples |
| ACC | hsa-miR-125a-5p | MIMAT0000443 | 0.016 | -0.27 | 78 |
| ACC | hsa-miR-125a-5p | MIMAT0000443 | 0.016 | -0.27 | 78 |
| UVM | hsa-miR-874-3p | MIMAT0004911 | 0.0054 | -0.31 | 80 |
| Top |
| TissGeneMut for NECAB3 |
| TissGeneSNV for NECAB3 |
| nsSNV counts per each loci. Different colors of circles represent different cancer types. Circle size denotes number of samples. (TCGA somatic mutation (SNPs and small INDELs) data, version 2016-04-25) * Click on the image to enlarge it in a new window. |
 |
 |
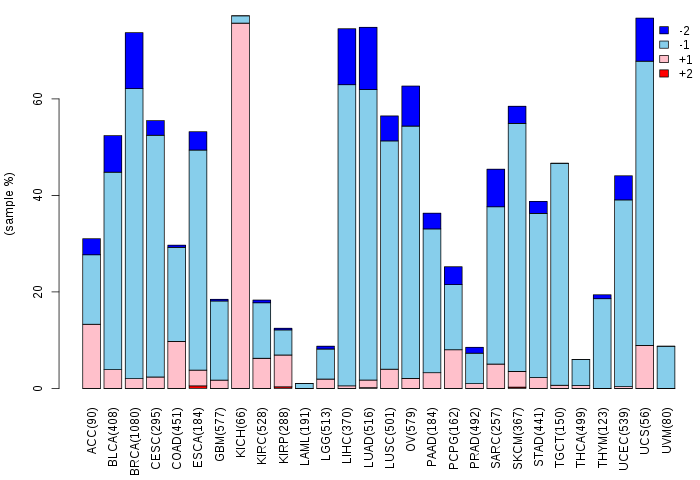
| Somatic nucleotide variants of TissGene across 28 cancer types (X-axis: cancer type and Y-axis: % of mutated samples) The numbers in parentheses are numbers of samples with mutation (nsSNVs). (TCGA somatic mutation (SNPs and small INDELs) data, version 2016-04-25) |
 |
| - nsSNVs sorted by frequency. |
| AAchange | Cancer type | # samples |
| p.V302G | LGG | 1 |
| p.F144L | LUAD | 1 |
| p.R46H | UCEC | 1 |
| p.S159L | SKCM | 1 |
| p.A183T | LIHC | 1 |
| p.V302G | HNSC | 1 |
| p.P259A | ESCA | 1 |
| p.R175Q | COAD | 1 |
| p.E161V | BLCA | 1 |
| p.R175W | COAD | 1 |
| p.S208F | SARC | 1 |
| p.L316P | LIHC | 1 |
| p.P247S | UCEC | 1 |
| p.L345M | DLBC | 1 |
| p.D236N | HNSC | 1 |
| p.R369H | THYM | 1 |
| p.S164* | ACC | 1 |
| p.V302G | LUAD | 1 |
| p.A305T | STAD | 1 |
| Top |
| TissGeneCNV for NECAB3 |
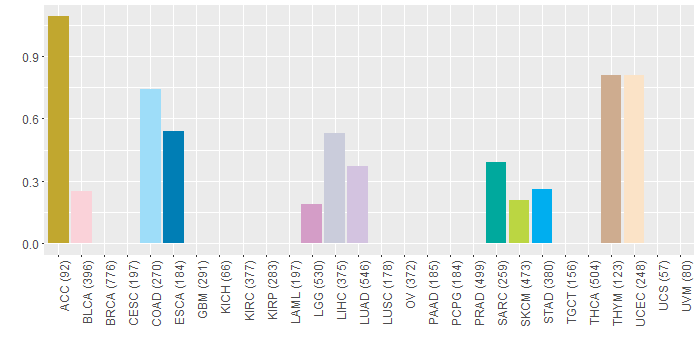
| Copy number variations of TissGene across 28 cancer types (X-axis: cancer type and Y-axis: % of CNV samples) (TCGA Gistic2_CopyNumber_Gistic2_all_data_by_genes, Gistic2 copy number data, version 2016-08-16) |
 |
| Top |
| TissGeneFusions for NECAB3 |
| Fusion genes including TissGene (ChimerDB 3.0, 2016-12-01 and TCGA fusion Portal 2015-12-01) |
| Database | Src | Cancer type | Sample | Fusion gene | ORF | 5'-gene BP | 3'-gene BP |
| Chimerdb3.0 | ChiTaRs | NA | BE818164 | AP2A1-NECAB3 | chr19:50292064 | chr20:32247515 | |
| Chimerdb3.0 | ChiTaRs | NA | BG927599 | NECAB3-DCN | chr20:32261408 | chr12:91550912 | |
| Chimerdb3.0 | ChiTaRs | NA | BG984251 | TADA2A-NECAB3 | chr17:35801828 | chr20:32245631 | |
| TCGAfusionPortal | PRADA | BRCA | TCGA-A7-A6VY-01A | NECAB3-ARHGAP40 | CDS-5UTR | Chr20:32257181 | Chr20:37252002 |
| Top |
| TissGeneNet for NECAB3 |
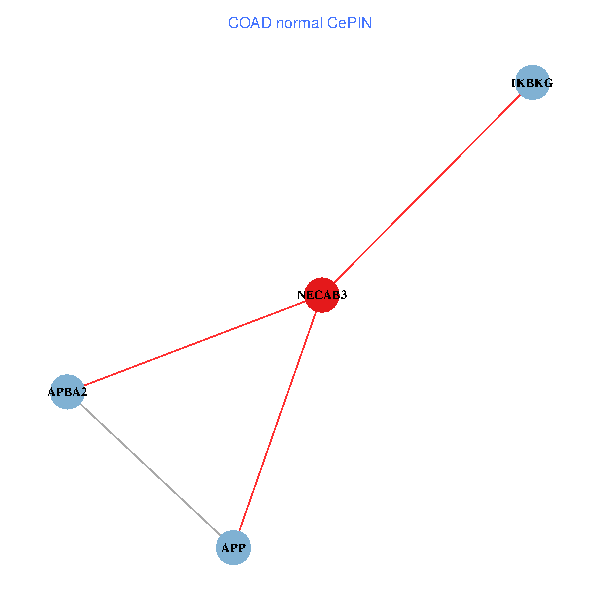
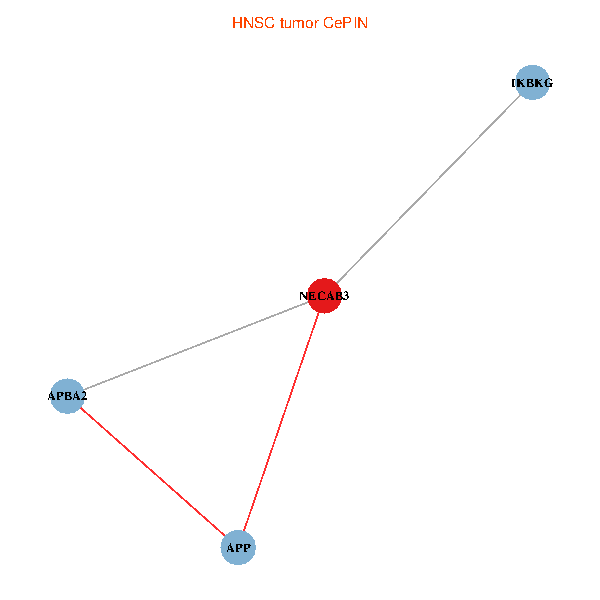
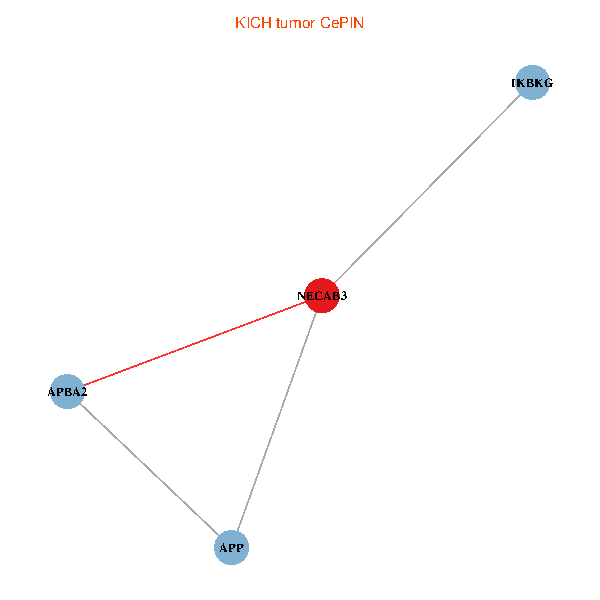
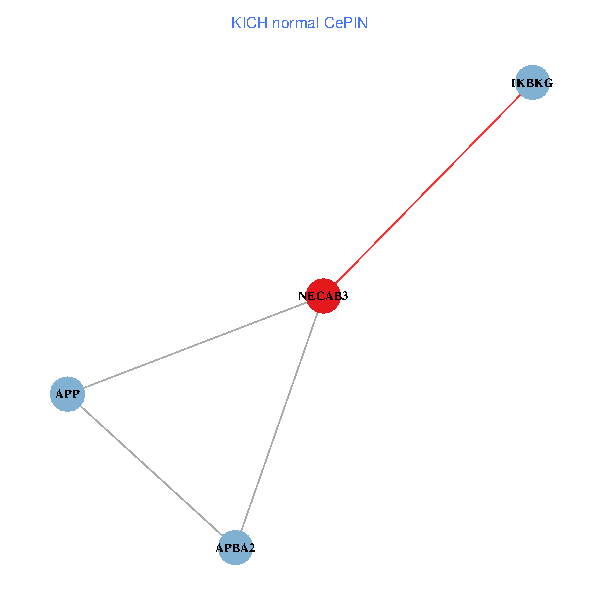
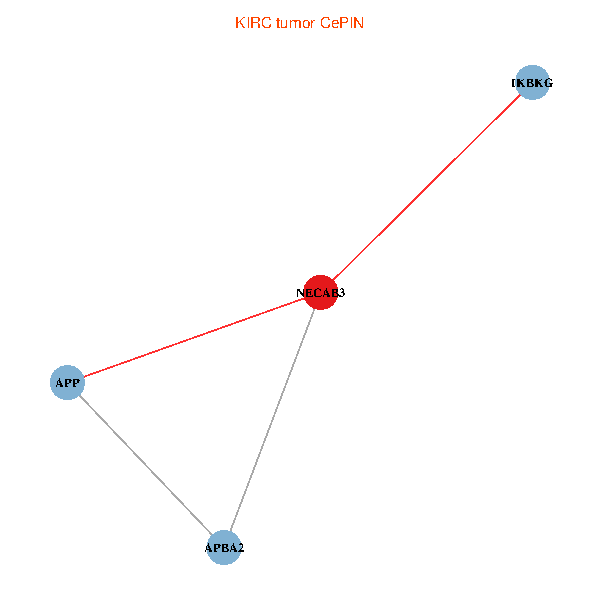
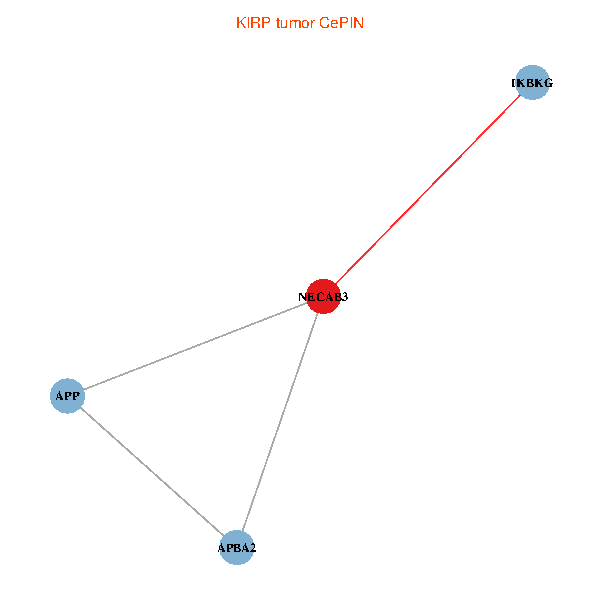
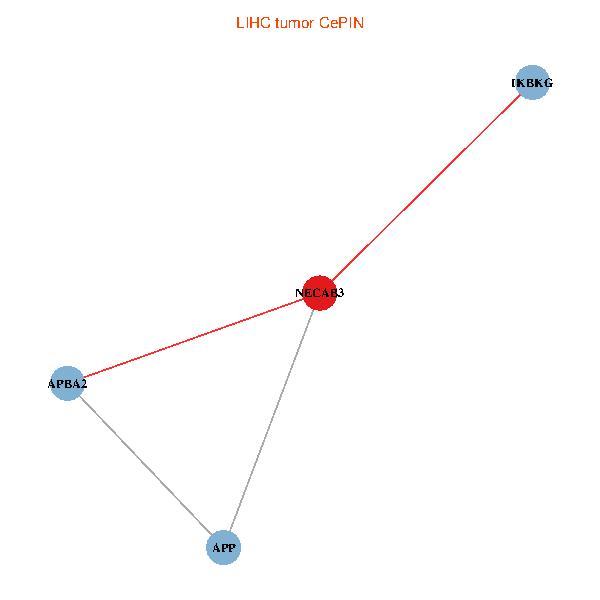
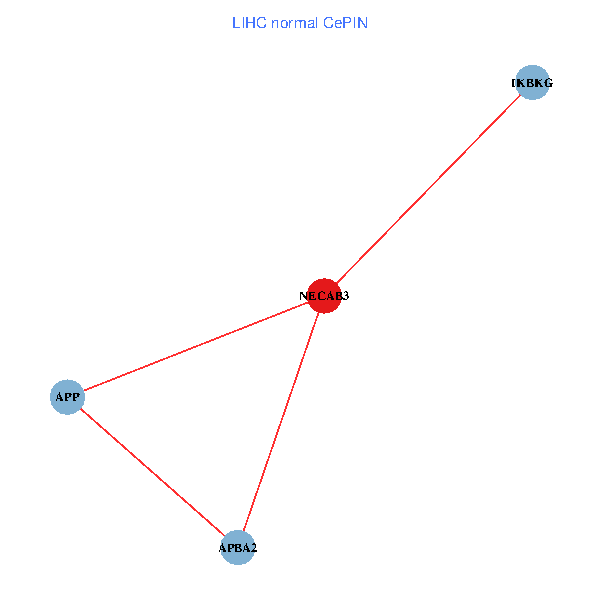
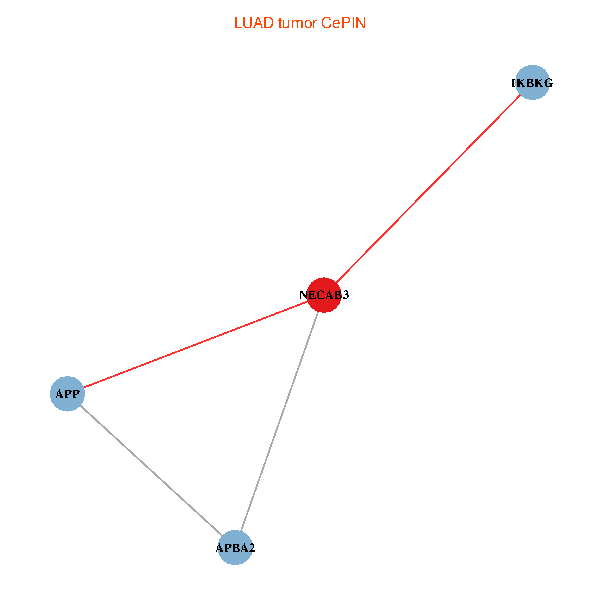
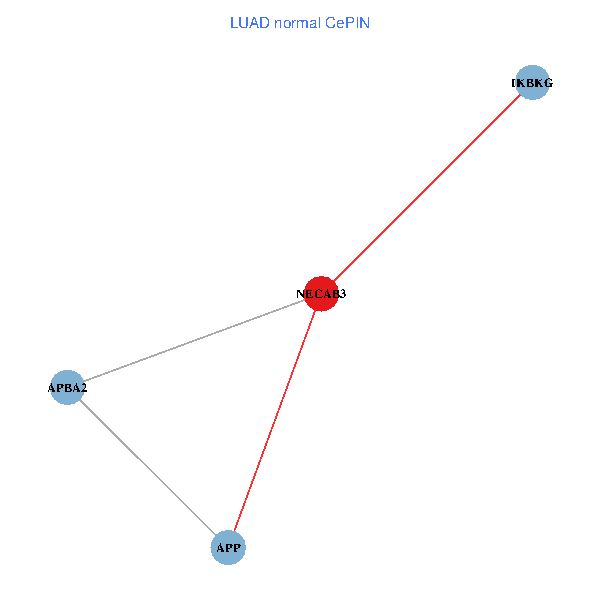
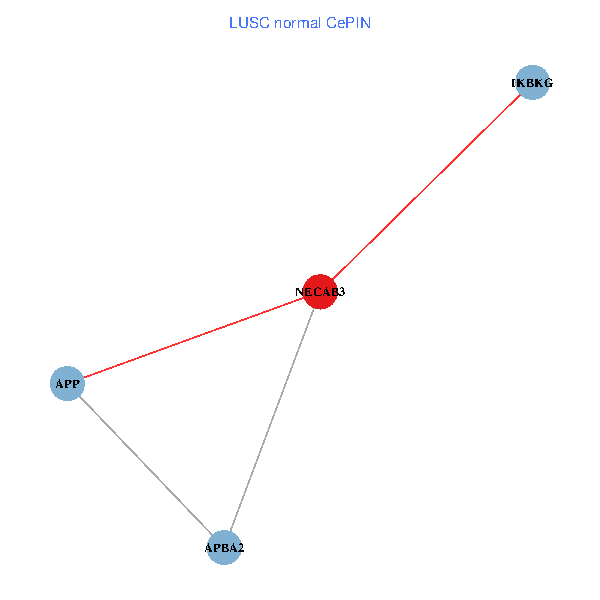
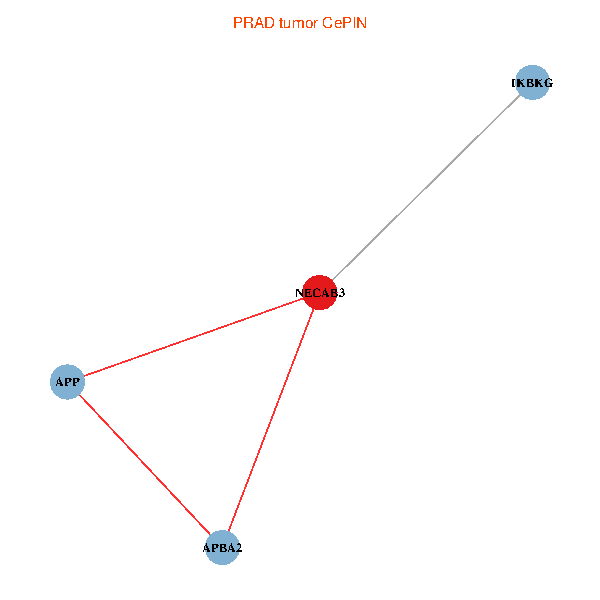
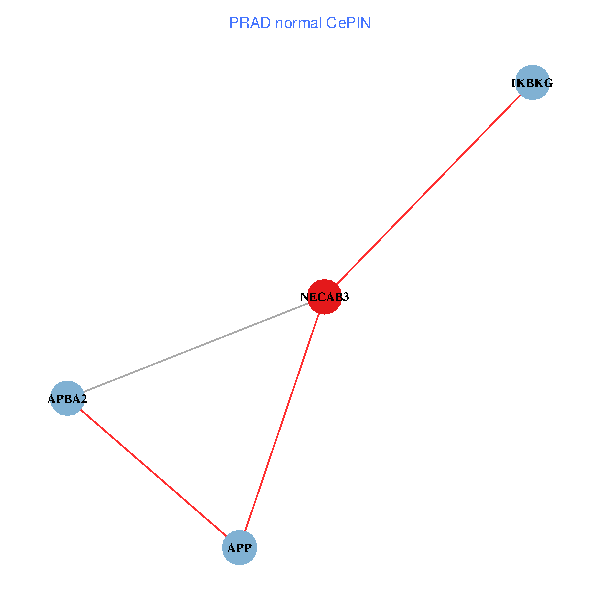
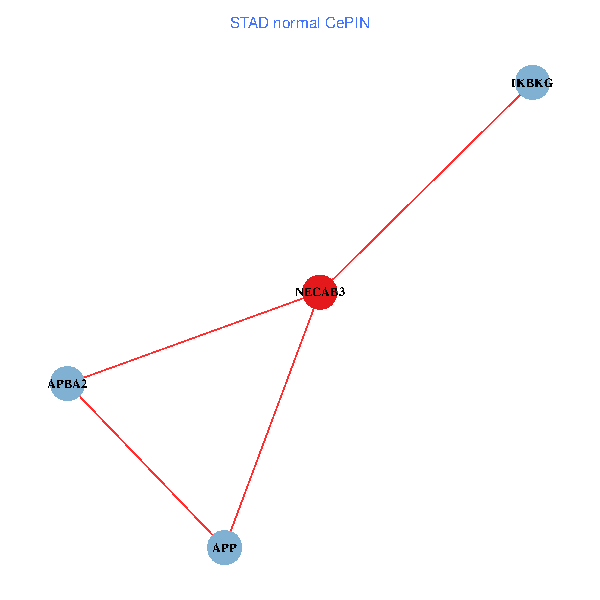
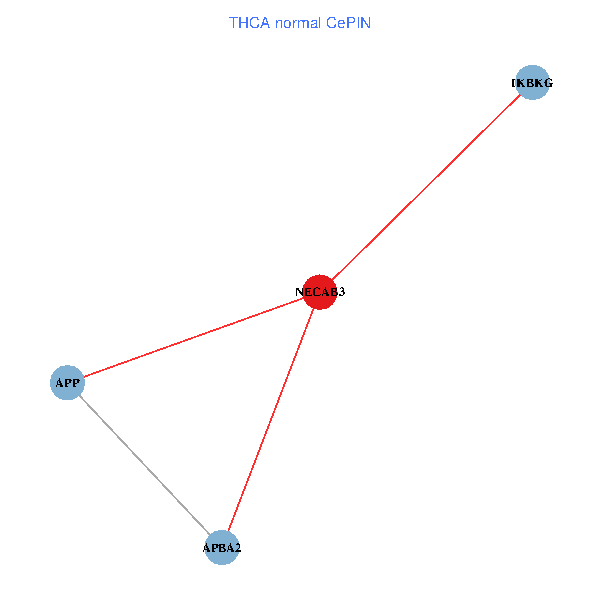
| Co-expressed gene networks based on protein-protein interaction data (CePIN) (TCGA IlluminaHiSeq_RNASeqV2, pan-cancer normalized log2(norm_counts+1) data, version 2016-08-16) (PINA2 ppi data) |
| BRCA (tumor) | BRCA (normal) |
| NECAB3, IKBKG, APP, APBA2 (tumor) | NECAB3, IKBKG, APP, APBA2 (normal) |
 |  |
| COAD (tumor) | COAD (normal) |
| NECAB3, IKBKG, APP, APBA2 (tumor) | NECAB3, IKBKG, APP, APBA2 (normal) |
 |  |
| HNSC (tumor) | HNSC (normal) |
| NECAB3, IKBKG, APP, APBA2 (tumor) | NECAB3, IKBKG, APP, APBA2 (normal) |
 |  |
| KICH (tumor) | KICH (normal) |
| NECAB3, IKBKG, APP, APBA2 (tumor) | NECAB3, IKBKG, APP, APBA2 (normal) |
 |  |
| KIRC (tumor) | KIRC (normal) |
| NECAB3, IKBKG, APP, APBA2 (tumor) | NECAB3, IKBKG, APP, APBA2 (normal) |
 |  |
| KIRP (tumor) | KIRP (normal) |
| NECAB3, IKBKG, APP, APBA2 (tumor) | NECAB3, IKBKG, APP, APBA2 (normal) |
 |  |
| LIHC (tumor) | LIHC (normal) |
| NECAB3, IKBKG, APP, APBA2 (tumor) | NECAB3, IKBKG, APP, APBA2 (normal) |
 |  |
| LUAD (tumor) | LUAD (normal) |
| NECAB3, IKBKG, APP, APBA2 (tumor) | NECAB3, IKBKG, APP, APBA2 (normal) |
 |  |
| LUSC (tumor) | LUSC (normal) |
| NECAB3, IKBKG, APP, APBA2 (tumor) | NECAB3, IKBKG, APP, APBA2 (normal) |
 |  |
| PRAD (tumor) | PRAD (normal) |
| NECAB3, IKBKG, APP, APBA2 (tumor) | NECAB3, IKBKG, APP, APBA2 (normal) |
 |  |
| STAD (tumor) | STAD (normal) |
| NECAB3, IKBKG, APP, APBA2 (tumor) | NECAB3, IKBKG, APP, APBA2 (normal) |
 |  |
| THCA (tumor) | THCA (normal) |
| NECAB3, IKBKG, APP, APBA2 (tumor) | NECAB3, IKBKG, APP, APBA2 (normal) |
 |  |
| Top |
| TissGeneProg for NECAB3 |
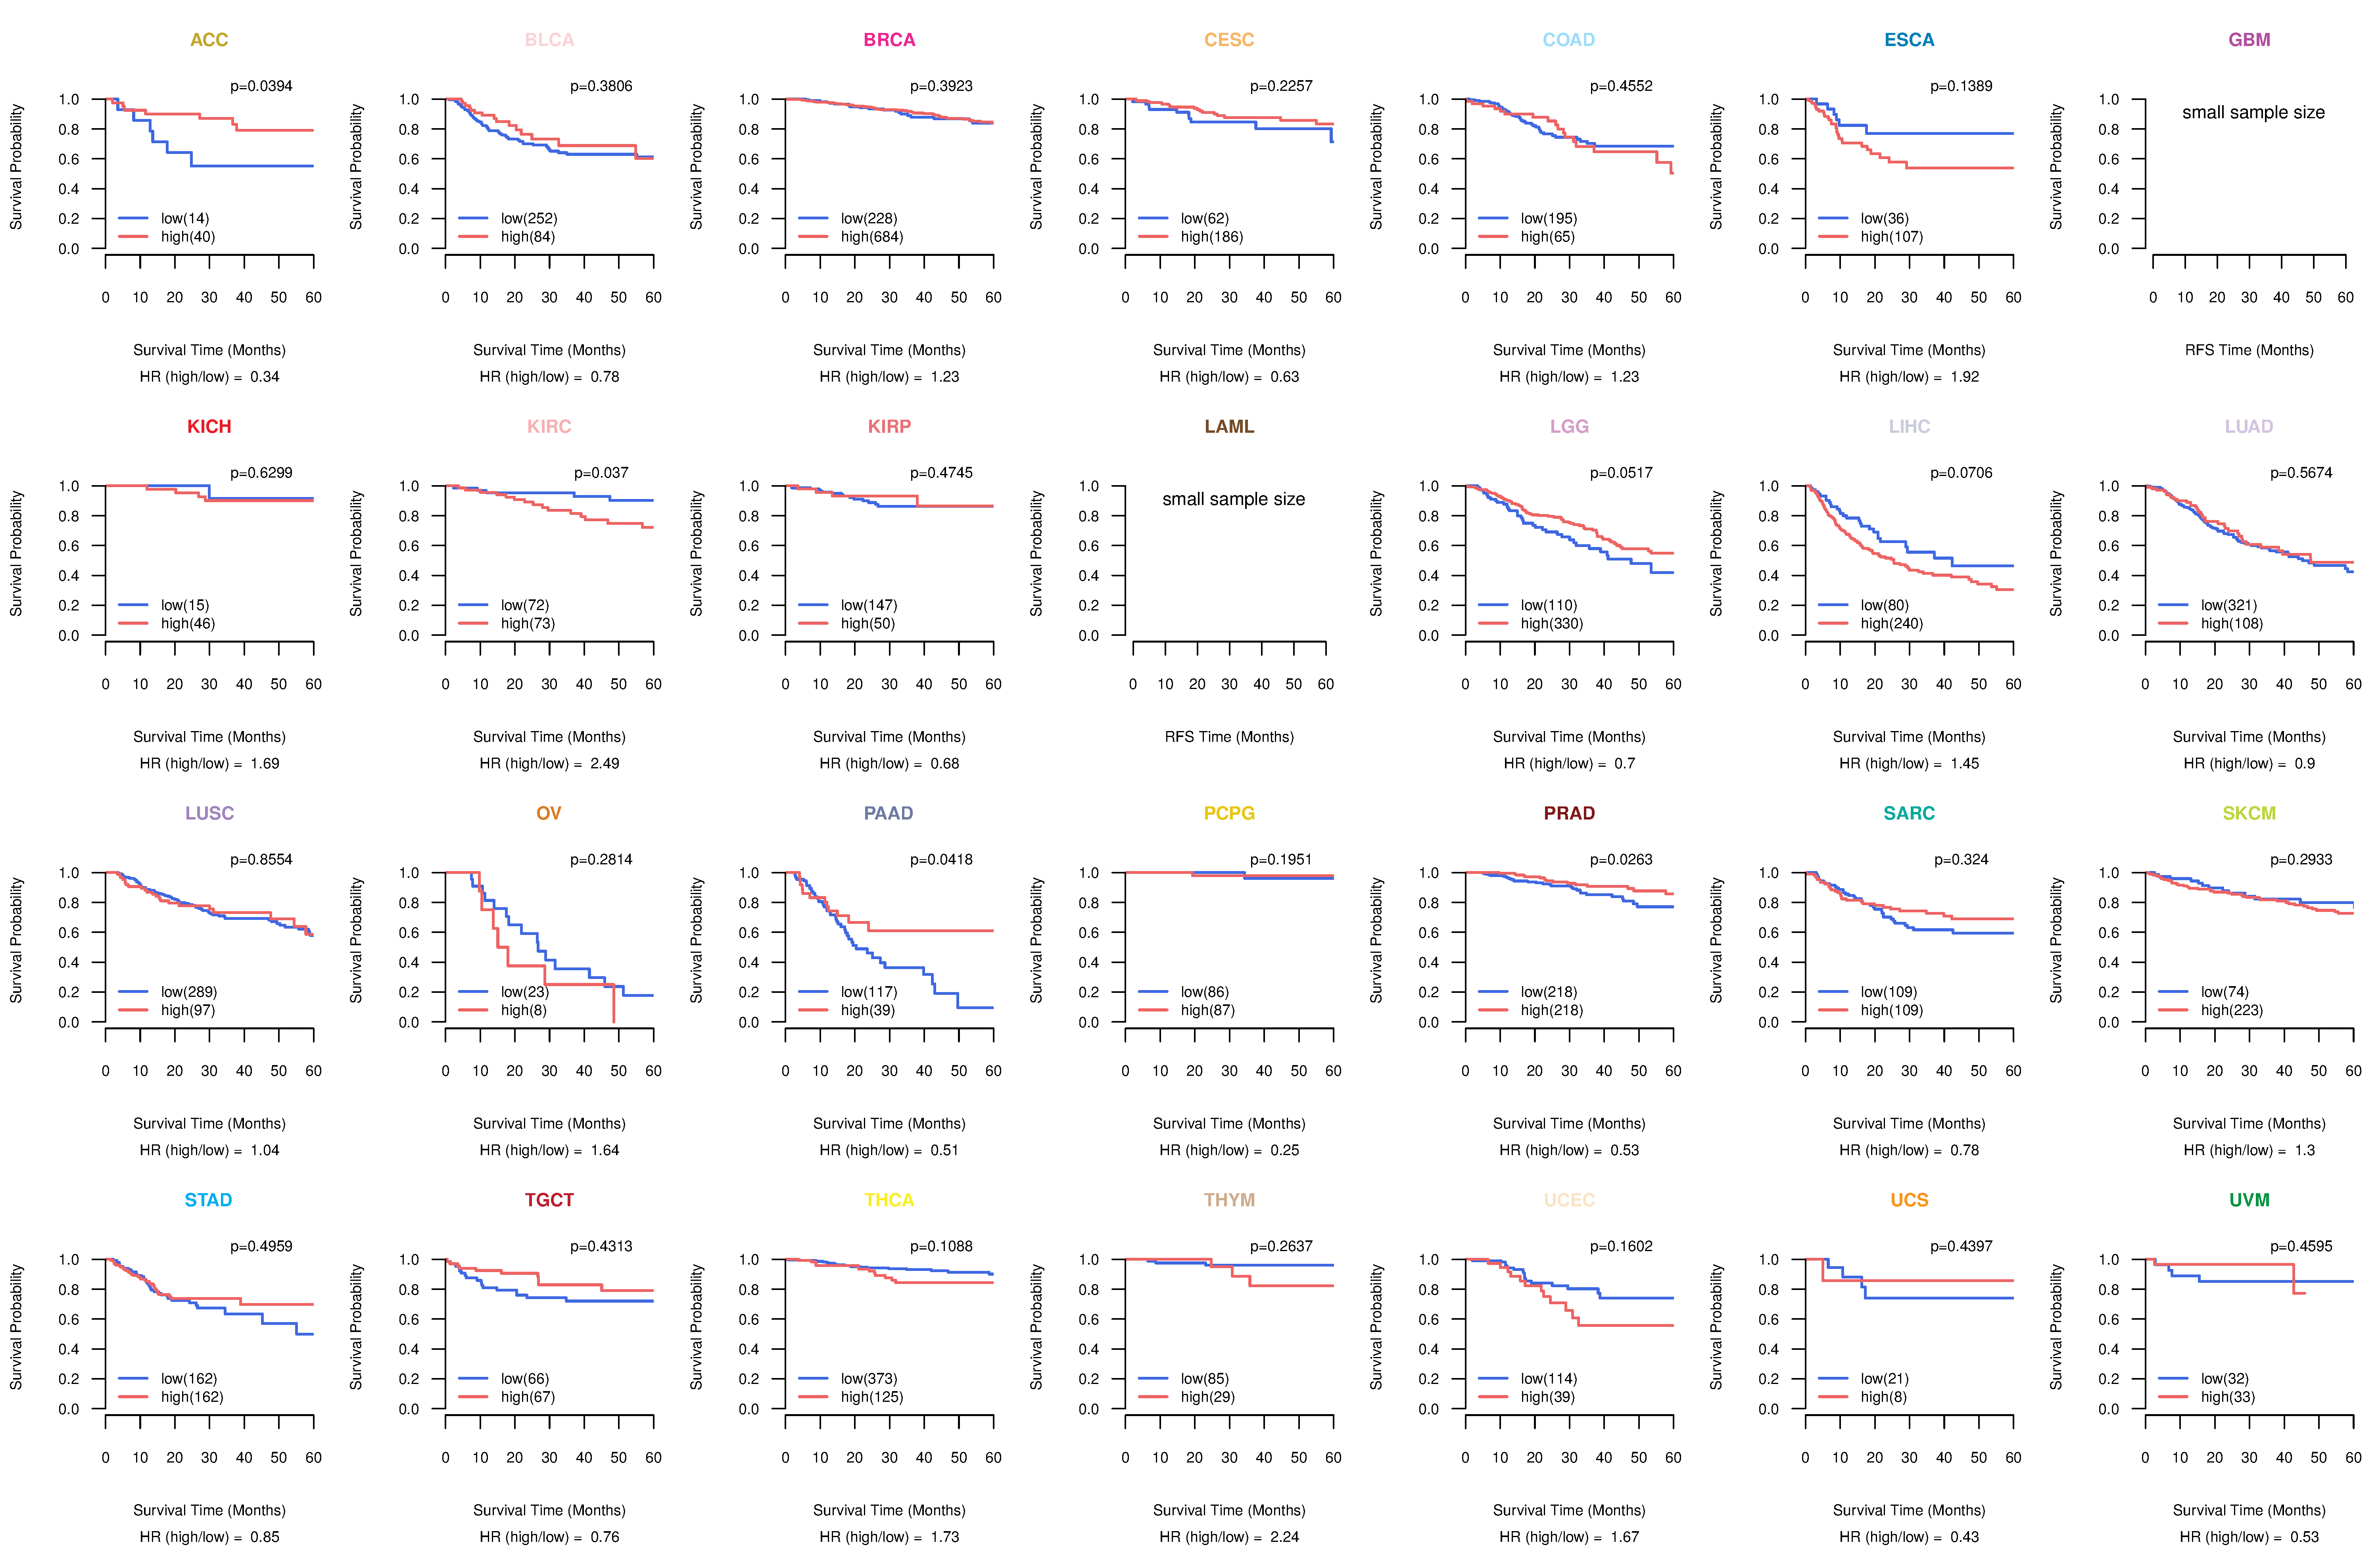
| Kaplan-Meier plots with logrank tests of overall survival (OS) using 28 cancer types (TCGA IlluminaHiSeq_RNASeqV2, pan-cancer normalized log2(norm_counts+1) data, version 2016-08-16) (TCGA clinicalMatrix, phenotype data, version 2016-04-27) * Click on the image to enlarge it in a new window. |
 |
| Kaplan-Meier plots with logrank test of relapse free survival (RFS) using 28 cancer types (TCGA IlluminaHiSeq_RNASeqV2, pan-cancer normalized log2(norm_counts+1) data, version 2016-08-16) (TCGA clinicalMatrix, phenotype data, version 2016-04-27) * Click on the image enlarge it in a new window. |
 |
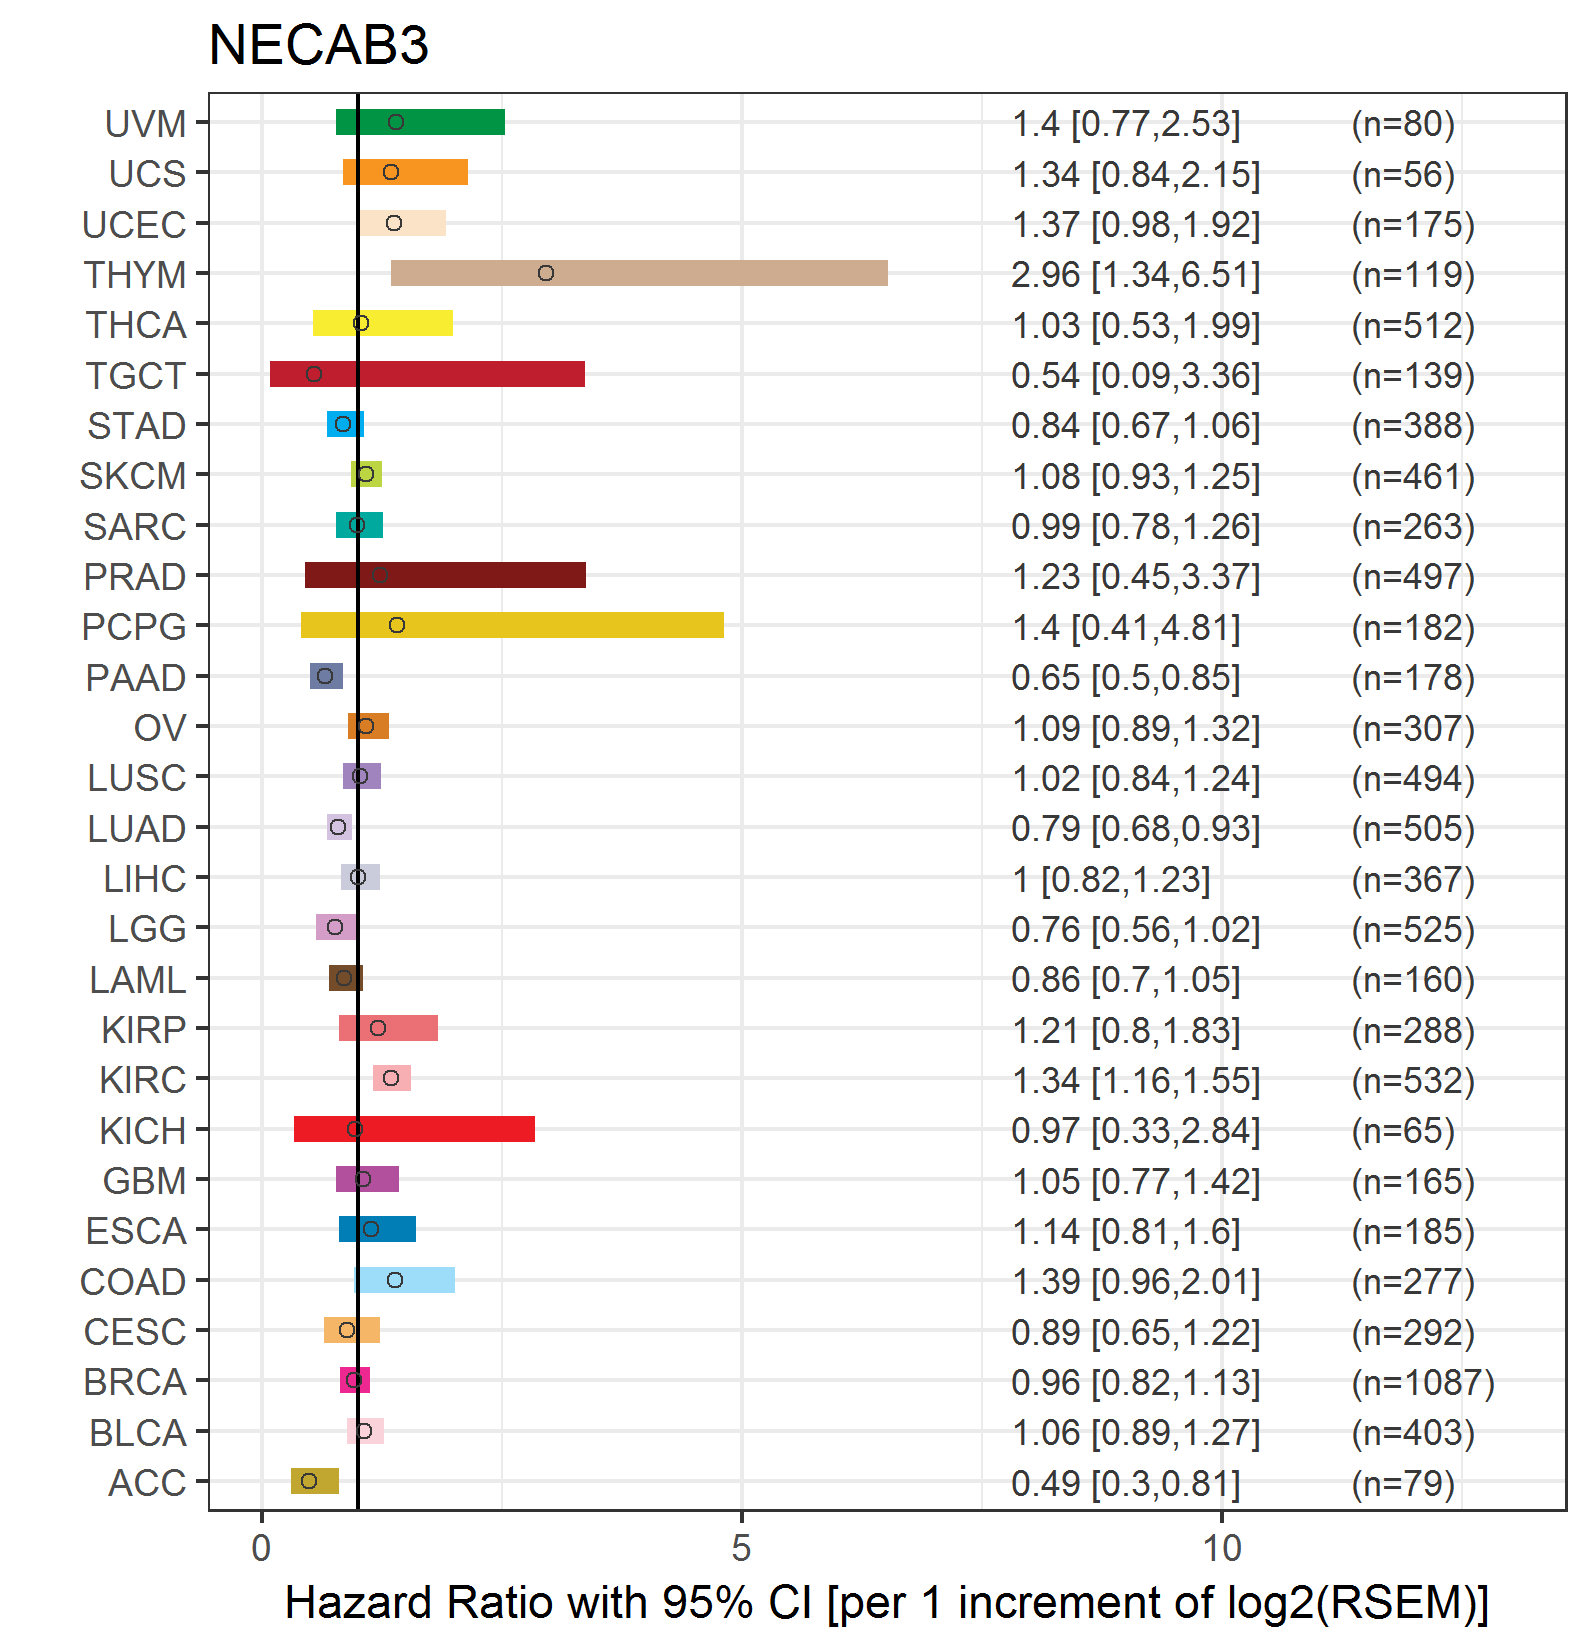
| Forest plot of Cox proportional hazard ratio (HR) and 95% CI of overall survival (OS) using 28 cancer types (TCGA IlluminaHiSeq_RNASeqV2, pan-cancer normalized log2(norm_counts+1) data, version 2016-08-16) (TCGA clinicalMatrix, phenotype data, version 2016-04-27) * Click on the image enlarge it in a new window. |
 |
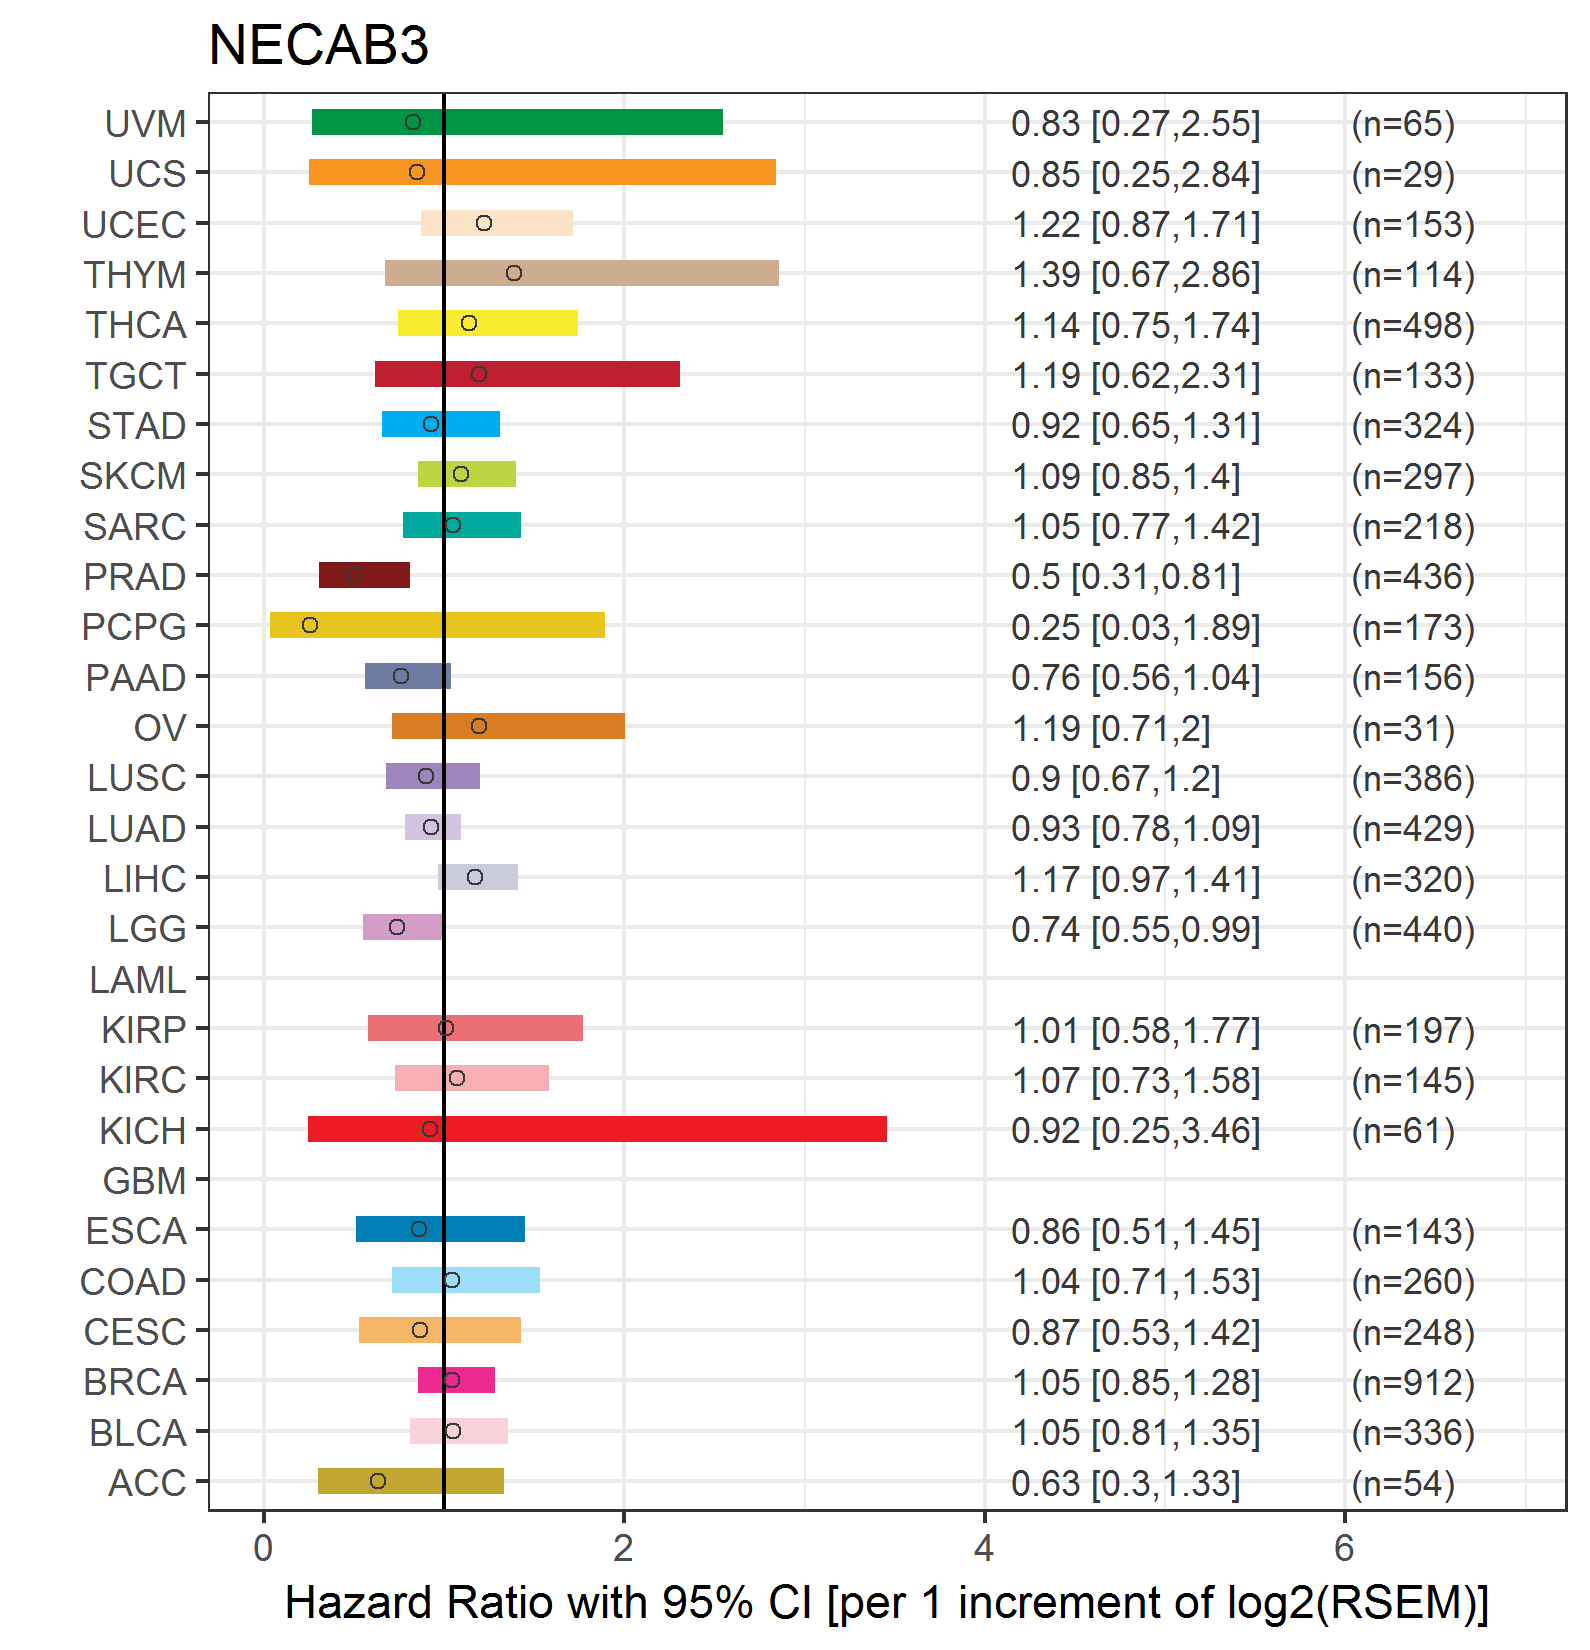
| Forest plot of Cox proportional hazard ratio (HR) and 95% CI of relapse free survival (RFS) using 28 cancer types (TCGA IlluminaHiSeq_RNASeqV2, pan-cancer normalized log2(norm_counts+1) data, version 2016-08-16) (TCGA clinicalMatrix, phenotype data, version 2016-04-27) * Click on the image enlarge it in a new window. |
 |
| Top |
| TissGeneClin for NECAB3 |
| TissGeneDrug for NECAB3 |
| Drug information targeting TissGene (DrugBank Version 5.0.6, 2017-04-01) |
| DrugBank ID | Drug name | Drug activity | Drug type | Drug status |
| Top |
| TissGeneDisease for NECAB3 |
| Disease information associated with TissGene (DisGeNet, 2016-06-01) |
| Disease ID | Disease name | # pubmeds | Source |
| umls:C0006142 | Malignant neoplasm of breast | 1 | BeFree |
| umls:C0678222 | Breast Carcinoma | 1 | BeFree |
|
Copyright 2016-Present - The University of Texas Health Science Center at Houston (UTHealth) Web File Viewing | How to Report, Fraud, Waste and Abuse | State of Texas | Statewide Search | Texas Homeland Security | Site Policies |