 |
| |
| |
| |
| |
| |
| |
|

| TissGeneSummary for UGT2B10 |
 Gene summary Gene summary |
| Basic gene information | Gene symbol | UGT2B10 |
| Gene name | UDP glucuronosyltransferase 2 family, polypeptide B10 | |
| Synonyms | UDPGT2B10 | |
| Cytomap | UCSC genome browser: 4q13.2 | |
| Type of gene | protein-coding | |
| RefGenes | NM_001075.5, NM_001144767.2,NM_001290091.1, | |
| Description | UDP-glucuronosyltransferase 2B10UDPGT 2B10 | |
| Modification date | 20141207 | |
| dbXrefs | MIM : 600070 | |
| HGNC : HGNC | ||
| HPRD : 07193 | ||
| Protein | UniProt: go to UniProt's Cross Reference DB Table | |
| Expression | CleanEX: HS_UGT2B10 | |
| BioGPS: 7365 | ||
| Pathway | NCI Pathway Interaction Database: UGT2B10 | |
| KEGG: UGT2B10 | ||
| REACTOME: UGT2B10 | ||
| Pathway Commons: UGT2B10 | ||
| Context | iHOP: UGT2B10 | |
| ligand binding site mutation search in PubMed: UGT2B10 | ||
| UCL Cancer Institute: UGT2B10 | ||
| Assigned class in TissGDB* | A | |
| Included tissue-specific gene expression resources | ||
| Specific-tissues in normal samples (assigned by TissGDB using HPA, TiGER, and GTEx) | Liver | |
| Cancer types related to the specific-tissues in cancer samples (assigned by TissGDB using TCGA) | LIHC | |
| Reference showing the relevant tissue of UGT2B10 | Regulation of UGT2B Expression and Activity by miR-216b-5p in Liver Cancer Cell Lines. J Pharmacol Exp Ther. 2016 Oct;359(1):182-93. doi: 10.1124/jpet.116.235044. Epub 2016 Jul 29. (pmid:27474751) go to article | |
| Description by TissGene annotations | Cancer gene Significant down-regulated DEG TissgsKTS CNV lost TissGeneKTS | |
| * Class A consists of genes with literature evidence and is part of the cTissGenes. Class B consists of only cTissGenes without additional evidence. The remaining genes belong to Class C. |
| Gene ontology having evidence of Inferred from Direct Assay (IDA) from Entrez |
| GO ID | GO term | PubMed ID |
| Top |
| TissGeneExp for UGT2B10 |
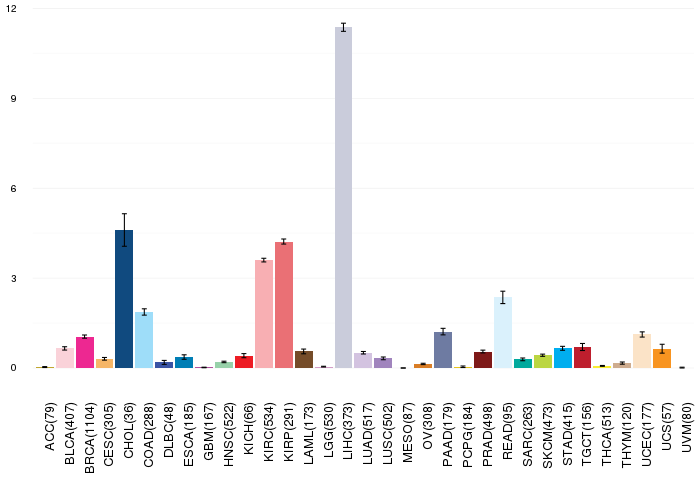
| Gene expressions across 28 cancer types (X-axis: cancer type and Y-axis: log2(norm_counts+1)) (TCGA IlluminaHiSeq_RNASeqV2, pan-cancer normalized log2(norm_counts+1) data, version 2016-08-16) |
 |
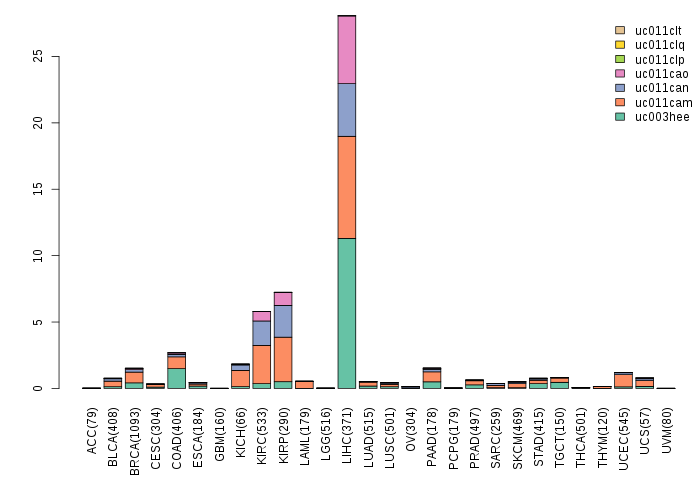
| Gene isoform expressions across 28 cancer types (X-axis: cancer type and Y-axis: log2(norm_counts+1)) (TCGA pan-cancer tcga_rsem_isoform_tpm, version 2016-09-01) |
 |
| Gene expressions across normal tissues of GTEx data (GTEx GTEx_Analysis_v6_RNA-seq_RNA-SeQCv1.1.8_gene_rpkm.gct) - Here, we shows the matched tissue types only among our 28 cancer types. |
 |
| Different expressions across 14 cancer types with more than 10 samples between matched tumors and normals (X-axis: cancer type and Y-axis: log2(norm_counts+1)) (TCGA IlluminaHiSeq_RNASeqV2, pan-cancer normalized log2(norm_counts+1) data, version 2016-08-16) |
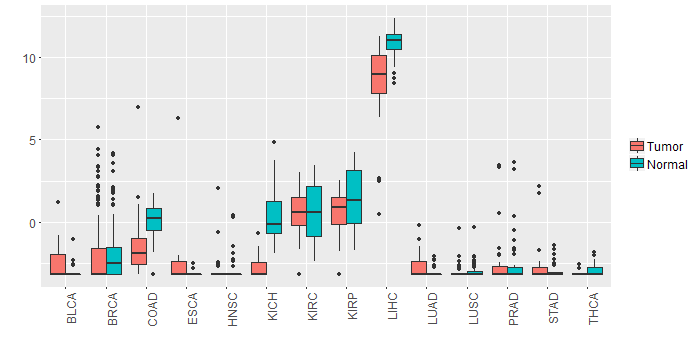 |
| - Significantly differentially expressed cancer types and information. (|Fold change|>1 and FDR<0.05) |
| Cancer type | Mean(exp) in tumor | Mean(exp) in matched normal | Log2FC | P-val. | FDR |
| LIHC | 8.590742595 | 10.84287259 | -2.25213 | 2.52E-08 | 2.02E-07 |
| KICH | -2.697811405 | 0.486648595 | -3.18446 | 2.26E-09 | 1.32E-08 |
| COAD | -1.33306279 | 0.000964133 | -1.334026923 | 0.00688 | 0.015850768 |
| Top |
| TissGene-miRNA for UGT2B10 |
| Significantly anti-correlated miRNAs of TissGene across 28 cancer types (Gene-miRNA relations from TargetScanHuman Relsease 7.1, Conserved_Site_Context_Scores.txt.zip, 06.01.2016) (TCGA IlluminaHiSeq_miRNASeq, log2(RPM+1) data, version 2016-11-21) (TCGA IlluminaHiSeq_RNASeqV2, log2(normalized_count+1) data, version 2016-08-16) (Spearman’s Rank Correlation (p-value<0.05 and coefficient<-0.25)) |
| Cancer type | miRNA id | miRNA accession | P-val. | Coeff. | # samples |
| Top |
| TissGeneMut for UGT2B10 |
| TissGeneSNV for UGT2B10 |
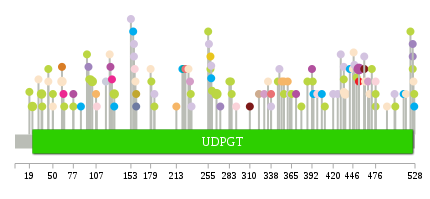
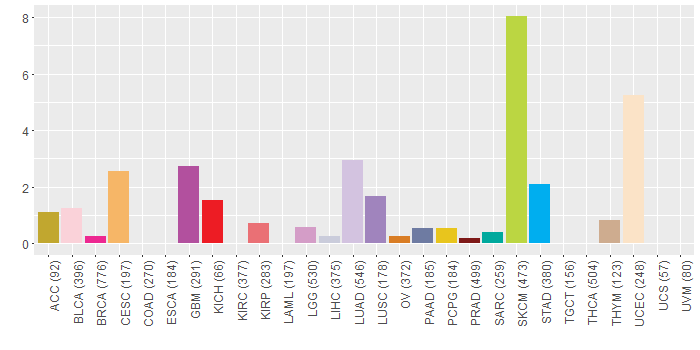
| nsSNV counts per each loci. Different colors of circles represent different cancer types. Circle size denotes number of samples. (TCGA somatic mutation (SNPs and small INDELs) data, version 2016-04-25) * Click on the image to enlarge it in a new window. |
 |
 |
| Somatic nucleotide variants of TissGene across 28 cancer types (X-axis: cancer type and Y-axis: % of mutated samples) The numbers in parentheses are numbers of samples with mutation (nsSNVs). (TCGA somatic mutation (SNPs and small INDELs) data, version 2016-04-25) |
 |
| - nsSNVs sorted by frequency. |
| AAchange | Cancer type | # samples |
| p.A454S | GBM | 4 |
| p.A461S | HNSC | 3 |
| p.P266S | SKCM | 3 |
| p.S436L | UCEC | 2 |
| p.W35* | SKCM | 2 |
| p.S131L | SKCM | 2 |
| p.L62I | UCEC | 2 |
| p.D102N | SKCM | 2 |
| p.G23E | SKCM | 2 |
| p.R258Q | HNSC | 1 |
| p.D128E | BRCA | 1 |
| p.S392_splice | GBM | 1 |
| p.Q233H | LUAD | 1 |
| p.S310P | PRAD | 1 |
| p.R221Q | STAD | 1 |
| p.R468H | HNSC | 1 |
| p.T430R | LUAD | 1 |
| p.D420Y | LUAD | 1 |
| p.D232N | SKCM | 1 |
| p.R446G | UCEC | 1 |
| p.K229N | UCEC | 1 |
| p.M213V | CESC | 1 |
| p.L62I | OV | 1 |
| p.S131P | STAD | 1 |
| p.G349R | LUAD | 1 |
| p.E31* | UCEC | 1 |
| p.V322I | THYM | 1 |
| p.P107S | CESC | 1 |
| p.D434Y | LUAD | 1 |
| p.P286L | SKCM | 1 |
| p.T81A | HNSC | 1 |
| p.S97P | LUSC | 1 |
| p.G184R | SKCM | 1 |
| p.S126T | GBM | 1 |
| p.W222S | HNSC | 1 |
| p.R95K | SKCM | 1 |
| p.D108H | BLCA | 1 |
| p.R527K | SKCM | 1 |
| p.W462R | UCEC | 1 |
| p.E44* | UCEC | 1 |
| p.S260F | SKCM | 1 |
| p.A501S | LUAD | 1 |
| p.T502I | SKCM | 1 |
| p.G347S | SKCM | 1 |
| p.A160P | HNSC | 1 |
| p.Q100* | SKCM | 1 |
| p.A160V | ACC | 1 |
| p.D220Y | HNSC | 1 |
| p.R258Q | SKCM | 1 |
| p.K526Q | UCEC | 1 |
| p.P365S | SKCM | 1 |
| p.H50P | SKCM | 1 |
| p.S19F | SKCM | 1 |
| p.G334D | UCEC | 1 |
| p.Y115D | HNSC | 1 |
| p.F448Y | LUAD | 1 |
| p.M36I | SKCM | 1 |
| p.W355R | CESC | 1 |
| p.W516C | UCEC | 1 |
| p.Q259H | LUAD | 1 |
| p.F513I | STAD | 1 |
| p.E256V | LUAD | 1 |
| p.A461S | LUAD | 1 |
| p.G386E | SKCM | 1 |
| p.E292K | BLCA | 1 |
| p.P283L | SKCM | 1 |
| p.V466L | LGG | 1 |
| p.P77T | GBM | 1 |
| p.D360N | CESC | 1 |
| p.Q259H | STAD | 1 |
| p.T422A | HNSC | 1 |
| p.F461L | PRAD | 1 |
| p.D491N | UCEC | 1 |
| p.V394A | STAD | 1 |
| p.W255* | SKCM | 1 |
| p.F179C | UCEC | 1 |
| p.G378D | SKCM | 1 |
| p.L352M | CESC | 1 |
| p.G184A | LUAD | 1 |
| p.A442V | STAD | 1 |
| p.G525E | SKCM | 1 |
| p.D120H | LIHC | 1 |
| p.G525* | LUSC | 1 |
| p.I447L | UCEC | 1 |
| p.L159M | UCEC | 1 |
| p.F223L | SARC | 1 |
| p.K329N | LGG | 1 |
| p.D434Y | UCEC | 1 |
| p.G363C | LUAD | 1 |
| p.P157H | LUAD | 1 |
| p.R314L | HNSC | 1 |
| p.E180K | SKCM | 1 |
| p.G522E | SKCM | 1 |
| p.E98K | SKCM | 1 |
| p.G338V | LUAD | 1 |
| p.G525V | LUSC | 1 |
| p.T338A | KIRP | 1 |
| p.H50N | UCEC | 1 |
| p.R476* | BLCA | 1 |
| p.F416L | HNSC | 1 |
| p.V156L | STAD | 1 |
| p.R468C | UCEC | 1 |
| p.G409R | SKCM | 1 |
| p.N426Y | LUAD | 1 |
| p.R476* | SKCM | 1 |
| p.M405T | STAD | 1 |
| p.L158V | BLCA | 1 |
| p.R476Q | SKCM | 1 |
| p.K285R | SKCM | 1 |
| p.A454S | KICH | 1 |
| p.F225L | KIRP | 1 |
| p.P271T | LUSC | 1 |
| p.Y125C | UCEC | 1 |
| p.S399* | BLCA | 1 |
| p.A160V | PAAD | 1 |
| p.P77S | SKCM | 1 |
| p.E157* | LUAD | 1 |
| p.P65S | SKCM | 1 |
| p.E37Q | HNSC | 1 |
| p.D434N | SKCM | 1 |
| p.G471E | SKCM | 1 |
| p.D371G | GBM | 1 |
| p.K101E | HNSC | 1 |
| p.E44K | SKCM | 1 |
| p.W231C | LGG | 1 |
| p.P153L | LUAD | 1 |
| p.N87H | STAD | 1 |
| p.L92F | HNSC | 1 |
| p.Q224K | SARC | 1 |
| p.P393L | SKCM | 1 |
| p.D216H | HNSC | 1 |
| p.R258* | PCPG | 1 |
| p.R527G | STAD | 1 |
| p.Q451* | SKCM | 1 |
| p.D64H | BRCA | 1 |
| p.W355* | SKCM | 1 |
| Top |
| TissGeneCNV for UGT2B10 |
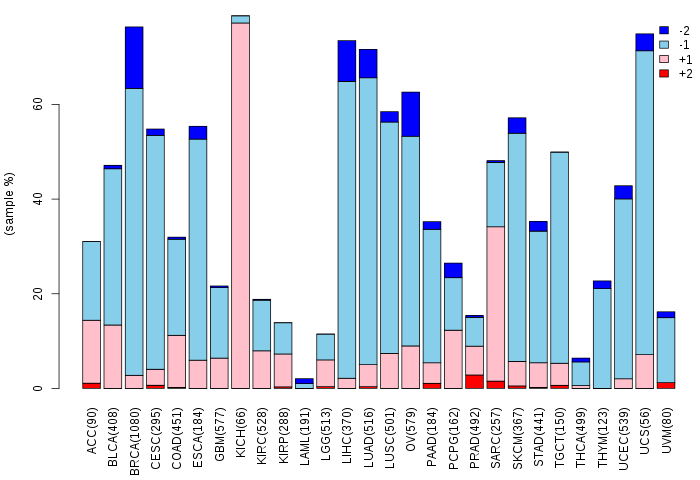
| Copy number variations of TissGene across 28 cancer types (X-axis: cancer type and Y-axis: % of CNV samples) (TCGA Gistic2_CopyNumber_Gistic2_all_data_by_genes, Gistic2 copy number data, version 2016-08-16) |
 |
| Top |
| TissGeneFusions for UGT2B10 |
| Fusion genes including TissGene (ChimerDB 3.0, 2016-12-01 and TCGA fusion Portal 2015-12-01) |
| Database | Src | Cancer type | Sample | Fusion gene | ORF | 5'-gene BP | 3'-gene BP |
| Chimerdb3.0 | ChiTaRs | NA | BP239062 | SLC16A1-UGT2B10 | chr1:113456634 | chr4:69681713 |
| Top |
| TissGeneNet for UGT2B10 |
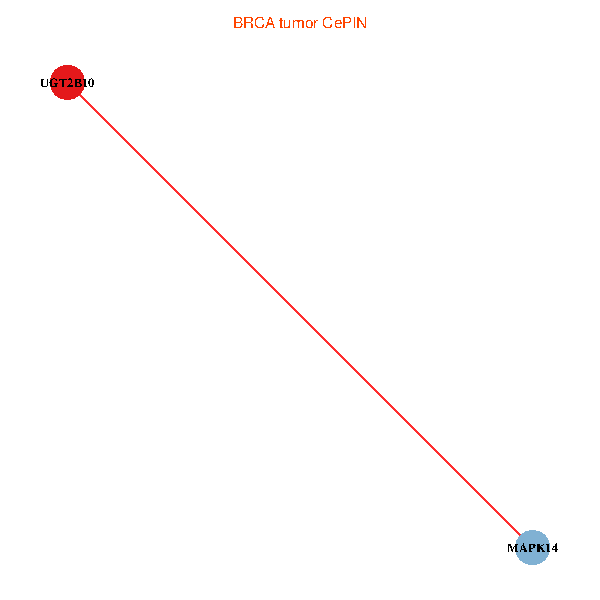
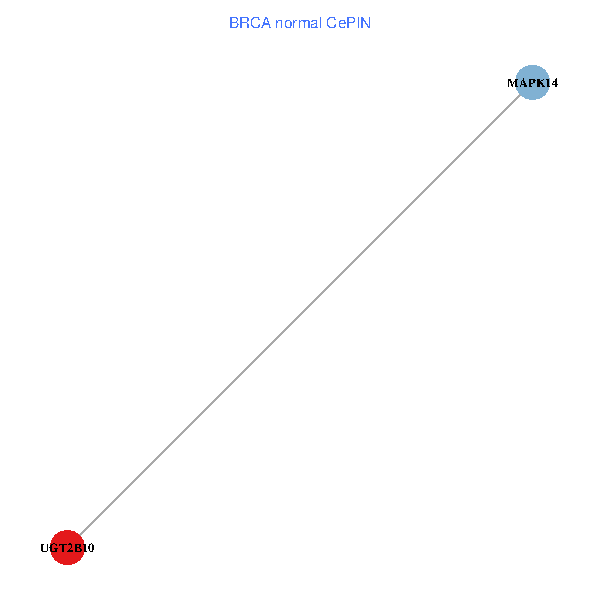
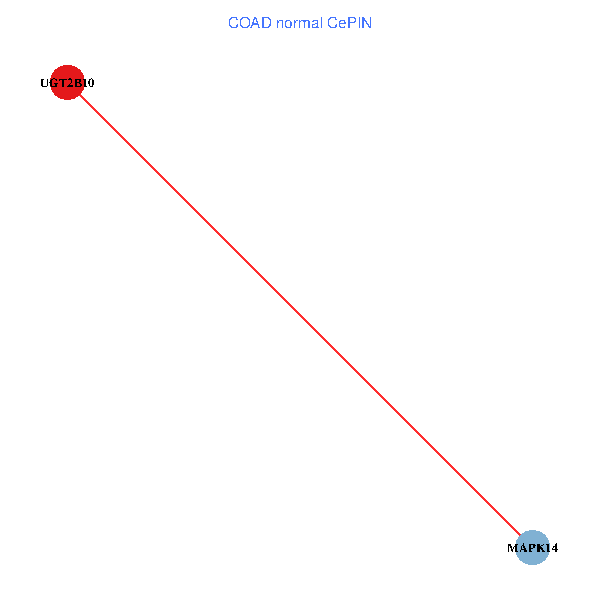
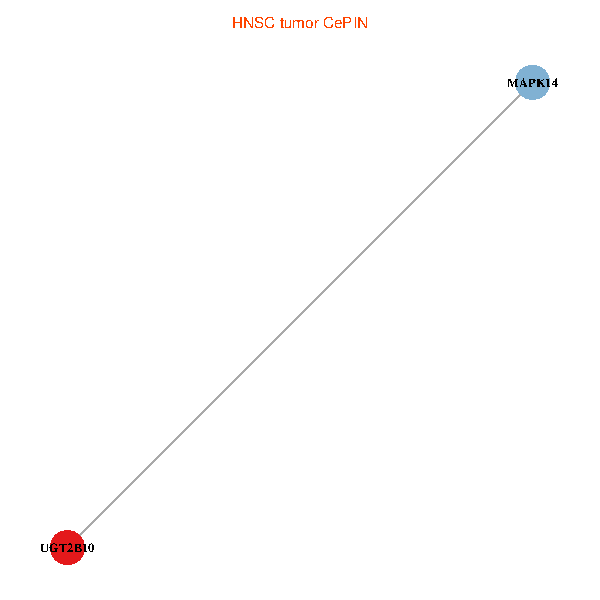
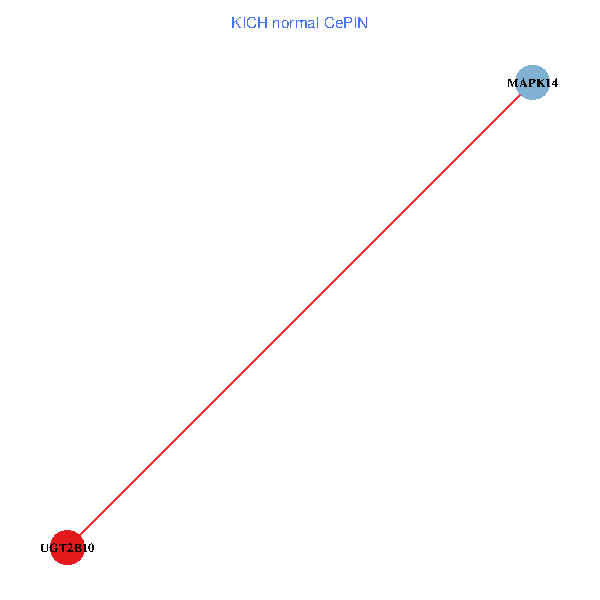
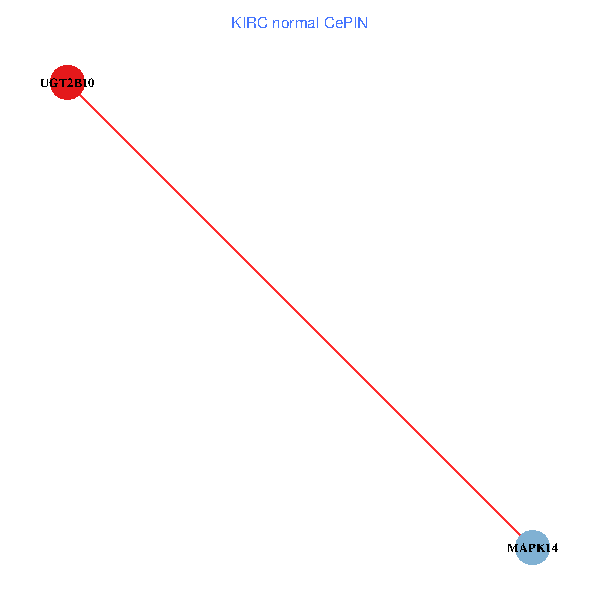
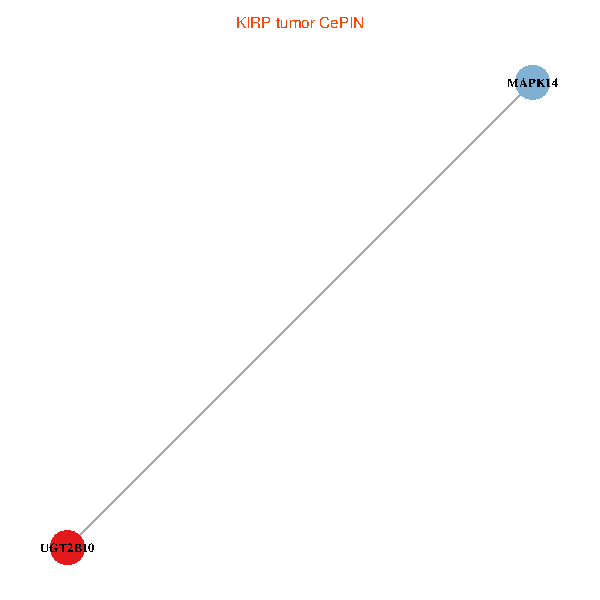
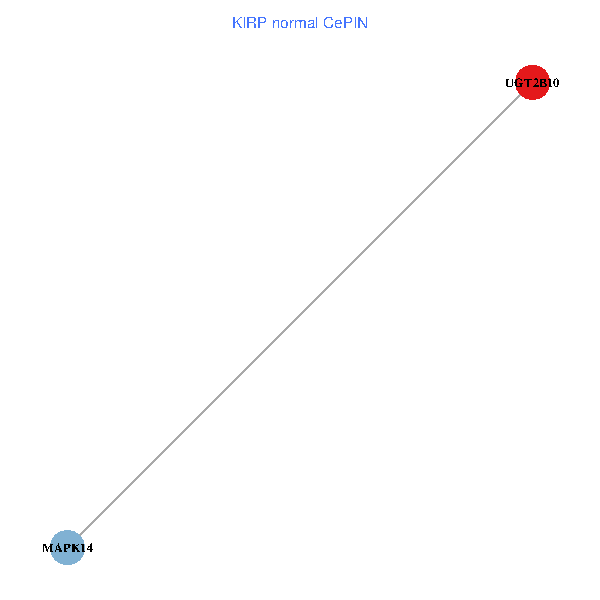
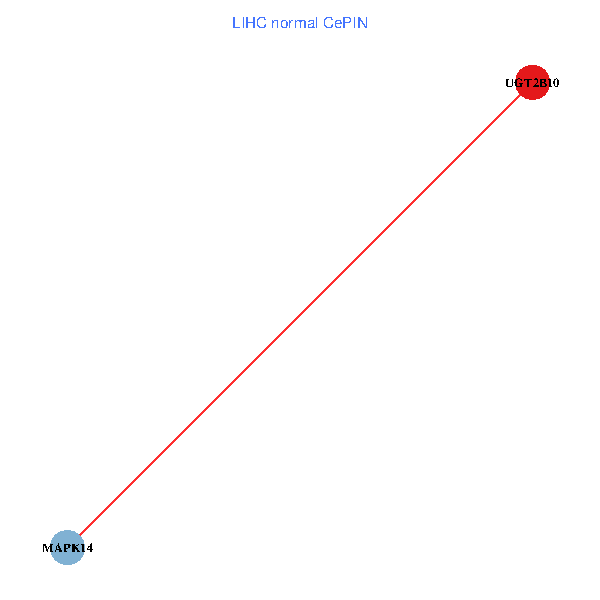
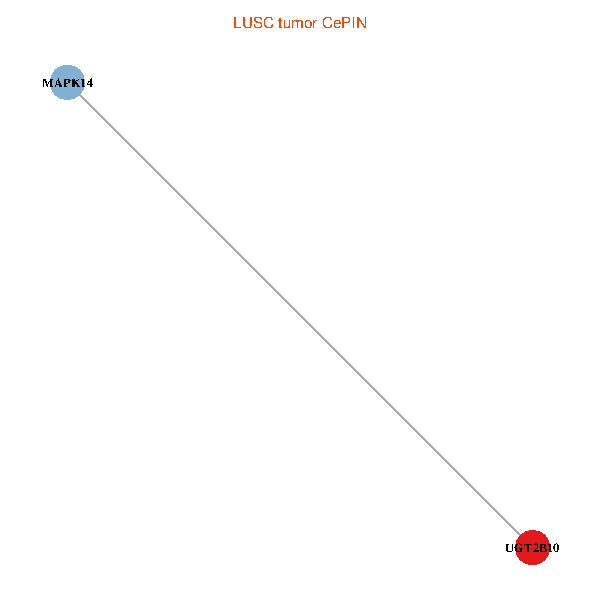
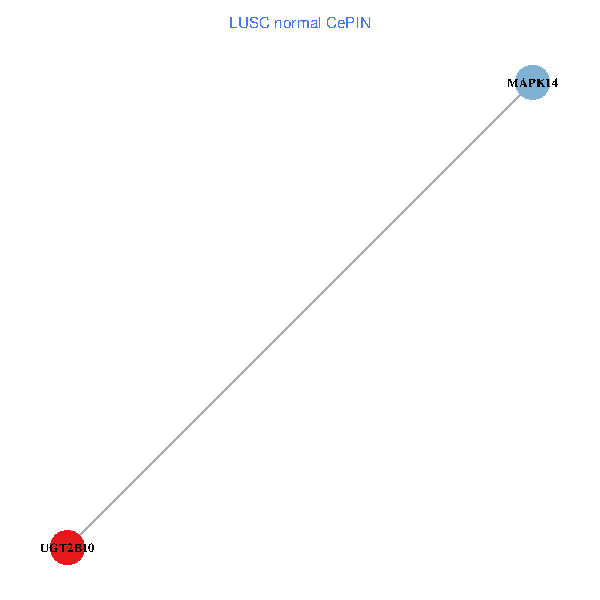
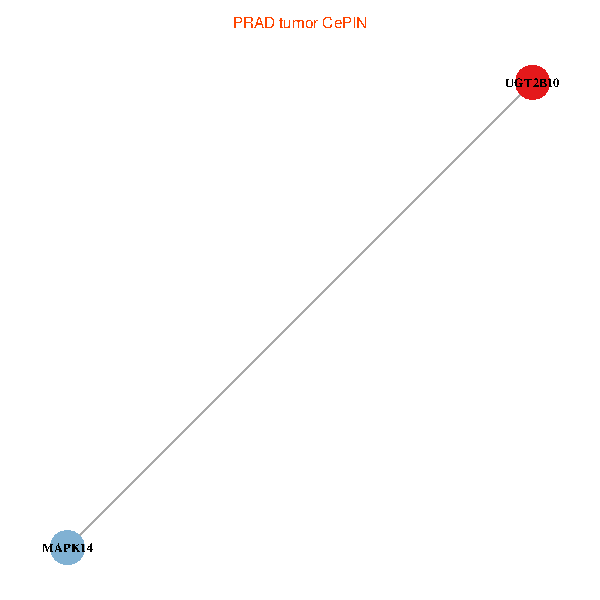
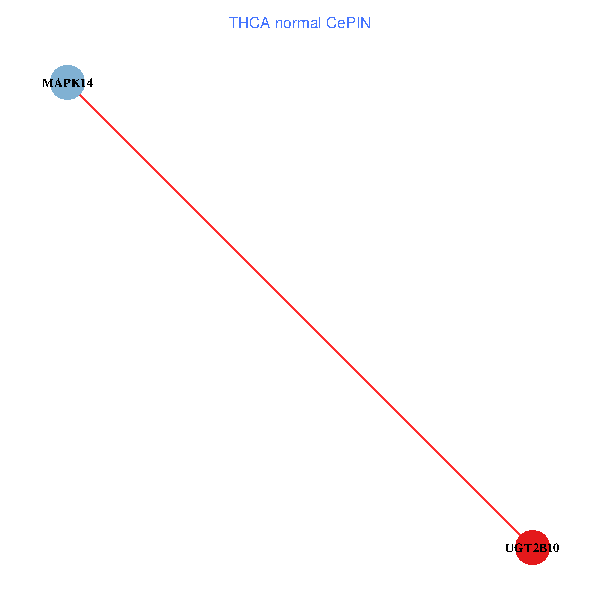
| Co-expressed gene networks based on protein-protein interaction data (CePIN) (TCGA IlluminaHiSeq_RNASeqV2, pan-cancer normalized log2(norm_counts+1) data, version 2016-08-16) (PINA2 ppi data) |
| BRCA (tumor) | BRCA (normal) |
| UGT2B10, MAPK14 (tumor) | UGT2B10, MAPK14 (normal) |
 |  |
| COAD (tumor) | COAD (normal) |
| UGT2B10, MAPK14 (tumor) | UGT2B10, MAPK14 (normal) |
 |  |
| HNSC (tumor) | HNSC (normal) |
| UGT2B10, MAPK14 (tumor) | UGT2B10, MAPK14 (normal) |
 |  |
| KICH (tumor) | KICH (normal) |
| UGT2B10, MAPK14 (tumor) | UGT2B10, MAPK14 (normal) |
 |  |
| KIRC (tumor) | KIRC (normal) |
| UGT2B10, MAPK14 (tumor) | UGT2B10, MAPK14 (normal) |
 |  |
| KIRP (tumor) | KIRP (normal) |
| UGT2B10, MAPK14 (tumor) | UGT2B10, MAPK14 (normal) |
 |  |
| LIHC (tumor) | LIHC (normal) |
| UGT2B10, MAPK14 (tumor) | UGT2B10, MAPK14 (normal) |
 |  |
| LUAD (tumor) | LUAD (normal) |
| UGT2B10, MAPK14 (tumor) | UGT2B10, MAPK14 (normal) |
 |  |
| LUSC (tumor) | LUSC (normal) |
| UGT2B10, MAPK14 (tumor) | UGT2B10, MAPK14 (normal) |
 |  |
| PRAD (tumor) | PRAD (normal) |
| UGT2B10, MAPK14 (tumor) | UGT2B10, MAPK14 (normal) |
 |  |
| STAD (tumor) | STAD (normal) |
| UGT2B10, MAPK14 (tumor) | UGT2B10, MAPK14 (normal) |
 |  |
| THCA (tumor) | THCA (normal) |
| UGT2B10, MAPK14 (tumor) | UGT2B10, MAPK14 (normal) |
 |  |
| Top |
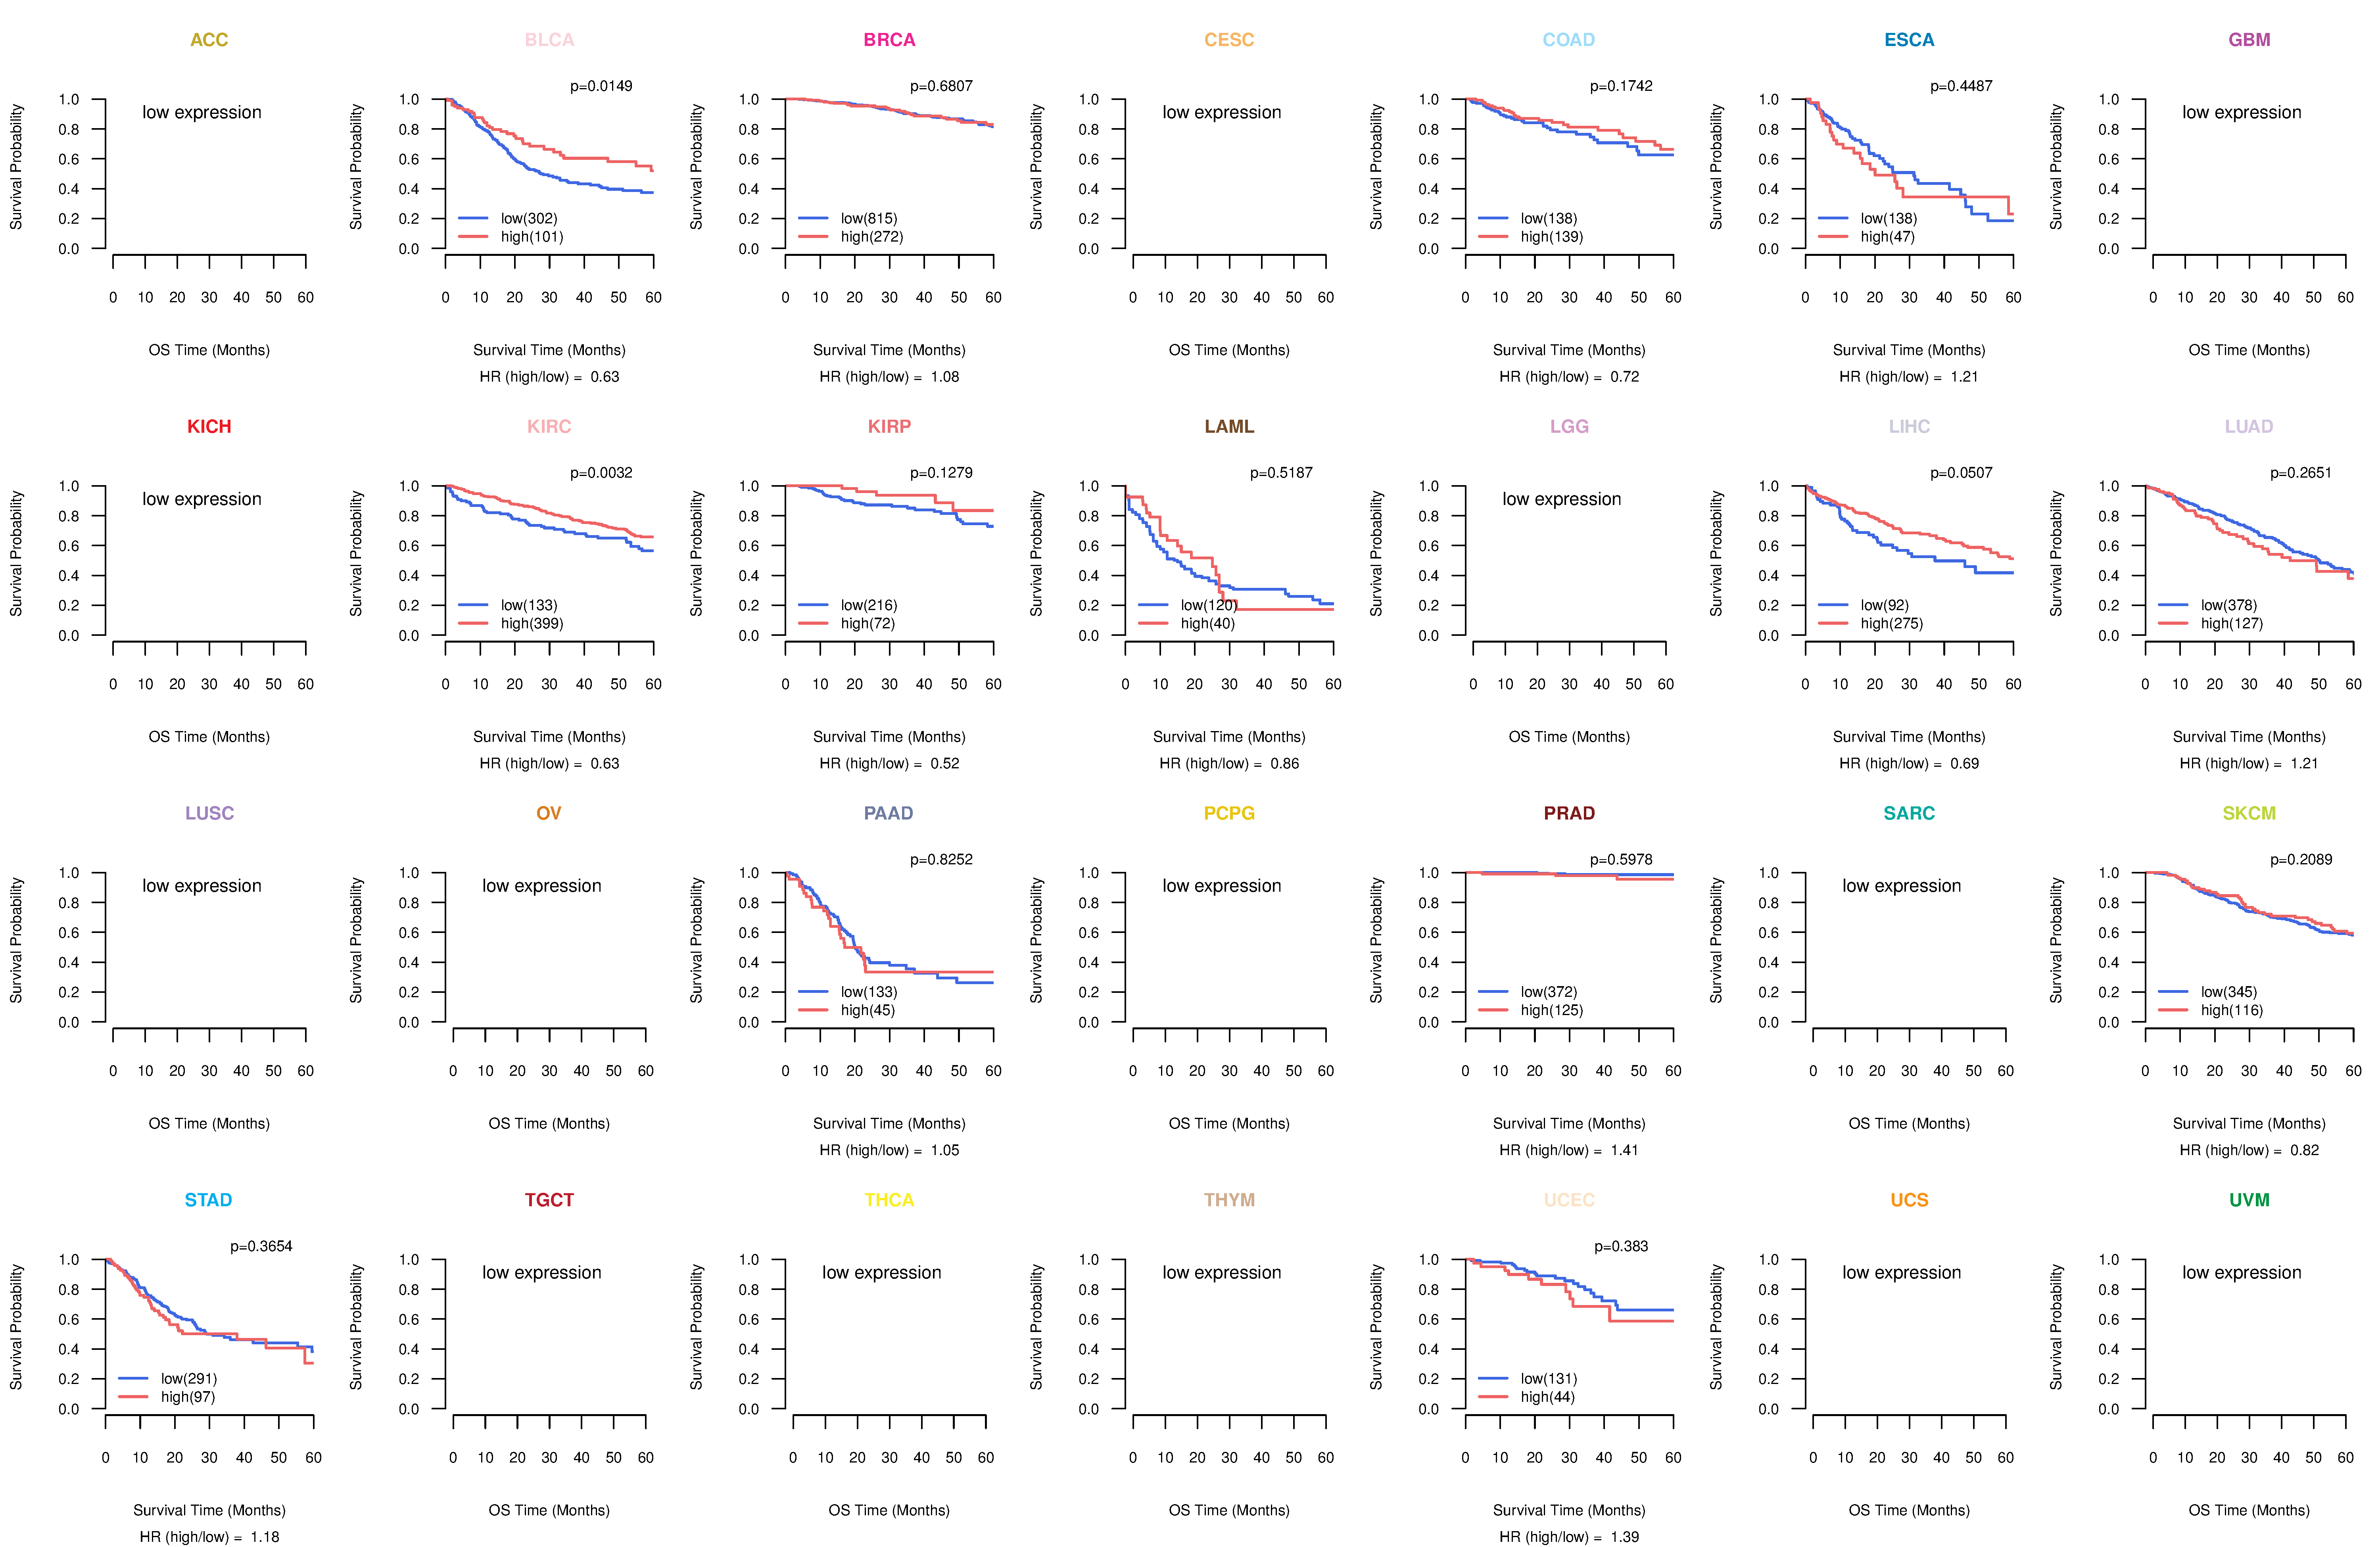
| TissGeneProg for UGT2B10 |
| Kaplan-Meier plots with logrank tests of overall survival (OS) using 28 cancer types (TCGA IlluminaHiSeq_RNASeqV2, pan-cancer normalized log2(norm_counts+1) data, version 2016-08-16) (TCGA clinicalMatrix, phenotype data, version 2016-04-27) * Click on the image to enlarge it in a new window. |
 |
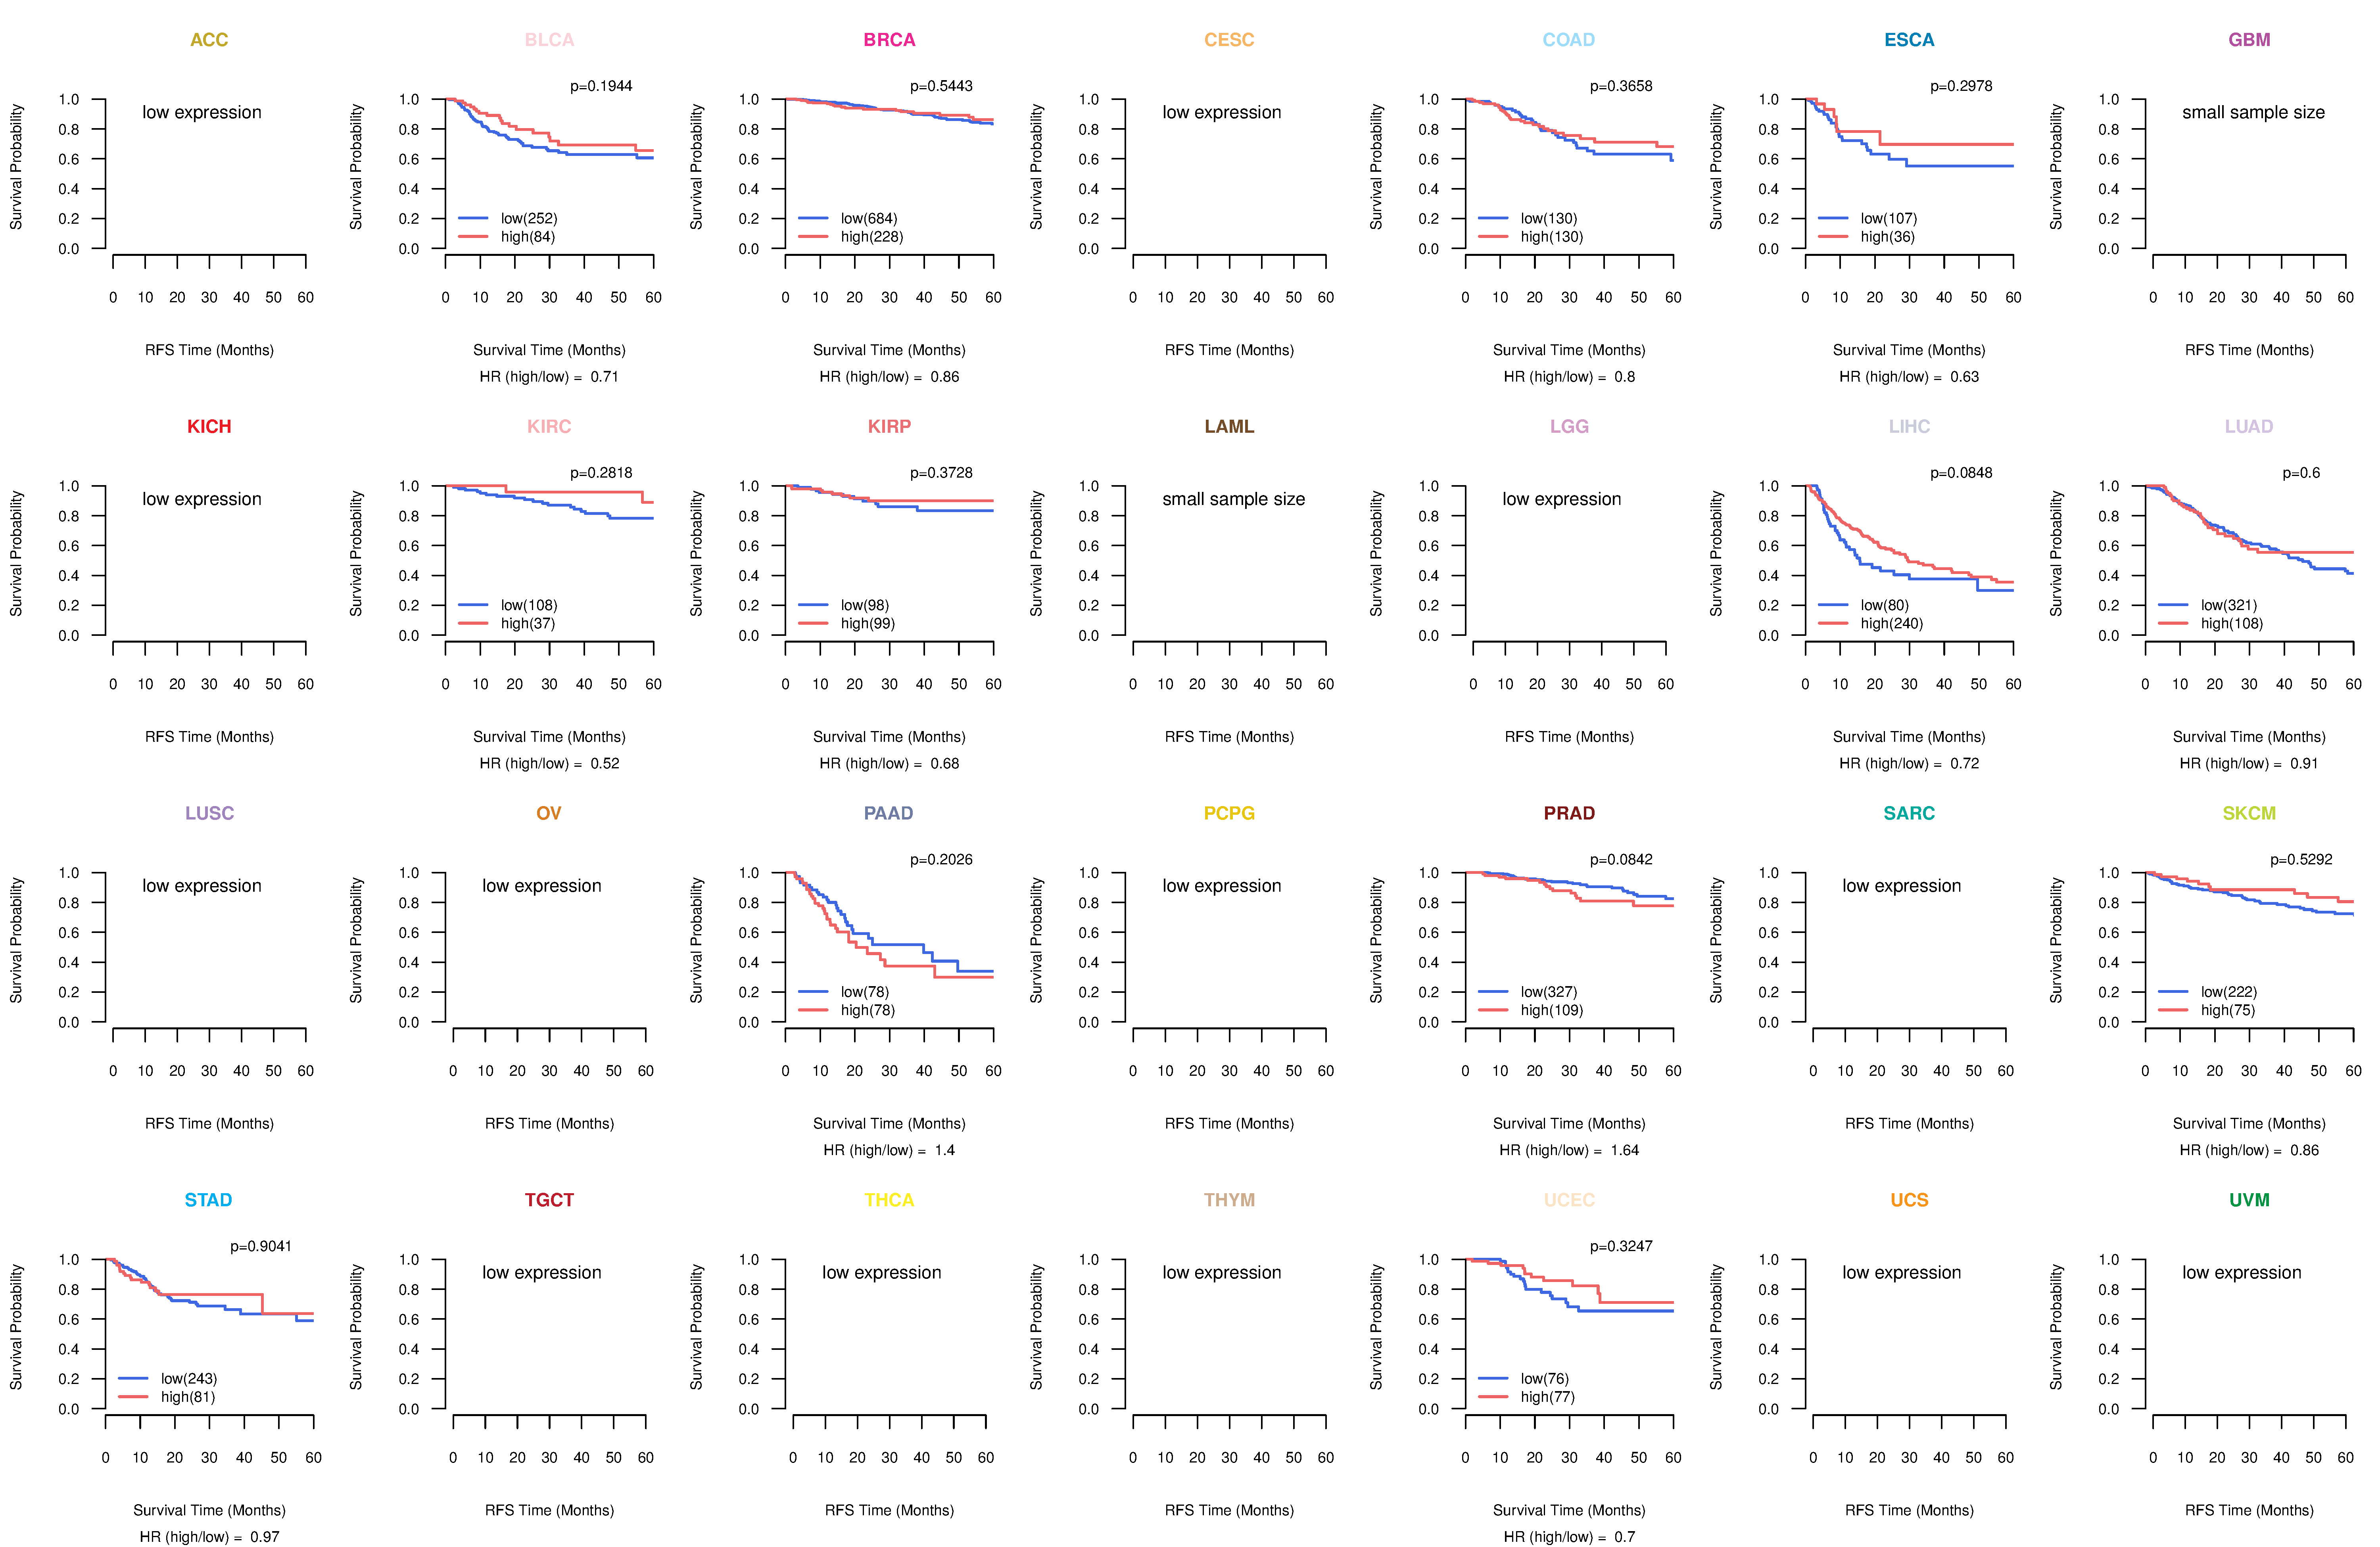
| Kaplan-Meier plots with logrank test of relapse free survival (RFS) using 28 cancer types (TCGA IlluminaHiSeq_RNASeqV2, pan-cancer normalized log2(norm_counts+1) data, version 2016-08-16) (TCGA clinicalMatrix, phenotype data, version 2016-04-27) * Click on the image enlarge it in a new window. |
 |
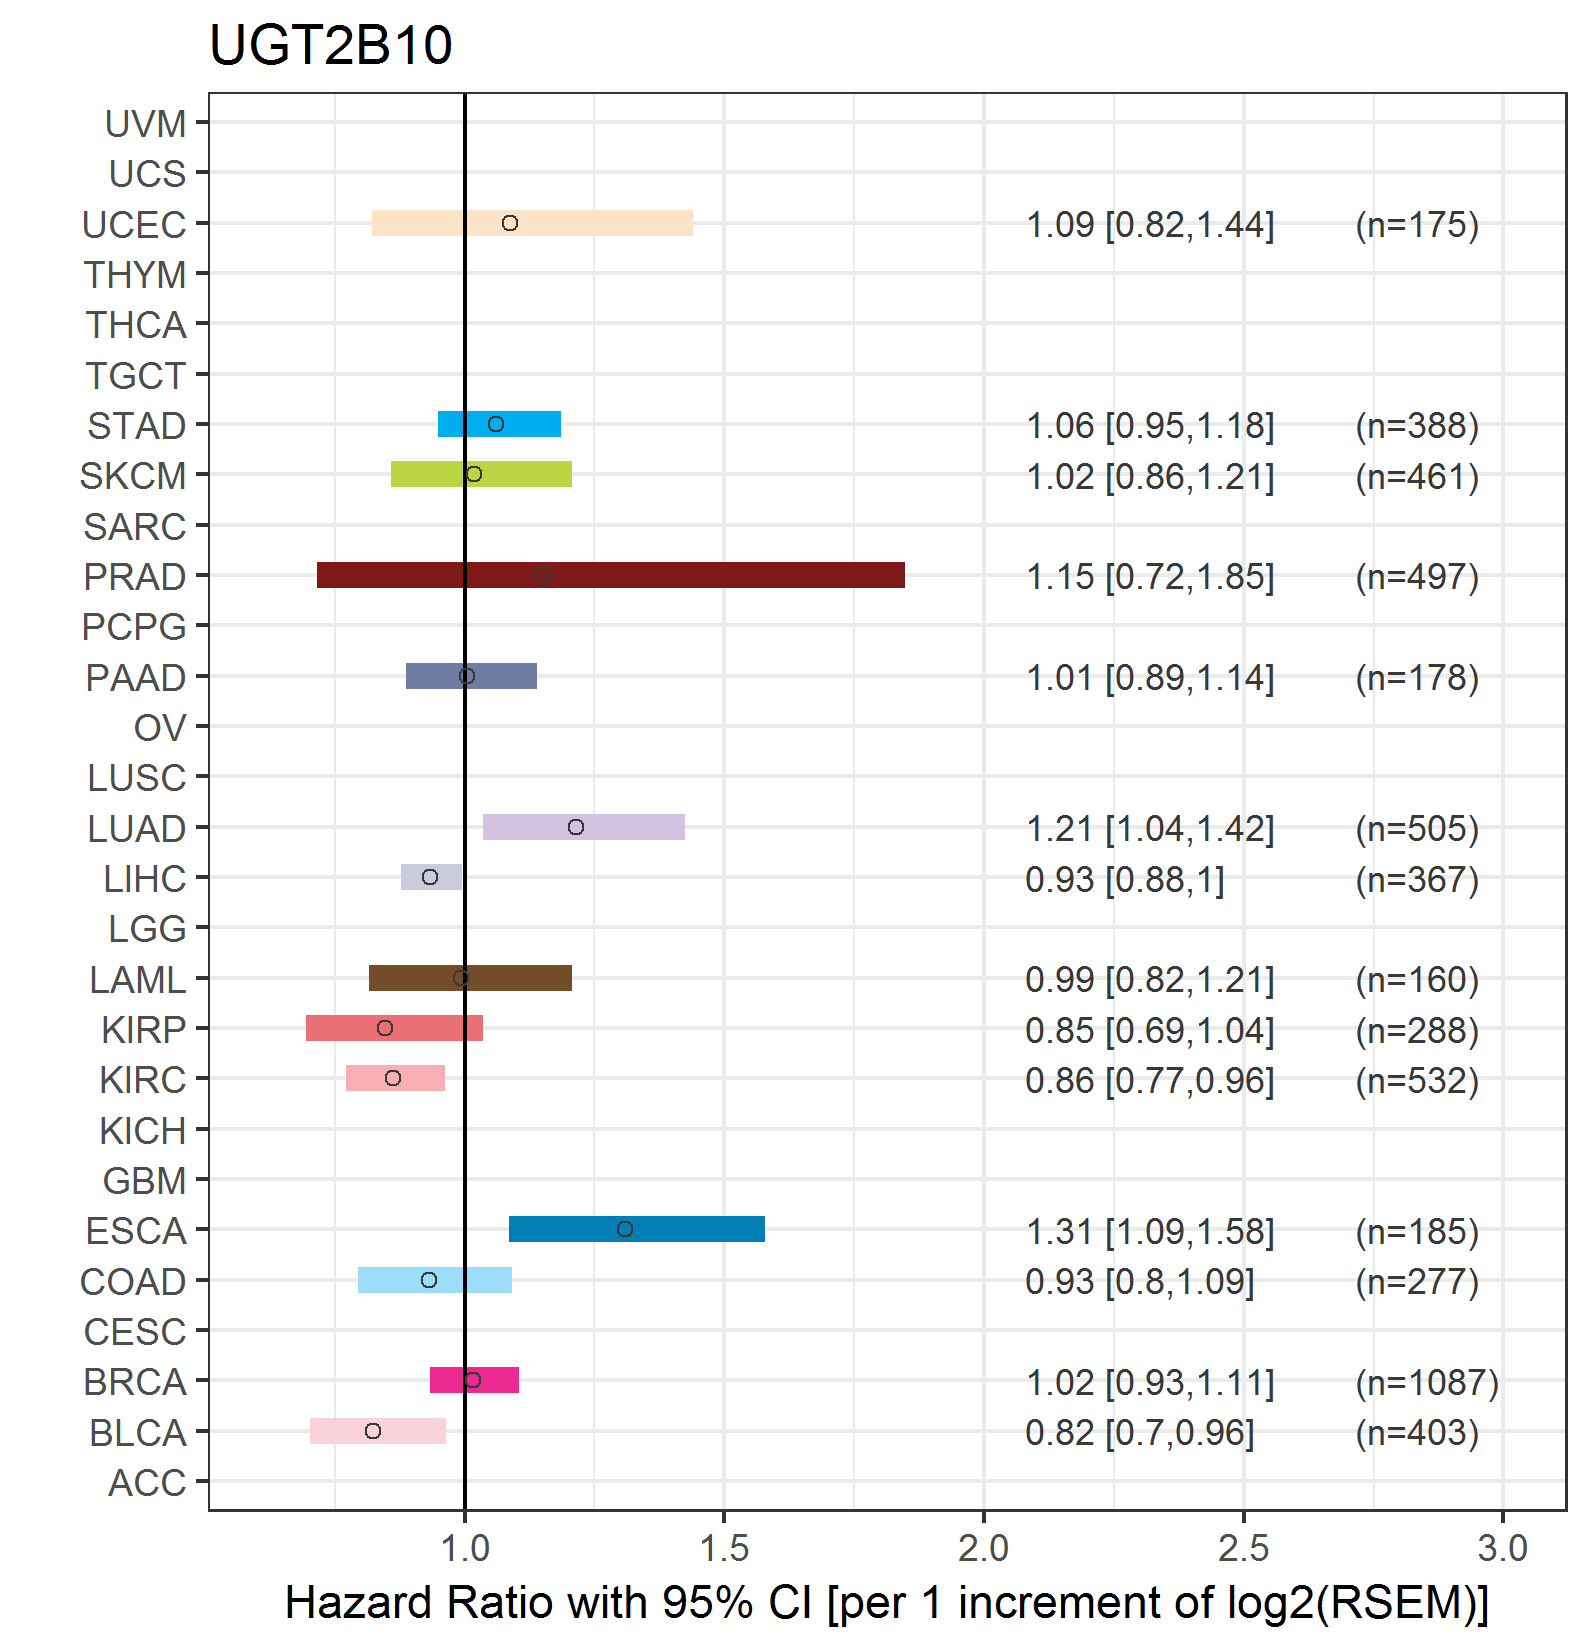
| Forest plot of Cox proportional hazard ratio (HR) and 95% CI of overall survival (OS) using 28 cancer types (TCGA IlluminaHiSeq_RNASeqV2, pan-cancer normalized log2(norm_counts+1) data, version 2016-08-16) (TCGA clinicalMatrix, phenotype data, version 2016-04-27) * Click on the image enlarge it in a new window. |
 |
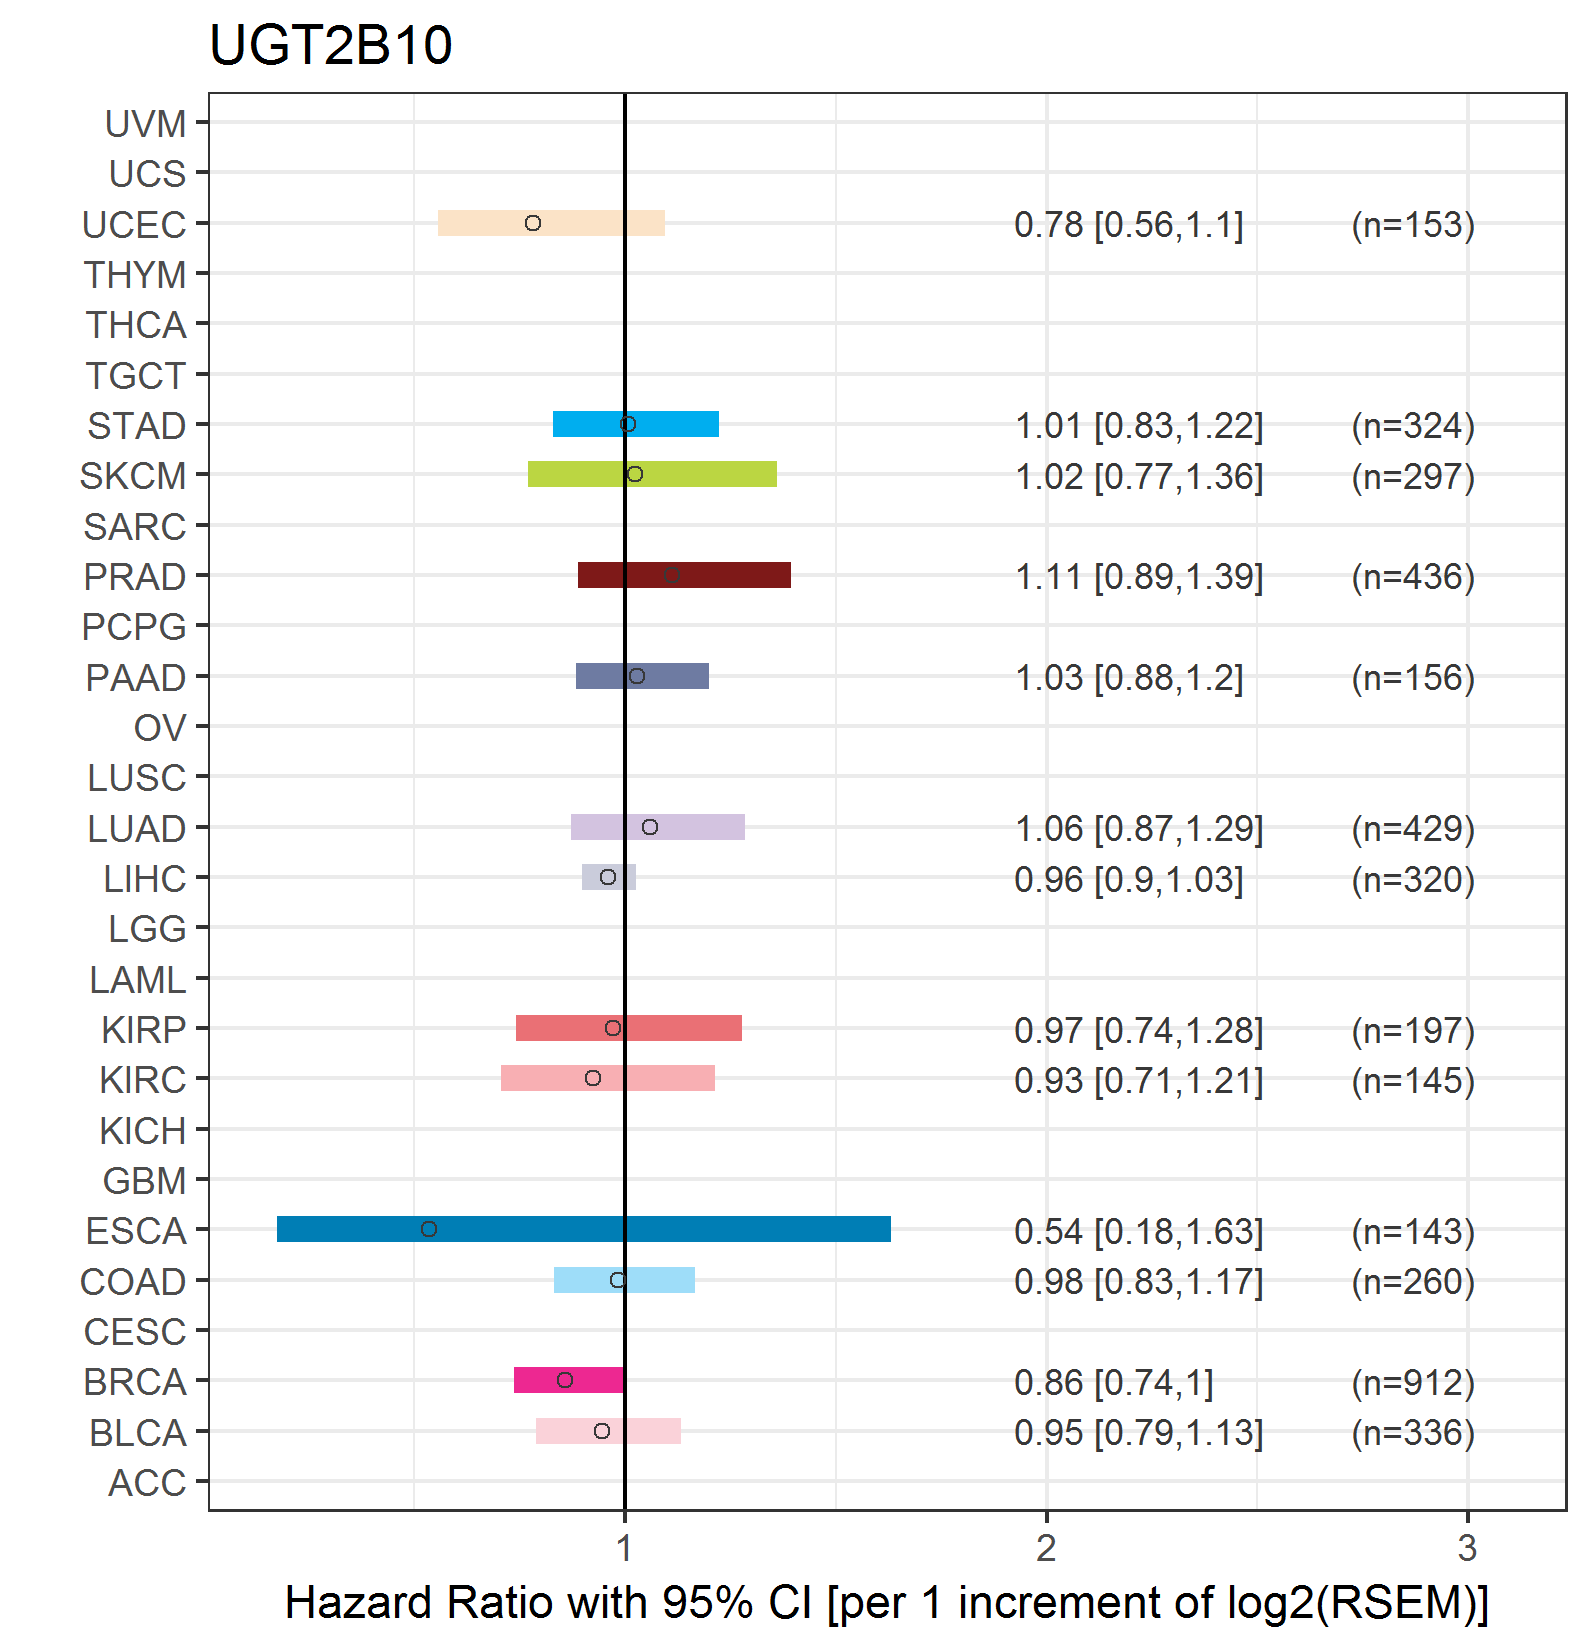
| Forest plot of Cox proportional hazard ratio (HR) and 95% CI of relapse free survival (RFS) using 28 cancer types (TCGA IlluminaHiSeq_RNASeqV2, pan-cancer normalized log2(norm_counts+1) data, version 2016-08-16) (TCGA clinicalMatrix, phenotype data, version 2016-04-27) * Click on the image enlarge it in a new window. |
 |
| Top |
| TissGeneClin for UGT2B10 |
| TissGeneDrug for UGT2B10 |
| Drug information targeting TissGene (DrugBank Version 5.0.6, 2017-04-01) |
| DrugBank ID | Drug name | Drug activity | Drug type | Drug status |
| Top |
| TissGeneDisease for UGT2B10 |
| Disease information associated with TissGene (DisGeNet, 2016-06-01) |
| Disease ID | Disease name | # pubmeds | Source |
| umls:C0025202 | melanoma | 1 | CTD_human |
| umls:C1846502 | Mammographic Density | 1 | BeFree |
|
Copyright 2016-Present - The University of Texas Health Science Center at Houston (UTHealth) Web File Viewing | How to Report, Fraud, Waste and Abuse | State of Texas | Statewide Search | Texas Homeland Security | Site Policies |