 |
| |
| |
| |
| |
| |
| |
|

| TissGeneSummary for MOGAT2 |
 Gene summary Gene summary |
| Basic gene information | Gene symbol | MOGAT2 |
| Gene name | monoacylglycerol O-acyltransferase 2 | |
| Synonyms | DGAT2L5|MGAT2 | |
| Cytomap | UCSC genome browser: 11q13.5 | |
| Type of gene | protein-coding | |
| RefGenes | NM_025098.2, | |
| Description | 2-acylglycerol O-acyltransferase 2acyl CoA:monoacylglycerol acyltransferase 2acyl-CoA:monoacylglycerol acyltransferase 2diacylglycerol O-acyltransferase candidate 5diacylglycerol acyltransferase 2-like protein 5hDC5hMGAT2 | |
| Modification date | 20141207 | |
| dbXrefs | MIM : 610270 | |
| HGNC : HGNC | ||
| HPRD : 11367 | ||
| Protein | UniProt: go to UniProt's Cross Reference DB Table | |
| Expression | CleanEX: HS_MOGAT2 | |
| BioGPS: 80168 | ||
| Pathway | NCI Pathway Interaction Database: MOGAT2 | |
| KEGG: MOGAT2 | ||
| REACTOME: MOGAT2 | ||
| Pathway Commons: MOGAT2 | ||
| Context | iHOP: MOGAT2 | |
| ligand binding site mutation search in PubMed: MOGAT2 | ||
| UCL Cancer Institute: MOGAT2 | ||
| Assigned class in TissGDB* | C | |
| Included tissue-specific gene expression resources | TiGER,GTEx | |
| Specific-tissues in normal samples (assigned by TissGDB using HPA, TiGER, and GTEx) | LiverStomach | |
| Cancer types related to the specific-tissues in cancer samples (assigned by TissGDB using TCGA) | LIHCSTAD | |
| Reference showing the relevant tissue of MOGAT2 | ||
| Description by TissGene annotations | ||
| * Class A consists of genes with literature evidence and is part of the cTissGenes. Class B consists of only cTissGenes without additional evidence. The remaining genes belong to Class C. |
| Gene ontology having evidence of Inferred from Direct Assay (IDA) from Entrez |
| GO ID | GO term | PubMed ID |
| Top |
| TissGeneExp for MOGAT2 |
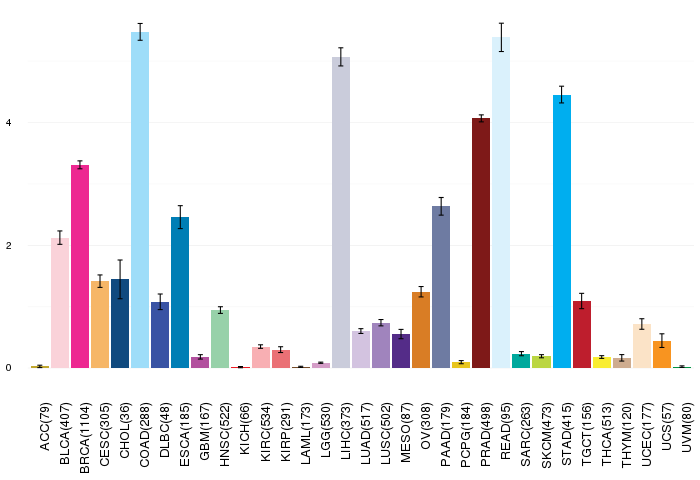
| Gene expressions across 28 cancer types (X-axis: cancer type and Y-axis: log2(norm_counts+1)) (TCGA IlluminaHiSeq_RNASeqV2, pan-cancer normalized log2(norm_counts+1) data, version 2016-08-16) |
 |
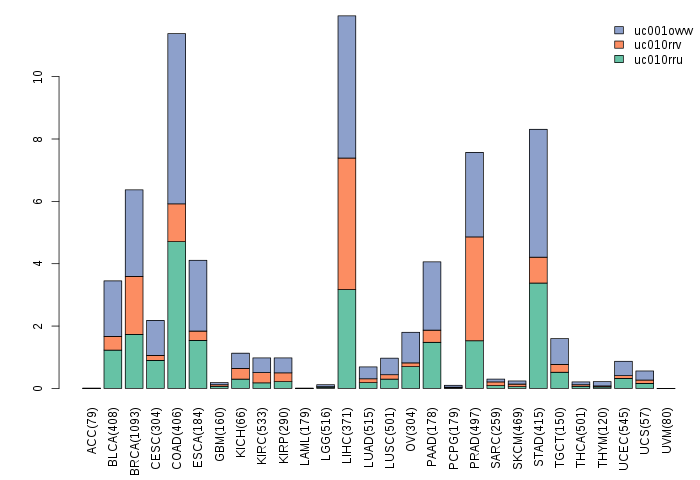
| Gene isoform expressions across 28 cancer types (X-axis: cancer type and Y-axis: log2(norm_counts+1)) (TCGA pan-cancer tcga_rsem_isoform_tpm, version 2016-09-01) |
 |
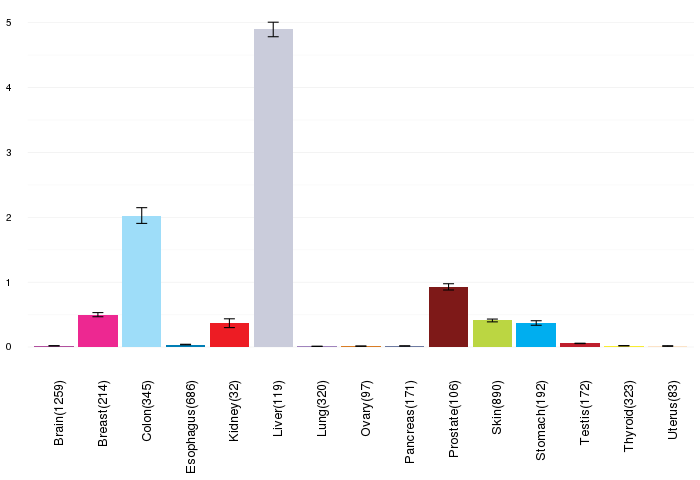
| Gene expressions across normal tissues of GTEx data (GTEx GTEx_Analysis_v6_RNA-seq_RNA-SeQCv1.1.8_gene_rpkm.gct) - Here, we shows the matched tissue types only among our 28 cancer types. |
 |
| Different expressions across 14 cancer types with more than 10 samples between matched tumors and normals (X-axis: cancer type and Y-axis: log2(norm_counts+1)) (TCGA IlluminaHiSeq_RNASeqV2, pan-cancer normalized log2(norm_counts+1) data, version 2016-08-16) |
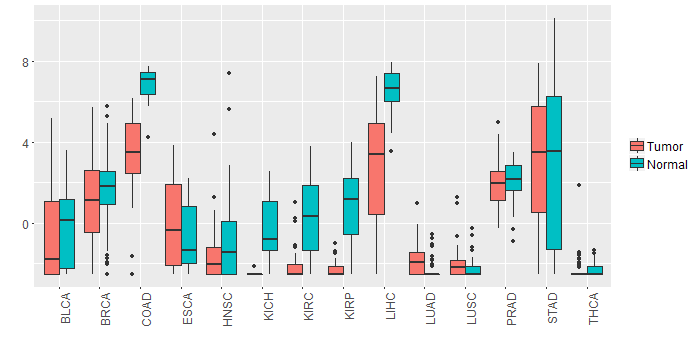 |
| - Significantly differentially expressed cancer types and information. (|Fold change|>1 and FDR<0.05) |
| Cancer type | Mean(exp) in tumor | Mean(exp) in matched normal | Log2FC | P-val. | FDR |
| LIHC | 2.70413402 | 6.55492802 | -3.850794 | 5.20E-12 | 8.92E-11 |
| COAD | 3.263582943 | 6.812371405 | -3.548788462 | 9.86E-09 | 8.71E-08 |
| KIRP | -2.295834605 | 0.811596645 | -3.10743125 | 4.36E-11 | 5.43E-10 |
| KICH | -2.49561198 | -0.17456398 | -2.321048 | 5.36E-08 | 2.58E-07 |
| KIRC | -2.183280091 | 0.313528243 | -2.496808333 | 3.74E-17 | 2.25E-16 |
| Top |
| TissGene-miRNA for MOGAT2 |
| Significantly anti-correlated miRNAs of TissGene across 28 cancer types (Gene-miRNA relations from TargetScanHuman Relsease 7.1, Conserved_Site_Context_Scores.txt.zip, 06.01.2016) (TCGA IlluminaHiSeq_miRNASeq, log2(RPM+1) data, version 2016-11-21) (TCGA IlluminaHiSeq_RNASeqV2, log2(normalized_count+1) data, version 2016-08-16) (Spearman’s Rank Correlation (p-value<0.05 and coefficient<-0.25)) |
| Cancer type | miRNA id | miRNA accession | P-val. | Coeff. | # samples |
| Top |
| TissGeneMut for MOGAT2 |
| TissGeneSNV for MOGAT2 |
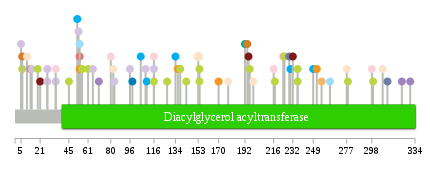
| nsSNV counts per each loci. Different colors of circles represent different cancer types. Circle size denotes number of samples. (TCGA somatic mutation (SNPs and small INDELs) data, version 2016-04-25) * Click on the image to enlarge it in a new window. |
 |
 |
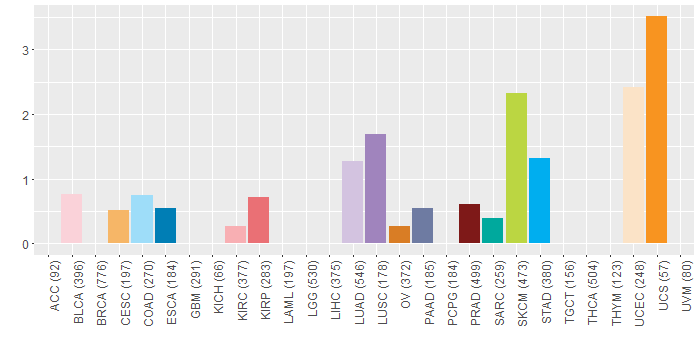
| Somatic nucleotide variants of TissGene across 28 cancer types (X-axis: cancer type and Y-axis: % of mutated samples) The numbers in parentheses are numbers of samples with mutation (nsSNVs). (TCGA somatic mutation (SNPs and small INDELs) data, version 2016-04-25) |
 |
| - nsSNVs sorted by frequency. |
| AAchange | Cancer type | # samples |
| p.D153Y | UCEC | 2 |
| p.H138Y | SKCM | 1 |
| p.P6L | SKCM | 1 |
| p.D230Y | STAD | 1 |
| p.E229V | PAAD | 1 |
| p.S225F | SKCM | 1 |
| p.R136C | UCS | 1 |
| p.G178R | UCEC | 1 |
| p.A105V | STAD | 1 |
| p.H330Q | LUSC | 1 |
| p.A54V | COAD | 1 |
| p.L98M | ESCA | 1 |
| p.E311V | PAAD | 1 |
| p.P109N | LUAD | 1 |
| p.E14Q | LUAD | 1 |
| p.E299K | SKCM | 1 |
| p.Y82C | UCEC | 1 |
| p.P236L | SKCM | 1 |
| p.I53F | LUAD | 1 |
| p.R65L | LUAD | 1 |
| p.R61Q | SKCM | 1 |
| p.T35I | DLBC | 1 |
| p.G45S | SKCM | 1 |
| p.F199S | UCEC | 1 |
| p.N232K | PRAD | 1 |
| p.P27H | LUAD | 1 |
| p.S116F | SKCM | 1 |
| p.G34R | BLCA | 1 |
| p.H110N | STAD | 1 |
| p.R249W | STAD | 1 |
| p.I256M | CESC | 1 |
| p.S159F | HNSC | 1 |
| p.R196Q | SKCM | 1 |
| p.H70L | LUSC | 1 |
| p.E298K | BLCA | 1 |
| p.R278Q | SKCM | 1 |
| p.R19W | SKCM | 1 |
| p.F224L | KIRC | 1 |
| p.R54C | UCS | 1 |
| p.W80R | BLCA | 1 |
| p.G116R | BLCA | 1 |
| p.A5V | LUAD | 1 |
| p.P27T | LUAD | 1 |
| p.P236S | SKCM | 1 |
| p.F323L | LUSC | 1 |
| p.A194T | OV | 1 |
| p.G52S | STAD | 1 |
| p.E96Q | LUAD | 1 |
| p.A54E | KIRP | 1 |
| p.M83I | LUAD | 1 |
| p.S143F | SKCM | 1 |
| p.H56Y | SKCM | 1 |
| p.R13C | KIRP | 1 |
| p.P154S | SKCM | 1 |
| p.I192K | SARC | 1 |
| p.K252N | UCS | 1 |
| p.G134S | STAD | 1 |
| p.P10L | UCEC | 1 |
| p.G116V | LUAD | 1 |
| p.E216K | BLCA | 1 |
| p.R204W | HNSC | 1 |
| p.Y21* | PRAD | 1 |
| p.G34V | LUAD | 1 |
| p.R122W | HNSC | 1 |
| p.E217K | SKCM | 1 |
| p.P6T | OV | 1 |
| p.R277H | UCEC | 1 |
| p.R307C | UCEC | 1 |
| p.K170N | UCS | 1 |
| p.G127S | SKCM | 1 |
| p.G263D | COAD | 1 |
| p.P154L | SKCM | 1 |
| p.R195C | PRAD | 1 |
| Top |
| TissGeneCNV for MOGAT2 |
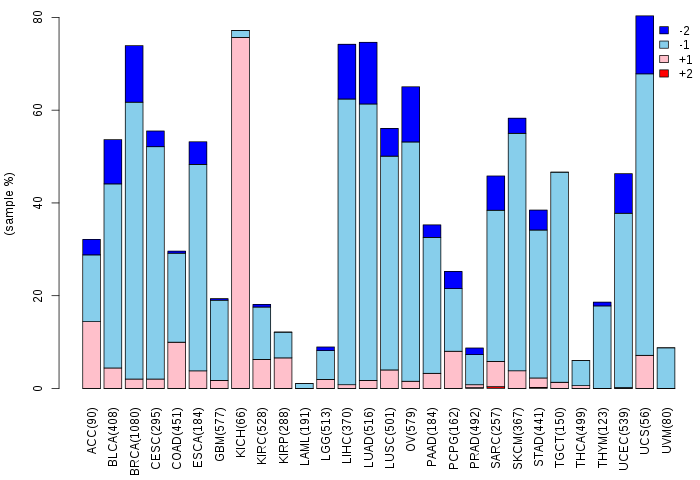
| Copy number variations of TissGene across 28 cancer types (X-axis: cancer type and Y-axis: % of CNV samples) (TCGA Gistic2_CopyNumber_Gistic2_all_data_by_genes, Gistic2 copy number data, version 2016-08-16) |
 |
| Top |
| TissGeneFusions for MOGAT2 |
| Fusion genes including TissGene (ChimerDB 3.0, 2016-12-01 and TCGA fusion Portal 2015-12-01) |
| Database | Src | Cancer type | Sample | Fusion gene | ORF | 5'-gene BP | 3'-gene BP |
| Chimerdb3.0 | ChiTaRs | NA | AW810166 | DPP8-MOGAT2 | chr15:65801624 | chr11:75439181 | |
| Chimerdb3.0 | TopHat-Fusion | BRCA | TCGA-A1-A0SQ-01A | LRP5-MOGAT2 | In-Frame | chr11:68193654 | chr11:75431036 |
| TCGAfusionPortal | PRADA | BRCA | TCGA-A1-A0SQ-01A | LRP5-MOGAT2 | In-frame | Chr11:68193655 | Chr11:75431037 |
| TCGAfusionPortal | PRADA | BRCA | TCGA-AN-A03Y-01A | ARAP1-MOGAT2 | Out-of-frame | Chr11:72410050 | Chr11:75431037 |
| Top |
| TissGeneNet for MOGAT2 |
| Co-expressed gene networks based on protein-protein interaction data (CePIN) (TCGA IlluminaHiSeq_RNASeqV2, pan-cancer normalized log2(norm_counts+1) data, version 2016-08-16) (PINA2 ppi data) |
| Top |
| TissGeneProg for MOGAT2 |
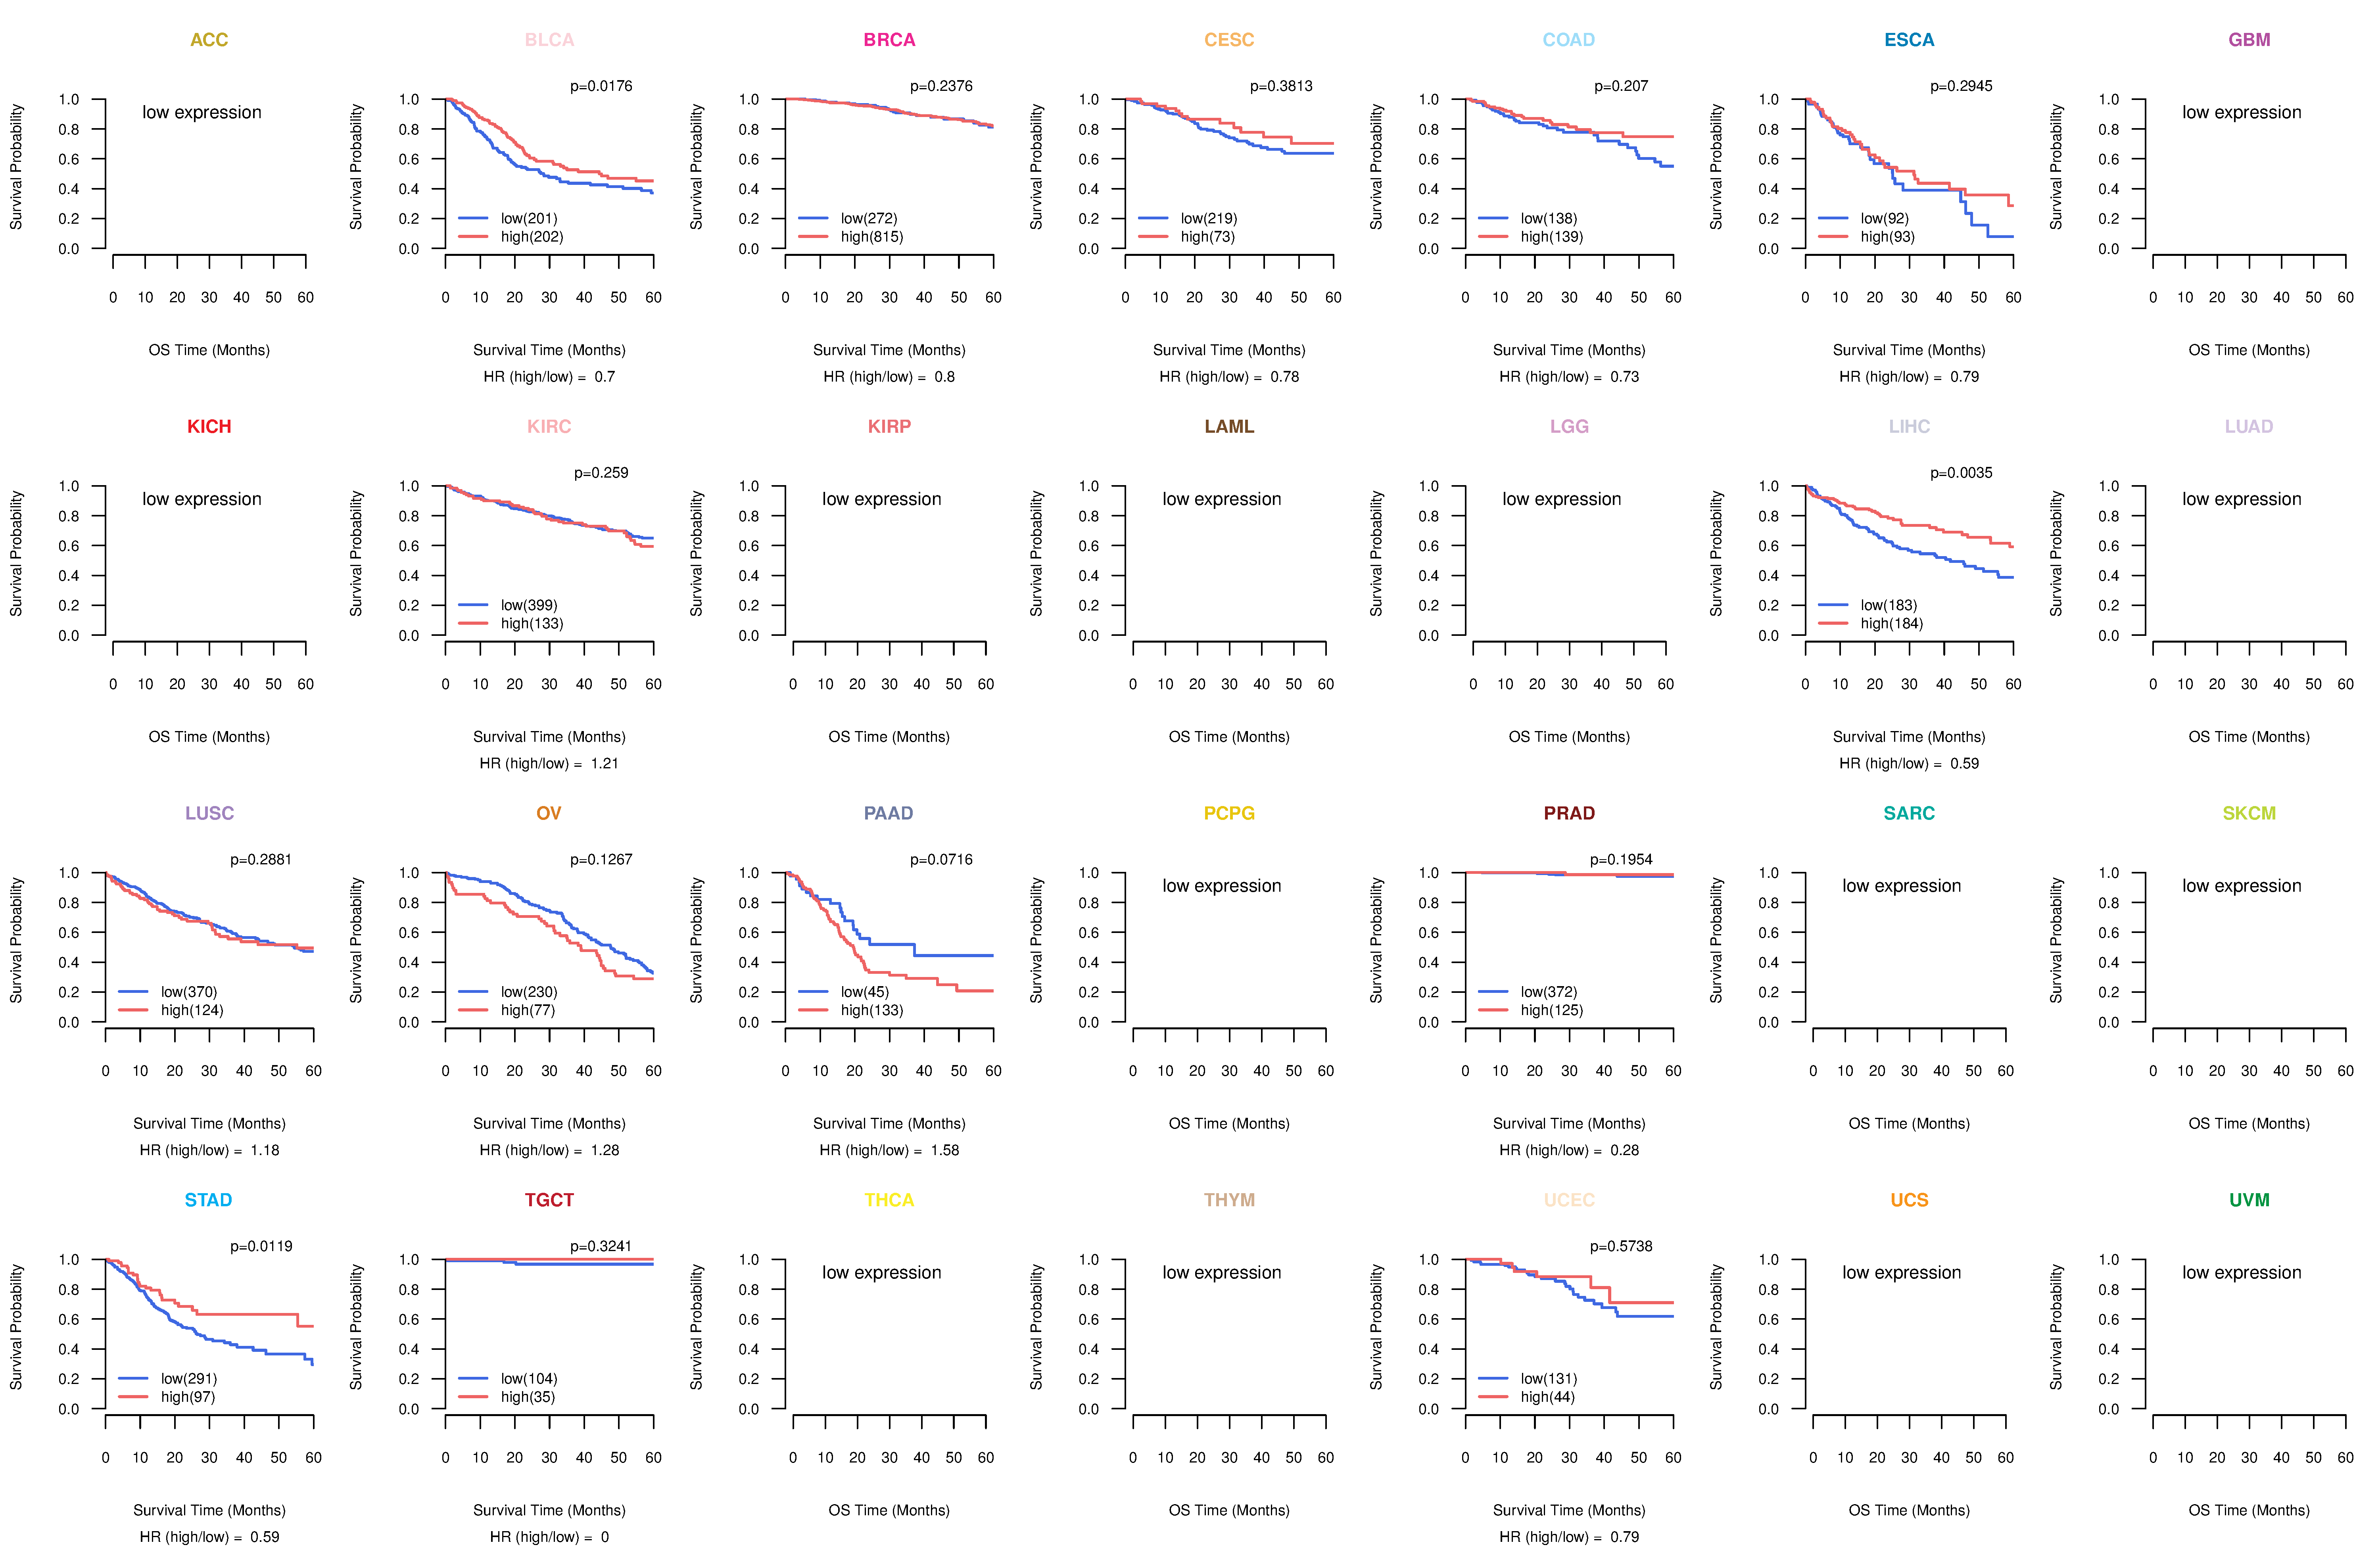
| Kaplan-Meier plots with logrank tests of overall survival (OS) using 28 cancer types (TCGA IlluminaHiSeq_RNASeqV2, pan-cancer normalized log2(norm_counts+1) data, version 2016-08-16) (TCGA clinicalMatrix, phenotype data, version 2016-04-27) * Click on the image to enlarge it in a new window. |
 |
| Kaplan-Meier plots with logrank test of relapse free survival (RFS) using 28 cancer types (TCGA IlluminaHiSeq_RNASeqV2, pan-cancer normalized log2(norm_counts+1) data, version 2016-08-16) (TCGA clinicalMatrix, phenotype data, version 2016-04-27) * Click on the image enlarge it in a new window. |
 |
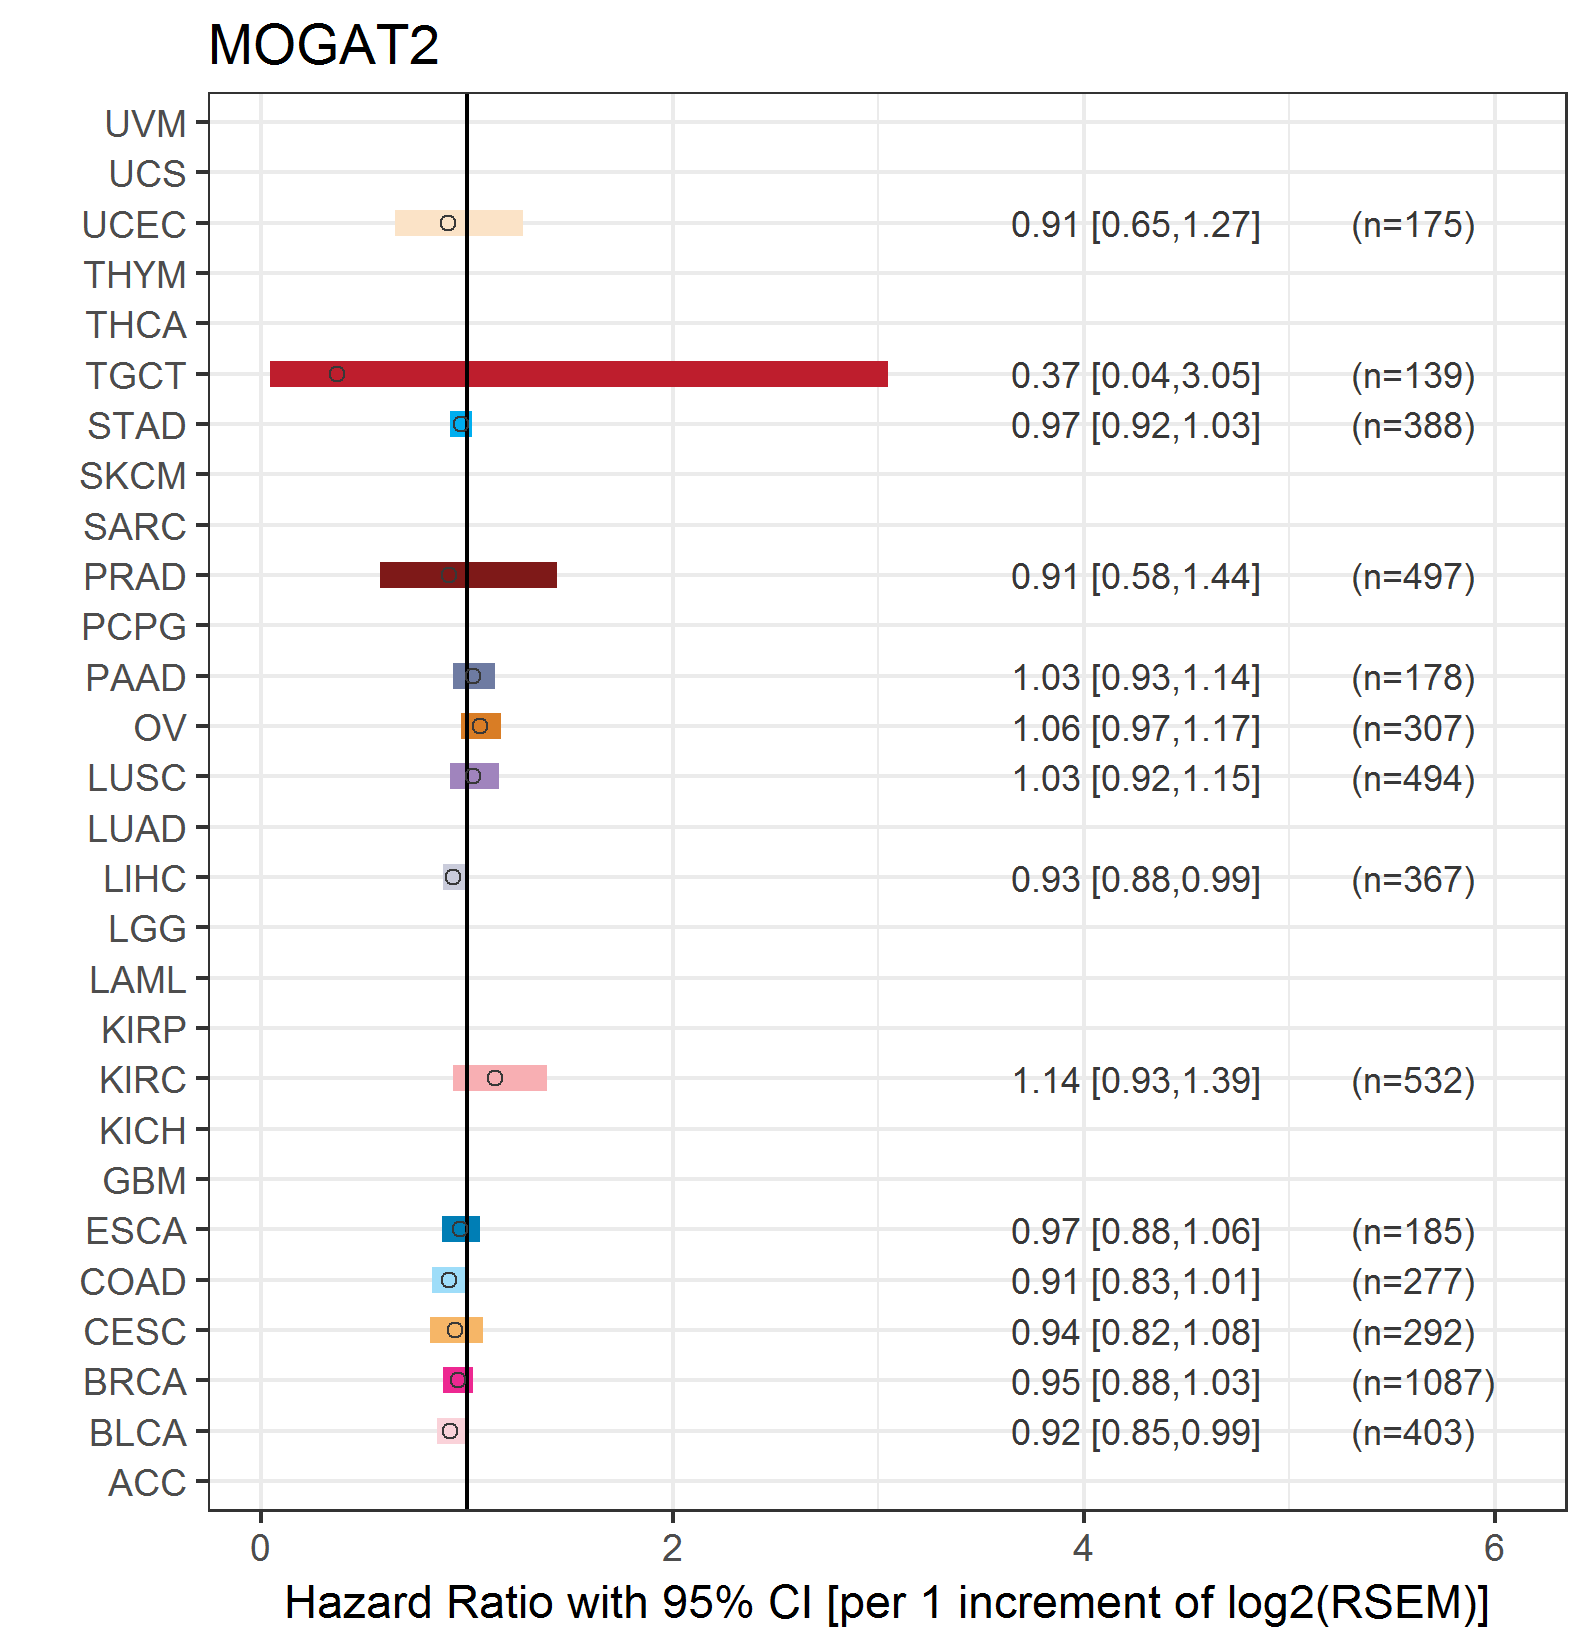
| Forest plot of Cox proportional hazard ratio (HR) and 95% CI of overall survival (OS) using 28 cancer types (TCGA IlluminaHiSeq_RNASeqV2, pan-cancer normalized log2(norm_counts+1) data, version 2016-08-16) (TCGA clinicalMatrix, phenotype data, version 2016-04-27) * Click on the image enlarge it in a new window. |
 |
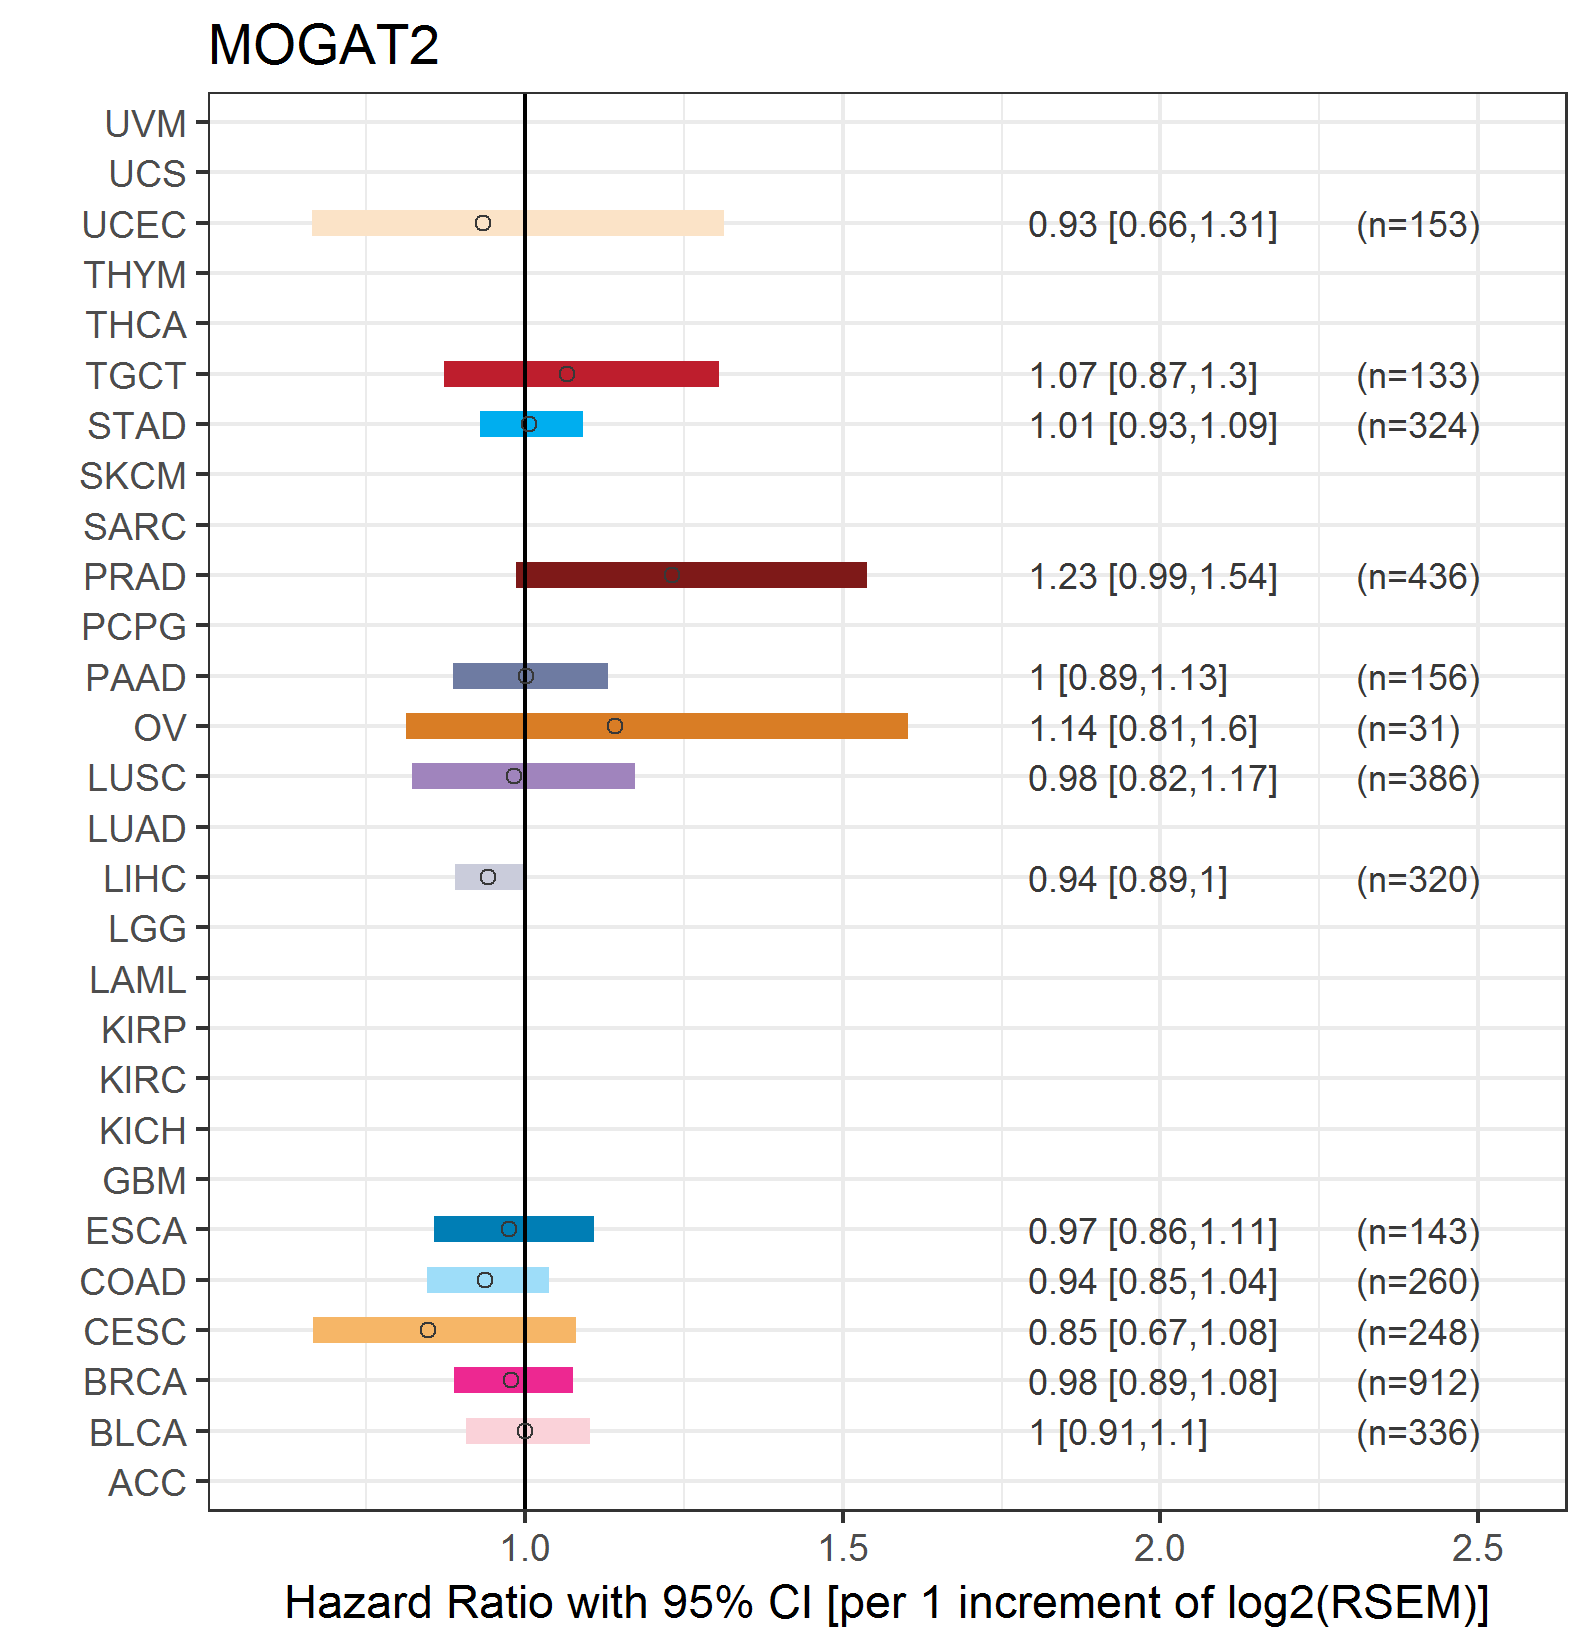
| Forest plot of Cox proportional hazard ratio (HR) and 95% CI of relapse free survival (RFS) using 28 cancer types (TCGA IlluminaHiSeq_RNASeqV2, pan-cancer normalized log2(norm_counts+1) data, version 2016-08-16) (TCGA clinicalMatrix, phenotype data, version 2016-04-27) * Click on the image enlarge it in a new window. |
 |
| Top |
| TissGeneClin for MOGAT2 |
| TissGeneDrug for MOGAT2 |
| Drug information targeting TissGene (DrugBank Version 5.0.6, 2017-04-01) |
| DrugBank ID | Drug name | Drug activity | Drug type | Drug status |
| Top |
| TissGeneDisease for MOGAT2 |
| Disease information associated with TissGene (DisGeNet, 2016-06-01) |
| Disease ID | Disease name | # pubmeds | Source |
| umls:C0028754 | Obesity | 4 | BeFree |
| umls:C0011860 | Diabetes Mellitus, Non-Insulin-Dependent | 1 | BeFree |
| umls:C0015695 | Fatty Liver | 1 | BeFree |
| umls:C0025517 | Metabolic Diseases | 1 | BeFree |
| umls:C0271650 | Impaired glucose tolerance | 1 | BeFree |
| umls:C0282577 | Congenital Disorders of Glycosylation | 1 | BeFree |
| umls:C2711227 | Steatohepatitis | 1 | BeFree |
|
Copyright 2016-Present - The University of Texas Health Science Center at Houston (UTHealth) Web File Viewing | How to Report, Fraud, Waste and Abuse | State of Texas | Statewide Search | Texas Homeland Security | Site Policies |