 |
| |
| |
| |
| |
| |
| |
|

| TissGeneSummary for RTP3 |
 Gene summary Gene summary |
| Basic gene information | Gene symbol | RTP3 |
| Gene name | receptor (chemosensory) transporter protein 3 | |
| Synonyms | LTM1|TMEM7|Z3CXXC3 | |
| Cytomap | UCSC genome browser: 3p21.3 | |
| Type of gene | protein-coding | |
| RefGenes | NM_031440.1, | |
| Description | receptor transporter protein 3receptor transporting protein 3receptor-transporting protein 3transmembrane protein 7zinc finger, 3CxxC-type 3 | |
| Modification date | 20141207 | |
| dbXrefs | MIM : 607181 | |
| HGNC : HGNC | ||
| HPRD : 06214 | ||
| Protein | UniProt: go to UniProt's Cross Reference DB Table | |
| Expression | CleanEX: HS_RTP3 | |
| BioGPS: 83597 | ||
| Pathway | NCI Pathway Interaction Database: RTP3 | |
| KEGG: RTP3 | ||
| REACTOME: RTP3 | ||
| Pathway Commons: RTP3 | ||
| Context | iHOP: RTP3 | |
| ligand binding site mutation search in PubMed: RTP3 | ||
| UCL Cancer Institute: RTP3 | ||
| Assigned class in TissGDB* | C | |
| Included tissue-specific gene expression resources | HPA,GTEx | |
| Specific-tissues in normal samples (assigned by TissGDB using HPA, TiGER, and GTEx) | Liver | |
| Cancer types related to the specific-tissues in cancer samples (assigned by TissGDB using TCGA) | LIHC | |
| Reference showing the relevant tissue of RTP3 | ||
| Description by TissGene annotations | Significant down-regulated DEG TissgsKTS CNV lost TissGeneKTS | |
| * Class A consists of genes with literature evidence and is part of the cTissGenes. Class B consists of only cTissGenes without additional evidence. The remaining genes belong to Class C. |
| Gene ontology having evidence of Inferred from Direct Assay (IDA) from Entrez |
| GO ID | GO term | PubMed ID | GO:0001580 | detection of chemical stimulus involved in sensory perception of bitter taste | 16720576 | GO:0006612 | protein targeting to membrane | 16720576 | GO:0001580 | detection of chemical stimulus involved in sensory perception of bitter taste | 16720576 | GO:0006612 | protein targeting to membrane | 16720576 |
| Top |
| TissGeneExp for RTP3 |
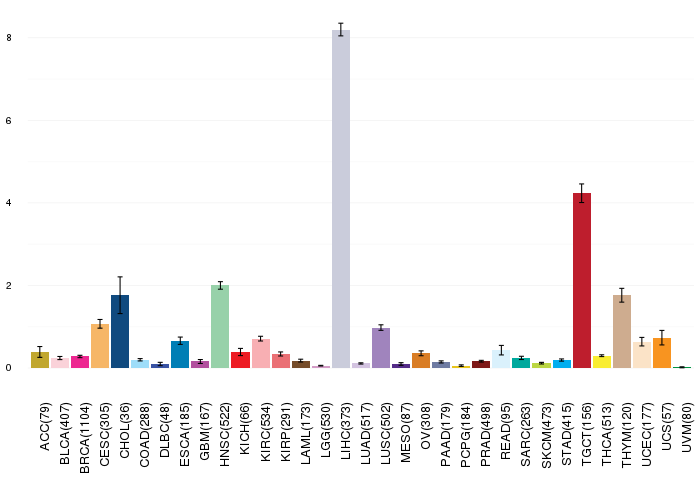
| Gene expressions across 28 cancer types (X-axis: cancer type and Y-axis: log2(norm_counts+1)) (TCGA IlluminaHiSeq_RNASeqV2, pan-cancer normalized log2(norm_counts+1) data, version 2016-08-16) |
 |
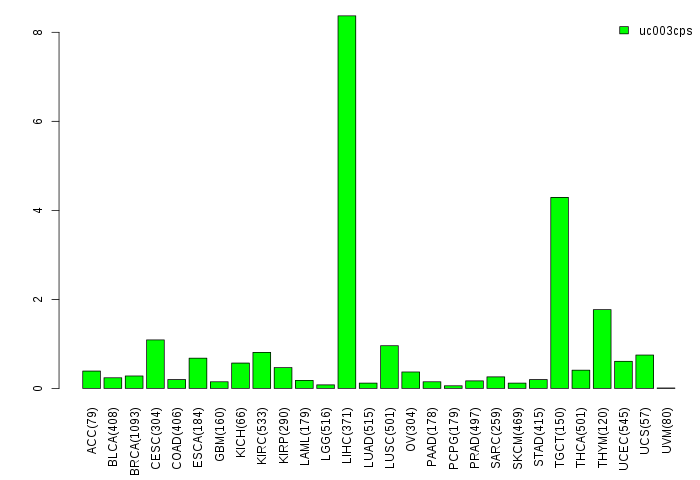
| Gene isoform expressions across 28 cancer types (X-axis: cancer type and Y-axis: log2(norm_counts+1)) (TCGA pan-cancer tcga_rsem_isoform_tpm, version 2016-09-01) |
 |
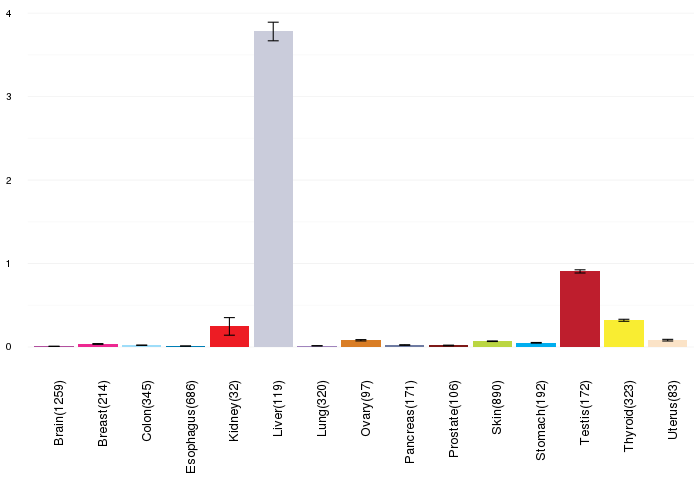
| Gene expressions across normal tissues of GTEx data (GTEx GTEx_Analysis_v6_RNA-seq_RNA-SeQCv1.1.8_gene_rpkm.gct) - Here, we shows the matched tissue types only among our 28 cancer types. |
 |
| Different expressions across 14 cancer types with more than 10 samples between matched tumors and normals (X-axis: cancer type and Y-axis: log2(norm_counts+1)) (TCGA IlluminaHiSeq_RNASeqV2, pan-cancer normalized log2(norm_counts+1) data, version 2016-08-16) |
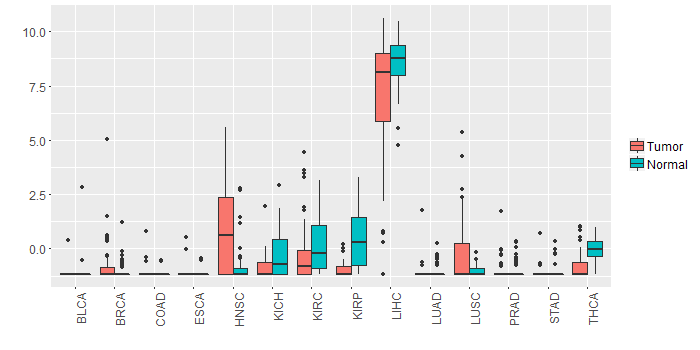 |
| - Significantly differentially expressed cancer types and information. (|Fold change|>1 and FDR<0.05) |
| Cancer type | Mean(exp) in tumor | Mean(exp) in matched normal | Log2FC | P-val. | FDR |
| HNSC | 0.893808384 | -0.753638128 | 1.647446512 | 1.30E-05 | 7.17E-05 |
| KIRP | -0.969600701 | 0.365393049 | -1.33499375 | 3.98E-06 | 1.78E-05 |
| LIHC | 7.073263174 | 8.564525174 | -1.491262 | 0.00153 | 0.004021456 |
| Top |
| TissGene-miRNA for RTP3 |
| Significantly anti-correlated miRNAs of TissGene across 28 cancer types (Gene-miRNA relations from TargetScanHuman Relsease 7.1, Conserved_Site_Context_Scores.txt.zip, 06.01.2016) (TCGA IlluminaHiSeq_miRNASeq, log2(RPM+1) data, version 2016-11-21) (TCGA IlluminaHiSeq_RNASeqV2, log2(normalized_count+1) data, version 2016-08-16) (Spearman’s Rank Correlation (p-value<0.05 and coefficient<-0.25)) |
| Cancer type | miRNA id | miRNA accession | P-val. | Coeff. | # samples |
| Top |
| TissGeneMut for RTP3 |
| TissGeneSNV for RTP3 |
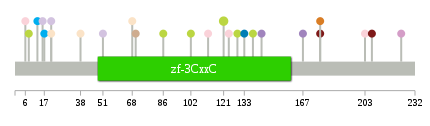
| nsSNV counts per each loci. Different colors of circles represent different cancer types. Circle size denotes number of samples. (TCGA somatic mutation (SNPs and small INDELs) data, version 2016-04-25) * Click on the image to enlarge it in a new window. |
 |
 |
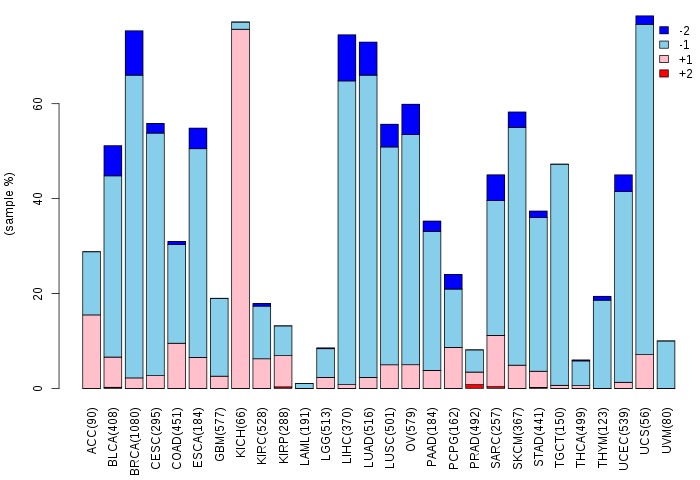
| Somatic nucleotide variants of TissGene across 28 cancer types (X-axis: cancer type and Y-axis: % of mutated samples) The numbers in parentheses are numbers of samples with mutation (nsSNVs). (TCGA somatic mutation (SNPs and small INDELs) data, version 2016-04-25) |
 |
| - nsSNVs sorted by frequency. |
| AAchange | Cancer type | # samples |
| p.R121Q | SKCM | 2 |
| p.R130K | HNSC | 1 |
| p.I143M | LUSC | 1 |
| p.L70P | THYM | 1 |
| p.A51D | LUAD | 1 |
| p.P21L | LUAD | 1 |
| p.L68M | UCEC | 1 |
| p.G129E | SKCM | 1 |
| p.P177T | PRAD | 1 |
| p.F214L | HNSC | 1 |
| p.V224M | LGG | 1 |
| p.K124N | BLCA | 1 |
| p.L38M | UCEC | 1 |
| p.E102K | SKCM | 1 |
| p.R17W | STAD | 1 |
| p.P21L | UCEC | 1 |
| p.M16T | LUAD | 1 |
| p.M86I | SKCM | 1 |
| p.P138S | SKCM | 1 |
| p.P177Q | OV | 1 |
| p.Q167K | LUSC | 1 |
| p.W8* | SKCM | 1 |
| p.E6* | BLCA | 1 |
| p.L133S | ESCA | 1 |
| p.Q13H | STAD | 1 |
| p.Q13K | HNSC | 1 |
| p.C203Y | BLCA | 1 |
| p.S112* | BLCA | 1 |
| p.I207V | PRAD | 1 |
| Top |
| TissGeneCNV for RTP3 |
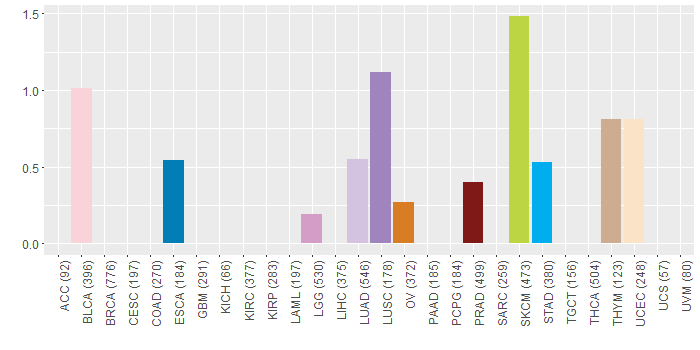
| Copy number variations of TissGene across 28 cancer types (X-axis: cancer type and Y-axis: % of CNV samples) (TCGA Gistic2_CopyNumber_Gistic2_all_data_by_genes, Gistic2 copy number data, version 2016-08-16) |
 |
| Top |
| TissGeneFusions for RTP3 |
| Fusion genes including TissGene (ChimerDB 3.0, 2016-12-01 and TCGA fusion Portal 2015-12-01) |
| Database | Src | Cancer type | Sample | Fusion gene | ORF | 5'-gene BP | 3'-gene BP |
| Top |
| TissGeneNet for RTP3 |
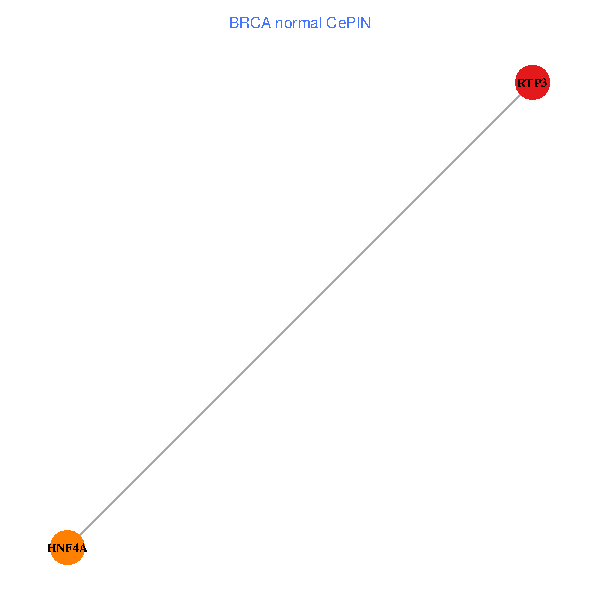
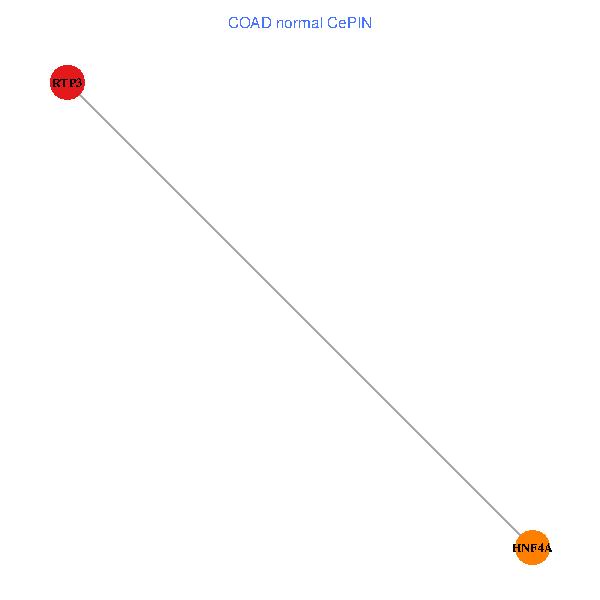
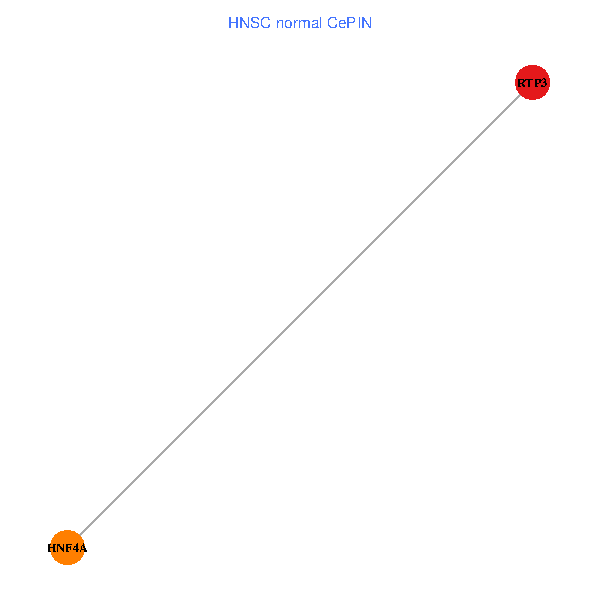
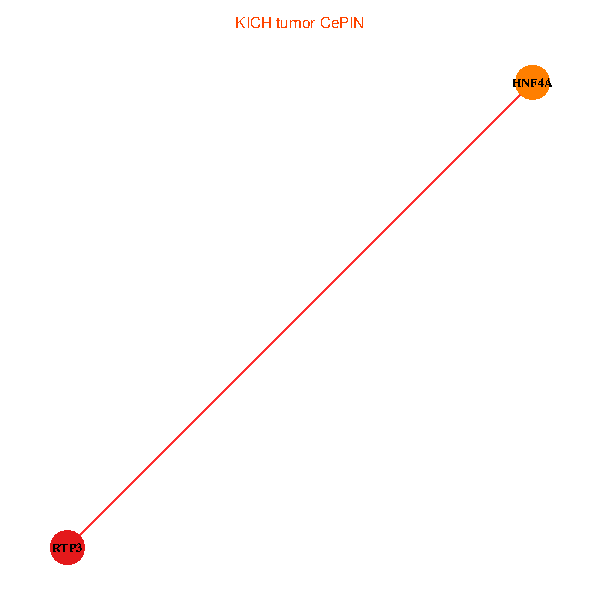
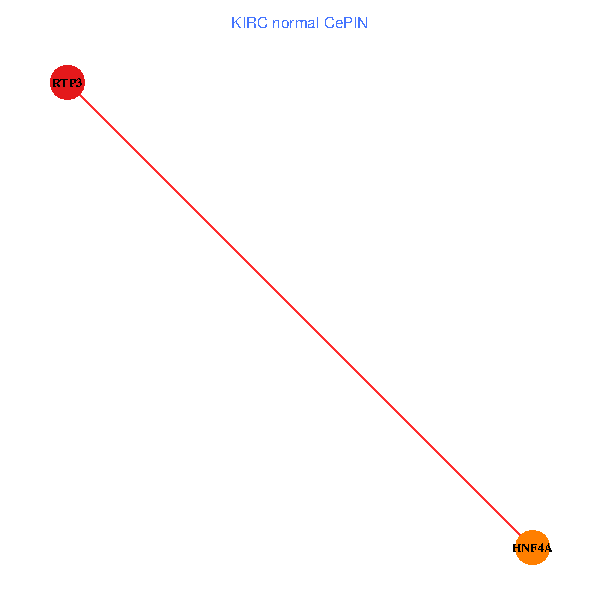
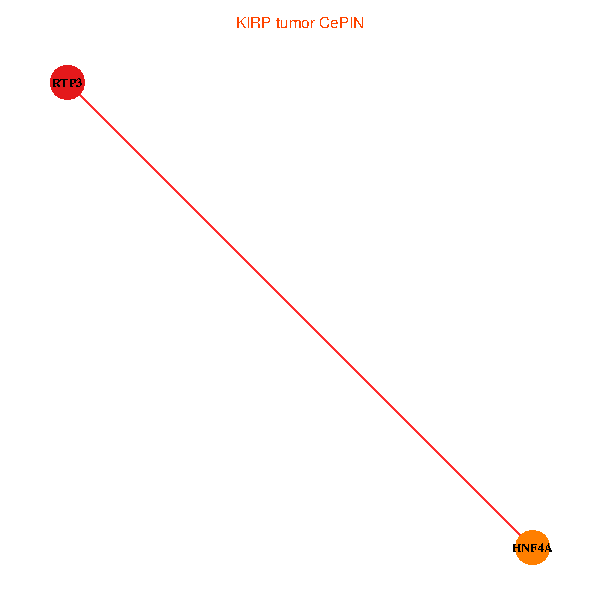
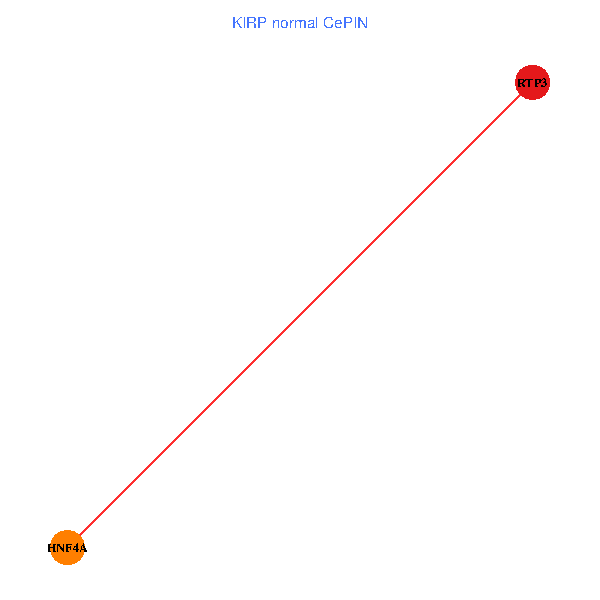
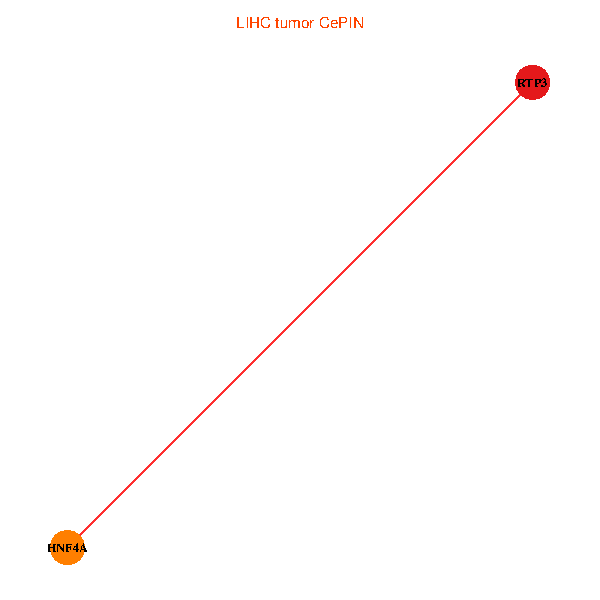
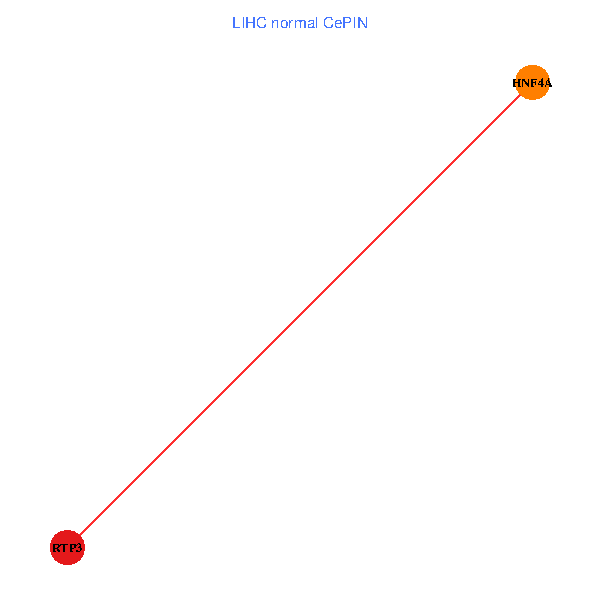
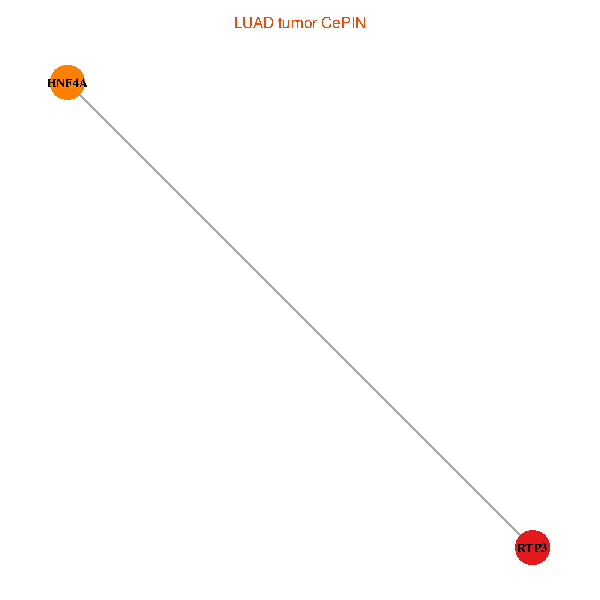
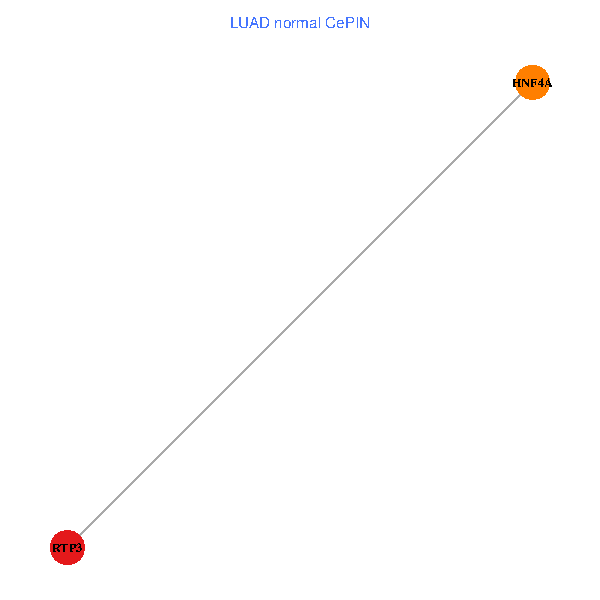
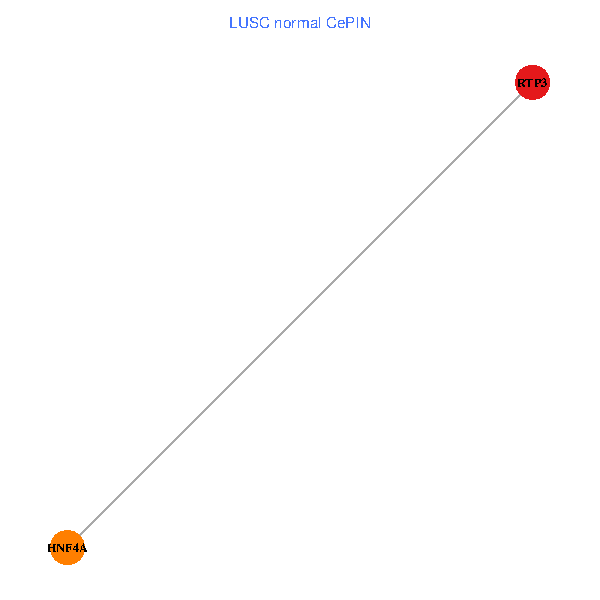
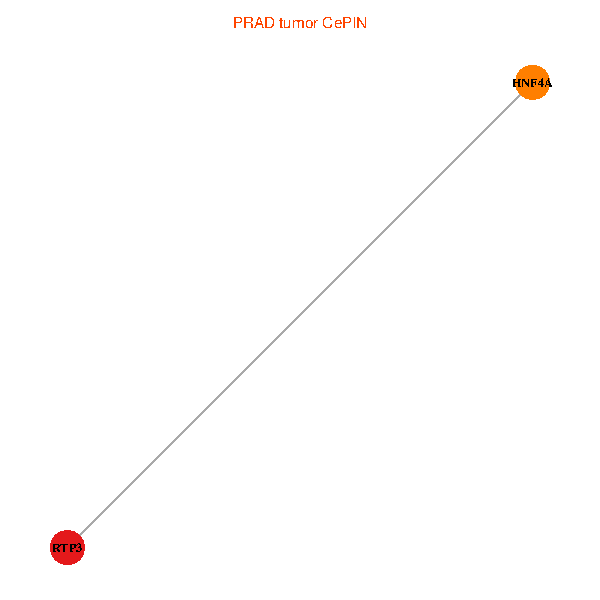
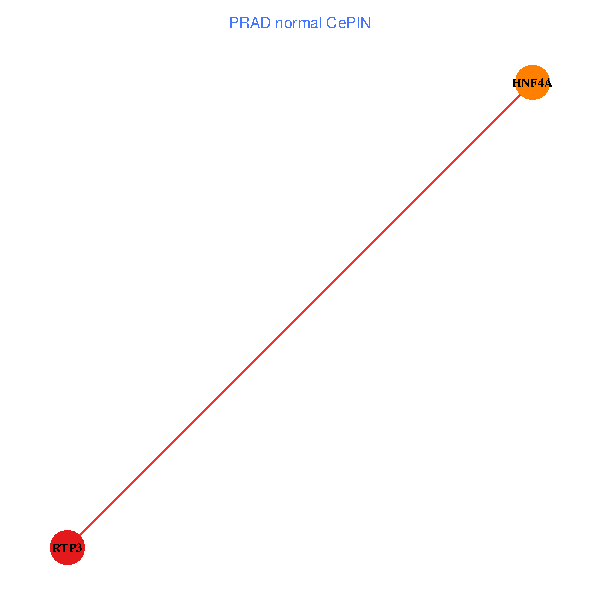
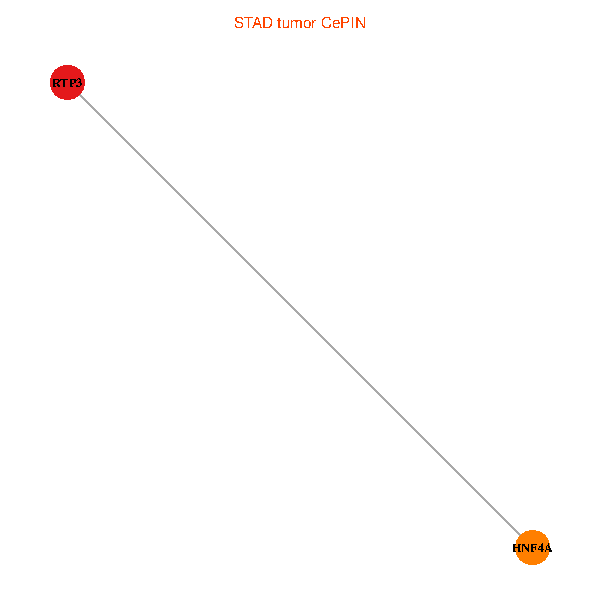
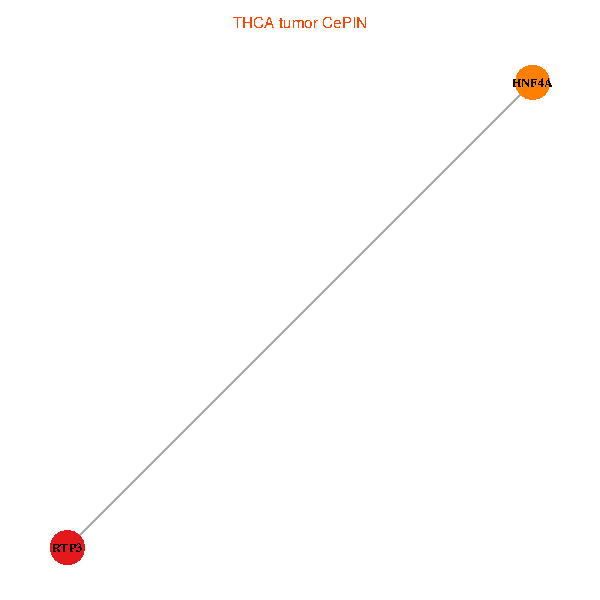
| Co-expressed gene networks based on protein-protein interaction data (CePIN) (TCGA IlluminaHiSeq_RNASeqV2, pan-cancer normalized log2(norm_counts+1) data, version 2016-08-16) (PINA2 ppi data) |
| BRCA (tumor) | BRCA (normal) |
| RTP3, HNF4A (tumor) | RTP3, HNF4A (normal) |
 |  |
| COAD (tumor) | COAD (normal) |
| RTP3, HNF4A (tumor) | RTP3, HNF4A (normal) |
 |  |
| HNSC (tumor) | HNSC (normal) |
| RTP3, HNF4A (tumor) | RTP3, HNF4A (normal) |
 |  |
| KICH (tumor) | KICH (normal) |
| RTP3, HNF4A (tumor) | RTP3, HNF4A (normal) |
 |  |
| KIRC (tumor) | KIRC (normal) |
| RTP3, HNF4A (tumor) | RTP3, HNF4A (normal) |
 |  |
| KIRP (tumor) | KIRP (normal) |
| RTP3, HNF4A (tumor) | RTP3, HNF4A (normal) |
 |  |
| LIHC (tumor) | LIHC (normal) |
| RTP3, HNF4A (tumor) | RTP3, HNF4A (normal) |
 |  |
| LUAD (tumor) | LUAD (normal) |
| RTP3, HNF4A (tumor) | RTP3, HNF4A (normal) |
 |  |
| LUSC (tumor) | LUSC (normal) |
| RTP3, HNF4A (tumor) | RTP3, HNF4A (normal) |
 |  |
| PRAD (tumor) | PRAD (normal) |
| RTP3, HNF4A (tumor) | RTP3, HNF4A (normal) |
 |  |
| STAD (tumor) | STAD (normal) |
| RTP3, HNF4A (tumor) | RTP3, HNF4A (normal) |
 |  |
| THCA (tumor) | THCA (normal) |
| RTP3, HNF4A (tumor) | RTP3, HNF4A (normal) |
 |  |
| Top |
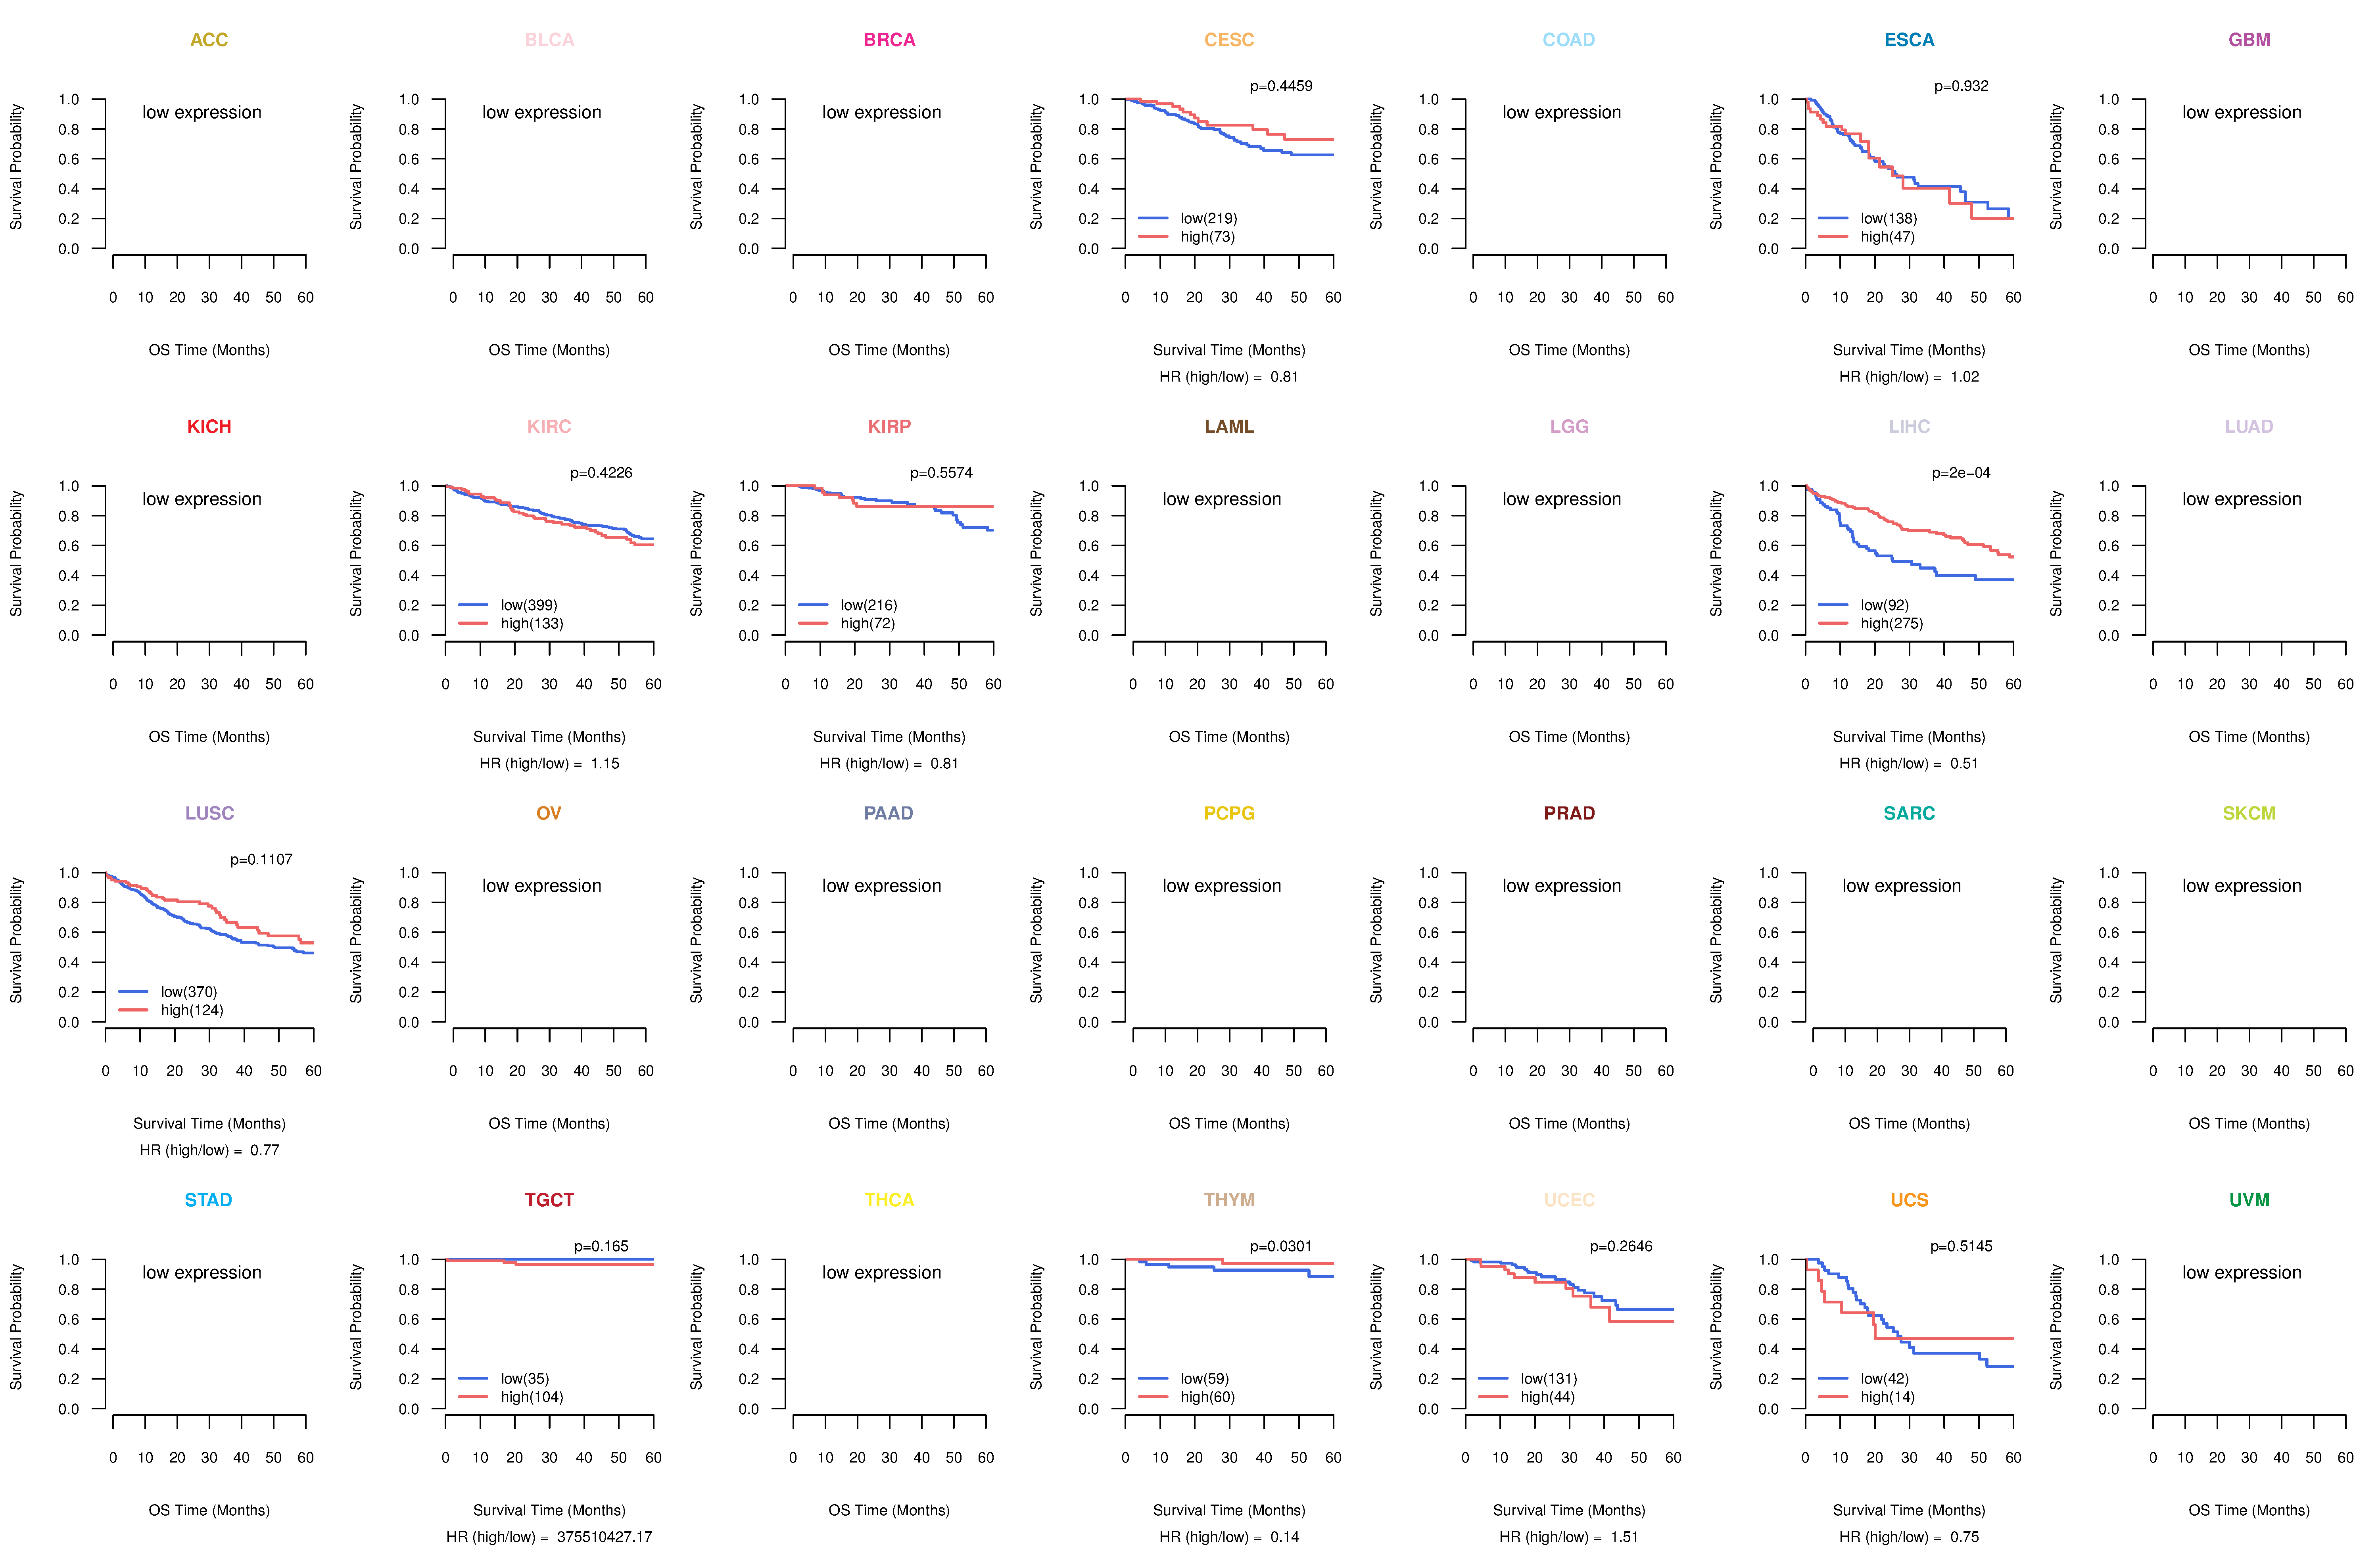
| TissGeneProg for RTP3 |
| Kaplan-Meier plots with logrank tests of overall survival (OS) using 28 cancer types (TCGA IlluminaHiSeq_RNASeqV2, pan-cancer normalized log2(norm_counts+1) data, version 2016-08-16) (TCGA clinicalMatrix, phenotype data, version 2016-04-27) * Click on the image to enlarge it in a new window. |
 |
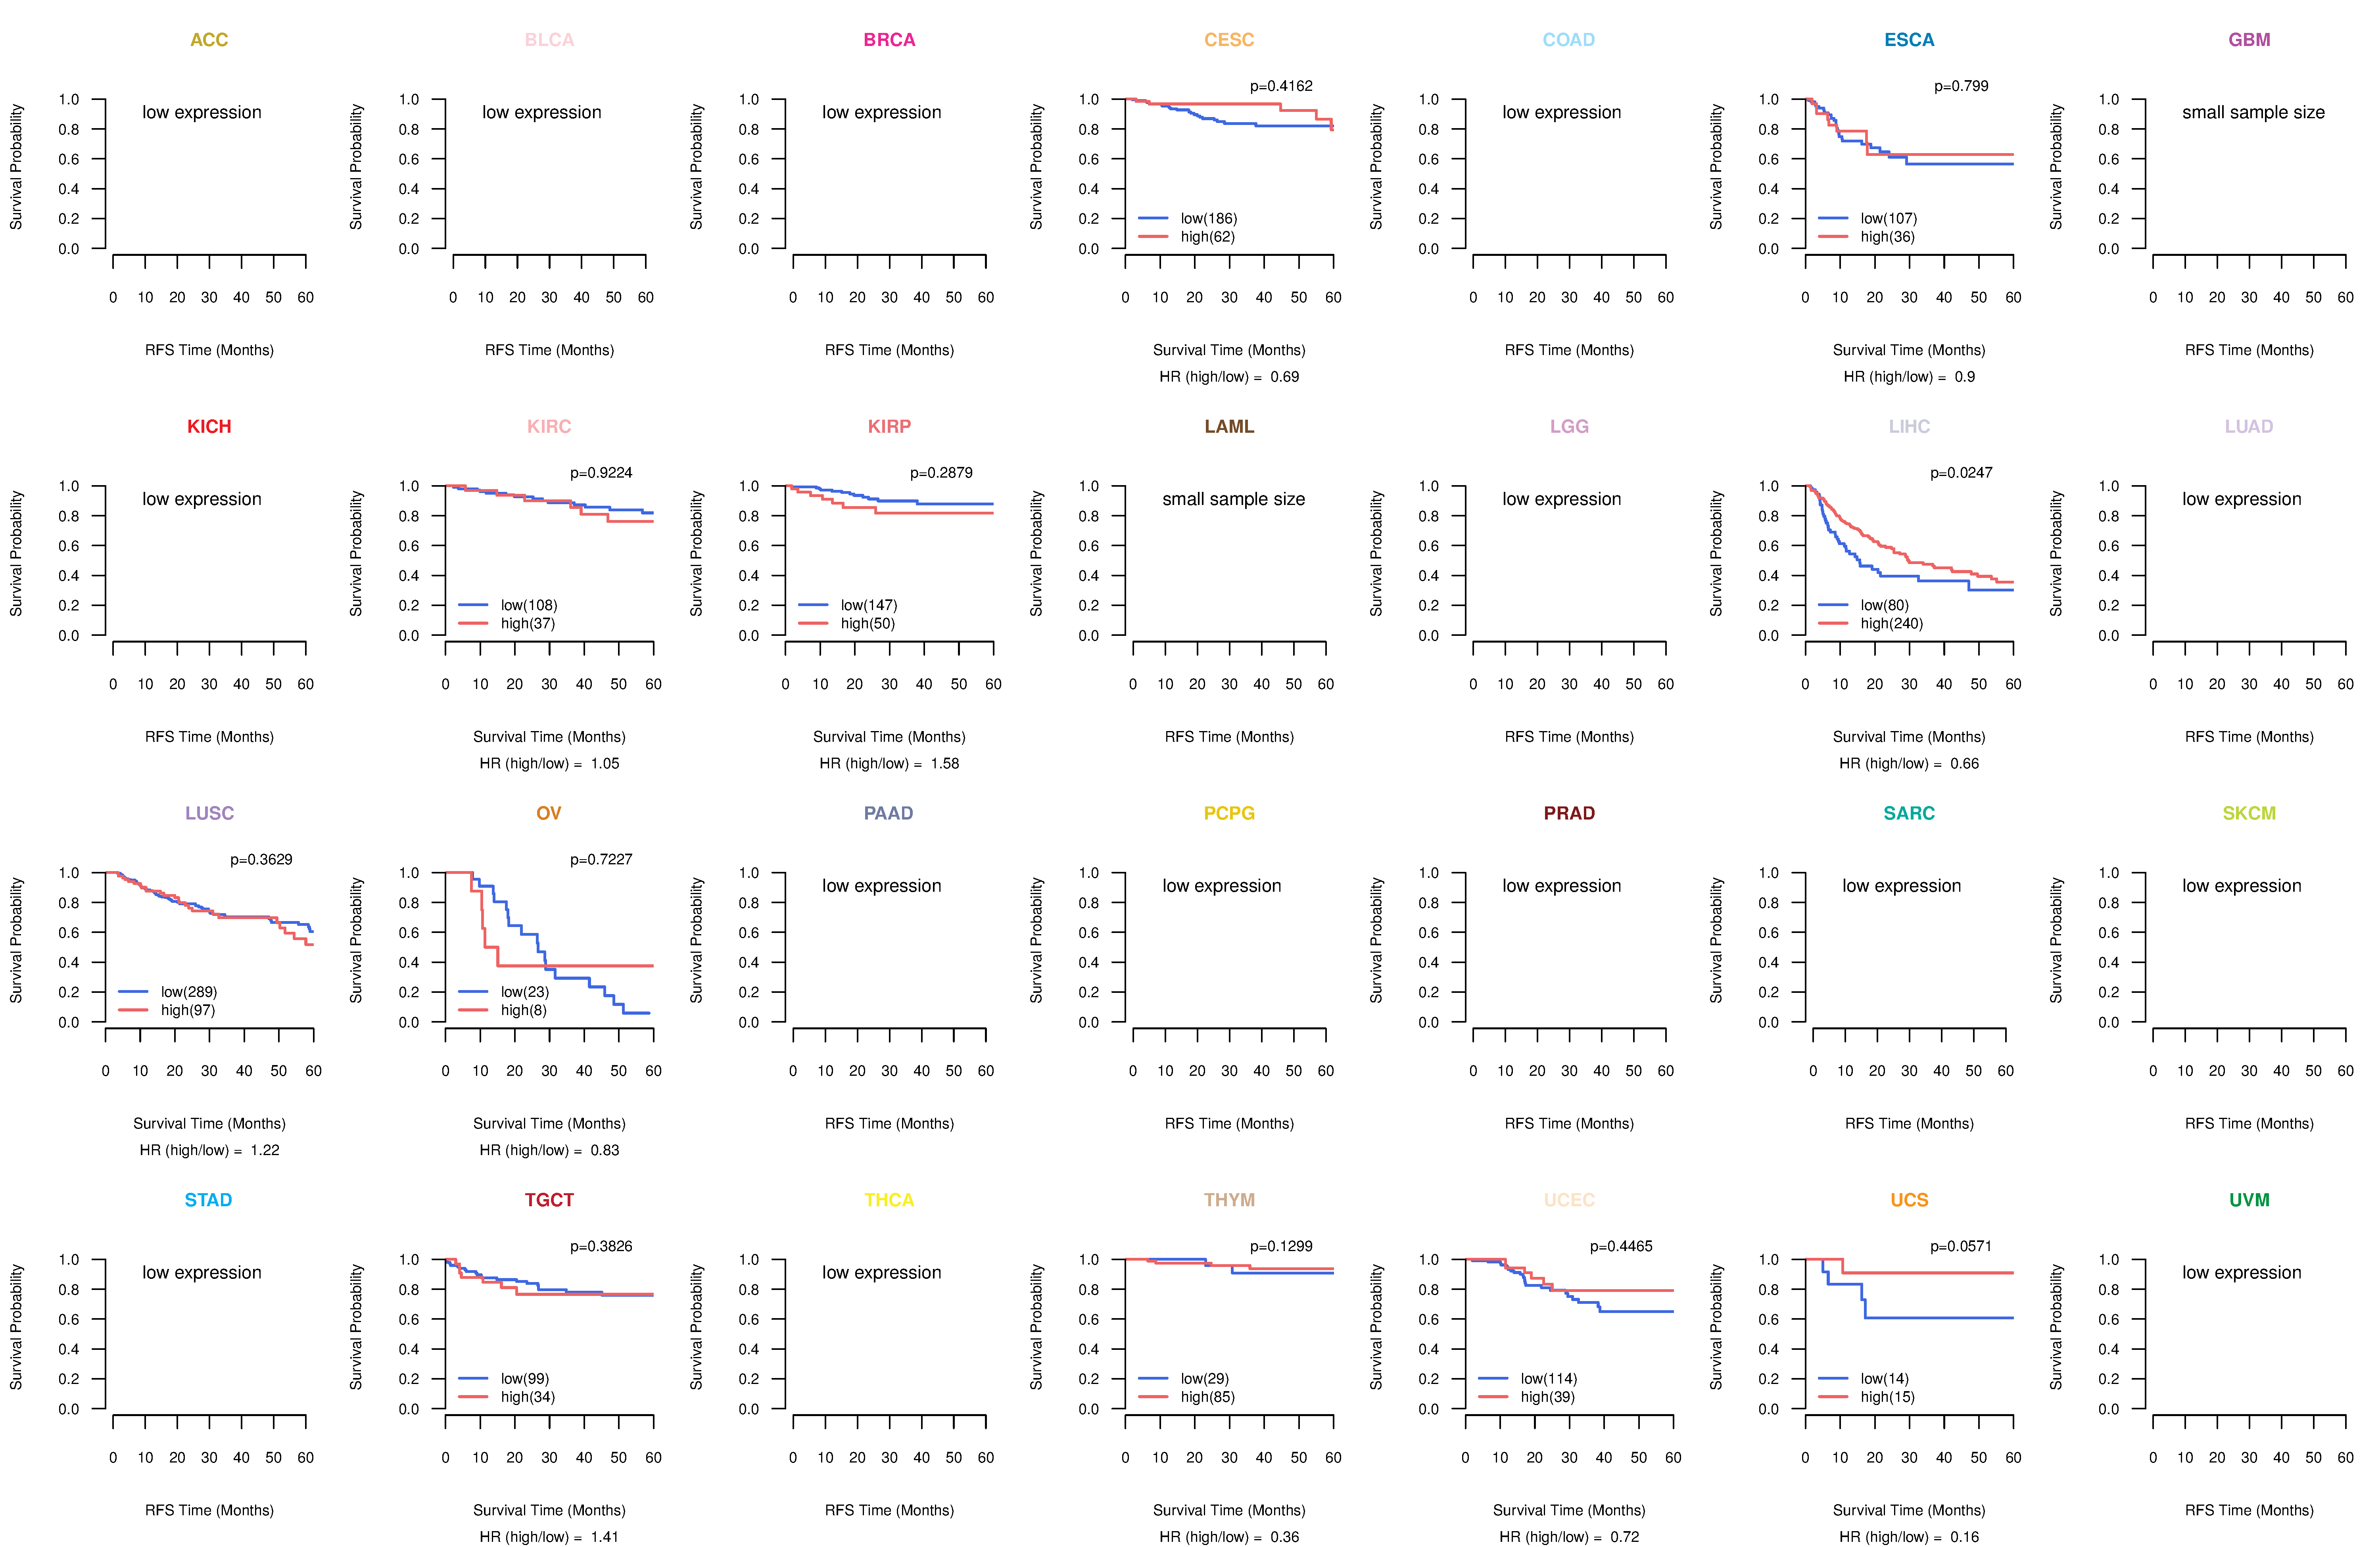
| Kaplan-Meier plots with logrank test of relapse free survival (RFS) using 28 cancer types (TCGA IlluminaHiSeq_RNASeqV2, pan-cancer normalized log2(norm_counts+1) data, version 2016-08-16) (TCGA clinicalMatrix, phenotype data, version 2016-04-27) * Click on the image enlarge it in a new window. |
 |
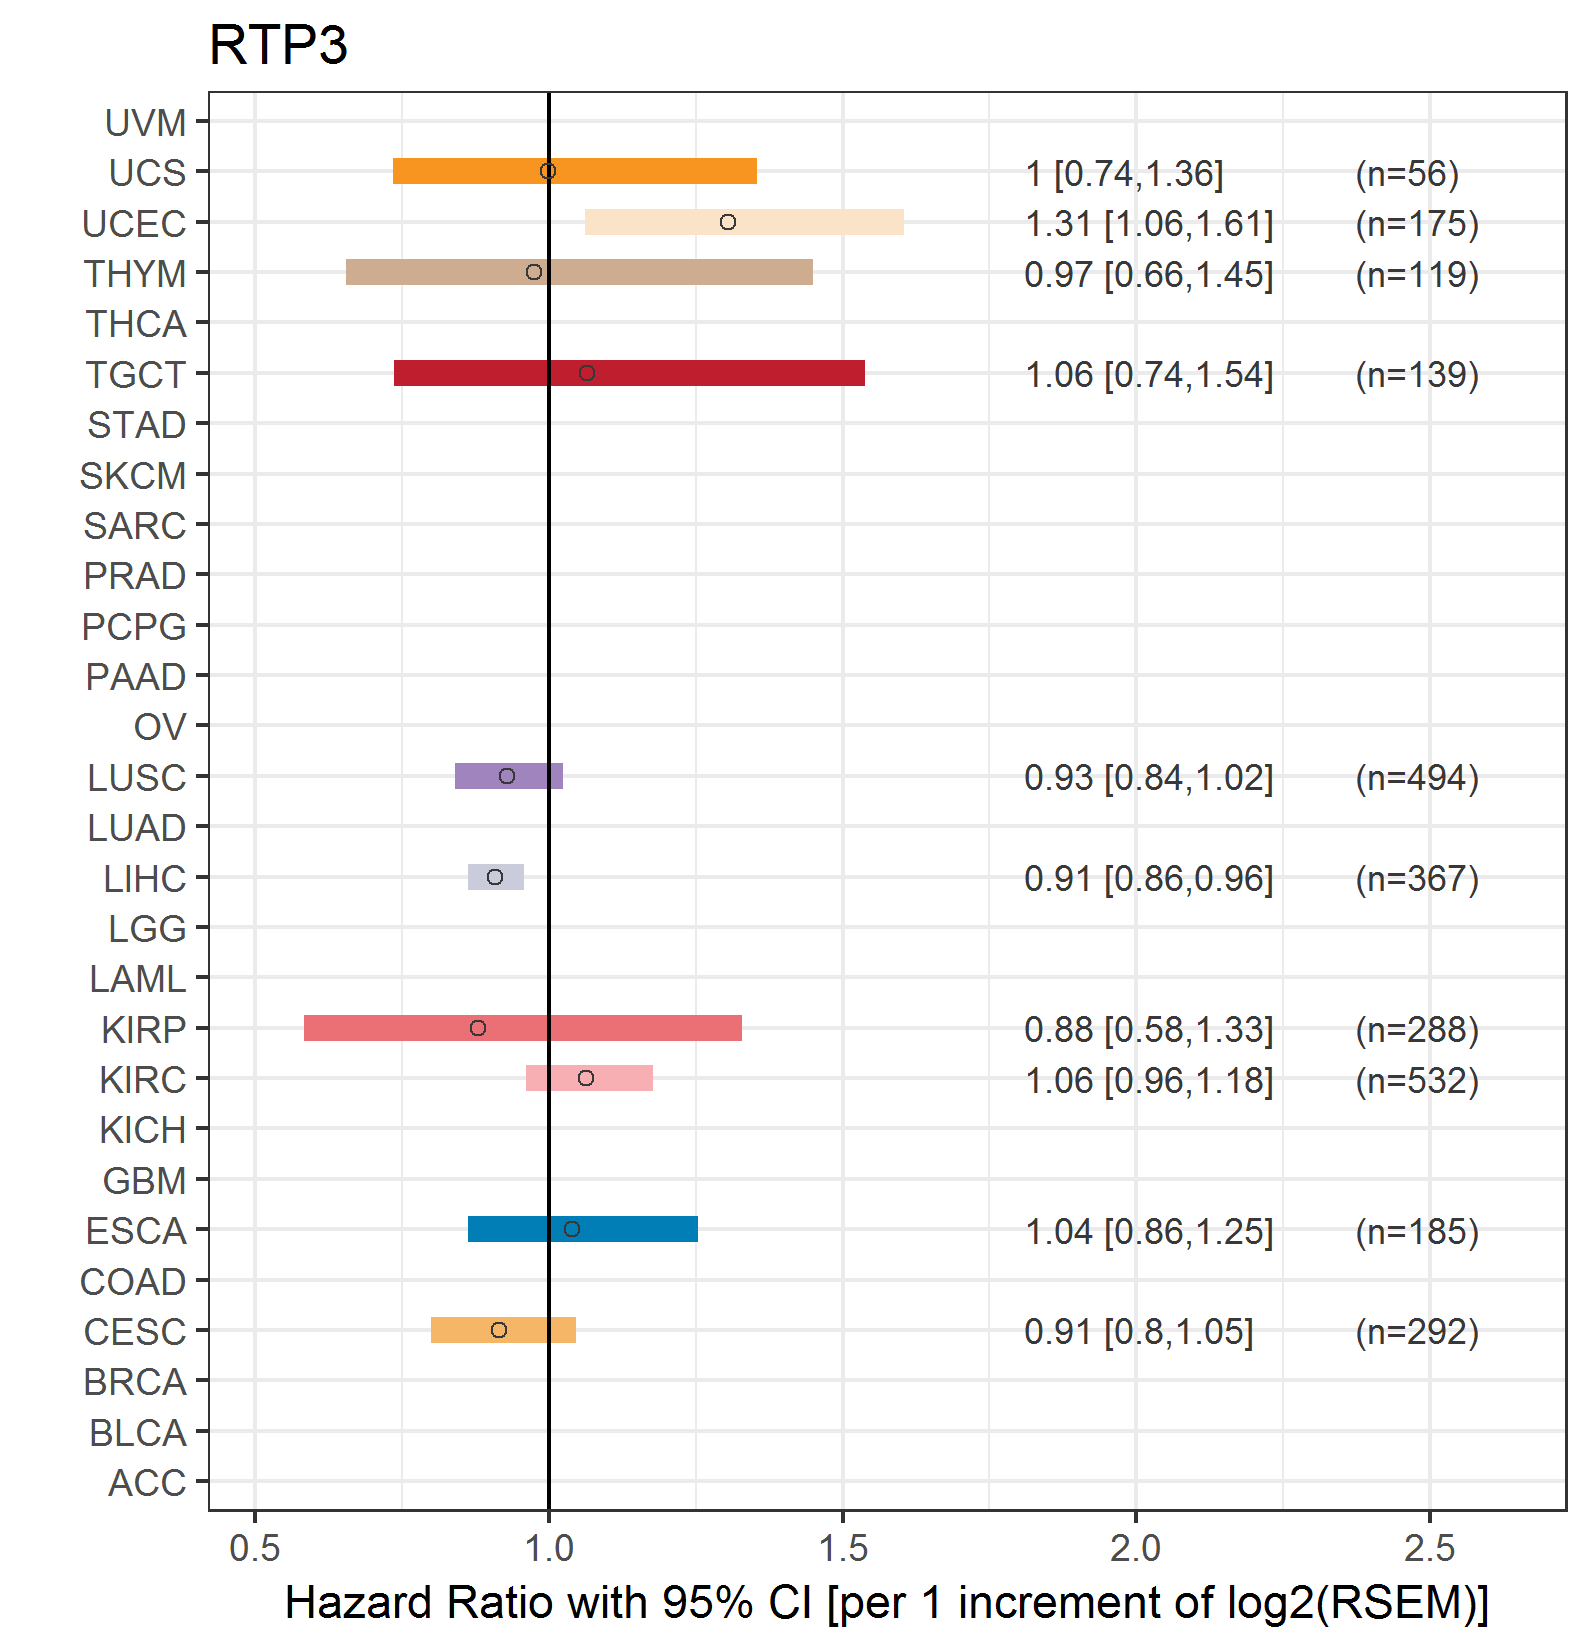
| Forest plot of Cox proportional hazard ratio (HR) and 95% CI of overall survival (OS) using 28 cancer types (TCGA IlluminaHiSeq_RNASeqV2, pan-cancer normalized log2(norm_counts+1) data, version 2016-08-16) (TCGA clinicalMatrix, phenotype data, version 2016-04-27) * Click on the image enlarge it in a new window. |
 |
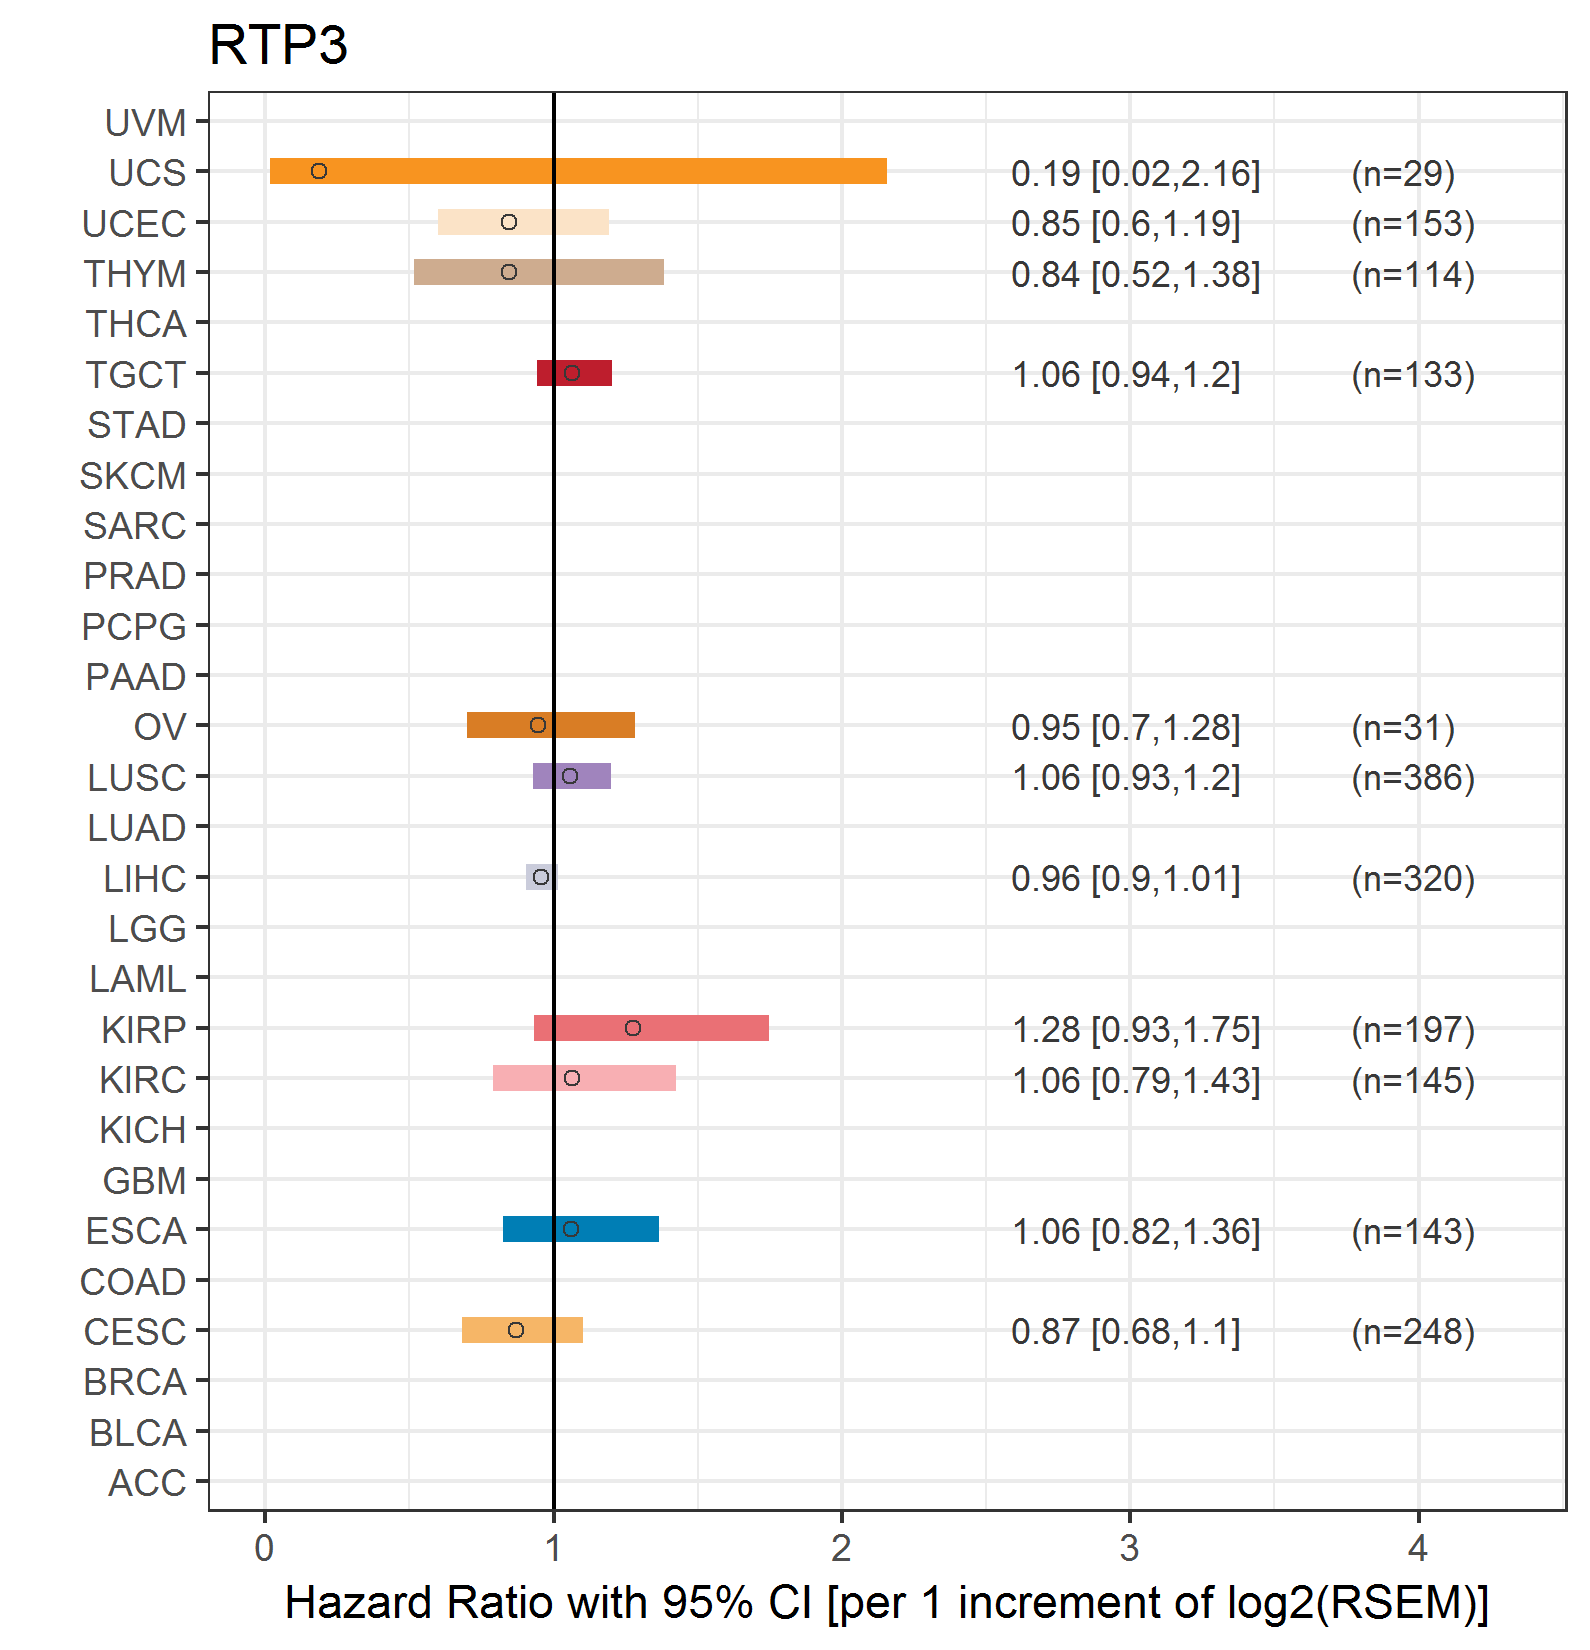
| Forest plot of Cox proportional hazard ratio (HR) and 95% CI of relapse free survival (RFS) using 28 cancer types (TCGA IlluminaHiSeq_RNASeqV2, pan-cancer normalized log2(norm_counts+1) data, version 2016-08-16) (TCGA clinicalMatrix, phenotype data, version 2016-04-27) * Click on the image enlarge it in a new window. |
 |
| Top |
| TissGeneClin for RTP3 |
| TissGeneDrug for RTP3 |
| Drug information targeting TissGene (DrugBank Version 5.0.6, 2017-04-01) |
| DrugBank ID | Drug name | Drug activity | Drug type | Drug status |
| Top |
| TissGeneDisease for RTP3 |
| Disease information associated with TissGene (DisGeNet, 2016-06-01) |
| Disease ID | Disease name | # pubmeds | Source |
| umls:C0023903 | Liver neoplasms | 1 | CTD_human |
| umls:C2239176 | Liver carcinoma | 1 | BeFree,CTD_human,LHGDN |
|
Copyright 2016-Present - The University of Texas Health Science Center at Houston (UTHealth) Web File Viewing | How to Report, Fraud, Waste and Abuse | State of Texas | Statewide Search | Texas Homeland Security | Site Policies |