 |
| |
| |
| |
| |
| |
| |
|

| TissGeneSummary for HIST1H4H |
 Gene summary Gene summary |
| Basic gene information | Gene symbol | HIST1H4H |
| Gene name | ||
| Synonyms | ||
| Cytomap | UCSC genome browser: | |
| Type of gene | ||
| RefGenes | ||
| Description | ||
| Modification date | ||
| dbXrefs | ||
| Protein | UniProt: go to UniProt's Cross Reference DB Table | |
| Expression | CleanEX: HS_HIST1H4H | |
| BioGPS: 8368 | ||
| Pathway | NCI Pathway Interaction Database: HIST1H4H | |
| KEGG: HIST1H4H | ||
| REACTOME: HIST1H4H | ||
| Pathway Commons: HIST1H4H | ||
| Context | iHOP: HIST1H4H | |
| ligand binding site mutation search in PubMed: HIST1H4H | ||
| UCL Cancer Institute: HIST1H4H | ||
| Assigned class in TissGDB* | C | |
| Included tissue-specific gene expression resources | TiGER,GTEx | |
| Specific-tissues in normal samples (assigned by TissGDB using HPA, TiGER, and GTEx) | Prostate | |
| Cancer types related to the specific-tissues in cancer samples (assigned by TissGDB using TCGA) | PRAD | |
| Reference showing the relevant tissue of HIST1H4H | ||
| Description by TissGene annotations | Cancer gene | |
| * Class A consists of genes with literature evidence and is part of the cTissGenes. Class B consists of only cTissGenes without additional evidence. The remaining genes belong to Class C. |
| Gene ontology having evidence of Inferred from Direct Assay (IDA) from Entrez |
| GO ID | GO term | PubMed ID |
| Top |
| TissGeneExp for HIST1H4H |
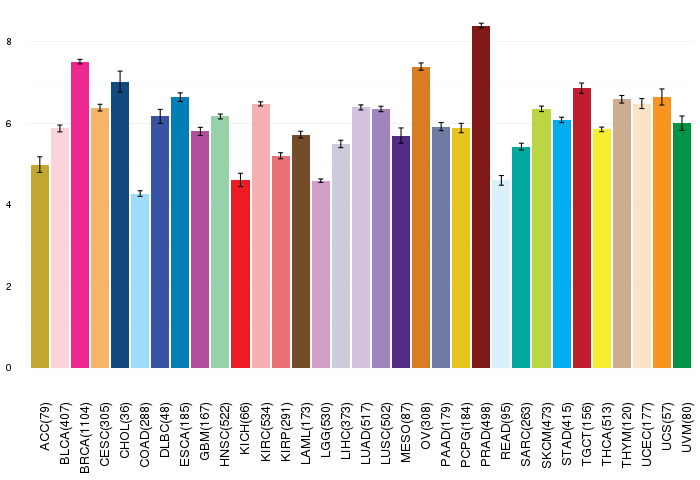
| Gene expressions across 28 cancer types (X-axis: cancer type and Y-axis: log2(norm_counts+1)) (TCGA IlluminaHiSeq_RNASeqV2, pan-cancer normalized log2(norm_counts+1) data, version 2016-08-16) |
 |
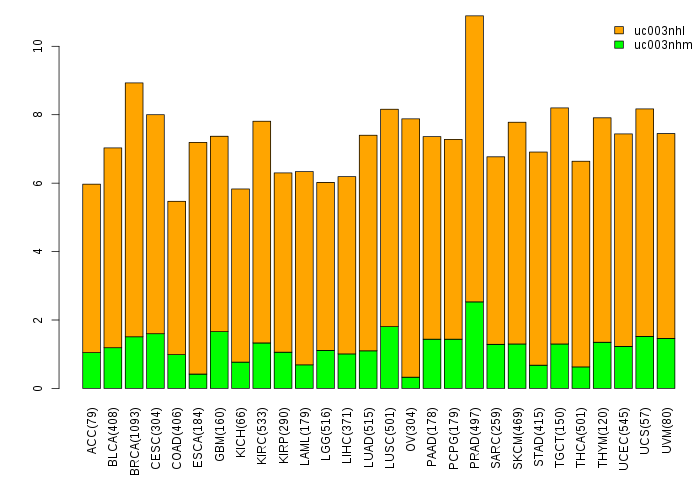
| Gene isoform expressions across 28 cancer types (X-axis: cancer type and Y-axis: log2(norm_counts+1)) (TCGA pan-cancer tcga_rsem_isoform_tpm, version 2016-09-01) |
 |
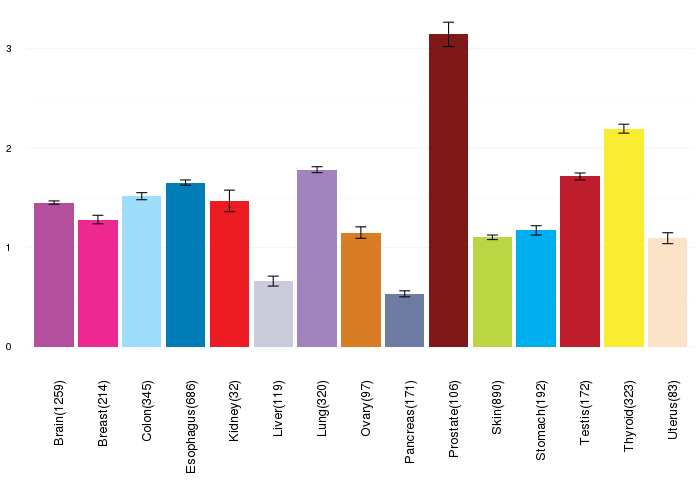
| Gene expressions across normal tissues of GTEx data (GTEx GTEx_Analysis_v6_RNA-seq_RNA-SeQCv1.1.8_gene_rpkm.gct) - Here, we shows the matched tissue types only among our 28 cancer types. |
 |
| Different expressions across 14 cancer types with more than 10 samples between matched tumors and normals (X-axis: cancer type and Y-axis: log2(norm_counts+1)) (TCGA IlluminaHiSeq_RNASeqV2, pan-cancer normalized log2(norm_counts+1) data, version 2016-08-16) |
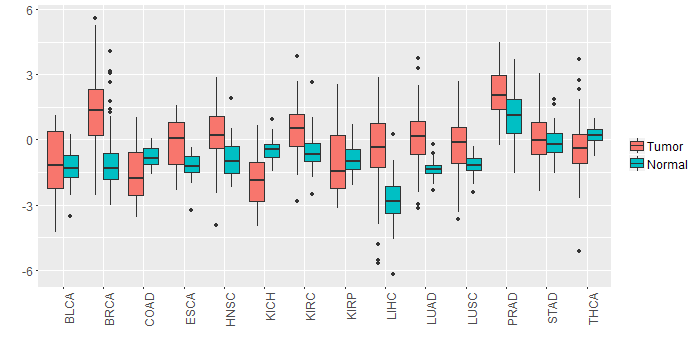 |
| - Significantly differentially expressed cancer types and information. (|Fold change|>1 and FDR<0.05) |
| Cancer type | Mean(exp) in tumor | Mean(exp) in matched normal | Log2FC | P-val. | FDR |
| HNSC | 0.22768148 | -0.936658055 | 1.164339535 | 1.50E-05 | 8.15E-05 |
| PRAD | 2.072837517 | 1.03524521 | 1.037592308 | 9.93E-06 | 5.54E-05 |
| BRCA | 1.367764609 | -1.037312584 | 2.405077193 | 4.74E-25 | 4.75E-24 |
| LUAD | 0.048583605 | -1.345995705 | 1.39457931 | 3.33E-10 | 1.88E-09 |
| KICH | -1.896455636 | -0.445575636 | -1.45088 | 5.44E-06 | 1.81E-05 |
| LIHC | -0.591573636 | -2.760861636 | 2.169288 | 1.22E-09 | 1.31E-08 |
| KIRC | 0.477227475 | -0.553251692 | 1.030479167 | 3.78E-09 | 1.19E-08 |
| Top |
| TissGene-miRNA for HIST1H4H |
| Significantly anti-correlated miRNAs of TissGene across 28 cancer types (Gene-miRNA relations from TargetScanHuman Relsease 7.1, Conserved_Site_Context_Scores.txt.zip, 06.01.2016) (TCGA IlluminaHiSeq_miRNASeq, log2(RPM+1) data, version 2016-11-21) (TCGA IlluminaHiSeq_RNASeqV2, log2(normalized_count+1) data, version 2016-08-16) (Spearman’s Rank Correlation (p-value<0.05 and coefficient<-0.25)) |
| Cancer type | miRNA id | miRNA accession | P-val. | Coeff. | # samples |
| Top |
| TissGeneMut for HIST1H4H |
| TissGeneSNV for HIST1H4H |
| nsSNV counts per each loci. Different colors of circles represent different cancer types. Circle size denotes number of samples. (TCGA somatic mutation (SNPs and small INDELs) data, version 2016-04-25) * Click on the image to enlarge it in a new window. |
 |
| Somatic nucleotide variants of TissGene across 28 cancer types (X-axis: cancer type and Y-axis: % of mutated samples) The numbers in parentheses are numbers of samples with mutation (nsSNVs). (TCGA somatic mutation (SNPs and small INDELs) data, version 2016-04-25) |
 |
| - nsSNVs sorted by frequency. |
| AAchange | Cancer type | # samples |
| p.G103D | DLBC | 1 |
| p.A16V | OV | 1 |
| p.K6E | LUAD | 1 |
| p.K17N | STAD | 1 |
| p.A39T | LUAD | 1 |
| p.S2C | BLCA | 1 |
| p.S2C | OV | 1 |
| p.A77T | STAD | 1 |
| p.I51F | LUAD | 1 |
| p.T31A | LUSC | 1 |
| p.V66E | DLBC | 1 |
| p.Y52C | ESCA | 1 |
| p.E64Q | BLCA | 1 |
| p.E75G | HNSC | 1 |
| Top |
| TissGeneCNV for HIST1H4H |
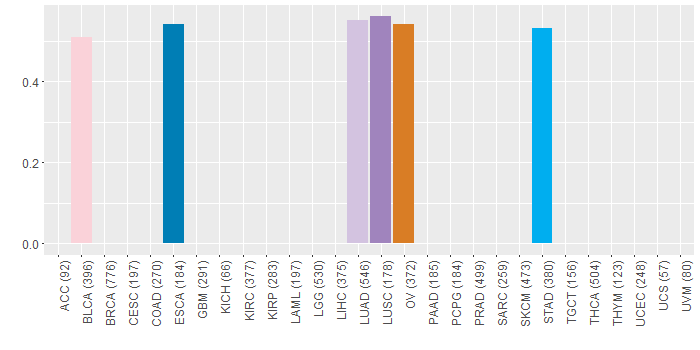
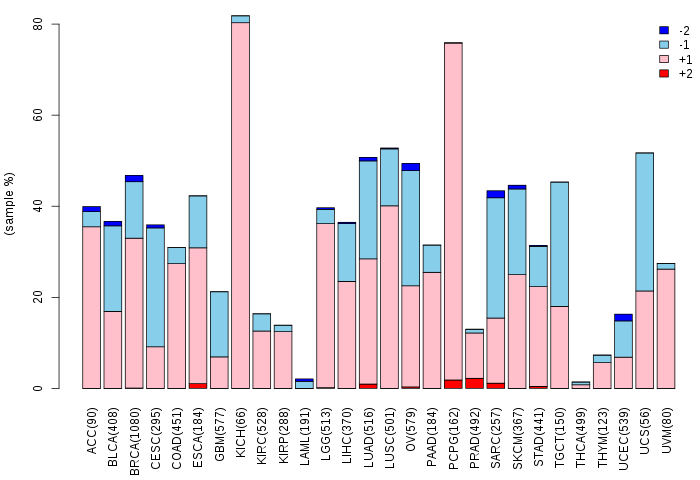
| Copy number variations of TissGene across 28 cancer types (X-axis: cancer type and Y-axis: % of CNV samples) (TCGA Gistic2_CopyNumber_Gistic2_all_data_by_genes, Gistic2 copy number data, version 2016-08-16) |
 |
| Top |
| TissGeneFusions for HIST1H4H |
| Fusion genes including TissGene (ChimerDB 3.0, 2016-12-01 and TCGA fusion Portal 2015-12-01) |
| Database | Src | Cancer type | Sample | Fusion gene | ORF | 5'-gene BP | 3'-gene BP |
| Top |
| TissGeneNet for HIST1H4H |
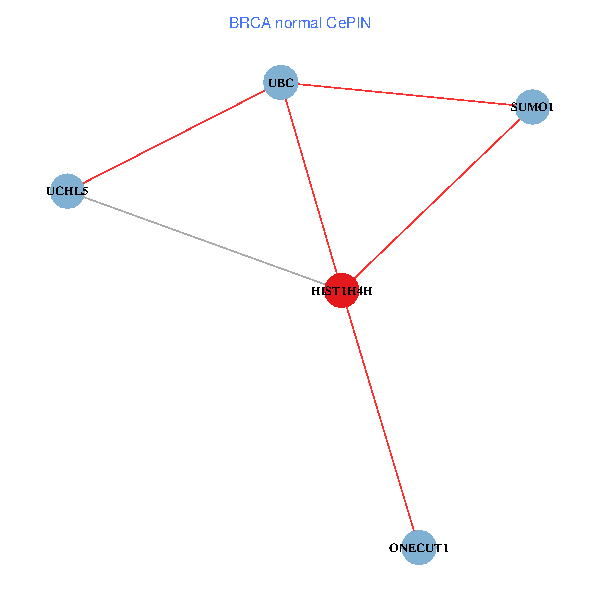
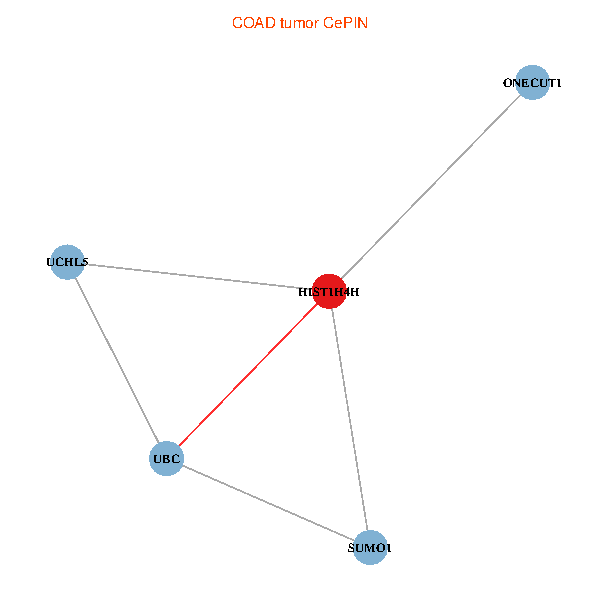
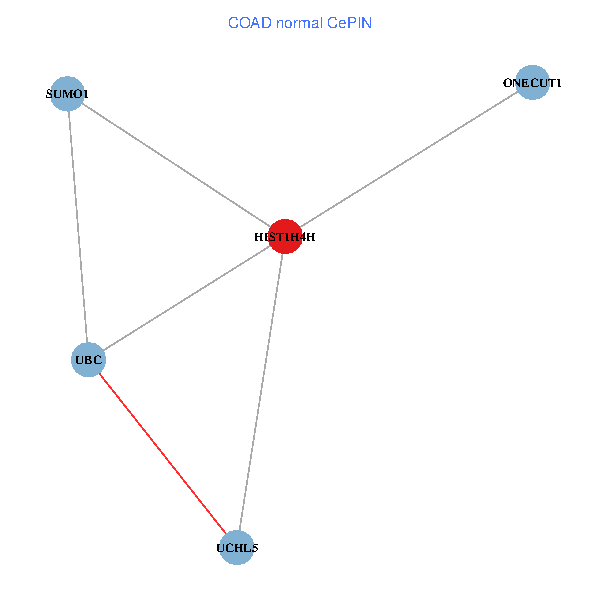
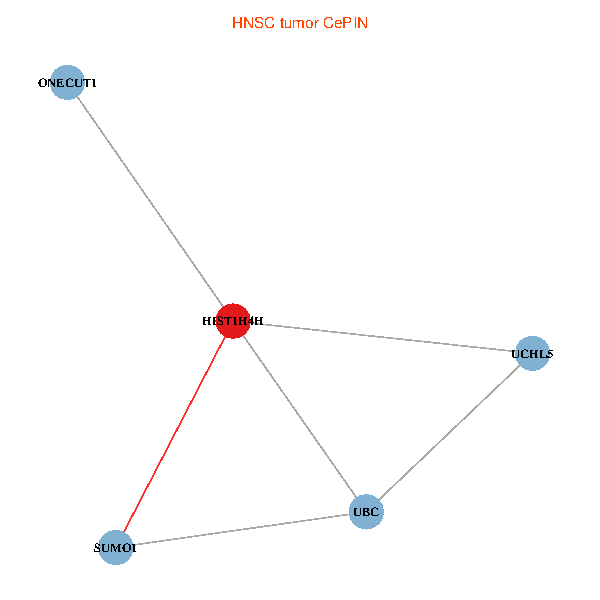
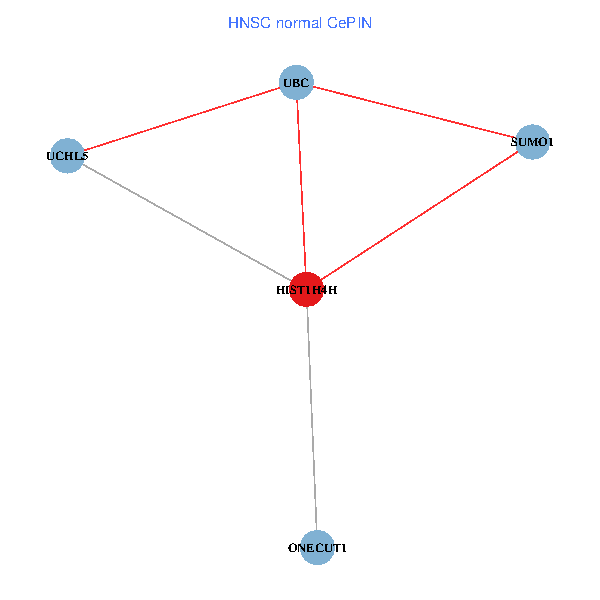
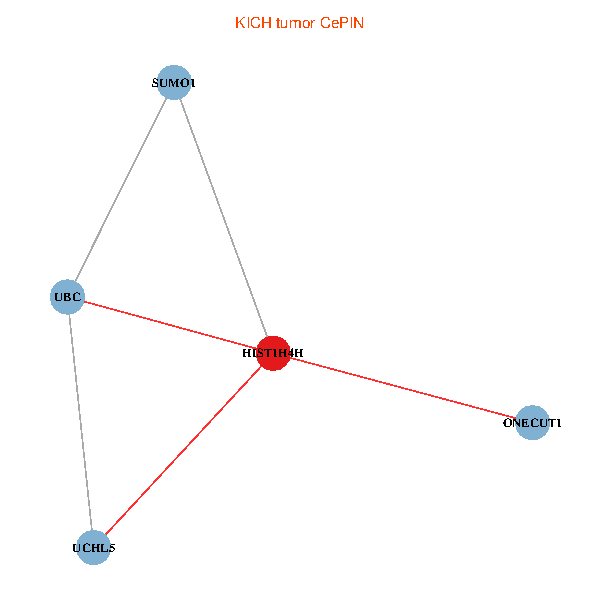
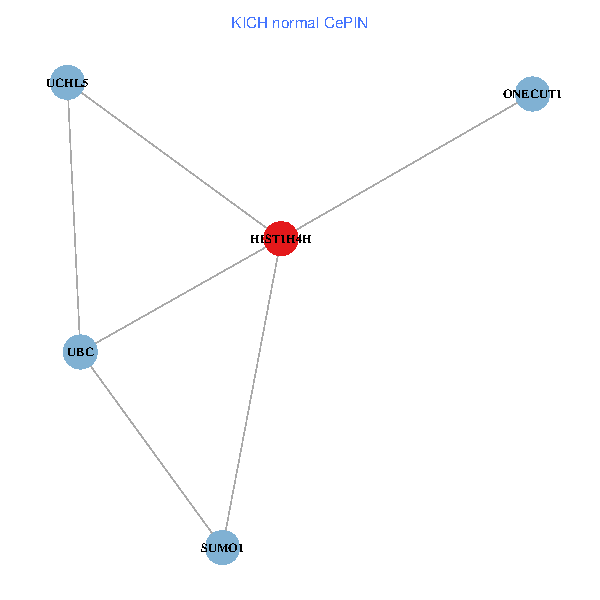
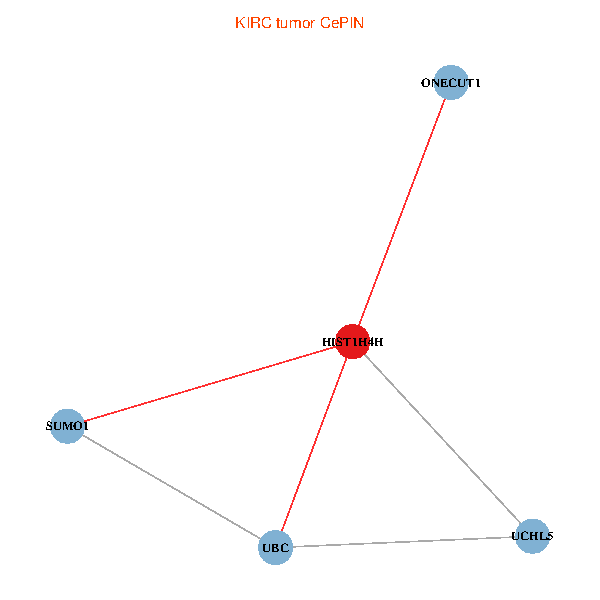
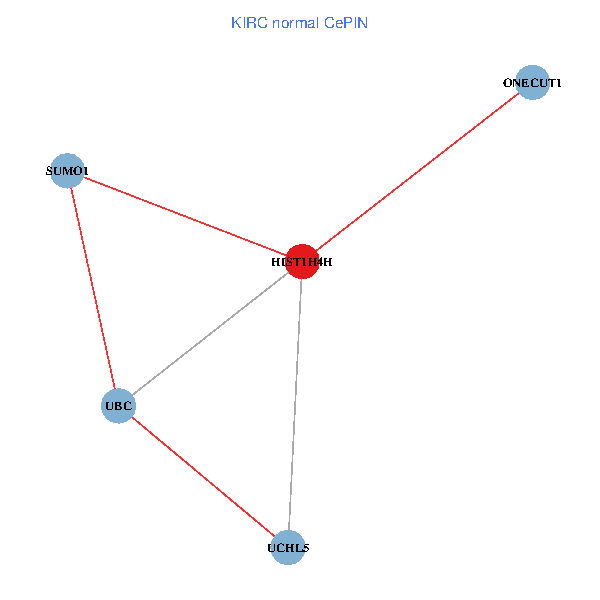
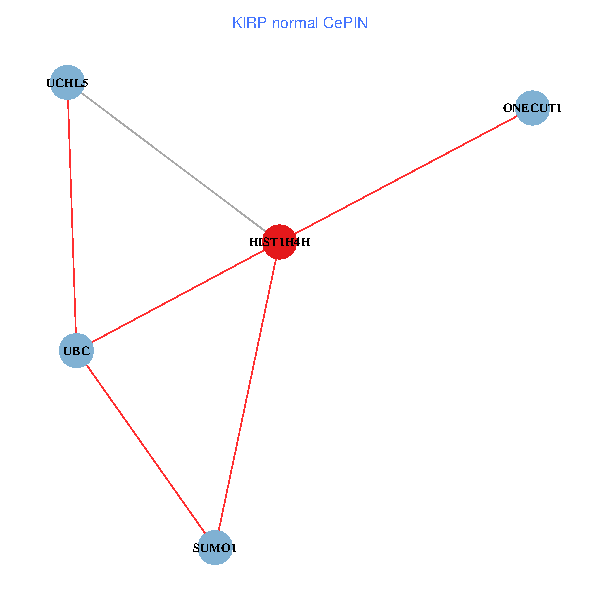
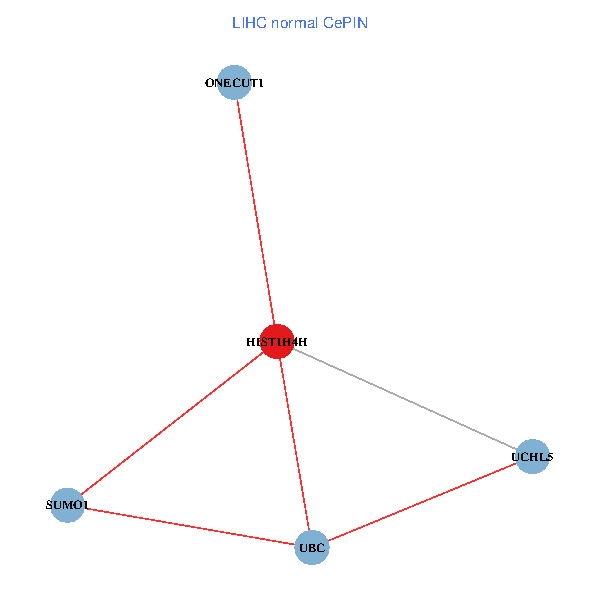
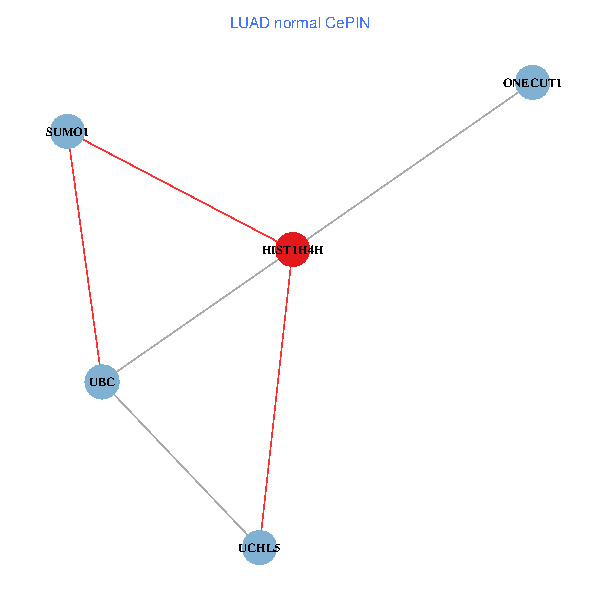
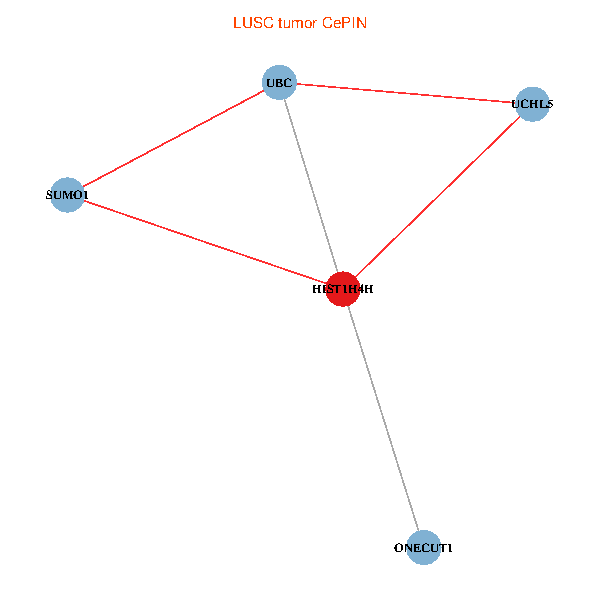
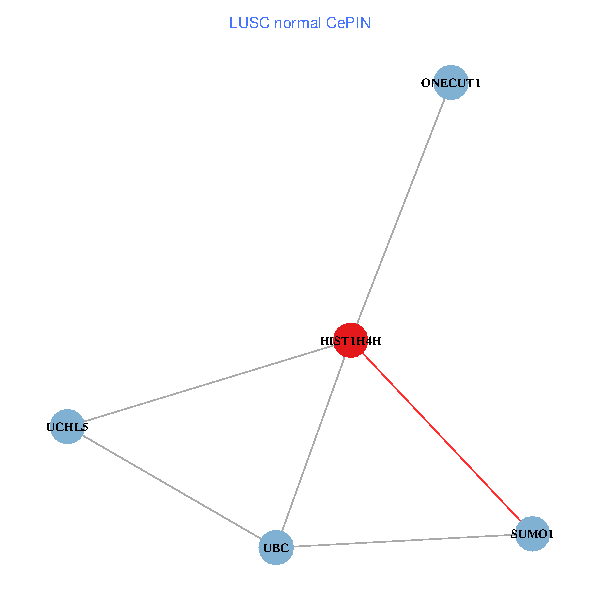
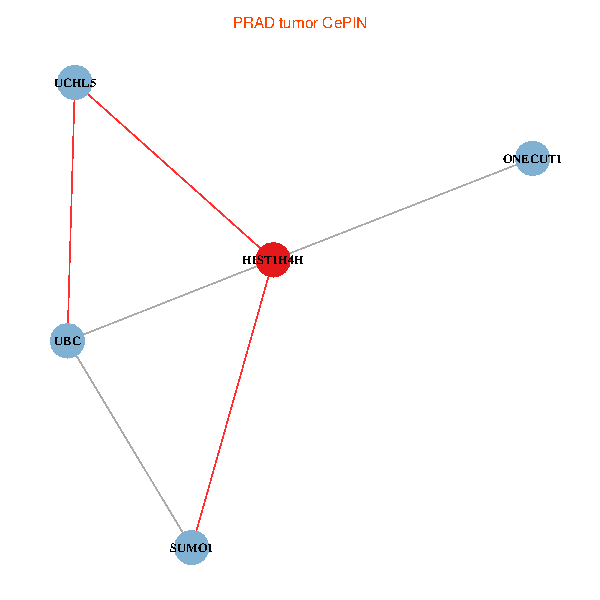
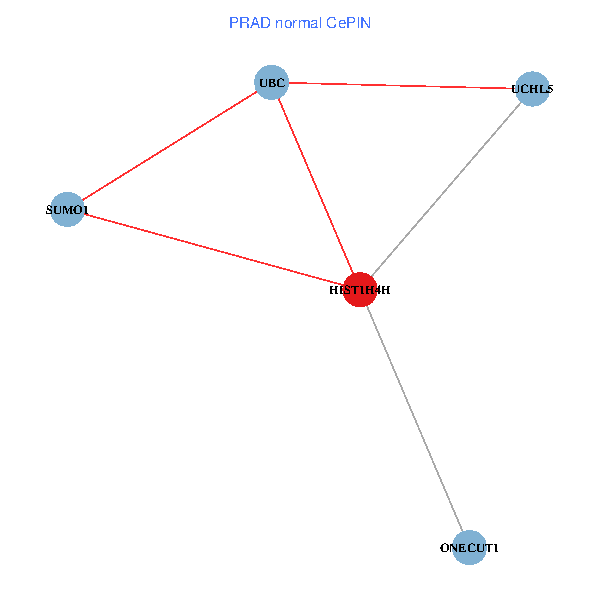
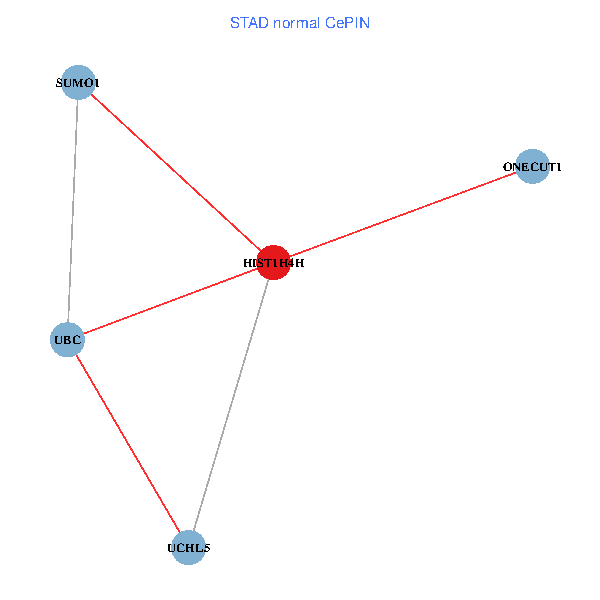
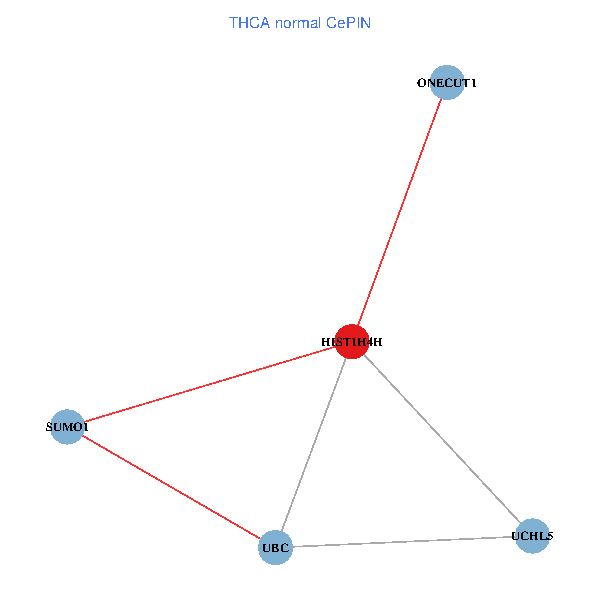
| Co-expressed gene networks based on protein-protein interaction data (CePIN) (TCGA IlluminaHiSeq_RNASeqV2, pan-cancer normalized log2(norm_counts+1) data, version 2016-08-16) (PINA2 ppi data) |
| BRCA (tumor) | BRCA (normal) |
| HIST1H4H, UBC, ONECUT1, SUMO1, UCHL5 (tumor) | HIST1H4H, UBC, ONECUT1, SUMO1, UCHL5 (normal) |
 |  |
| COAD (tumor) | COAD (normal) |
| HIST1H4H, UBC, ONECUT1, SUMO1, UCHL5 (tumor) | HIST1H4H, UBC, ONECUT1, SUMO1, UCHL5 (normal) |
 |  |
| HNSC (tumor) | HNSC (normal) |
| HIST1H4H, UBC, ONECUT1, SUMO1, UCHL5 (tumor) | HIST1H4H, UBC, ONECUT1, SUMO1, UCHL5 (normal) |
 |  |
| KICH (tumor) | KICH (normal) |
| HIST1H4H, UBC, ONECUT1, SUMO1, UCHL5 (tumor) | HIST1H4H, UBC, ONECUT1, SUMO1, UCHL5 (normal) |
 |  |
| KIRC (tumor) | KIRC (normal) |
| HIST1H4H, UBC, ONECUT1, SUMO1, UCHL5 (tumor) | HIST1H4H, UBC, ONECUT1, SUMO1, UCHL5 (normal) |
 |  |
| KIRP (tumor) | KIRP (normal) |
| HIST1H4H, UBC, ONECUT1, SUMO1, UCHL5 (tumor) | HIST1H4H, UBC, ONECUT1, SUMO1, UCHL5 (normal) |
 |  |
| LIHC (tumor) | LIHC (normal) |
| HIST1H4H, UBC, ONECUT1, SUMO1, UCHL5 (tumor) | HIST1H4H, UBC, ONECUT1, SUMO1, UCHL5 (normal) |
 |  |
| LUAD (tumor) | LUAD (normal) |
| HIST1H4H, UBC, ONECUT1, SUMO1, UCHL5 (tumor) | HIST1H4H, UBC, ONECUT1, SUMO1, UCHL5 (normal) |
 |  |
| LUSC (tumor) | LUSC (normal) |
| HIST1H4H, UBC, ONECUT1, SUMO1, UCHL5 (tumor) | HIST1H4H, UBC, ONECUT1, SUMO1, UCHL5 (normal) |
 |  |
| PRAD (tumor) | PRAD (normal) |
| HIST1H4H, UBC, ONECUT1, SUMO1, UCHL5 (tumor) | HIST1H4H, UBC, ONECUT1, SUMO1, UCHL5 (normal) |
 |  |
| STAD (tumor) | STAD (normal) |
| HIST1H4H, UBC, ONECUT1, SUMO1, UCHL5 (tumor) | HIST1H4H, UBC, ONECUT1, SUMO1, UCHL5 (normal) |
 |  |
| THCA (tumor) | THCA (normal) |
| HIST1H4H, UBC, ONECUT1, SUMO1, UCHL5 (tumor) | HIST1H4H, UBC, ONECUT1, SUMO1, UCHL5 (normal) |
 |  |
| Top |
| TissGeneProg for HIST1H4H |
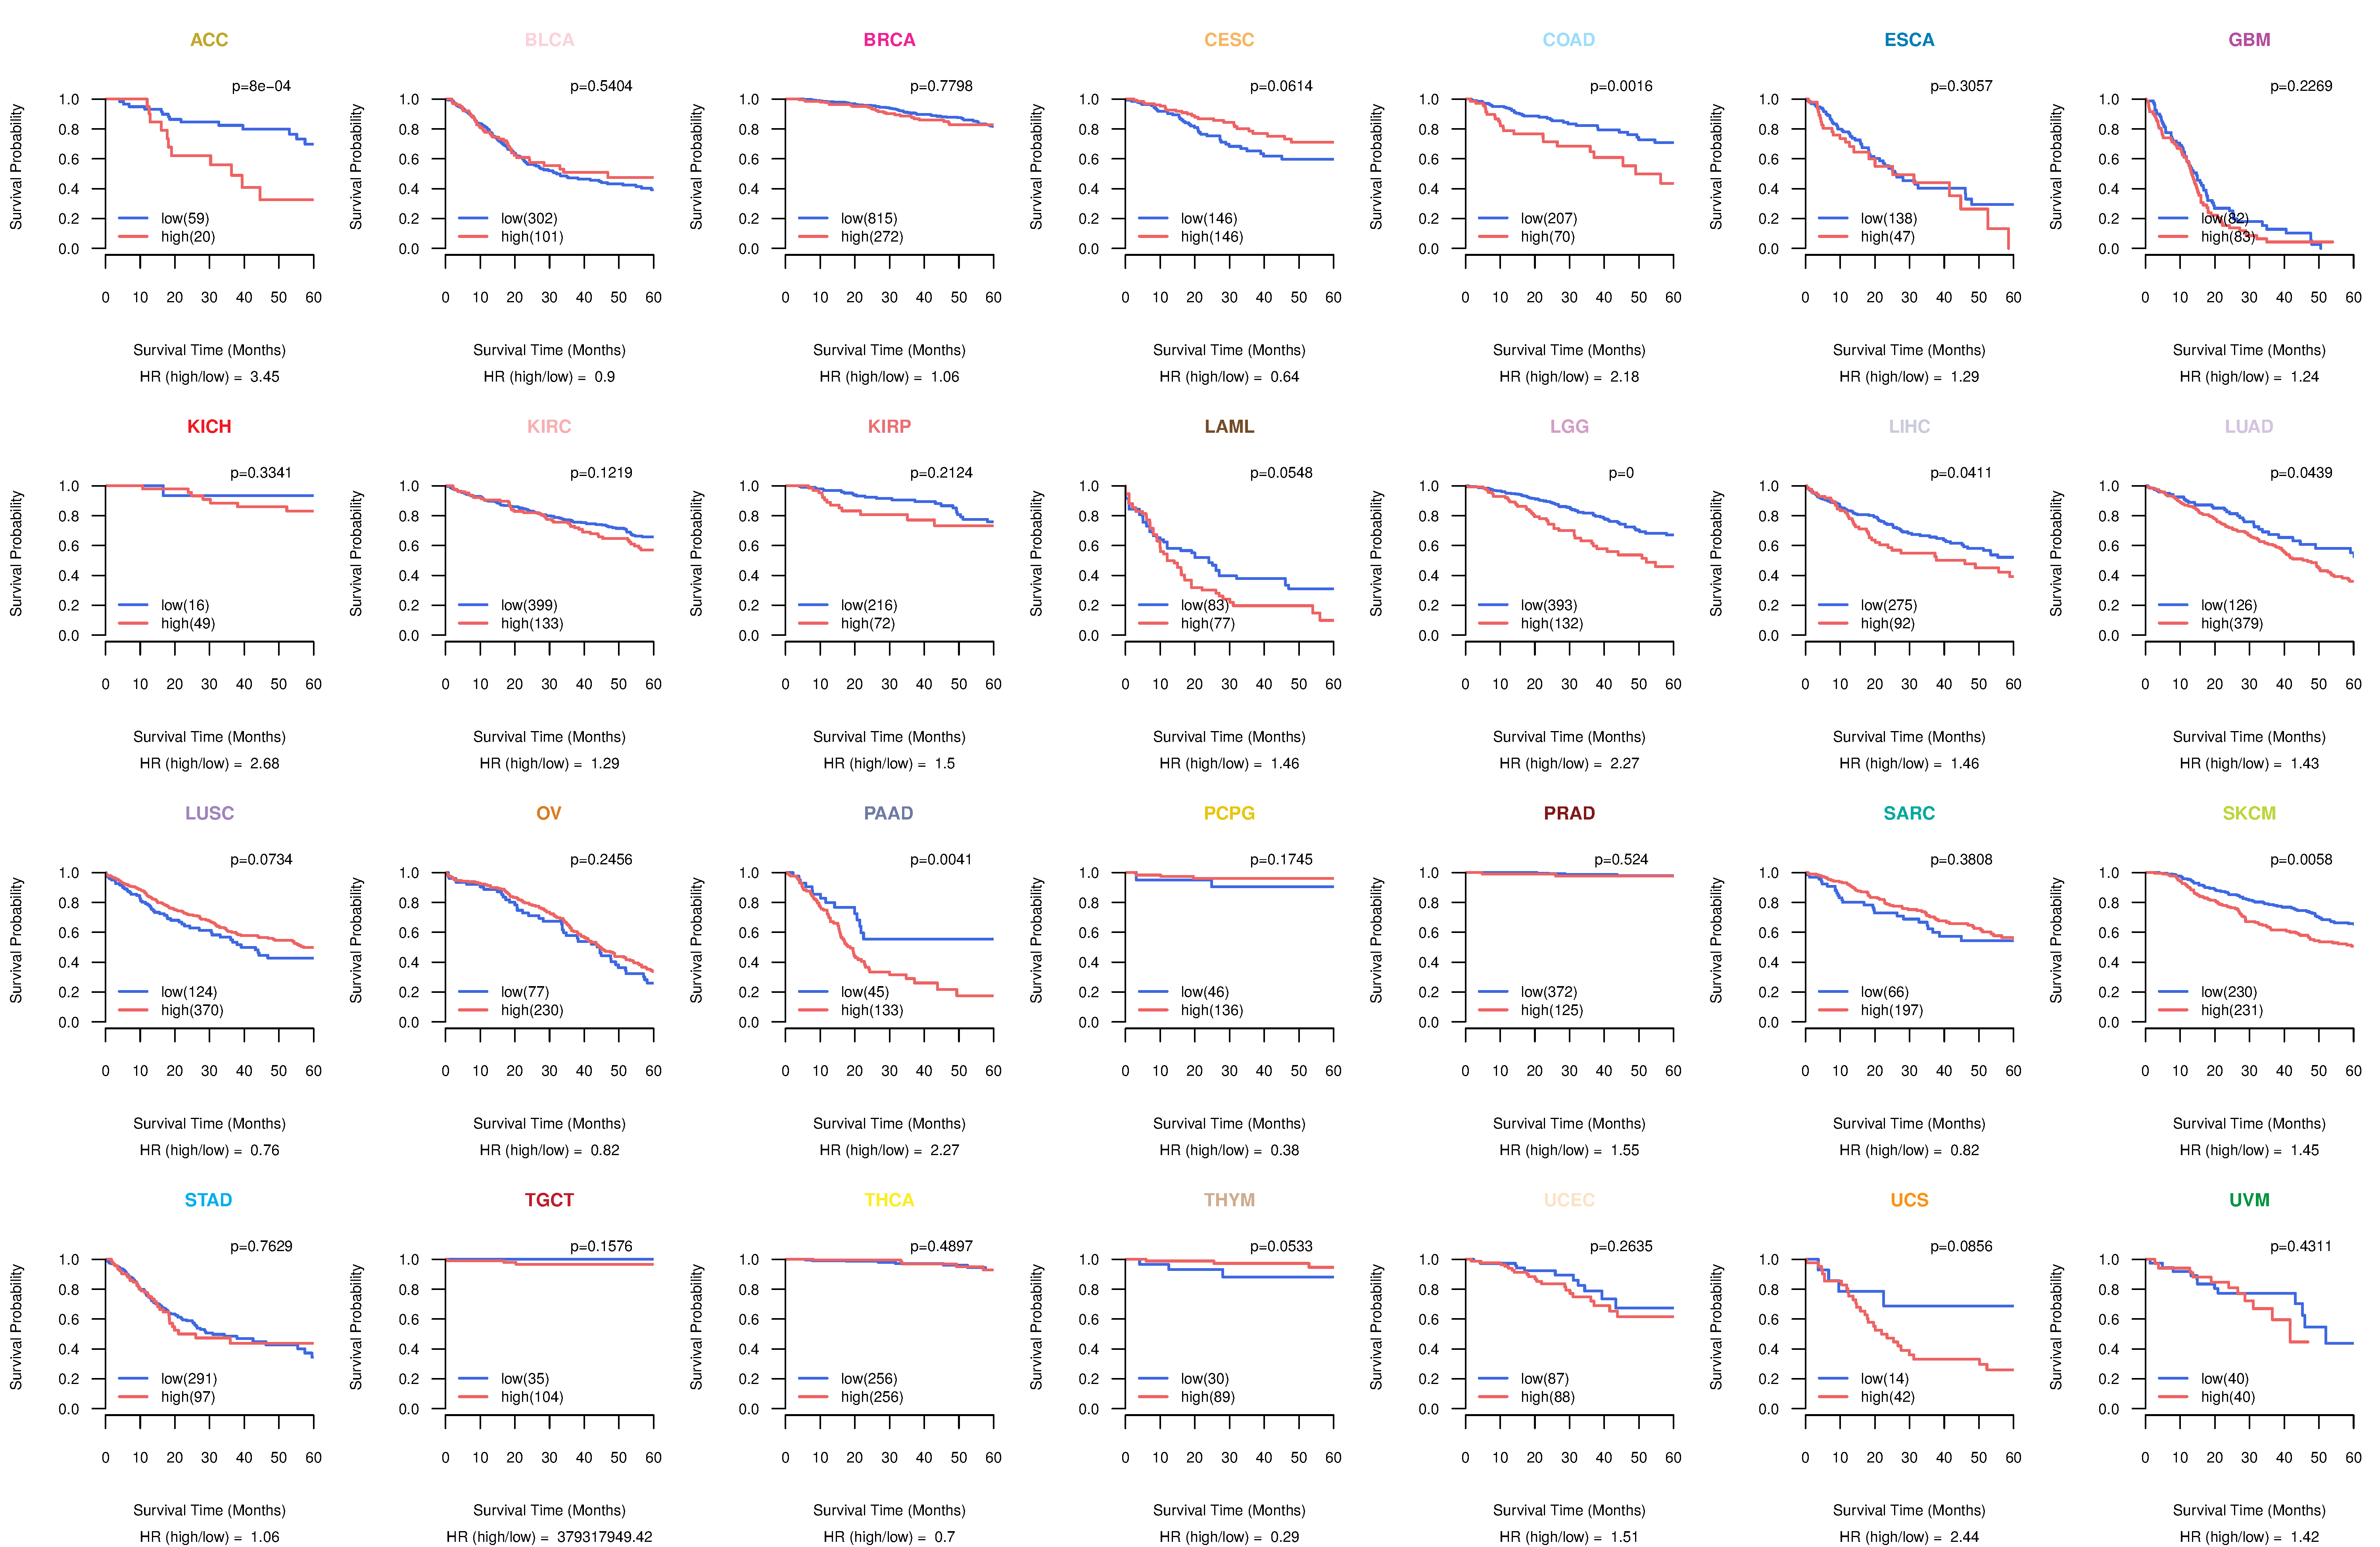
| Kaplan-Meier plots with logrank tests of overall survival (OS) using 28 cancer types (TCGA IlluminaHiSeq_RNASeqV2, pan-cancer normalized log2(norm_counts+1) data, version 2016-08-16) (TCGA clinicalMatrix, phenotype data, version 2016-04-27) * Click on the image to enlarge it in a new window. |
 |
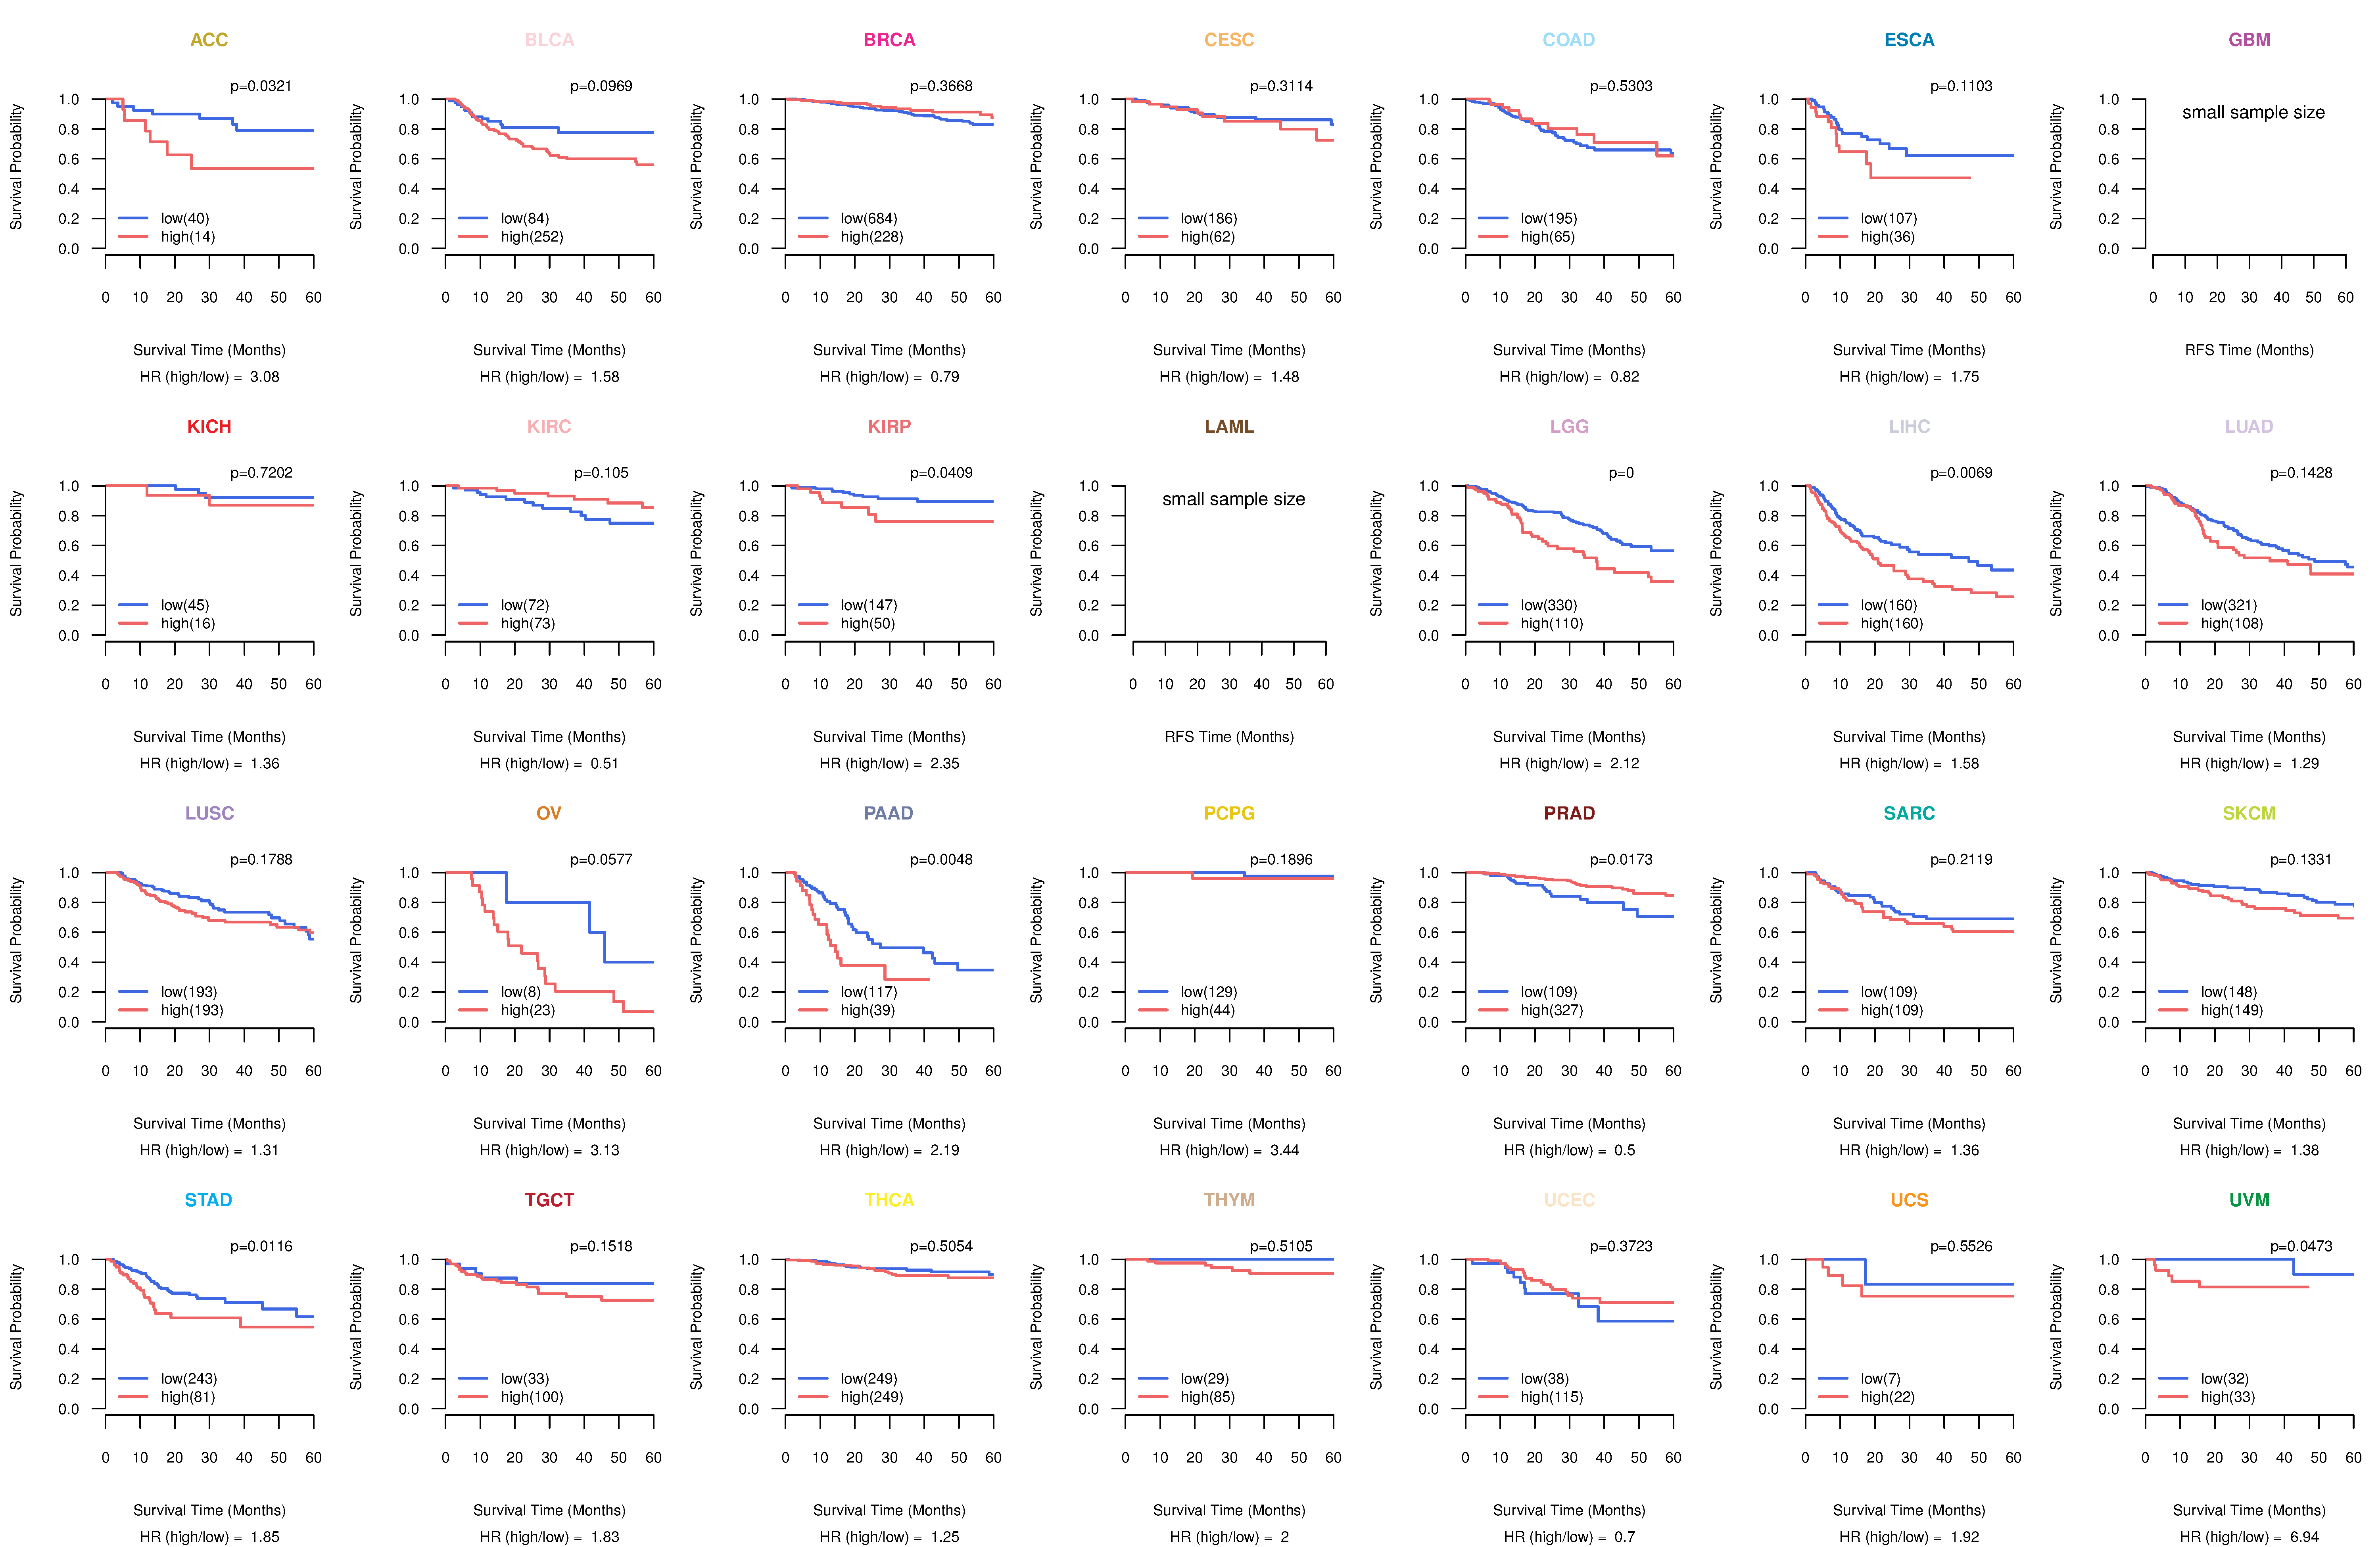
| Kaplan-Meier plots with logrank test of relapse free survival (RFS) using 28 cancer types (TCGA IlluminaHiSeq_RNASeqV2, pan-cancer normalized log2(norm_counts+1) data, version 2016-08-16) (TCGA clinicalMatrix, phenotype data, version 2016-04-27) * Click on the image enlarge it in a new window. |
 |
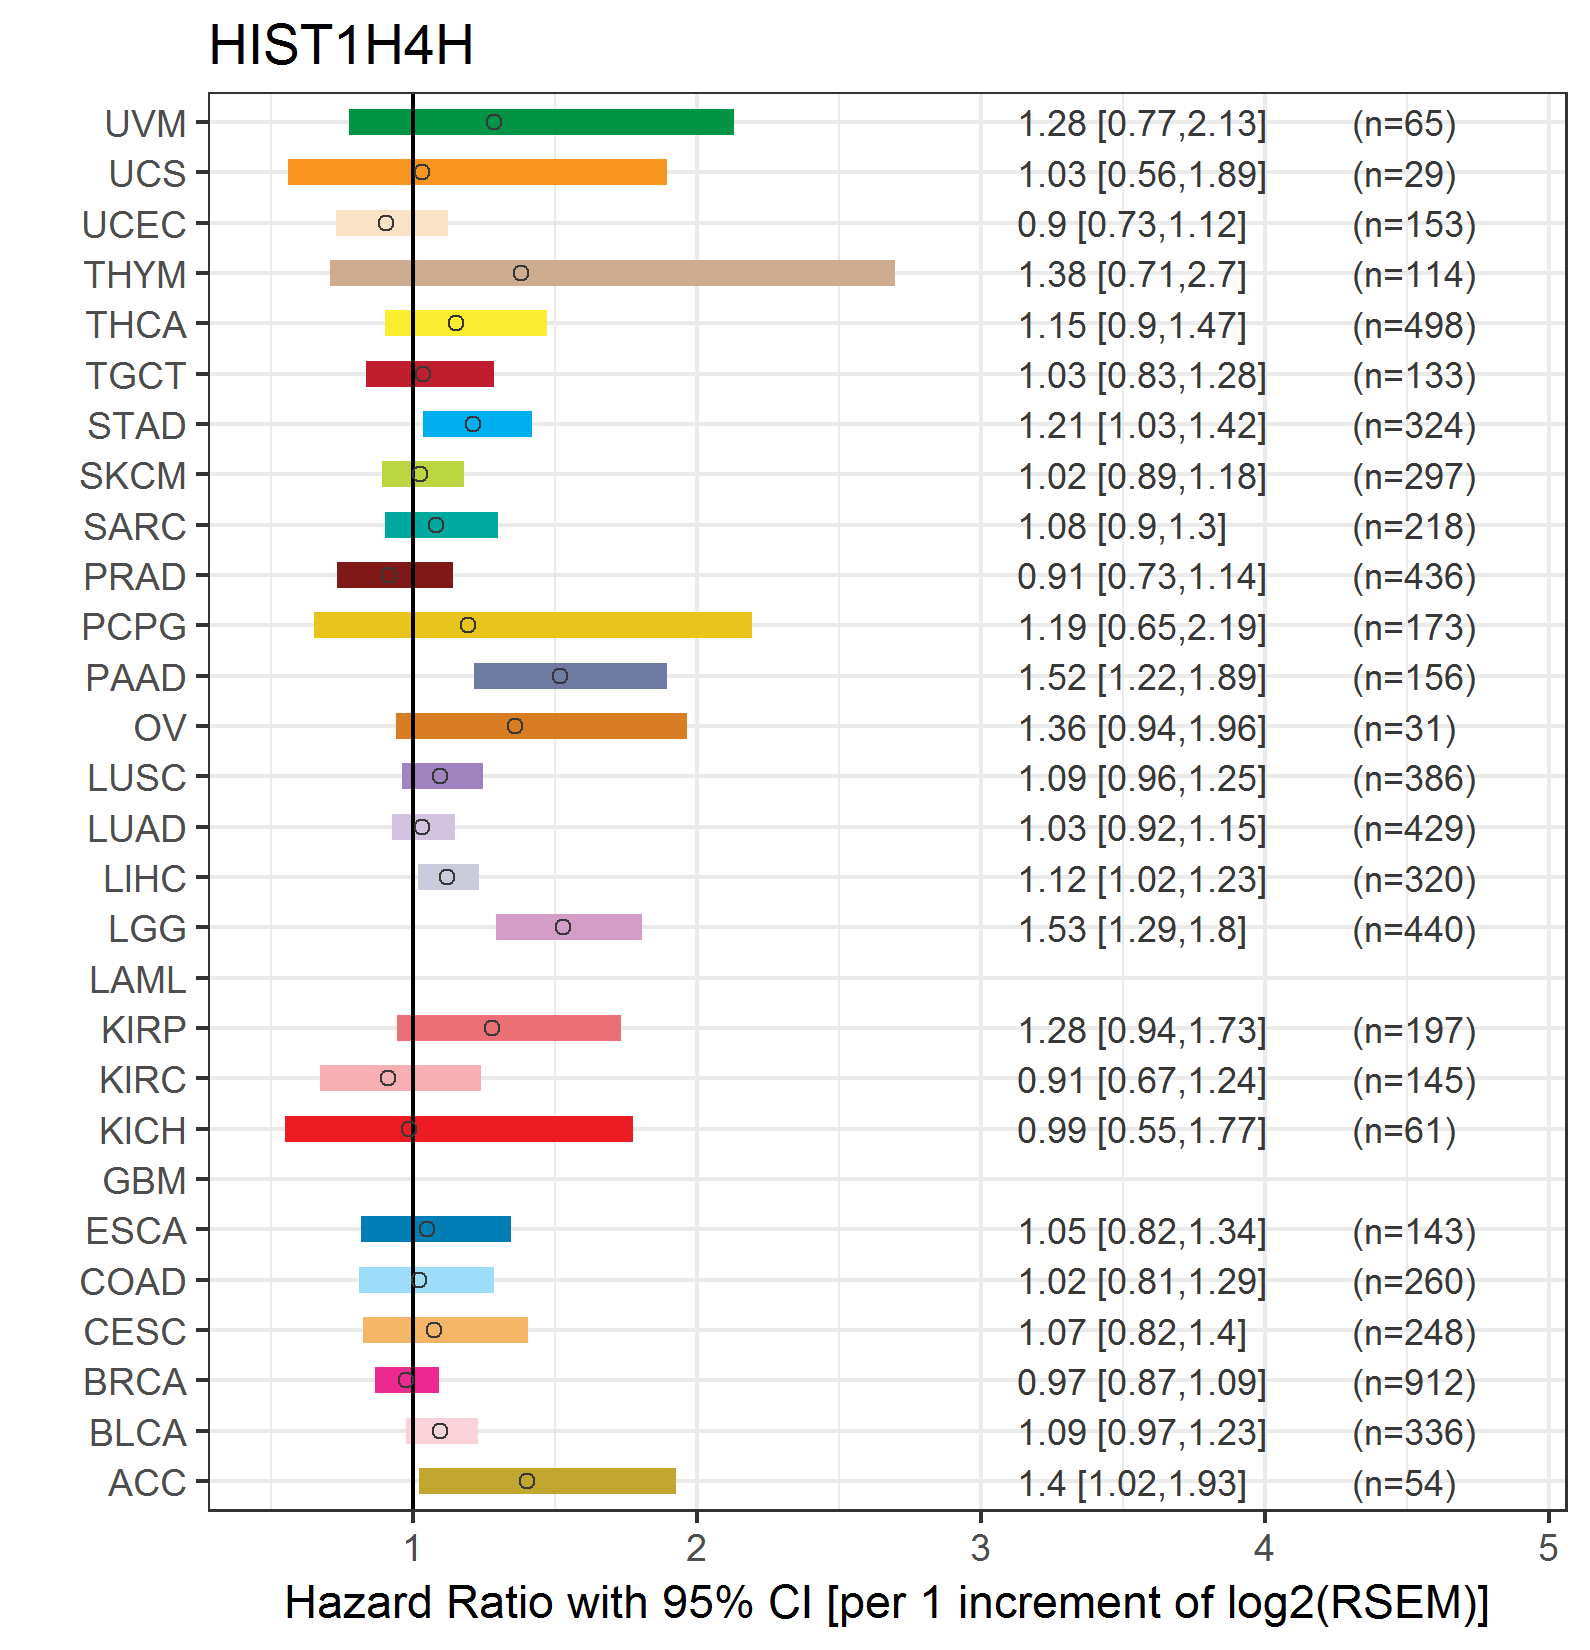
| Forest plot of Cox proportional hazard ratio (HR) and 95% CI of overall survival (OS) using 28 cancer types (TCGA IlluminaHiSeq_RNASeqV2, pan-cancer normalized log2(norm_counts+1) data, version 2016-08-16) (TCGA clinicalMatrix, phenotype data, version 2016-04-27) * Click on the image enlarge it in a new window. |
 |
| Forest plot of Cox proportional hazard ratio (HR) and 95% CI of relapse free survival (RFS) using 28 cancer types (TCGA IlluminaHiSeq_RNASeqV2, pan-cancer normalized log2(norm_counts+1) data, version 2016-08-16) (TCGA clinicalMatrix, phenotype data, version 2016-04-27) * Click on the image enlarge it in a new window. |
 |
| Top |
| TissGeneClin for HIST1H4H |
| TissGeneDrug for HIST1H4H |
| Drug information targeting TissGene (DrugBank Version 5.0.6, 2017-04-01) |
| DrugBank ID | Drug name | Drug activity | Drug type | Drug status |
| Top |
| TissGeneDisease for HIST1H4H |
| Disease information associated with TissGene (DisGeNet, 2016-06-01) |
| Disease ID | Disease name | # pubmeds | Source |
| umls:C0596263 | Carcinogenesis | 4 | BeFree |
| umls:C0023473 | Myeloid Leukemia, Chronic | 3 | BeFree |
| umls:C2239176 | Liver carcinoma | 3 | BeFree |
| umls:C0024141 | Lupus Erythematosus, Systemic | 2 | BeFree |
| umls:C1458155 | Mammary Neoplasms | 2 | BeFree |
| umls:C0007131 | Non-Small Cell Lung Carcinoma | 1 | BeFree |
| umls:C0007137 | Squamous cell carcinoma | 1 | BeFree |
| umls:C0008626 | Congenital chromosomal disease | 1 | BeFree |
| umls:C0017638 | Glioma | 1 | BeFree |
| umls:C0023467 | Leukemia, Myelocytic, Acute | 1 | BeFree |
| umls:C0025202 | melanoma | 1 | BeFree |
| umls:C0027627 | Neoplasm Metastasis | 1 | BeFree |
| umls:C0033578 | Prostatic Neoplasms | 1 | CTD_human |
| umls:C0035372 | Rett Syndrome | 1 | BeFree |
| umls:C0036421 | Systemic Scleroderma | 1 | BeFree |
| umls:C0149925 | Small cell carcinoma of lung | 1 | BeFree |
| umls:C0206659 | Embryonal Carcinoma | 1 | BeFree |
| umls:C0238288 | Muscular Dystrophy, Facioscapulohumeral | 1 | BeFree |
| umls:C0278484 | Malignant neoplasm of colon stage IV | 1 | BeFree |
| umls:C0278504 | Non-small cell lung cancer stage I | 1 | BeFree |
| umls:C0279626 | Squamous cell carcinoma of esophagus | 1 | BeFree |
| umls:C0346429 | Multiple malignancy | 1 | BeFree |
| umls:C1527249 | Colorectal Cancer | 1 | BeFree |
|
Copyright 2016-Present - The University of Texas Health Science Center at Houston (UTHealth) Web File Viewing | How to Report, Fraud, Waste and Abuse | State of Texas | Statewide Search | Texas Homeland Security | Site Policies |