 |
| |
| |
| |
| |
| |
| |
|

| TissGeneSummary for KIRREL2 |
 Gene summary Gene summary |
| Basic gene information | Gene symbol | KIRREL2 |
| Gene name | kin of IRRE like 2 (Drosophila) | |
| Synonyms | FILTRIN|NEPH3|NLG1 | |
| Cytomap | UCSC genome browser: 19q13.12 | |
| Type of gene | protein-coding | |
| RefGenes | NM_032123.6, NM_199179.3,NM_199180.3, | |
| Description | kin of IRRE-like protein 2kin of irregular chiasm-like protein 2nephrin-like gene 1nephrin-like protein 3 | |
| Modification date | 20141207 | |
| dbXrefs | MIM : 607762 | |
| HGNC : HGNC | ||
| Ensembl : ENSG00000126259 | ||
| HPRD : 08473 | ||
| Vega : OTTHUMG00000180691 | ||
| Protein | UniProt: go to UniProt's Cross Reference DB Table | |
| Expression | CleanEX: HS_KIRREL2 | |
| BioGPS: 84063 | ||
| Pathway | NCI Pathway Interaction Database: KIRREL2 | |
| KEGG: KIRREL2 | ||
| REACTOME: KIRREL2 | ||
| Pathway Commons: KIRREL2 | ||
| Context | iHOP: KIRREL2 | |
| ligand binding site mutation search in PubMed: KIRREL2 | ||
| UCL Cancer Institute: KIRREL2 | ||
| Assigned class in TissGDB* | B | |
| Included tissue-specific gene expression resources | HPA,TiGER,GTEx | |
| Specific-tissues in normal samples (assigned by TissGDB using HPA, TiGER, and GTEx) | LungPancreas | |
| Cancer types related to the specific-tissues in cancer samples (assigned by TissGDB using TCGA) | LUAD,LUSCPAAD | |
| Reference showing the relevant tissue of KIRREL2 | ||
| Description by TissGene annotations | ||
| * Class A consists of genes with literature evidence and is part of the cTissGenes. Class B consists of only cTissGenes without additional evidence. The remaining genes belong to Class C. |
| Gene ontology having evidence of Inferred from Direct Assay (IDA) from Entrez |
| GO ID | GO term | PubMed ID |
| Top |
| TissGeneExp for KIRREL2 |
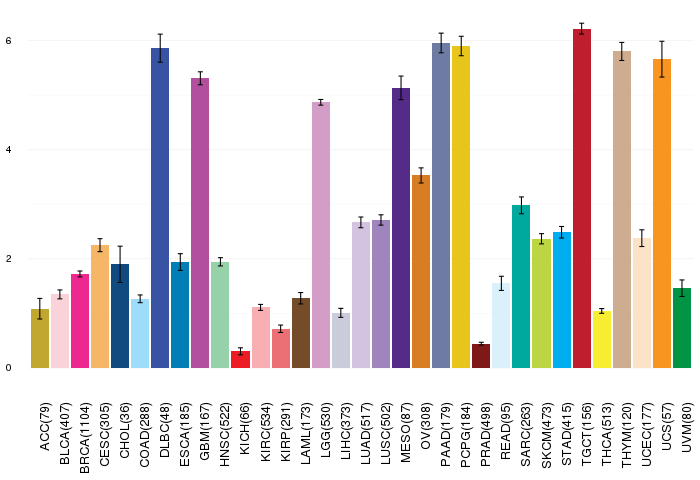
| Gene expressions across 28 cancer types (X-axis: cancer type and Y-axis: log2(norm_counts+1)) (TCGA IlluminaHiSeq_RNASeqV2, pan-cancer normalized log2(norm_counts+1) data, version 2016-08-16) |
 |
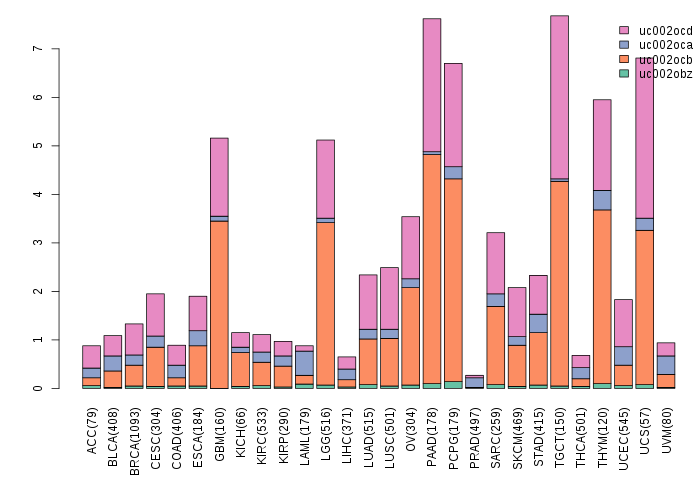
| Gene isoform expressions across 28 cancer types (X-axis: cancer type and Y-axis: log2(norm_counts+1)) (TCGA pan-cancer tcga_rsem_isoform_tpm, version 2016-09-01) |
 |
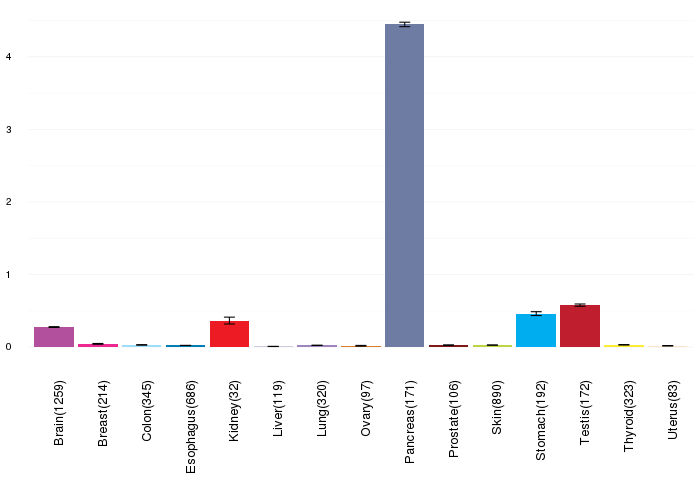
| Gene expressions across normal tissues of GTEx data (GTEx GTEx_Analysis_v6_RNA-seq_RNA-SeQCv1.1.8_gene_rpkm.gct) - Here, we shows the matched tissue types only among our 28 cancer types. |
 |
| Different expressions across 14 cancer types with more than 10 samples between matched tumors and normals (X-axis: cancer type and Y-axis: log2(norm_counts+1)) (TCGA IlluminaHiSeq_RNASeqV2, pan-cancer normalized log2(norm_counts+1) data, version 2016-08-16) |
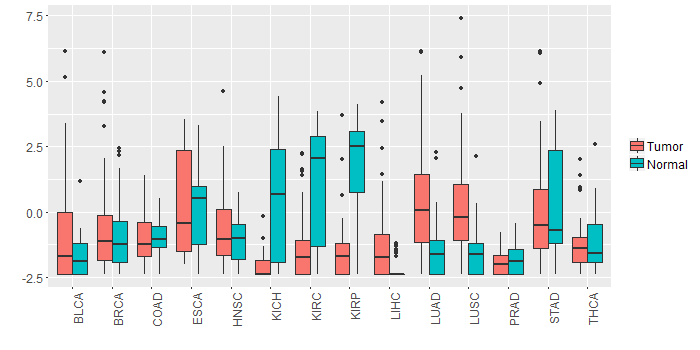 |
| - Significantly differentially expressed cancer types and information. (|Fold change|>1 and FDR<0.05) |
| Cancer type | Mean(exp) in tumor | Mean(exp) in matched normal | Log2FC | P-val. | FDR |
| KIRP | -1.34634866 | 1.66481384 | -3.0111625 | 1.10E-08 | 8.36E-08 |
| KICH | -1.99860766 | 0.56222034 | -2.560828 | 1.27E-05 | 3.93E-05 |
| LUAD | 0.402312547 | -1.455218487 | 1.857531034 | 6.42E-08 | 2.59E-07 |
| KIRC | -1.41042366 | 1.13153884 | -2.5419625 | 3.61E-14 | 1.72E-13 |
| LUSC | 0.236974379 | -1.532866797 | 1.769841176 | 4.88E-07 | 1.27E-06 |
| Top |
| TissGene-miRNA for KIRREL2 |
| Significantly anti-correlated miRNAs of TissGene across 28 cancer types (Gene-miRNA relations from TargetScanHuman Relsease 7.1, Conserved_Site_Context_Scores.txt.zip, 06.01.2016) (TCGA IlluminaHiSeq_miRNASeq, log2(RPM+1) data, version 2016-11-21) (TCGA IlluminaHiSeq_RNASeqV2, log2(normalized_count+1) data, version 2016-08-16) (Spearman’s Rank Correlation (p-value<0.05 and coefficient<-0.25)) |
| Cancer type | miRNA id | miRNA accession | P-val. | Coeff. | # samples |
| Top |
| TissGeneMut for KIRREL2 |
| TissGeneSNV for KIRREL2 |
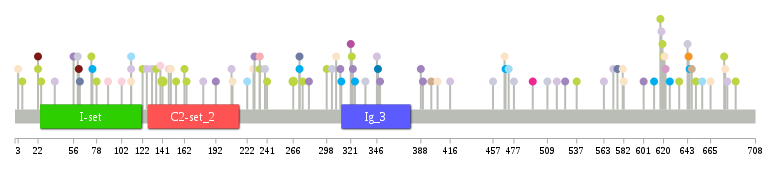
| nsSNV counts per each loci. Different colors of circles represent different cancer types. Circle size denotes number of samples. (TCGA somatic mutation (SNPs and small INDELs) data, version 2016-04-25) * Click on the image to enlarge it in a new window. |
 |
 |
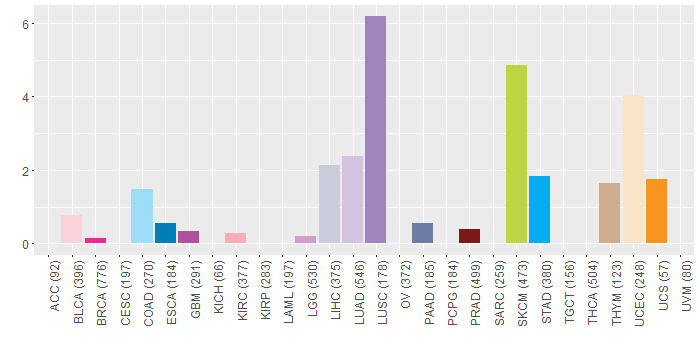
| Somatic nucleotide variants of TissGene across 28 cancer types (X-axis: cancer type and Y-axis: % of mutated samples) The numbers in parentheses are numbers of samples with mutation (nsSNVs). (TCGA somatic mutation (SNPs and small INDELs) data, version 2016-04-25) |
 |
| - nsSNVs sorted by frequency. |
| AAchange | Cancer type | # samples |
| p.P141S | SKCM | 3 |
| p.S266F | SKCM | 2 |
| p.P22L | PRAD | 1 |
| p.L166M | READ | 1 |
| p.S537N | SKCM | 1 |
| p.G131C | LUAD | 1 |
| p.P126T | LUAD | 1 |
| p.P667L | HNSC | 1 |
| p.A657T | COAD | 1 |
| p.R207L | LUAD | 1 |
| p.P619S | SKCM | 1 |
| p.A388D | LUSC | 1 |
| p.S556N | DLBC | 1 |
| p.A518S | LUAD | 1 |
| p.A618V | LUAD | 1 |
| p.A403T | READ | 1 |
| p.P626S | STAD | 1 |
| p.H89N | BLCA | 1 |
| p.S234L | SKCM | 1 |
| p.R74W | STAD | 1 |
| p.G241R | SKCM | 1 |
| p.Q239X | LIHC | 1 |
| p.S222T | COAD | 1 |
| p.R149H | UCEC | 1 |
| p.R111H | UCEC | 1 |
| p.R416H | LUAD | 1 |
| p.D582G | UCEC | 1 |
| p.P665H | UCEC | 1 |
| p.P267S | HNSC | 1 |
| p.L61Q | PRAD | 1 |
| p.S621Y | UCEC | 1 |
| p.T192N | LUSC | 1 |
| p.F679S | UCEC | 1 |
| p.R205Q | DLBC | 1 |
| p.G495C | BRCA | 1 |
| p.N643S | LIHC | 1 |
| p.W56* | LUSC | 1 |
| p.N601S | LUSC | 1 |
| p.V321M | GBM | 1 |
| p.G635E | SKCM | 1 |
| p.P7S | SKCM | 1 |
| p.R162* | SKCM | 1 |
| p.P312L | STAD | 1 |
| p.V509M | LIHC | 1 |
| p.L469P | STAD | 1 |
| p.S322F | HNSC | 1 |
| p.P644A | UCS | 1 |
| p.L404M | UCEC | 1 |
| p.S234L | KIRC | 1 |
| p.P398S | THYM | 1 |
| p.P681T | LUAD | 1 |
| p.S477Y | LIHC | 1 |
| p.I526F | LUSC | 1 |
| p.A563T | LUAD | 1 |
| p.R347C | ESCA | 1 |
| p.G592E | HNSC | 1 |
| p.S322F | SKCM | 1 |
| p.G442W | CHOL | 1 |
| p.S78L | SKCM | 1 |
| p.V323M | LUSC | 1 |
| p.E228K | UCEC | 1 |
| p.G620R | SKCM | 1 |
| p.H645R | STAD | 1 |
| p.G311W | LUSC | 1 |
| p.G311A | HNSC | 1 |
| p.V468A | UCEC | 1 |
| p.G298D | SKCM | 1 |
| p.S73F | SKCM | 1 |
| p.G139A | BLCA | 1 |
| p.P611S | STAD | 1 |
| p.R572L | LUAD | 1 |
| p.S457G | LIHC | 1 |
| p.T346A | LUAD | 1 |
| p.T581I | UCEC | 1 |
| p.D307N | UCEC | 1 |
| p.R302S | DLBC | 1 |
| p.P154S | SKCM | 1 |
| p.G38W | LUAD | 1 |
| p.P651L | SKCM | 1 |
| p.S424F | HNSC | 1 |
| p.S135F | SKCM | 1 |
| p.S208I | UCEC | 1 |
| p.G647D | THYM | 1 |
| p.P122S | SKCM | 1 |
| p.G576D | PAAD | 1 |
| p.S303R | LIHC | 1 |
| p.R147W | BLCA | 1 |
| p.G349R | LUSC | 1 |
| p.R275K | SKCM | 1 |
| p.G60R | LIHC | 1 |
| p.R3M | UCEC | 1 |
| p.R111H | LUAD | 1 |
| p.H25R | SKCM | 1 |
| p.E617K | SKCM | 1 |
| p.G622C | LGG | 1 |
| p.R272H | PAAD | 1 |
| p.R272H | STAD | 1 |
| p.S678F | SKCM | 1 |
| p.G180V | LUAD | 1 |
| p.R207Q | HNSC | 1 |
| p.P22S | SKCM | 1 |
| p.W335X | LIHC | 1 |
| p.A62T | PAAD | 1 |
| p.V325M | STAD | 1 |
| p.E102K | BLCA | 1 |
| p.P689S | SKCM | 1 |
| p.D281N | LUSC | 1 |
| p.V229L | LUSC | 1 |
| p.E390K | LUSC | 1 |
| p.S472L | COAD | 1 |
| p.R111H | COAD | 1 |
| p.G164R | SKCM | 1 |
| Top |
| TissGeneCNV for KIRREL2 |
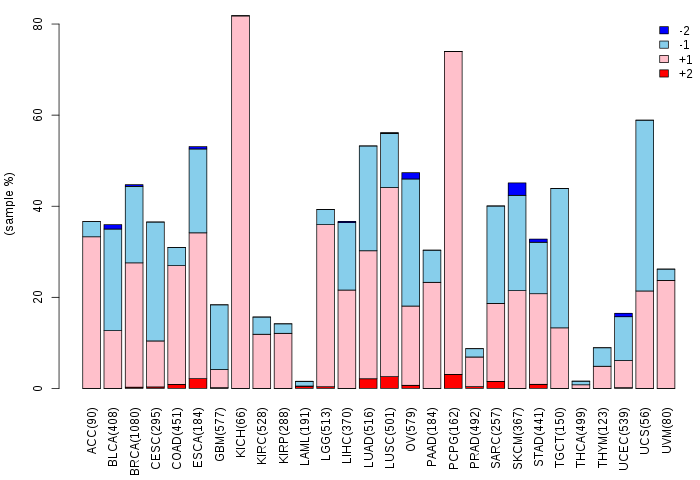
| Copy number variations of TissGene across 28 cancer types (X-axis: cancer type and Y-axis: % of CNV samples) (TCGA Gistic2_CopyNumber_Gistic2_all_data_by_genes, Gistic2 copy number data, version 2016-08-16) |
 |
| Top |
| TissGeneFusions for KIRREL2 |
| Fusion genes including TissGene (ChimerDB 3.0, 2016-12-01 and TCGA fusion Portal 2015-12-01) |
| Database | Src | Cancer type | Sample | Fusion gene | ORF | 5'-gene BP | 3'-gene BP |
| TCGAfusionPortal | PRADA | BRCA | TCGA-A2-A0EV-01A | MAPK8-KIRREL2 | NA | Chr10:49534008 | Chr19:36355550 |
| Top |
| TissGeneNet for KIRREL2 |
| Co-expressed gene networks based on protein-protein interaction data (CePIN) (TCGA IlluminaHiSeq_RNASeqV2, pan-cancer normalized log2(norm_counts+1) data, version 2016-08-16) (PINA2 ppi data) |
| Top |
| TissGeneProg for KIRREL2 |
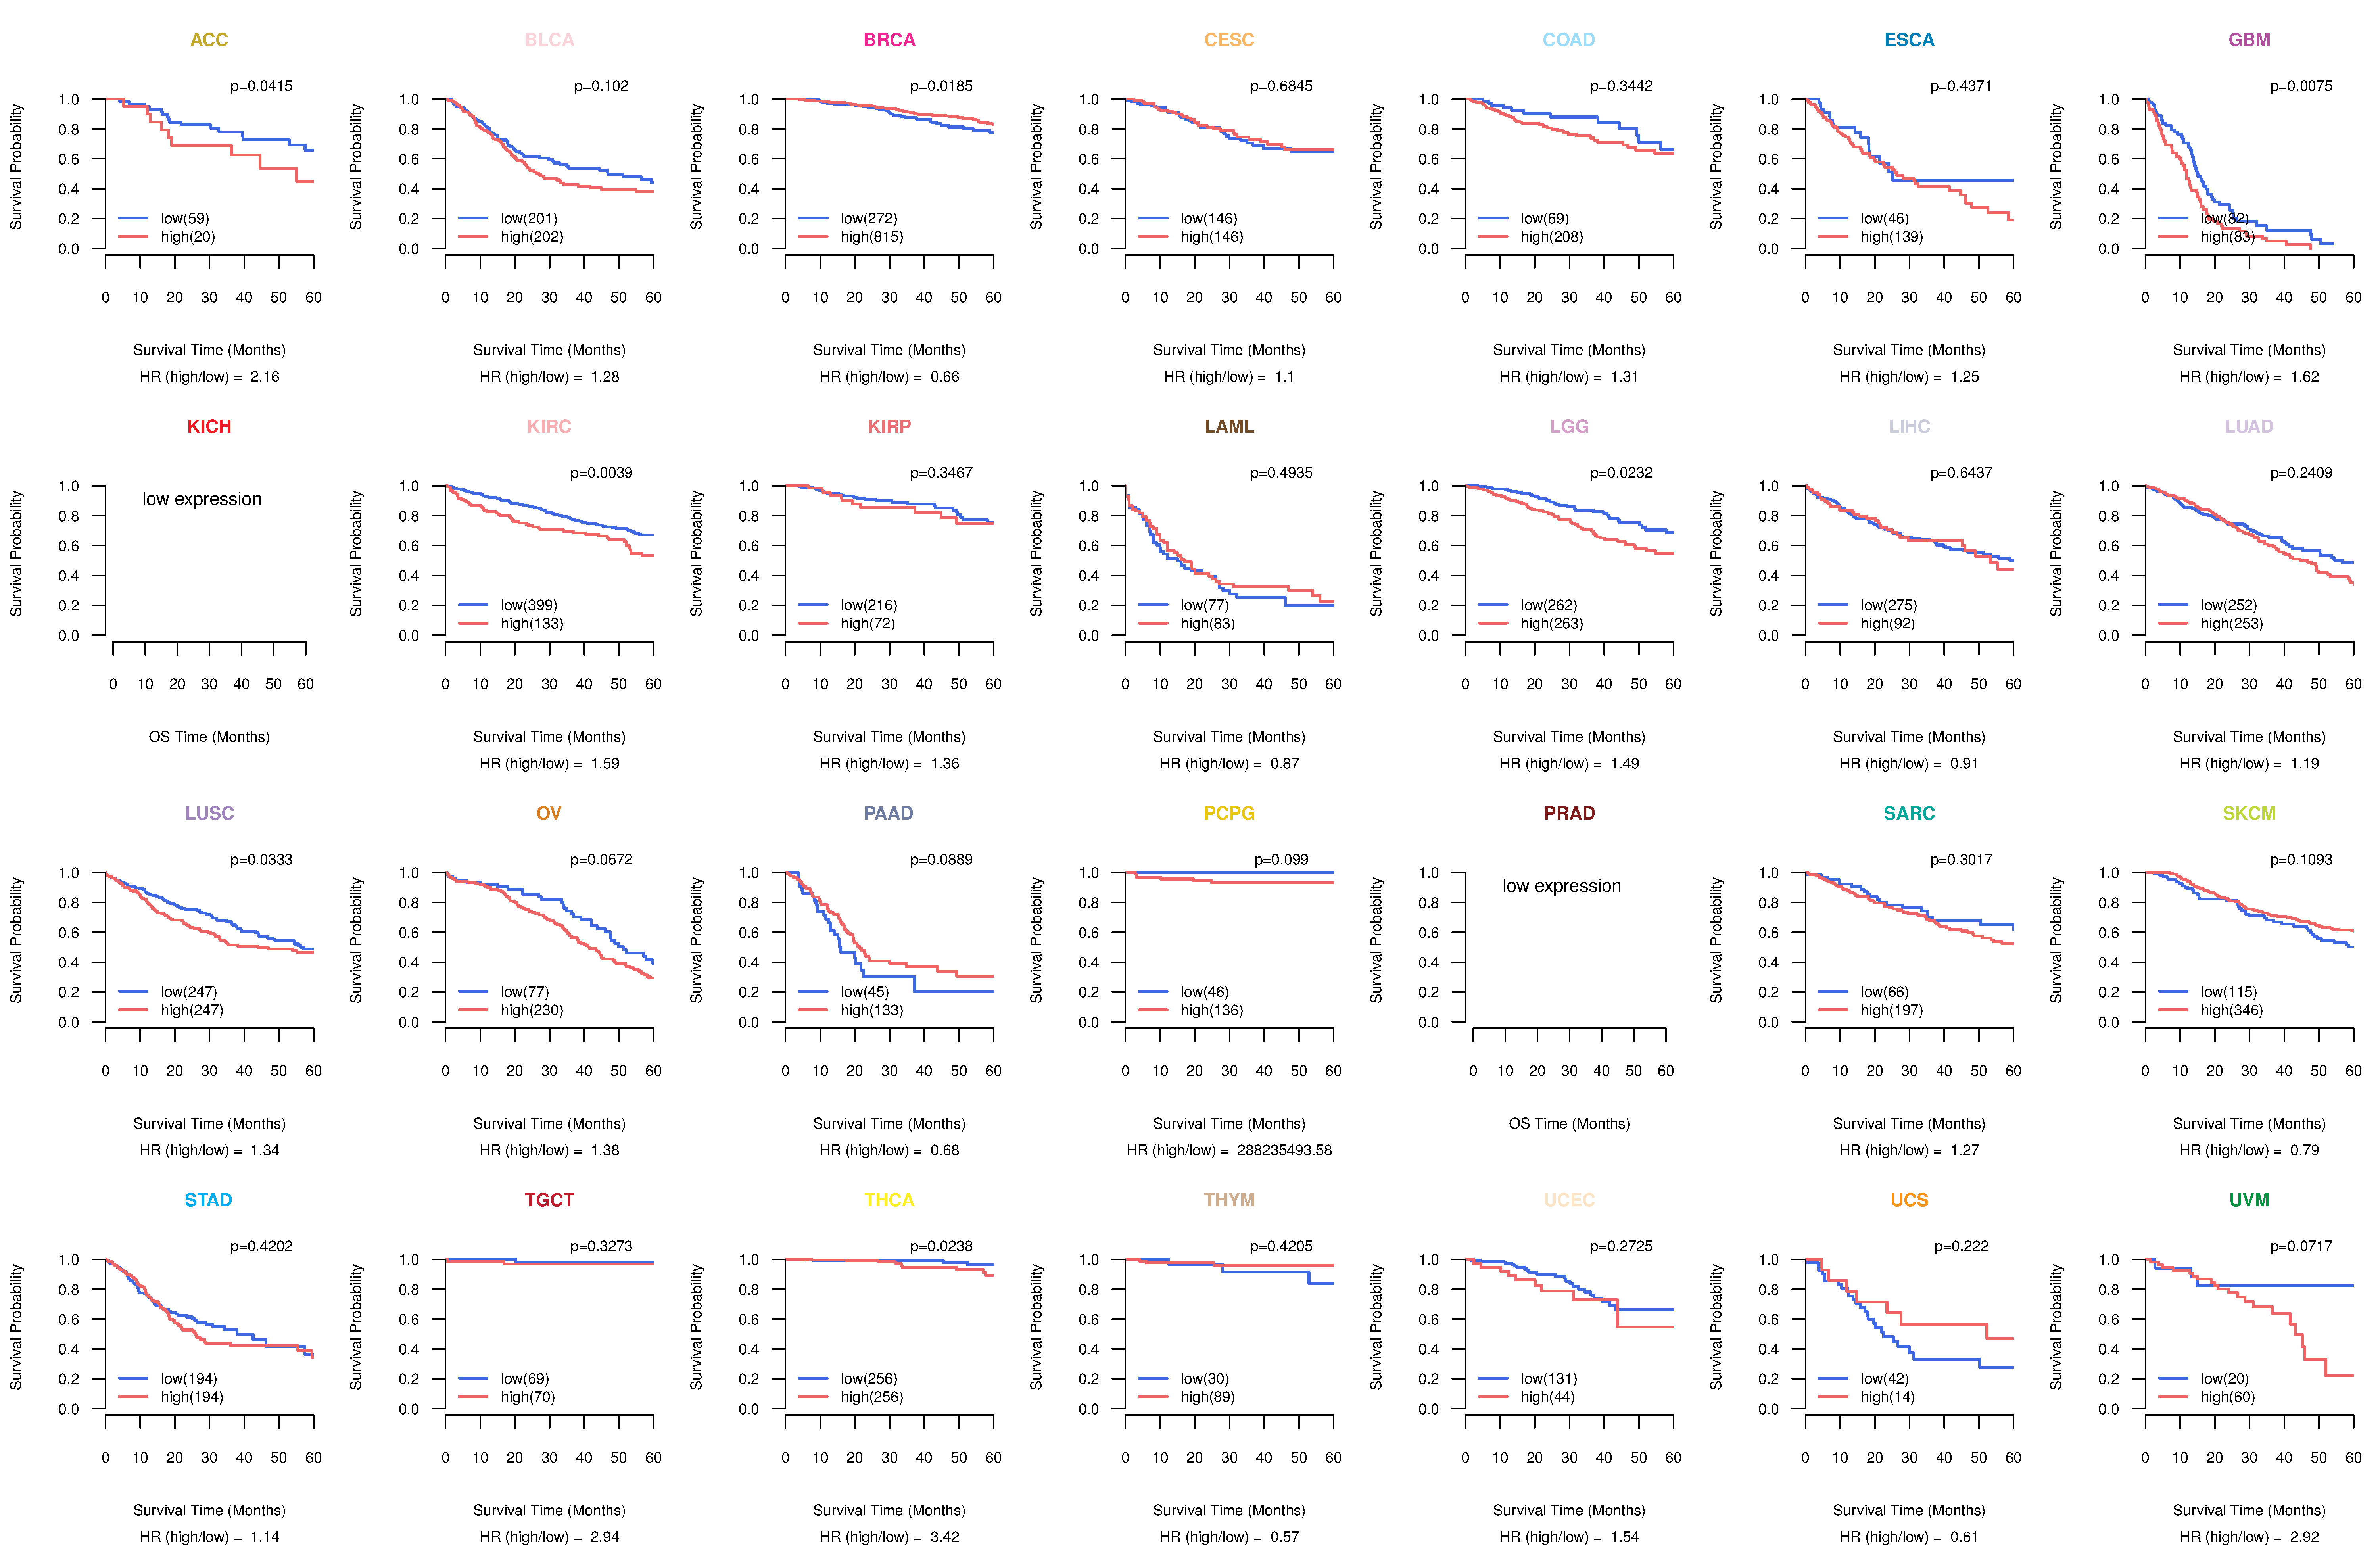
| Kaplan-Meier plots with logrank tests of overall survival (OS) using 28 cancer types (TCGA IlluminaHiSeq_RNASeqV2, pan-cancer normalized log2(norm_counts+1) data, version 2016-08-16) (TCGA clinicalMatrix, phenotype data, version 2016-04-27) * Click on the image to enlarge it in a new window. |
 |
| Kaplan-Meier plots with logrank test of relapse free survival (RFS) using 28 cancer types (TCGA IlluminaHiSeq_RNASeqV2, pan-cancer normalized log2(norm_counts+1) data, version 2016-08-16) (TCGA clinicalMatrix, phenotype data, version 2016-04-27) * Click on the image enlarge it in a new window. |
 |
| Forest plot of Cox proportional hazard ratio (HR) and 95% CI of overall survival (OS) using 28 cancer types (TCGA IlluminaHiSeq_RNASeqV2, pan-cancer normalized log2(norm_counts+1) data, version 2016-08-16) (TCGA clinicalMatrix, phenotype data, version 2016-04-27) * Click on the image enlarge it in a new window. |
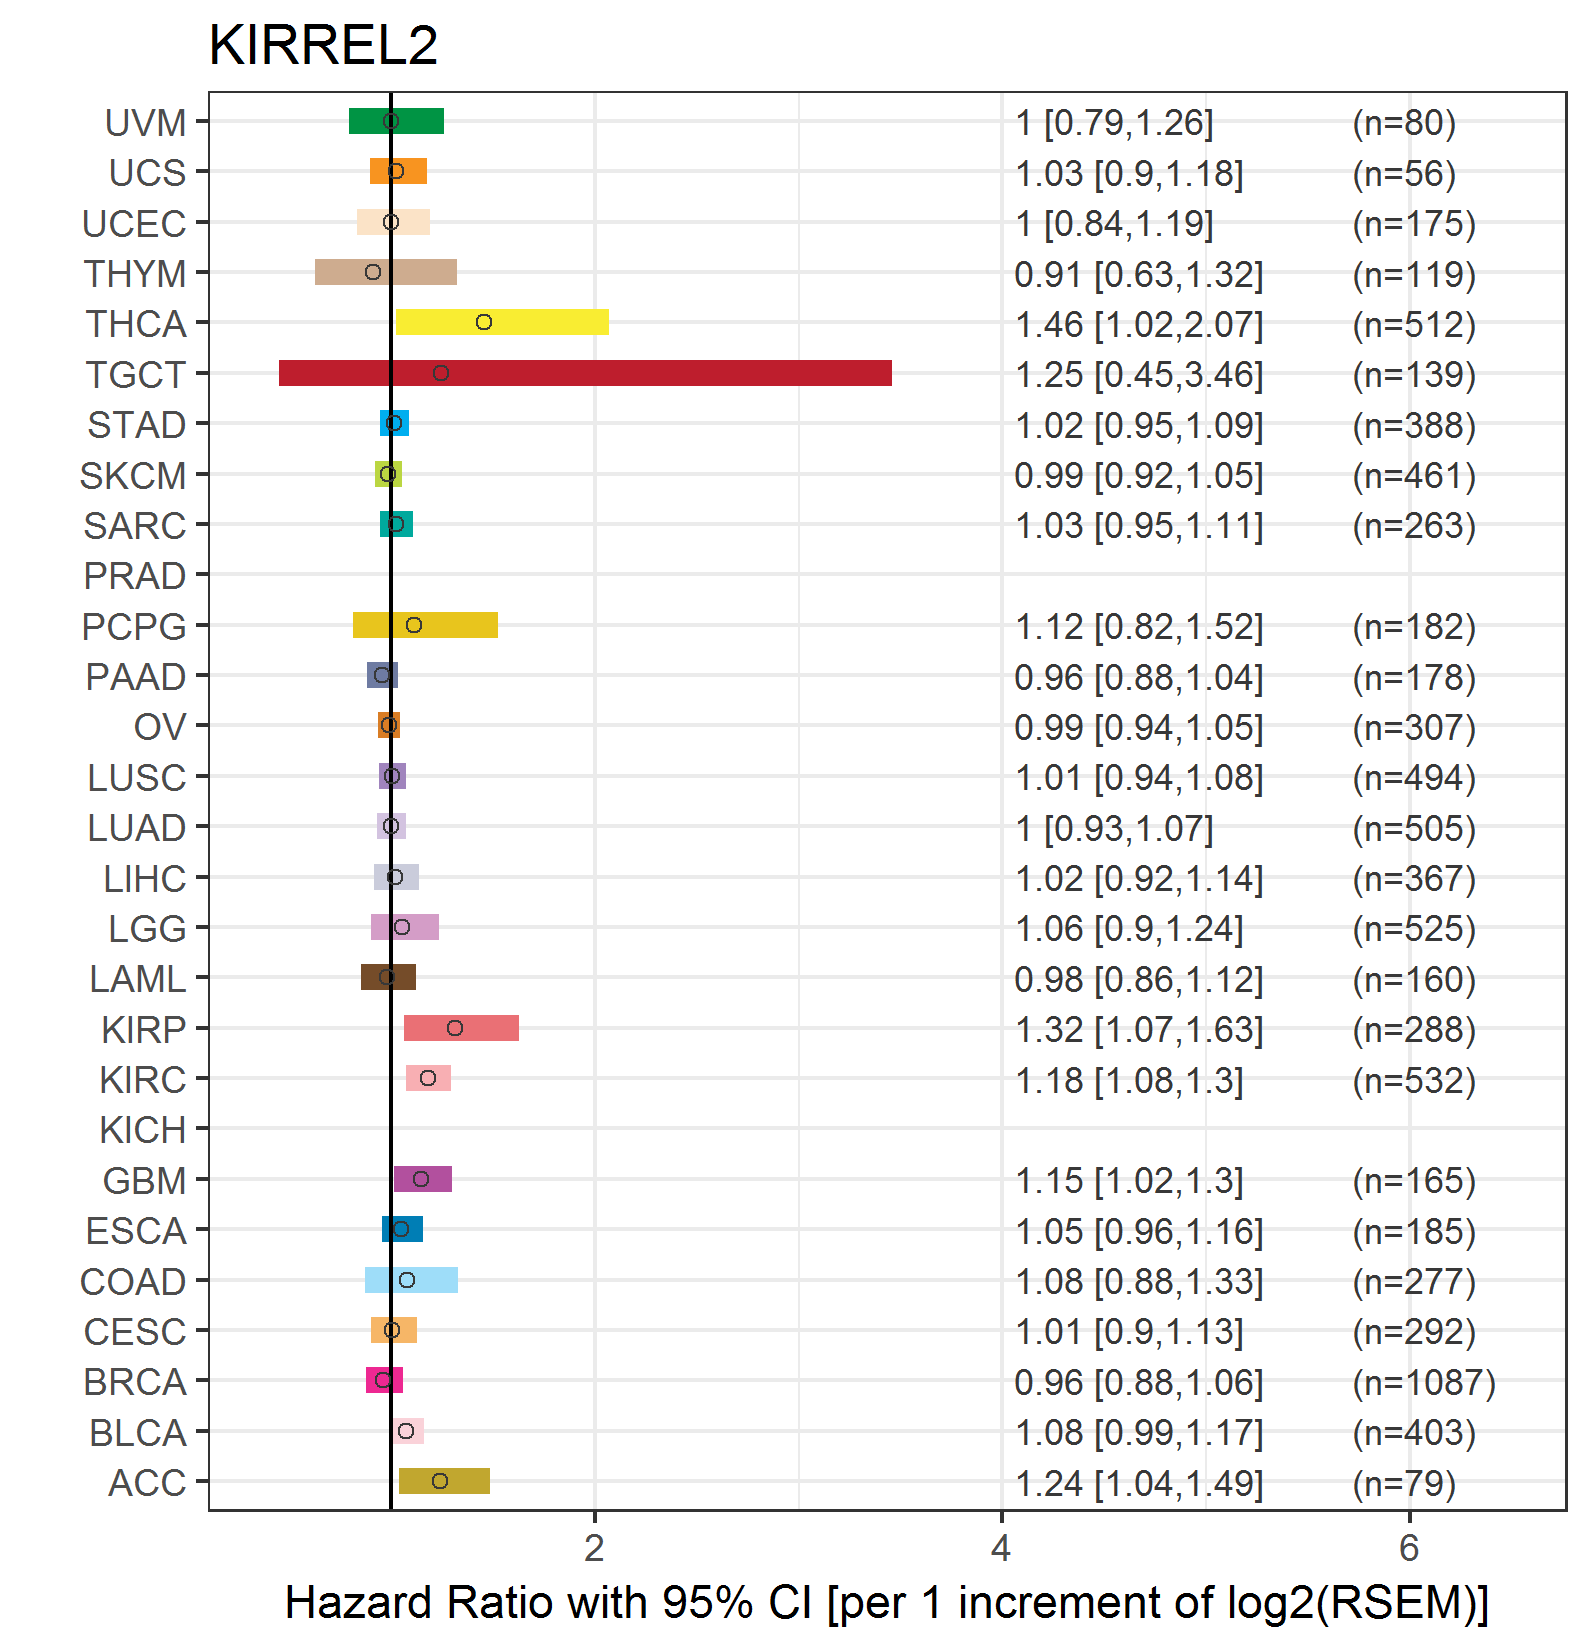 |
| Forest plot of Cox proportional hazard ratio (HR) and 95% CI of relapse free survival (RFS) using 28 cancer types (TCGA IlluminaHiSeq_RNASeqV2, pan-cancer normalized log2(norm_counts+1) data, version 2016-08-16) (TCGA clinicalMatrix, phenotype data, version 2016-04-27) * Click on the image enlarge it in a new window. |
 |
| Top |
| TissGeneClin for KIRREL2 |
| TissGeneDrug for KIRREL2 |
| Drug information targeting TissGene (DrugBank Version 5.0.6, 2017-04-01) |
| DrugBank ID | Drug name | Drug activity | Drug type | Drug status |
| Top |
| TissGeneDisease for KIRREL2 |
| Disease information associated with TissGene (DisGeNet, 2016-06-01) |
| Disease ID | Disease name | # pubmeds | Source |
| umls:C0018889 | Helminthiasis | 1 | BeFree |
|
Copyright 2016-Present - The University of Texas Health Science Center at Houston (UTHealth) Web File Viewing | How to Report, Fraud, Waste and Abuse | State of Texas | Statewide Search | Texas Homeland Security | Site Policies |