 |
| |
| |
| |
| |
| |
| |
|

| TissGeneSummary for CCDC65 |
 Gene summary Gene summary |
| Basic gene information | Gene symbol | CCDC65 |
| Gene name | coiled-coil domain containing 65 | |
| Synonyms | CILD27|FAP250|NYD-SP28 | |
| Cytomap | UCSC genome browser: 12q13.12 | |
| Type of gene | protein-coding | |
| RefGenes | NM_001286957.1, NM_033124.4, | |
| Description | coiled-coil domain-containing protein 65testis development protein NYD-SP28 | |
| Modification date | 20141207 | |
| dbXrefs | MIM : 611088 | |
| HGNC : HGNC | ||
| Ensembl : ENSG00000139537 | ||
| HPRD : 14867 | ||
| Vega : OTTHUMG00000170401 | ||
| Protein | UniProt: go to UniProt's Cross Reference DB Table | |
| Expression | CleanEX: HS_CCDC65 | |
| BioGPS: 85478 | ||
| Pathway | NCI Pathway Interaction Database: CCDC65 | |
| KEGG: CCDC65 | ||
| REACTOME: CCDC65 | ||
| Pathway Commons: CCDC65 | ||
| Context | iHOP: CCDC65 | |
| ligand binding site mutation search in PubMed: CCDC65 | ||
| UCL Cancer Institute: CCDC65 | ||
| Assigned class in TissGDB* | C | |
| Included tissue-specific gene expression resources | TiGER,GTEx | |
| Specific-tissues in normal samples (assigned by TissGDB using HPA, TiGER, and GTEx) | Testis | |
| Cancer types related to the specific-tissues in cancer samples (assigned by TissGDB using TCGA) | TGCT | |
| Reference showing the relevant tissue of CCDC65 | ||
| Description by TissGene annotations | ||
| * Class A consists of genes with literature evidence and is part of the cTissGenes. Class B consists of only cTissGenes without additional evidence. The remaining genes belong to Class C. |
| Gene ontology having evidence of Inferred from Direct Assay (IDA) from Entrez |
| GO ID | GO term | PubMed ID |
| Top |
| TissGeneExp for CCDC65 |
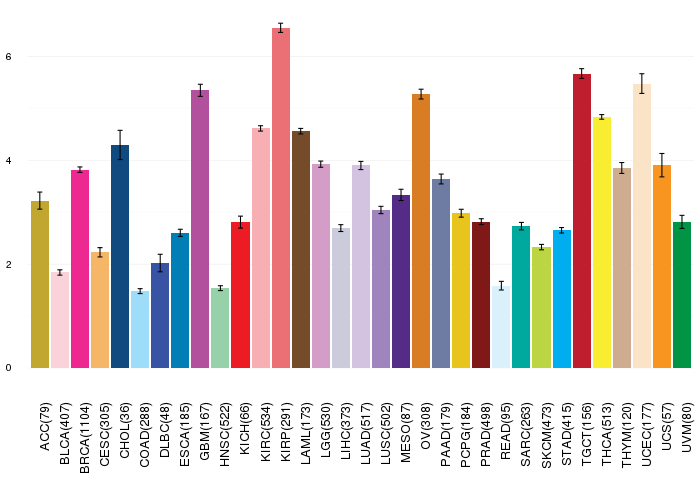
| Gene expressions across 28 cancer types (X-axis: cancer type and Y-axis: log2(norm_counts+1)) (TCGA IlluminaHiSeq_RNASeqV2, pan-cancer normalized log2(norm_counts+1) data, version 2016-08-16) |
 |
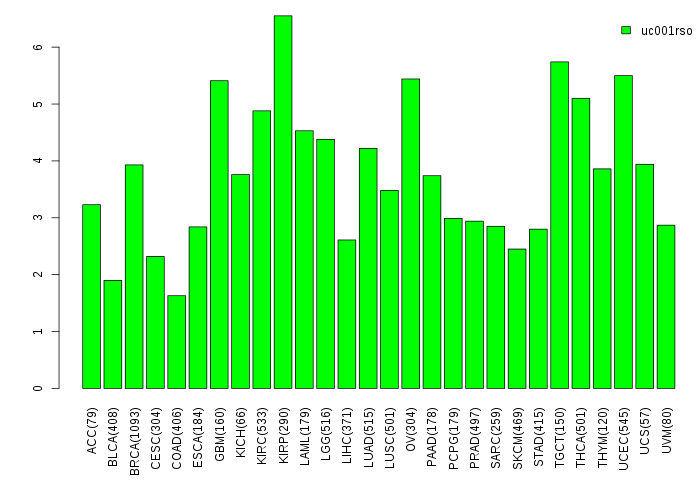
| Gene isoform expressions across 28 cancer types (X-axis: cancer type and Y-axis: log2(norm_counts+1)) (TCGA pan-cancer tcga_rsem_isoform_tpm, version 2016-09-01) |
 |
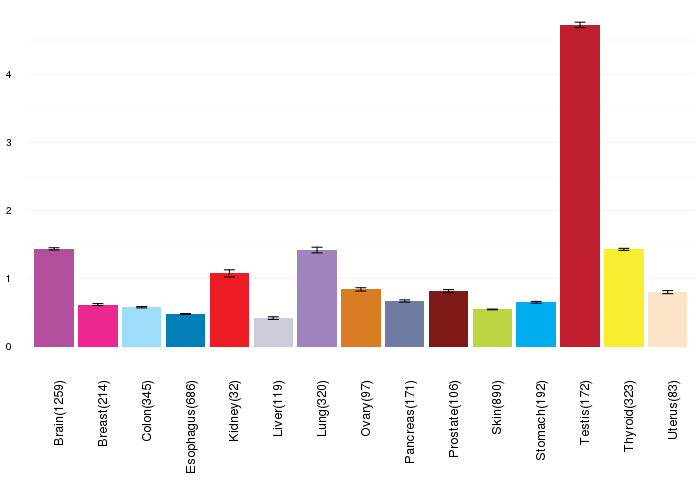
| Gene expressions across normal tissues of GTEx data (GTEx GTEx_Analysis_v6_RNA-seq_RNA-SeQCv1.1.8_gene_rpkm.gct) - Here, we shows the matched tissue types only among our 28 cancer types. |
 |
| Different expressions across 14 cancer types with more than 10 samples between matched tumors and normals (X-axis: cancer type and Y-axis: log2(norm_counts+1)) (TCGA IlluminaHiSeq_RNASeqV2, pan-cancer normalized log2(norm_counts+1) data, version 2016-08-16) |
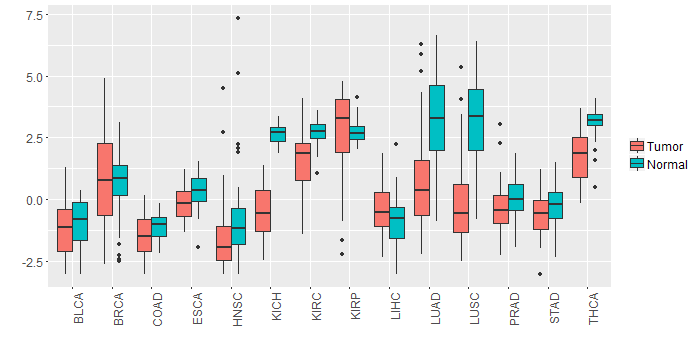 |
| - Significantly differentially expressed cancer types and information. (|Fold change|>1 and FDR<0.05) |
| Cancer type | Mean(exp) in tumor | Mean(exp) in matched normal | Log2FC | P-val. | FDR |
| LUSC | -0.182670756 | 3.082560616 | -3.265231373 | 1.41E-15 | 9.48E-15 |
| KIRC | 1.669689129 | 2.709291907 | -1.039602778 | 1.60E-10 | 5.51E-10 |
| LUAD | 0.765149426 | 3.15149253 | -2.386343103 | 5.62E-10 | 3.07E-09 |
| KICH | -0.411277815 | 2.636378185 | -3.047656 | 1.13E-14 | 2.09E-13 |
| THCA | 1.765502524 | 3.165221168 | -1.399718644 | 1.14E-14 | 1.36E-13 |
| Top |
| TissGene-miRNA for CCDC65 |
| Significantly anti-correlated miRNAs of TissGene across 28 cancer types (Gene-miRNA relations from TargetScanHuman Relsease 7.1, Conserved_Site_Context_Scores.txt.zip, 06.01.2016) (TCGA IlluminaHiSeq_miRNASeq, log2(RPM+1) data, version 2016-11-21) (TCGA IlluminaHiSeq_RNASeqV2, log2(normalized_count+1) data, version 2016-08-16) (Spearman’s Rank Correlation (p-value<0.05 and coefficient<-0.25)) |
| Cancer type | miRNA id | miRNA accession | P-val. | Coeff. | # samples |
| Top |
| TissGeneMut for CCDC65 |
| TissGeneSNV for CCDC65 |
| nsSNV counts per each loci. Different colors of circles represent different cancer types. Circle size denotes number of samples. (TCGA somatic mutation (SNPs and small INDELs) data, version 2016-04-25) * Click on the image to enlarge it in a new window. |
 |
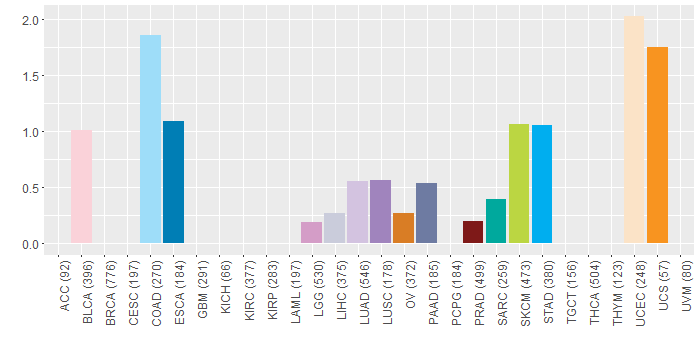
| Somatic nucleotide variants of TissGene across 28 cancer types (X-axis: cancer type and Y-axis: % of mutated samples) The numbers in parentheses are numbers of samples with mutation (nsSNVs). (TCGA somatic mutation (SNPs and small INDELs) data, version 2016-04-25) |
 |
| - nsSNVs sorted by frequency. |
| AAchange | Cancer type | # samples |
| p.R90* | STAD | 1 |
| p.I443M | BLCA | 1 |
| p.S185Y | READ | 1 |
| p.S283R | LIHC | 1 |
| p.K297N | LGG | 1 |
| p.R311K | SKCM | 1 |
| p.Q462E | LUAD | 1 |
| p.N409S | PRAD | 1 |
| p.M1V | STAD | 1 |
| p.E257D | BLCA | 1 |
| p.K278N | HNSC | 1 |
| p.R305X | COAD | 1 |
| p.K6N | PAAD | 1 |
| p.R315G | LUAD | 1 |
| p.K320N | COAD | 1 |
| p.H475L | LUAD | 1 |
| p.E154K | BLCA | 1 |
| p.H475N | LUAD | 1 |
| p.E108K | SKCM | 1 |
| p.R70W | LGG | 1 |
| p.Y292C | UCEC | 1 |
| p.E82D | ESCA | 1 |
| p.F42L | READ | 1 |
| p.E71K | SKCM | 1 |
| p.H475I | LUAD | 1 |
| p.H133R | COAD | 1 |
| p.E152K | LUSC | 1 |
| p.D478N | UCS | 1 |
| p.I183M | DLBC | 1 |
| p.R472H | COAD | 1 |
| p.H169N | COAD | 1 |
| p.P482A | OV | 1 |
| p.Y408C | COAD | 1 |
| p.E359X | ESCA | 1 |
| p.E359K | SKCM | 1 |
| p.N143K | SARC | 1 |
| p.E5* | UCEC | 1 |
| p.E76* | STAD | 1 |
| p.S101Y | UCEC | 1 |
| p.R294H | STAD | 1 |
| p.R90X | STAD | 1 |
| p.N217D | READ | 1 |
| p.F42L | UCEC | 1 |
| p.E448K | SKCM | 1 |
| p.E257Q | BLCA | 1 |
| p.E76X | STAD | 1 |
| p.R294C | COAD | 1 |
| p.E448K | UCEC | 1 |
| Top |
| TissGeneCNV for CCDC65 |
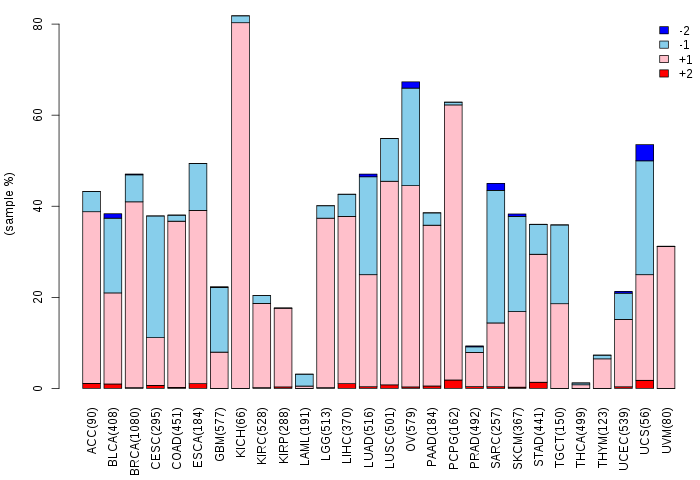
| Copy number variations of TissGene across 28 cancer types (X-axis: cancer type and Y-axis: % of CNV samples) (TCGA Gistic2_CopyNumber_Gistic2_all_data_by_genes, Gistic2 copy number data, version 2016-08-16) |
 |
| Top |
| TissGeneFusions for CCDC65 |
| Fusion genes including TissGene (ChimerDB 3.0, 2016-12-01 and TCGA fusion Portal 2015-12-01) |
| Database | Src | Cancer type | Sample | Fusion gene | ORF | 5'-gene BP | 3'-gene BP |
| Top |
| TissGeneNet for CCDC65 |
| Co-expressed gene networks based on protein-protein interaction data (CePIN) (TCGA IlluminaHiSeq_RNASeqV2, pan-cancer normalized log2(norm_counts+1) data, version 2016-08-16) (PINA2 ppi data) |
| Top |
| TissGeneProg for CCDC65 |
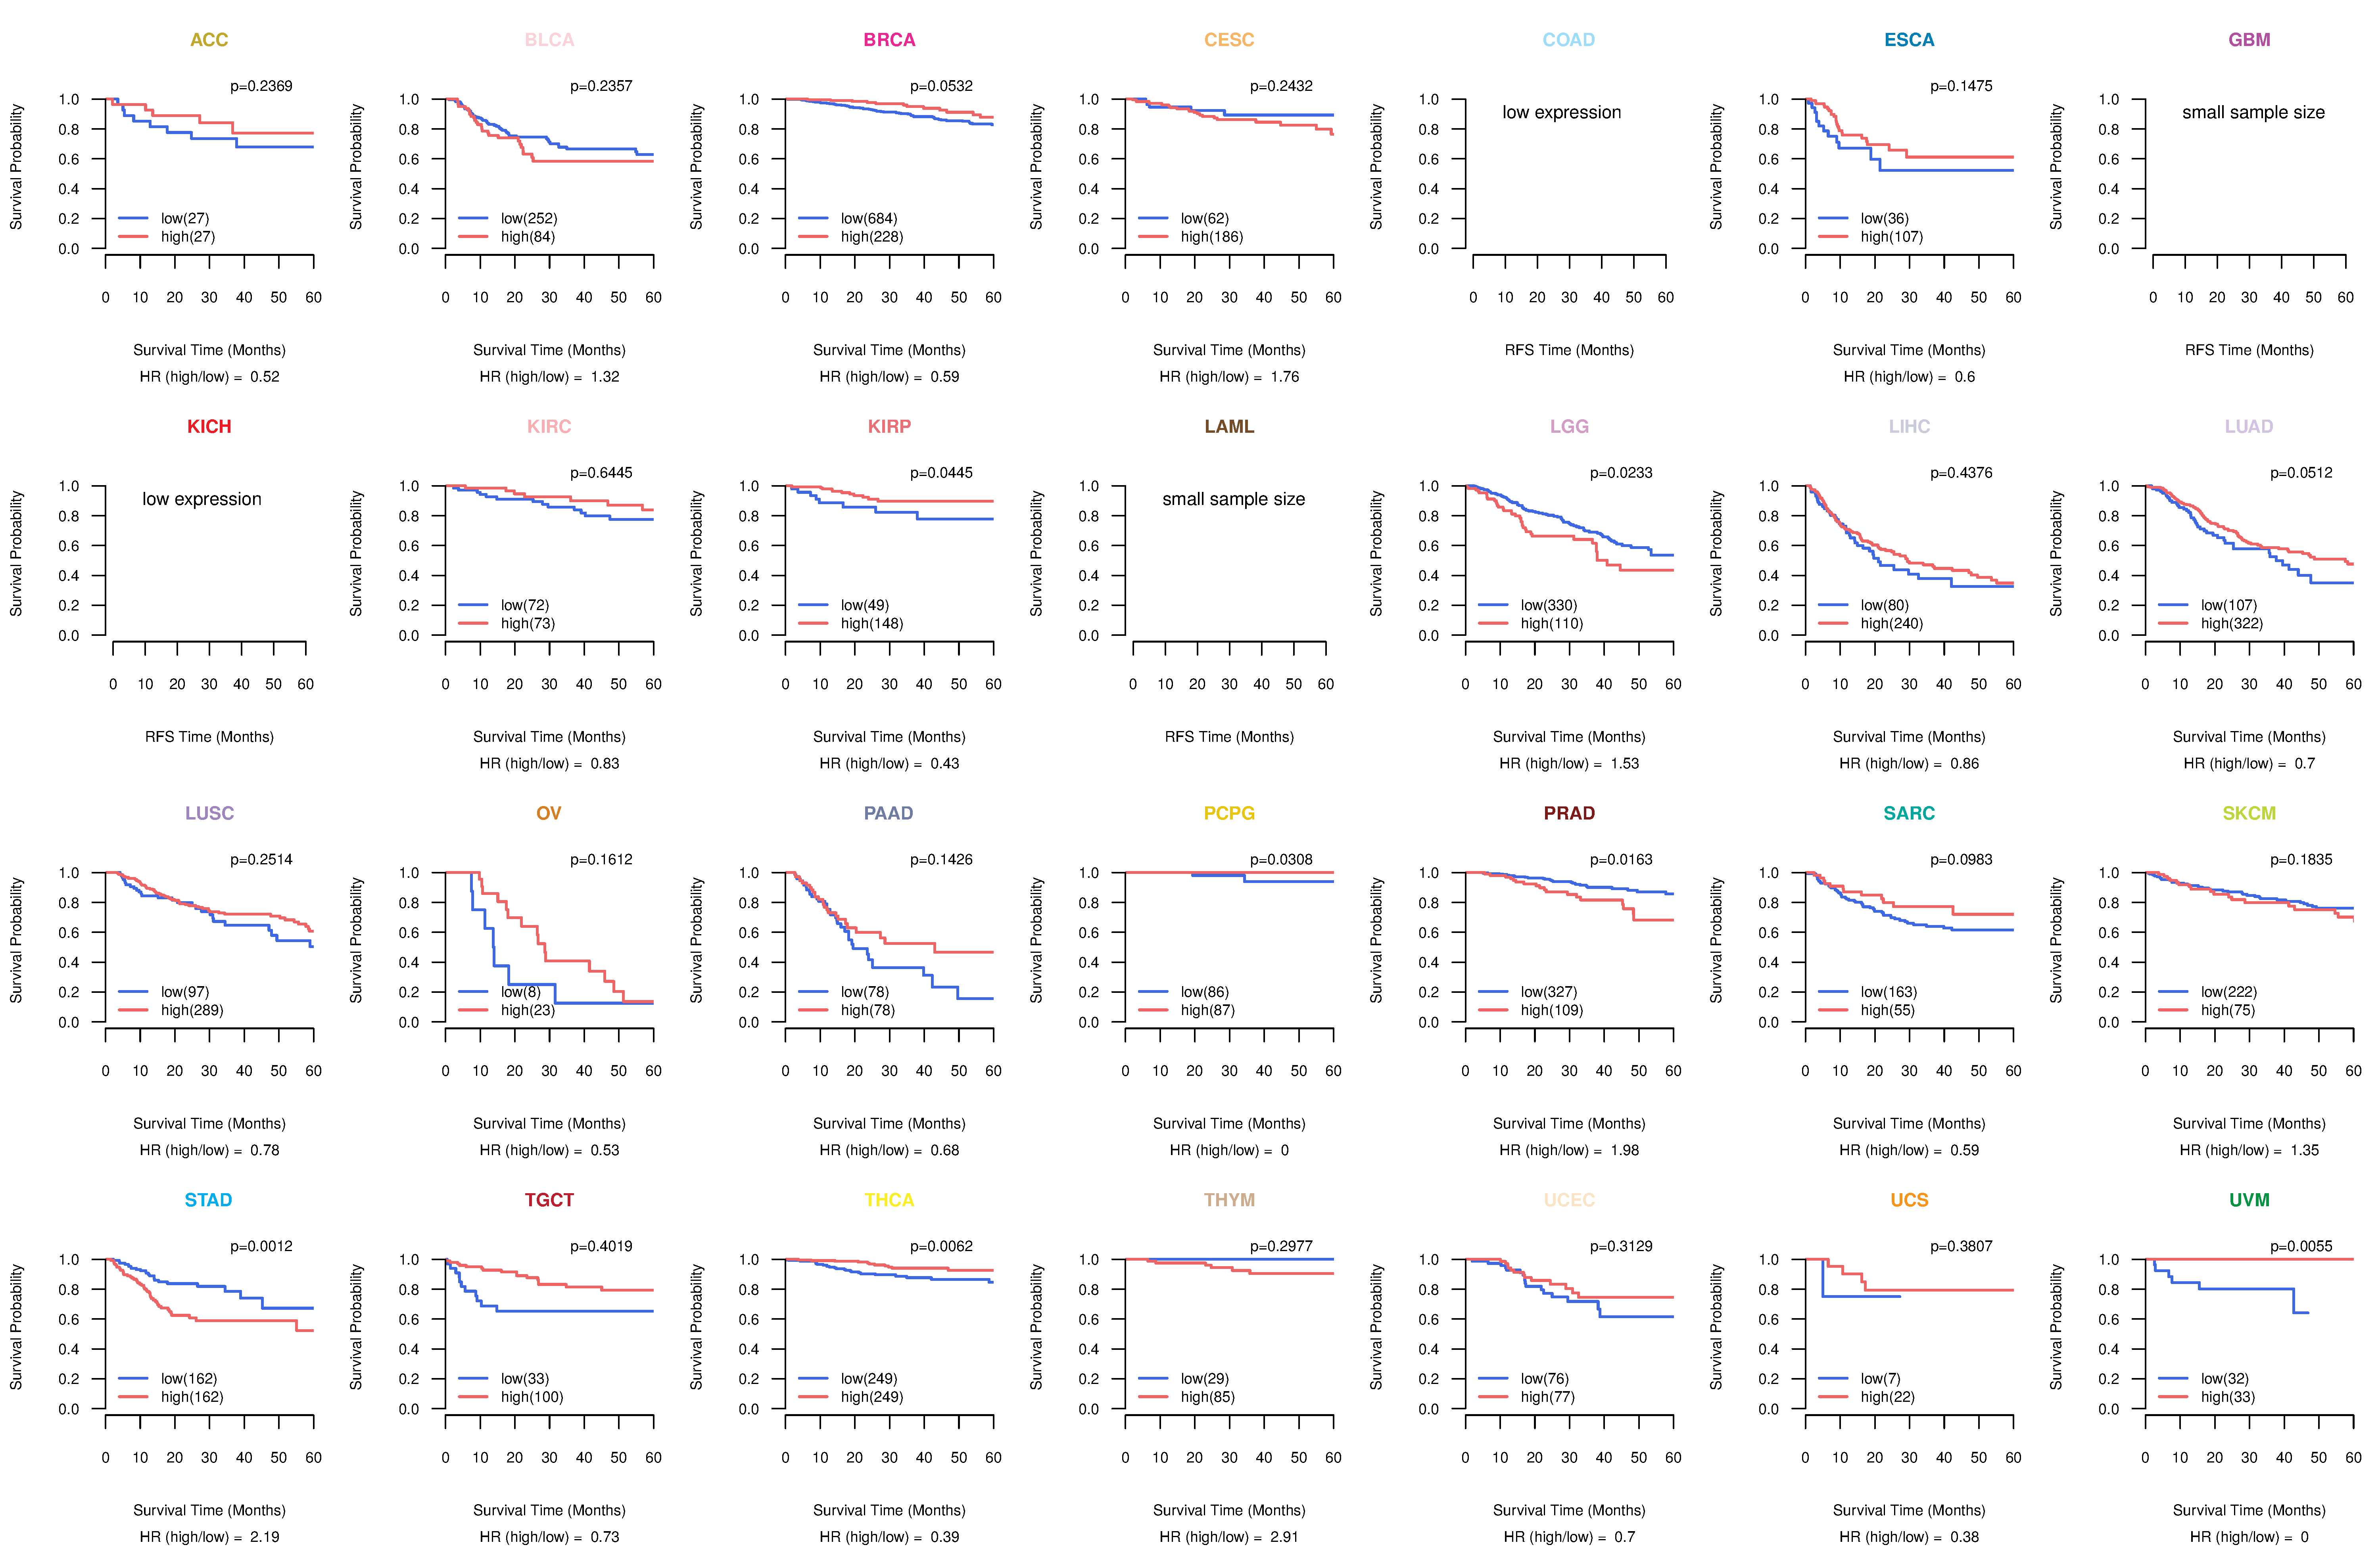
| Kaplan-Meier plots with logrank tests of overall survival (OS) using 28 cancer types (TCGA IlluminaHiSeq_RNASeqV2, pan-cancer normalized log2(norm_counts+1) data, version 2016-08-16) (TCGA clinicalMatrix, phenotype data, version 2016-04-27) * Click on the image to enlarge it in a new window. |
 |
| Kaplan-Meier plots with logrank test of relapse free survival (RFS) using 28 cancer types (TCGA IlluminaHiSeq_RNASeqV2, pan-cancer normalized log2(norm_counts+1) data, version 2016-08-16) (TCGA clinicalMatrix, phenotype data, version 2016-04-27) * Click on the image enlarge it in a new window. |
 |
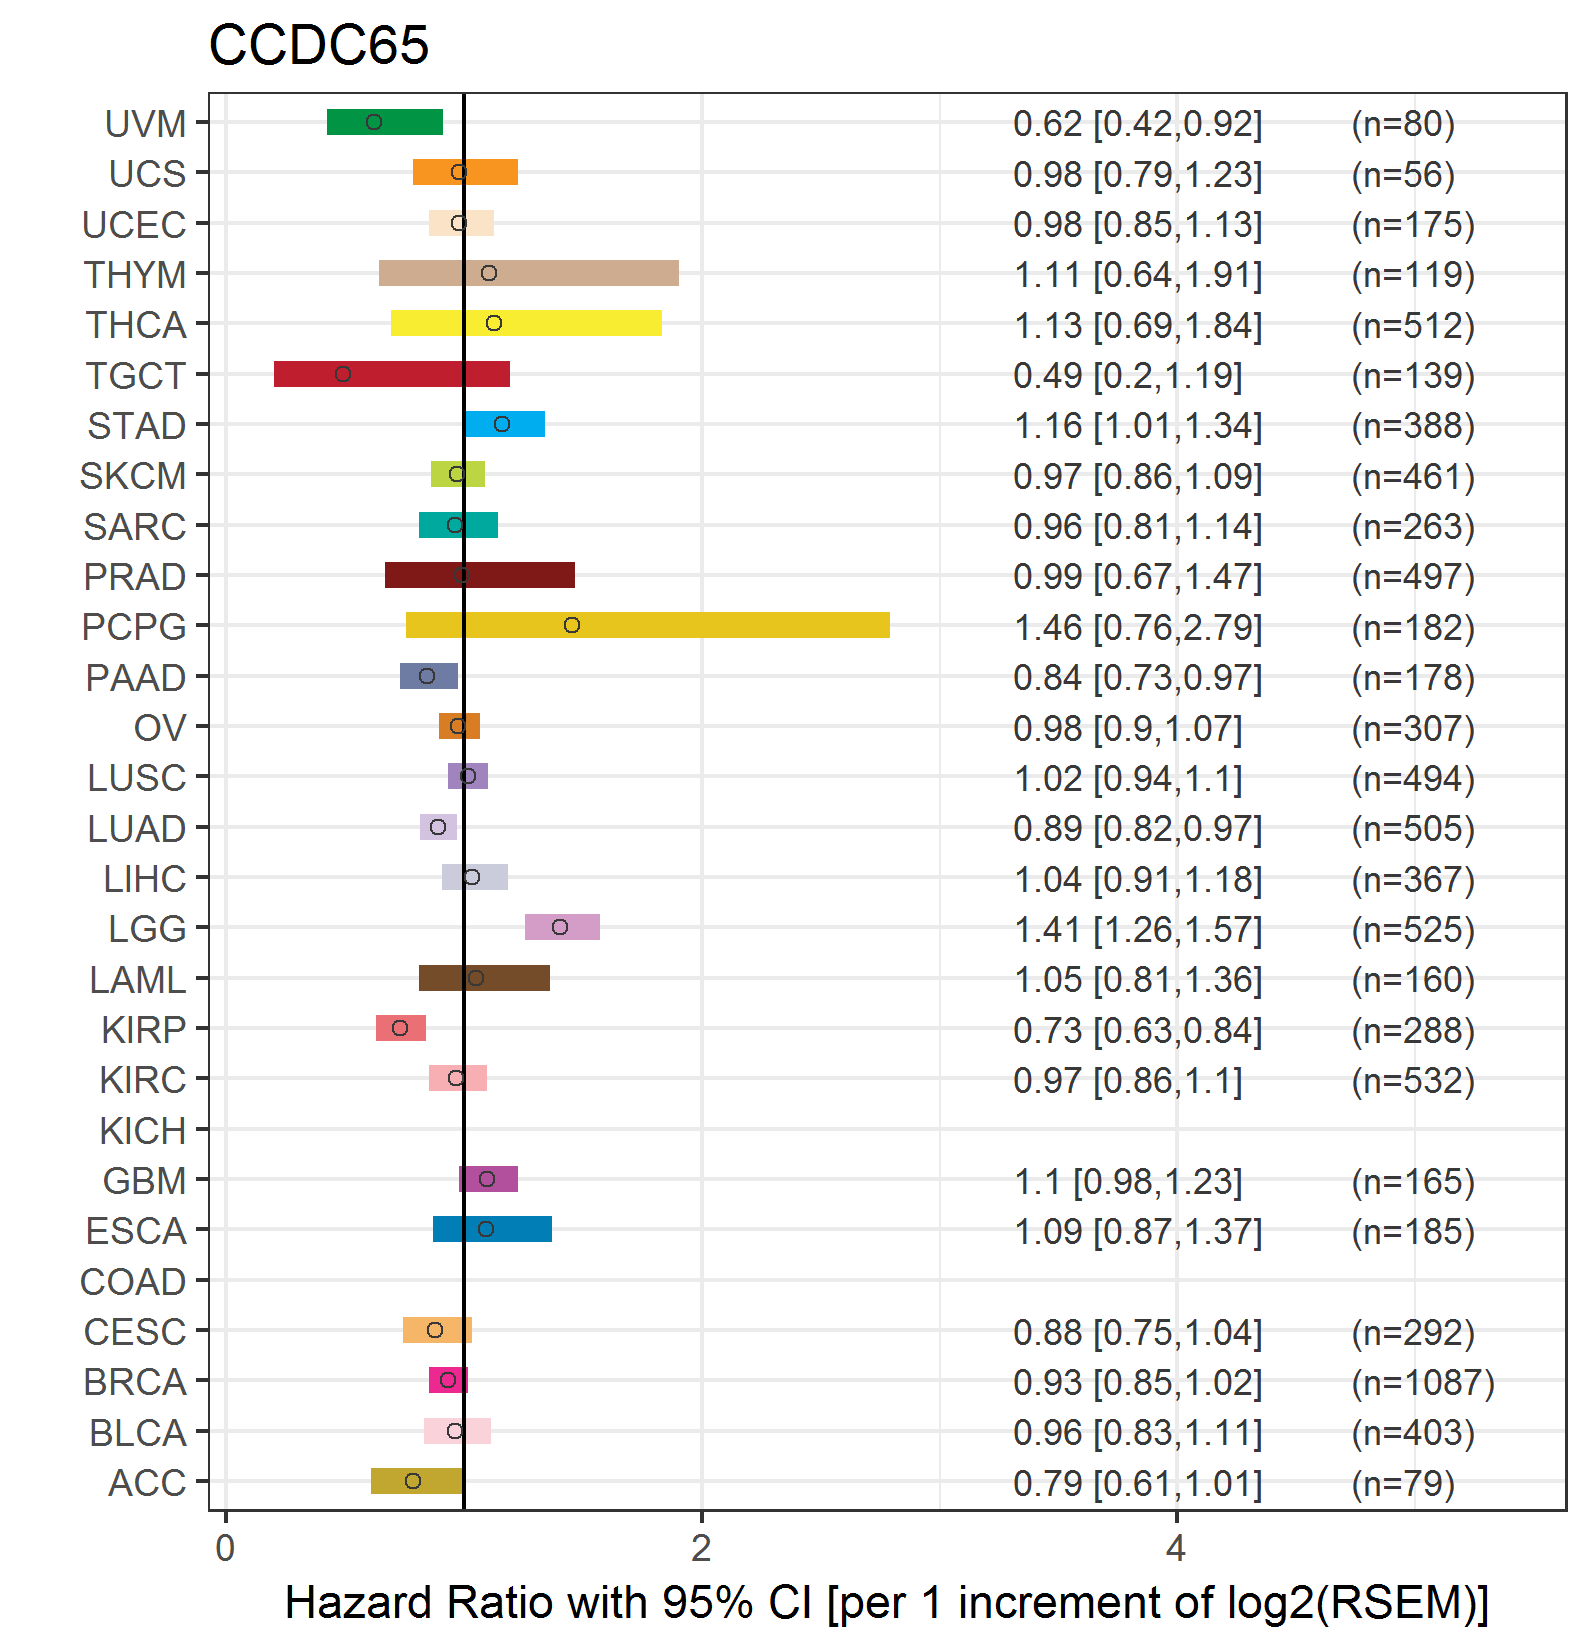
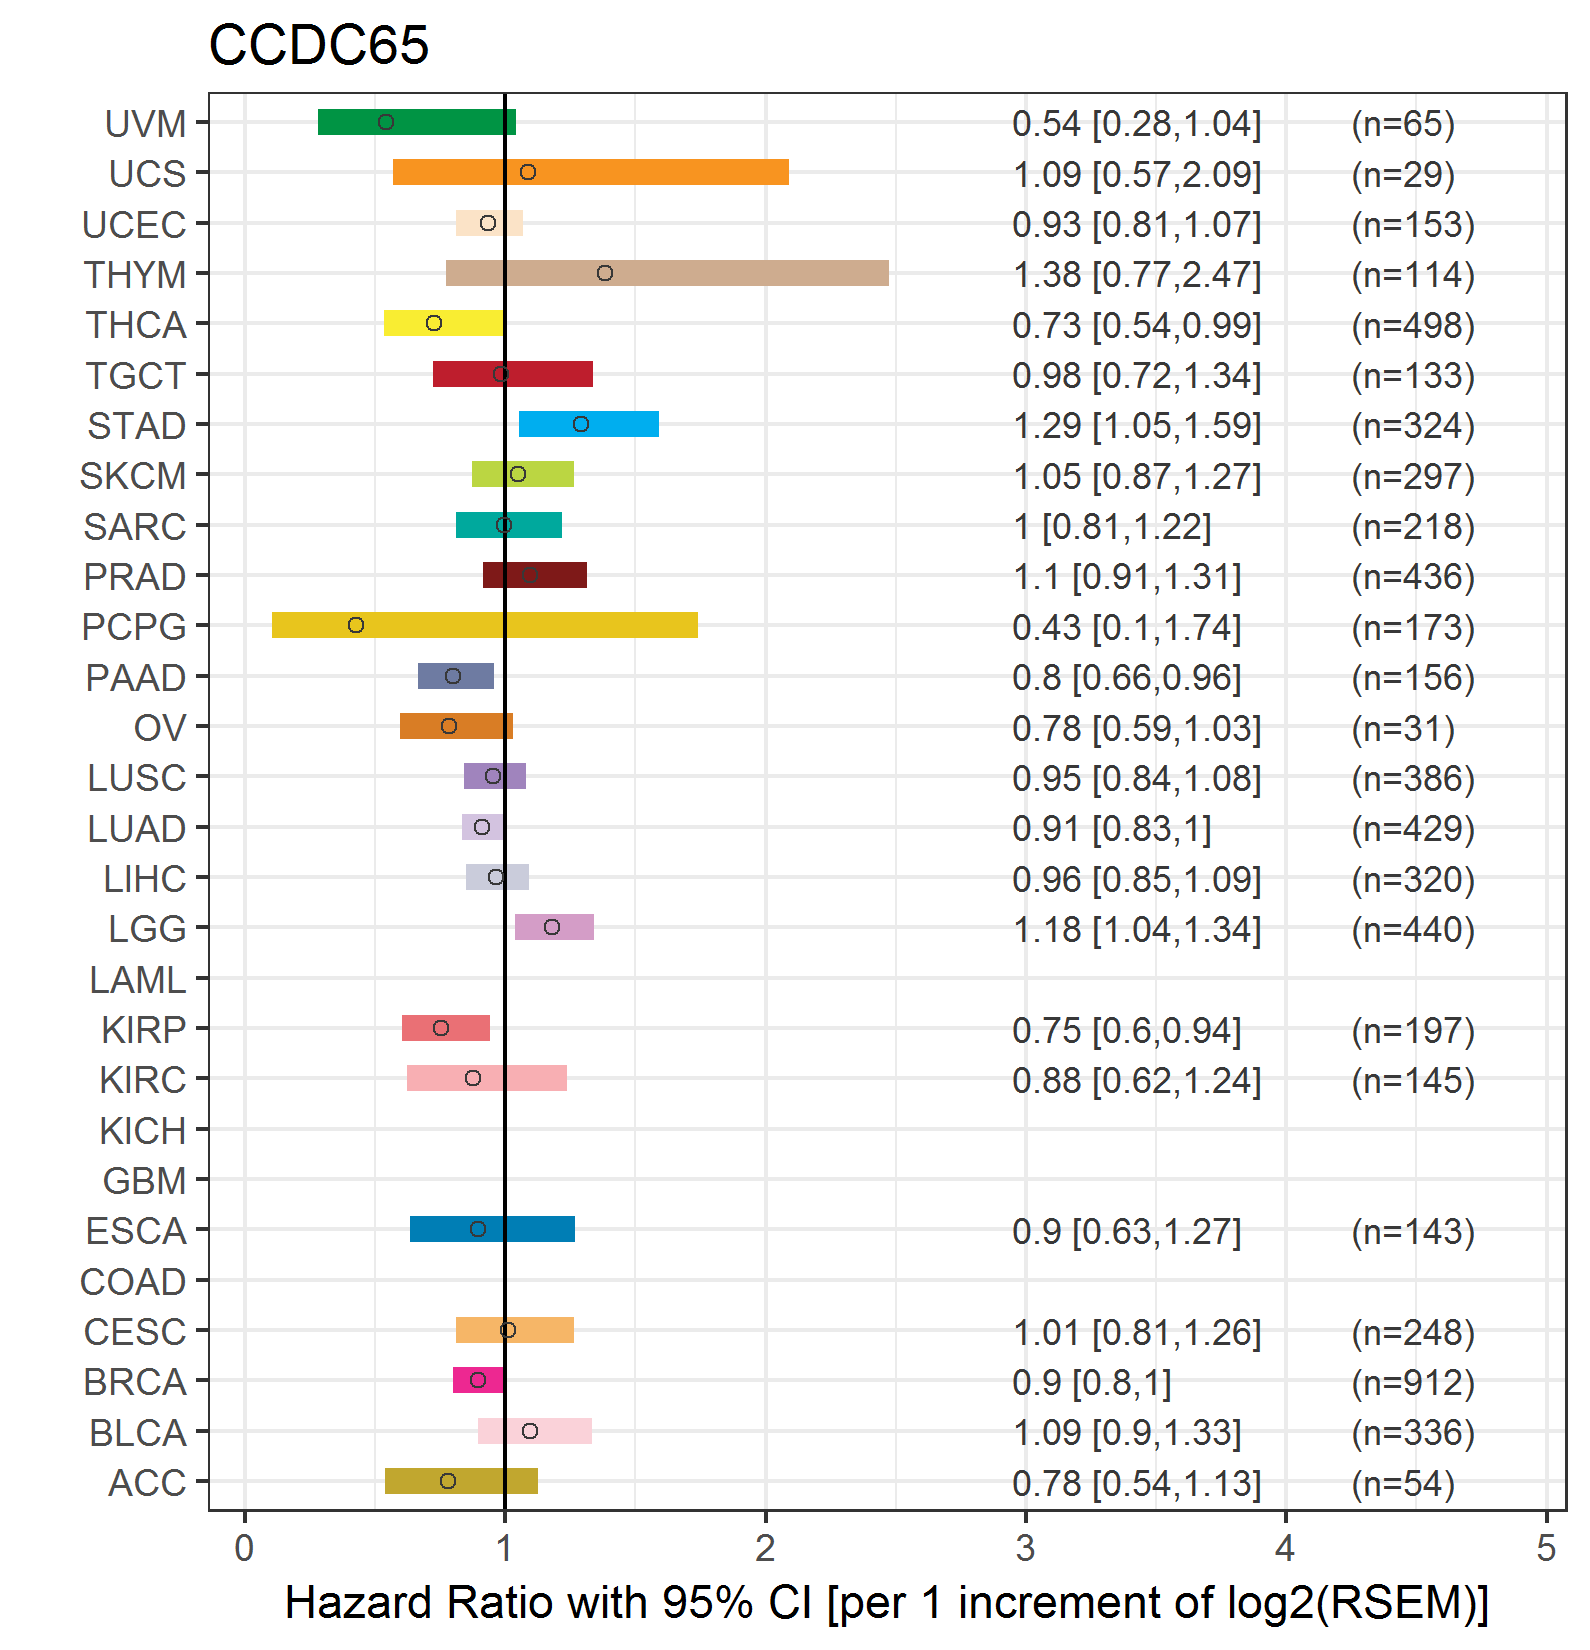
| Forest plot of Cox proportional hazard ratio (HR) and 95% CI of overall survival (OS) using 28 cancer types (TCGA IlluminaHiSeq_RNASeqV2, pan-cancer normalized log2(norm_counts+1) data, version 2016-08-16) (TCGA clinicalMatrix, phenotype data, version 2016-04-27) * Click on the image enlarge it in a new window. |
 |
| Forest plot of Cox proportional hazard ratio (HR) and 95% CI of relapse free survival (RFS) using 28 cancer types (TCGA IlluminaHiSeq_RNASeqV2, pan-cancer normalized log2(norm_counts+1) data, version 2016-08-16) (TCGA clinicalMatrix, phenotype data, version 2016-04-27) * Click on the image enlarge it in a new window. |
 |
| Top |
| TissGeneClin for CCDC65 |
| TissGeneDrug for CCDC65 |
| Drug information targeting TissGene (DrugBank Version 5.0.6, 2017-04-01) |
| DrugBank ID | Drug name | Drug activity | Drug type | Drug status |
| Top |
| TissGeneDisease for CCDC65 |
| Disease information associated with TissGene (DisGeNet, 2016-06-01) |
| Disease ID | Disease name | # pubmeds | Source |
| umls:C0008780 | Ciliary Motility Disorders | 2 | BeFree |
| umls:C0022521 | Kartagener Syndrome | 2 | BeFree,CLINVAR |
| umls:C3809701 | CILIARY DYSKINESIA, PRIMARY, 27 | 0 | CLINVAR |
|
Copyright 2016-Present - The University of Texas Health Science Center at Houston (UTHealth) Web File Viewing | How to Report, Fraud, Waste and Abuse | State of Texas | Statewide Search | Texas Homeland Security | Site Policies |