 |
| |
| |
| |
| |
| |
| |
|

| TissGeneSummary for IL1RL2 |
 Gene summary Gene summary |
| Basic gene information | Gene symbol | IL1RL2 |
| Gene name | interleukin 1 receptor-like 2 | |
| Synonyms | IL-1Rrp2|IL-36R|IL1R-rp2|IL1RRP2 | |
| Cytomap | UCSC genome browser: 2q12 | |
| Type of gene | protein-coding | |
| RefGenes | NM_003854.2, | |
| Description | IL-1 receptor-related protein 2IL-36 receptorinterleukin-1 receptor-like 2interleukin-1 receptor-related protein 2 | |
| Modification date | 20141207 | |
| dbXrefs | MIM : 604512 | |
| HGNC : HGNC | ||
| Ensembl : ENSG00000115598 | ||
| HPRD : 05150 | ||
| Vega : OTTHUMG00000130776 | ||
| Protein | UniProt: go to UniProt's Cross Reference DB Table | |
| Expression | CleanEX: HS_IL1RL2 | |
| BioGPS: 8808 | ||
| Pathway | NCI Pathway Interaction Database: IL1RL2 | |
| KEGG: IL1RL2 | ||
| REACTOME: IL1RL2 | ||
| Pathway Commons: IL1RL2 | ||
| Context | iHOP: IL1RL2 | |
| ligand binding site mutation search in PubMed: IL1RL2 | ||
| UCL Cancer Institute: IL1RL2 | ||
| Assigned class in TissGDB* | C | |
| Included tissue-specific gene expression resources | TiGER,GTEx | |
| Specific-tissues in normal samples (assigned by TissGDB using HPA, TiGER, and GTEx) | ColonSkin | |
| Cancer types related to the specific-tissues in cancer samples (assigned by TissGDB using TCGA) | COADSKCM | |
| Reference showing the relevant tissue of IL1RL2 | ||
| Description by TissGene annotations | ||
| * Class A consists of genes with literature evidence and is part of the cTissGenes. Class B consists of only cTissGenes without additional evidence. The remaining genes belong to Class C. |
| Gene ontology having evidence of Inferred from Direct Assay (IDA) from Entrez |
| GO ID | GO term | PubMed ID |
| Top |
| TissGeneExp for IL1RL2 |
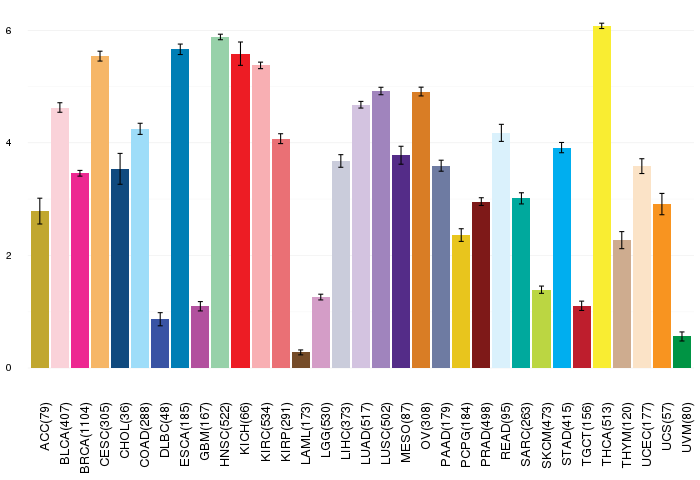
| Gene expressions across 28 cancer types (X-axis: cancer type and Y-axis: log2(norm_counts+1)) (TCGA IlluminaHiSeq_RNASeqV2, pan-cancer normalized log2(norm_counts+1) data, version 2016-08-16) |
 |
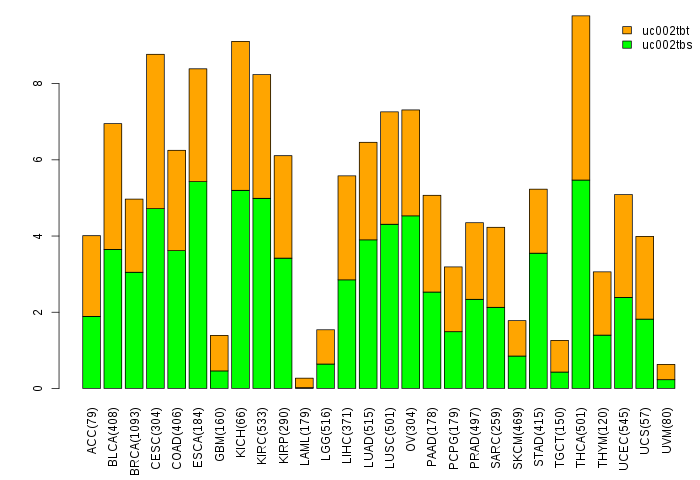
| Gene isoform expressions across 28 cancer types (X-axis: cancer type and Y-axis: log2(norm_counts+1)) (TCGA pan-cancer tcga_rsem_isoform_tpm, version 2016-09-01) |
 |
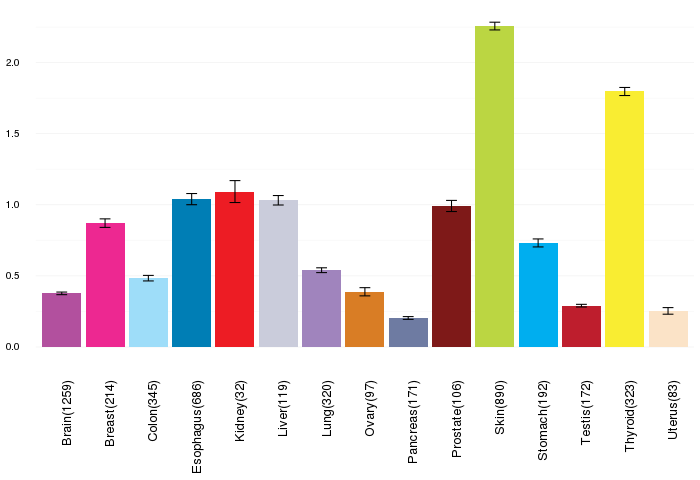
| Gene expressions across normal tissues of GTEx data (GTEx GTEx_Analysis_v6_RNA-seq_RNA-SeQCv1.1.8_gene_rpkm.gct) - Here, we shows the matched tissue types only among our 28 cancer types. |
 |
| Different expressions across 14 cancer types with more than 10 samples between matched tumors and normals (X-axis: cancer type and Y-axis: log2(norm_counts+1)) (TCGA IlluminaHiSeq_RNASeqV2, pan-cancer normalized log2(norm_counts+1) data, version 2016-08-16) |
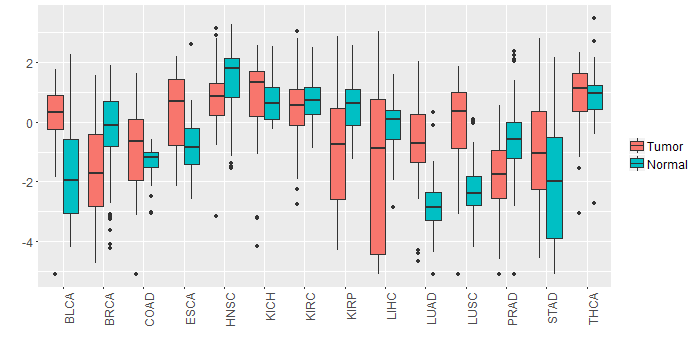 |
| - Significantly differentially expressed cancer types and information. (|Fold change|>1 and FDR<0.05) |
| Cancer type | Mean(exp) in tumor | Mean(exp) in matched normal | Log2FC | P-val. | FDR |
| PRAD | -1.935212031 | -0.526312031 | -1.4089 | 7.18E-07 | 5.29E-06 |
| LUAD | -0.648706129 | -2.816331991 | 2.167625862 | 4.12E-16 | 4.67E-15 |
| LUSC | -0.162674588 | -2.208419686 | 2.045745098 | 5.31E-12 | 2.30E-11 |
| BRCA | -1.555876032 | -0.301293576 | -1.254582456 | 3.36E-10 | 1.26E-09 |
| KIRP | -0.943840397 | 0.535043978 | -1.478884375 | 0.000383 | 0.001154148 |
| LIHC | -1.532947647 | -0.081715647 | -1.451232 | 0.000368 | 0.001107491 |
| Top |
| TissGene-miRNA for IL1RL2 |
| Significantly anti-correlated miRNAs of TissGene across 28 cancer types (Gene-miRNA relations from TargetScanHuman Relsease 7.1, Conserved_Site_Context_Scores.txt.zip, 06.01.2016) (TCGA IlluminaHiSeq_miRNASeq, log2(RPM+1) data, version 2016-11-21) (TCGA IlluminaHiSeq_RNASeqV2, log2(normalized_count+1) data, version 2016-08-16) (Spearman’s Rank Correlation (p-value<0.05 and coefficient<-0.25)) |
| Cancer type | miRNA id | miRNA accession | P-val. | Coeff. | # samples |
| Top |
| TissGeneMut for IL1RL2 |
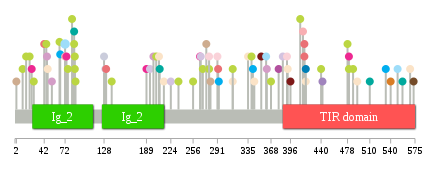
| TissGeneSNV for IL1RL2 |
| nsSNV counts per each loci. Different colors of circles represent different cancer types. Circle size denotes number of samples. (TCGA somatic mutation (SNPs and small INDELs) data, version 2016-04-25) * Click on the image to enlarge it in a new window. |
 |
 |
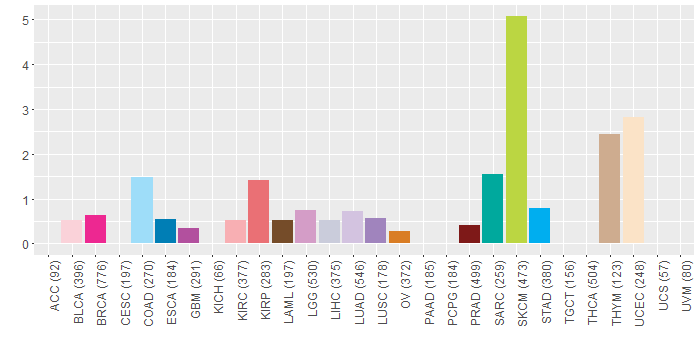
| Somatic nucleotide variants of TissGene across 28 cancer types (X-axis: cancer type and Y-axis: % of mutated samples) The numbers in parentheses are numbers of samples with mutation (nsSNVs). (TCGA somatic mutation (SNPs and small INDELs) data, version 2016-04-25) |
 |
| - nsSNVs sorted by frequency. |
| AAchange | Cancer type | # samples |
| p.R72I | COAD | 2 |
| p.P392L | UCEC | 1 |
| p.D362N | LGG | 1 |
| p.R557H | SARC | 1 |
| p.I11T | SKCM | 1 |
| p.P46H | LGG | 1 |
| p.S16F | SKCM | 1 |
| p.R368Q | SKCM | 1 |
| p.F82I | SKCM | 1 |
| p.R279Q | BLCA | 1 |
| p.L199R | LGG | 1 |
| p.D130N | LIHC | 1 |
| p.E292A | KIRP | 1 |
| p.A510D | SARC | 1 |
| p.P313T | UCEC | 1 |
| p.S90L | HNSC | 1 |
| p.E414D | KIRC | 1 |
| p.S396N | PRAD | 1 |
| p.K160T | READ | 1 |
| p.V442L | LUSC | 1 |
| p.R291W | BLCA | 1 |
| p.M85I | SKCM | 1 |
| p.V214E | UCEC | 1 |
| p.Y354F | PRAD | 1 |
| p.Q75H | READ | 1 |
| p.P45S | SKCM | 1 |
| p.P313L | SKCM | 1 |
| p.D189N | BRCA | 1 |
| p.E86D | SKCM | 1 |
| p.P410L | SKCM | 1 |
| p.V65M | STAD | 1 |
| p.D275A | THYM | 1 |
| p.L128I | LIHC | 1 |
| p.E86A | SKCM | 1 |
| p.G418V | UCEC | 1 |
| p.D76N | SKCM | 1 |
| p.L550P | COAD | 1 |
| p.R72I | KIRC | 1 |
| p.C42Y | KIRP | 1 |
| p.A194S | LUAD | 1 |
| p.E207G | UCEC | 1 |
| p.G224E | LUAD | 1 |
| p.Q478* | SKCM | 1 |
| p.G27R | SKCM | 1 |
| p.Q416X | KIRP | 1 |
| p.R540W | OV | 1 |
| p.Q416* | KIRP | 1 |
| p.E440K | SKCM | 1 |
| p.K568N | UCEC | 1 |
| p.P24A | BRCA | 1 |
| p.W87G | SKCM | 1 |
| p.A344T | UCEC | 1 |
| p.T573M | LAML | 1 |
| p.R281I | THYM | 1 |
| p.A471T | DLBC | 1 |
| p.D379_splice | GBM | 1 |
| p.N266S | BRCA | 1 |
| p.D256N | SKCM | 1 |
| p.H235Y | SKCM | 1 |
| p.V208D | SARC | 1 |
| p.G340E | SKCM | 1 |
| p.E131D | KIRP | 1 |
| p.G418V | ESCA | 1 |
| p.G21R | SKCM | 1 |
| p.H74Q | BRCA | 1 |
| p.P64S | SKCM | 1 |
| p.L342I | STAD | 1 |
| p.K391T | BLCA | 1 |
| p.V270M | SKCM | 1 |
| p.E492D | UCEC | 1 |
| p.W2X | THYM | 1 |
| p.S60C | HNSC | 1 |
| p.M85I | SARC | 1 |
| p.S53N | LGG | 1 |
| p.H293L | STAD | 1 |
| p.N267S | LUAD | 1 |
| p.R533G | STAD | 1 |
| p.I486M | SKCM | 1 |
| p.G139E | SKCM | 1 |
| p.I47T | UCEC | 1 |
| p.A385S | LUAD | 1 |
| p.G203E | SKCM | 1 |
| p.R279Q | SKCM | 1 |
| p.G480E | SKCM | 1 |
| p.R335Q | UCEC | 1 |
| p.G480R | BRCA | 1 |
| p.I361T | COAD | 1 |
| Top |
| TissGeneCNV for IL1RL2 |
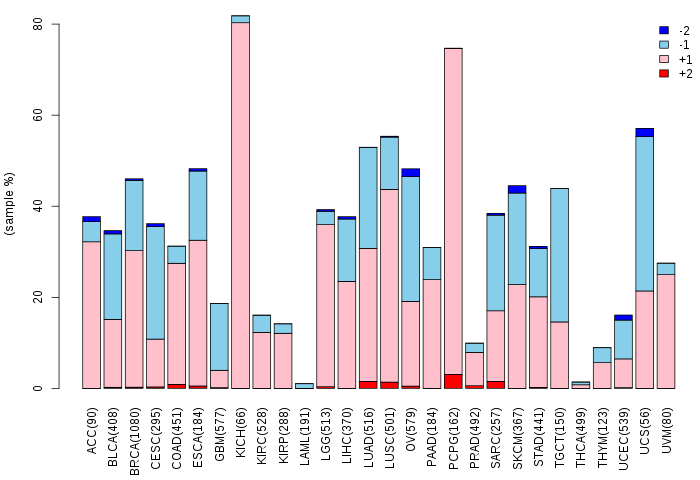
| Copy number variations of TissGene across 28 cancer types (X-axis: cancer type and Y-axis: % of CNV samples) (TCGA Gistic2_CopyNumber_Gistic2_all_data_by_genes, Gistic2 copy number data, version 2016-08-16) |
 |
| Top |
| TissGeneFusions for IL1RL2 |
| Fusion genes including TissGene (ChimerDB 3.0, 2016-12-01 and TCGA fusion Portal 2015-12-01) |
| Database | Src | Cancer type | Sample | Fusion gene | ORF | 5'-gene BP | 3'-gene BP |
| TCGAfusionPortal | PRADA | BRCA | TCGA-BH-A1FD-01A | IL1RL2-IL1R2 | Out-of-frame | Chr2:102828634 | Chr2:102636100 |
| Top |
| TissGeneNet for IL1RL2 |
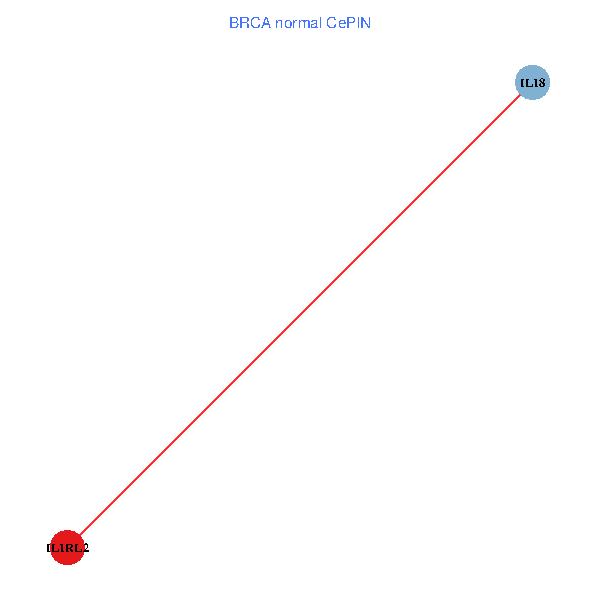
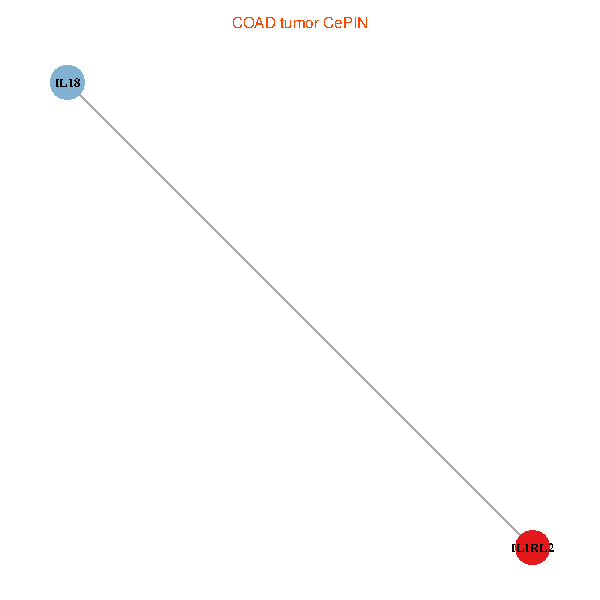
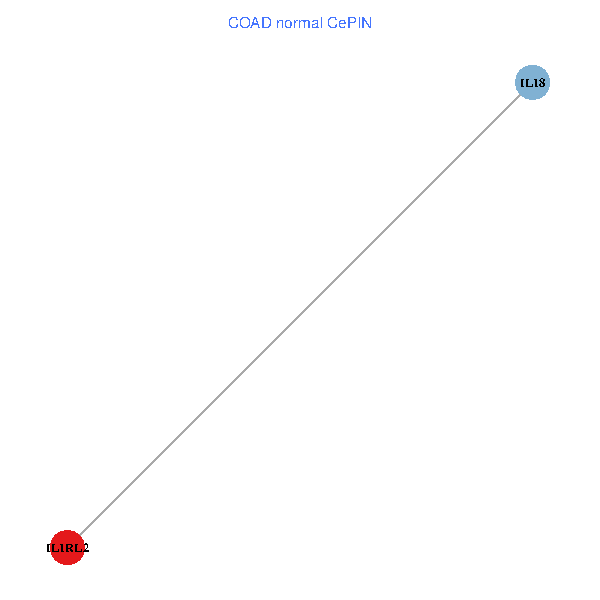
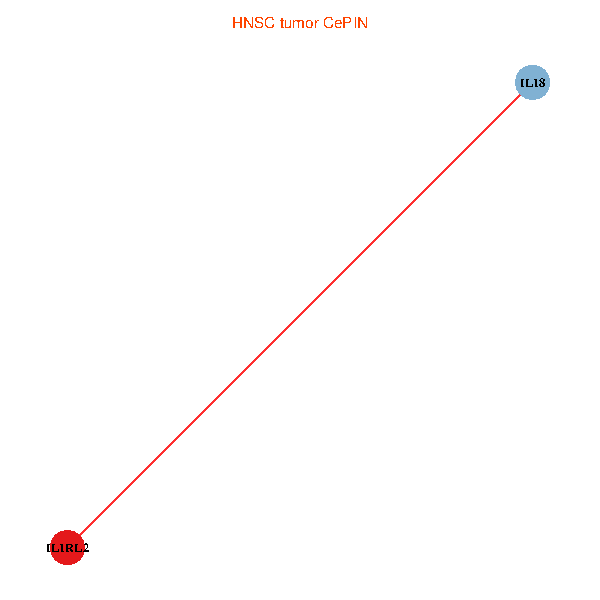
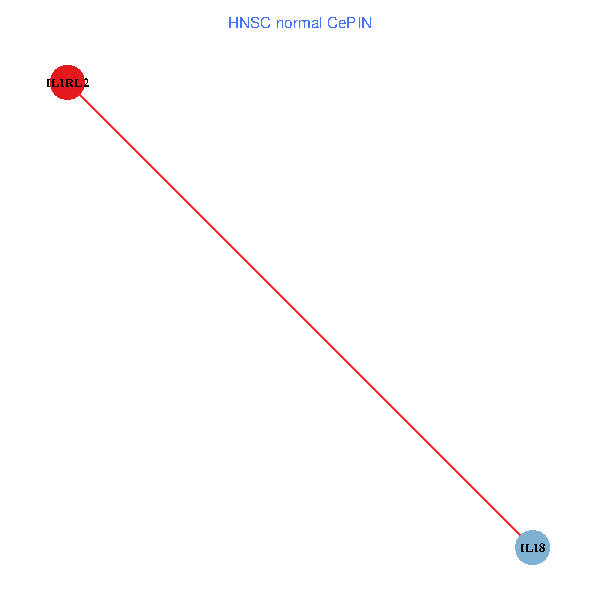
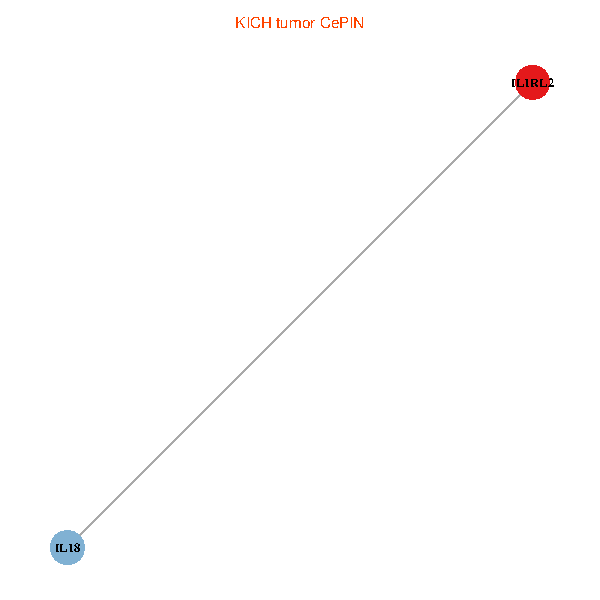
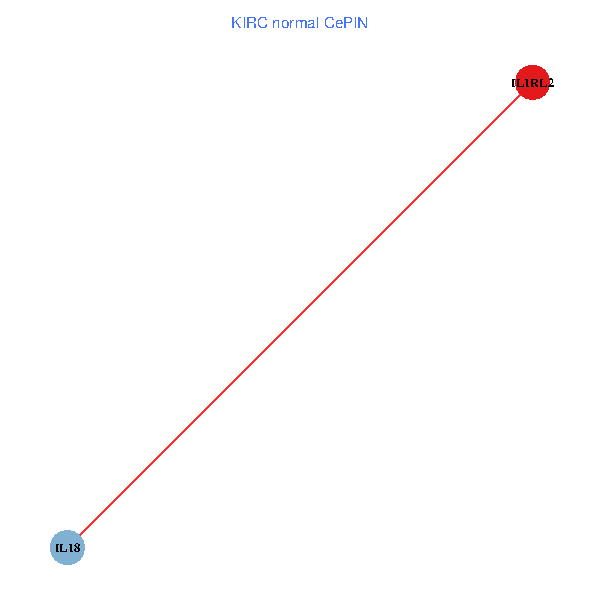
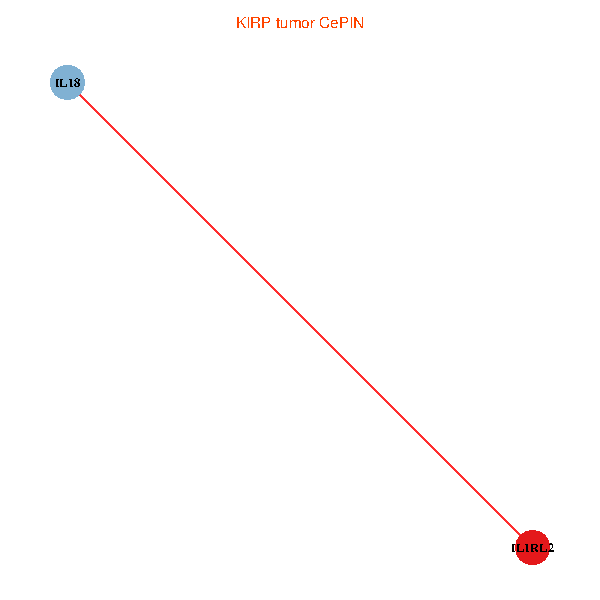
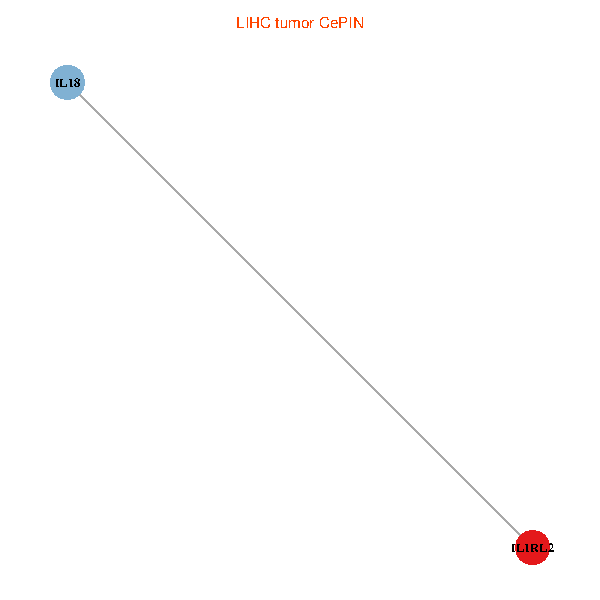
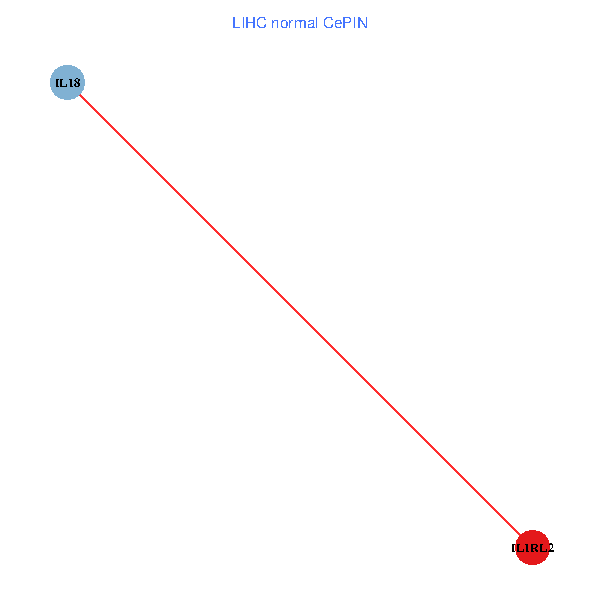
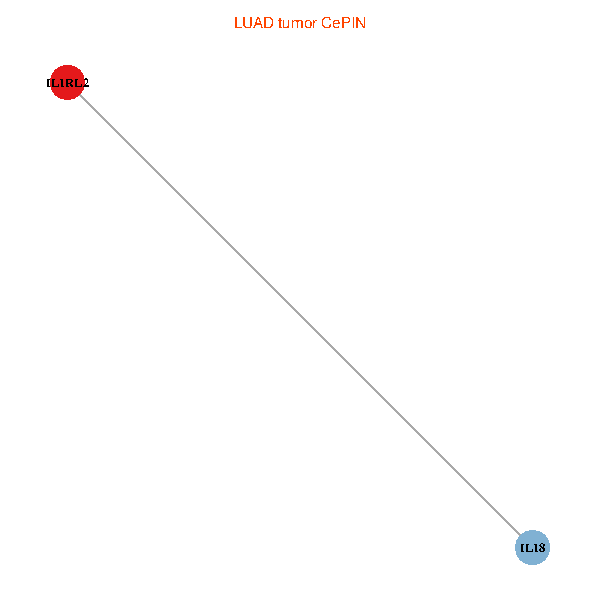
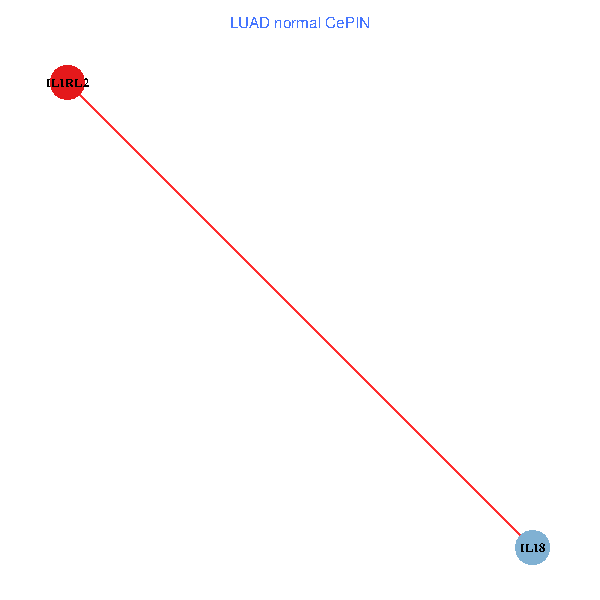
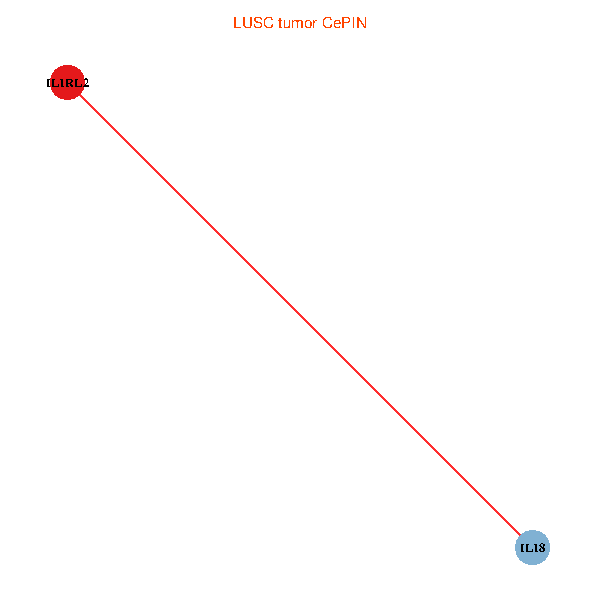
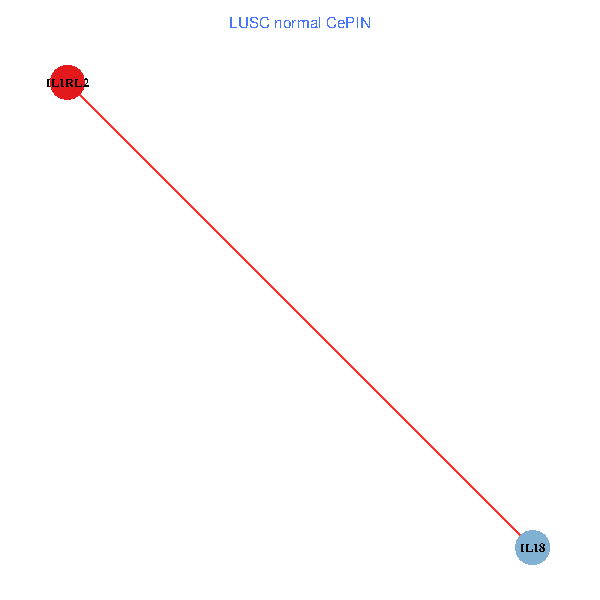
| Co-expressed gene networks based on protein-protein interaction data (CePIN) (TCGA IlluminaHiSeq_RNASeqV2, pan-cancer normalized log2(norm_counts+1) data, version 2016-08-16) (PINA2 ppi data) |
| BRCA (tumor) | BRCA (normal) |
| IL1RL2, IL18 (tumor) | IL1RL2, IL18 (normal) |
 |  |
| COAD (tumor) | COAD (normal) |
| IL1RL2, IL18 (tumor) | IL1RL2, IL18 (normal) |
 |  |
| HNSC (tumor) | HNSC (normal) |
| IL1RL2, IL18 (tumor) | IL1RL2, IL18 (normal) |
 |  |
| KICH (tumor) | KICH (normal) |
| IL1RL2, IL18 (tumor) | IL1RL2, IL18 (normal) |
 |  |
| KIRC (tumor) | KIRC (normal) |
| IL1RL2, IL18 (tumor) | IL1RL2, IL18 (normal) |
 |  |
| KIRP (tumor) | KIRP (normal) |
| IL1RL2, IL18 (tumor) | IL1RL2, IL18 (normal) |
 |  |
| LIHC (tumor) | LIHC (normal) |
| IL1RL2, IL18 (tumor) | IL1RL2, IL18 (normal) |
 |  |
| LUAD (tumor) | LUAD (normal) |
| IL1RL2, IL18 (tumor) | IL1RL2, IL18 (normal) |
 |  |
| LUSC (tumor) | LUSC (normal) |
| IL1RL2, IL18 (tumor) | IL1RL2, IL18 (normal) |
 |  |
| PRAD (tumor) | PRAD (normal) |
| IL1RL2, IL18 (tumor) | IL1RL2, IL18 (normal) |
 |  |
| STAD (tumor) | STAD (normal) |
| IL1RL2, IL18 (tumor) | IL1RL2, IL18 (normal) |
 |  |
| THCA (tumor) | THCA (normal) |
| IL1RL2, IL18 (tumor) | IL1RL2, IL18 (normal) |
 |  |
| Top |
| TissGeneProg for IL1RL2 |
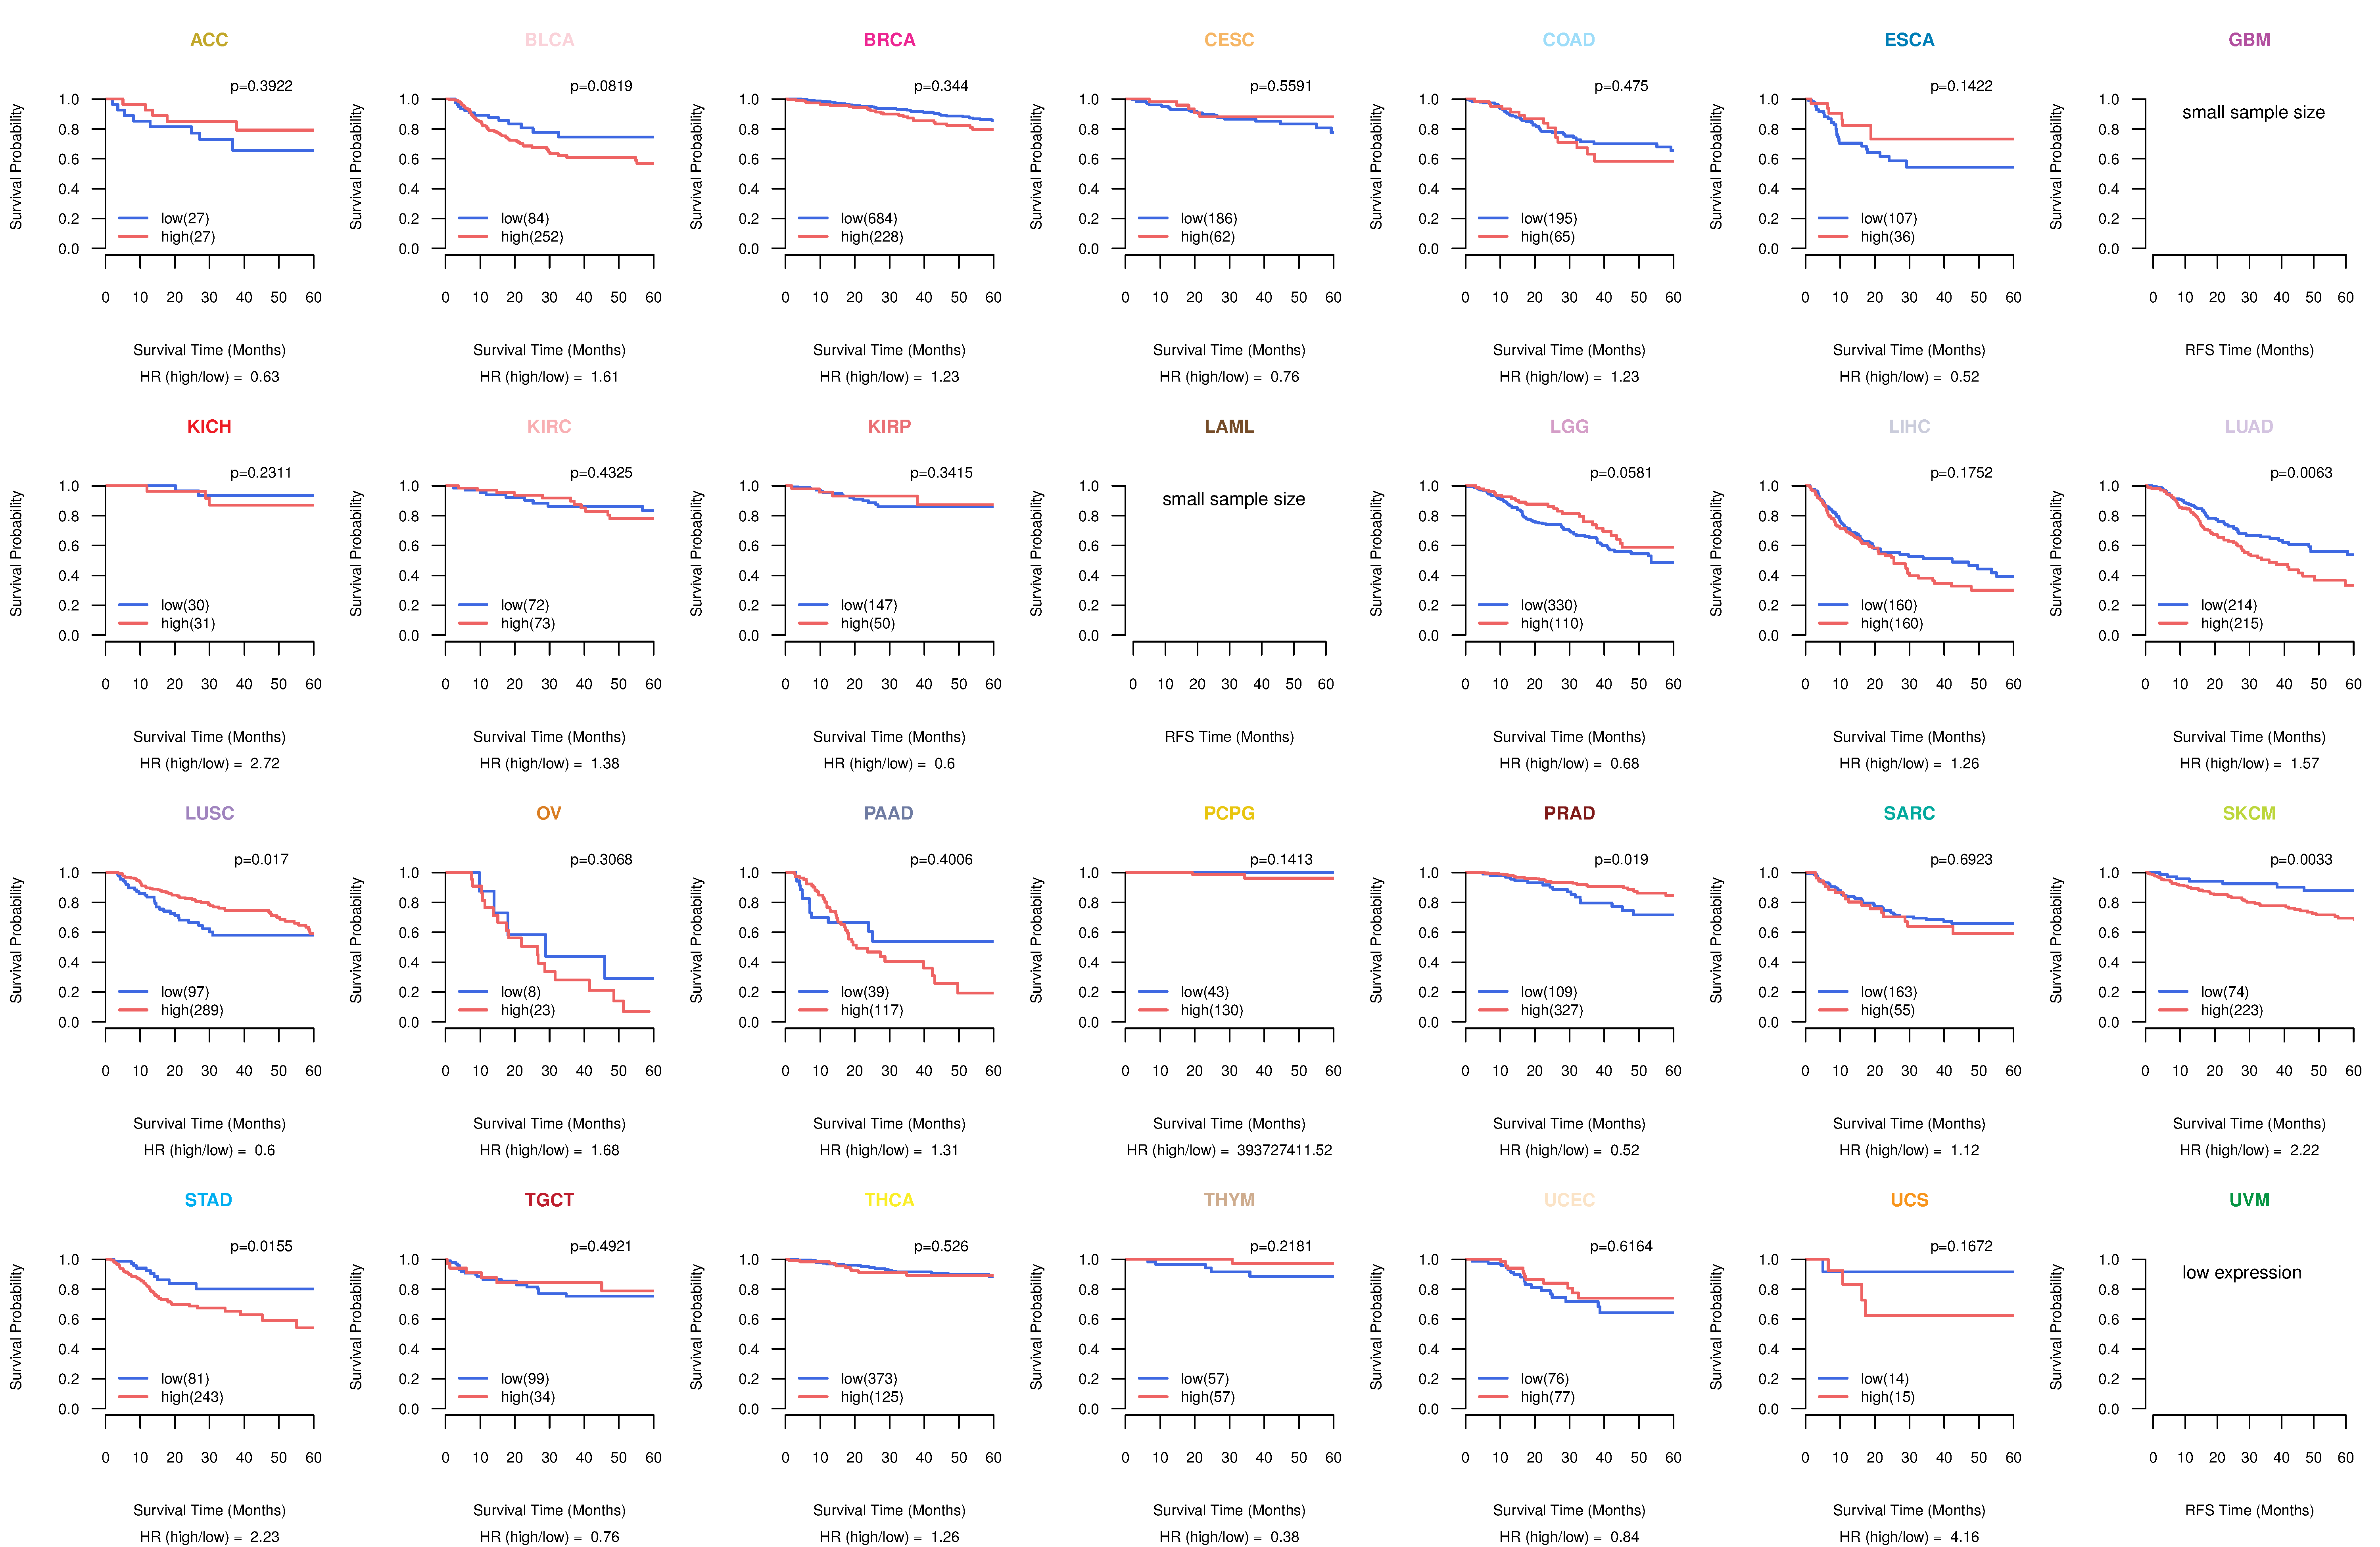
| Kaplan-Meier plots with logrank tests of overall survival (OS) using 28 cancer types (TCGA IlluminaHiSeq_RNASeqV2, pan-cancer normalized log2(norm_counts+1) data, version 2016-08-16) (TCGA clinicalMatrix, phenotype data, version 2016-04-27) * Click on the image to enlarge it in a new window. |
 |
| Kaplan-Meier plots with logrank test of relapse free survival (RFS) using 28 cancer types (TCGA IlluminaHiSeq_RNASeqV2, pan-cancer normalized log2(norm_counts+1) data, version 2016-08-16) (TCGA clinicalMatrix, phenotype data, version 2016-04-27) * Click on the image enlarge it in a new window. |
 |
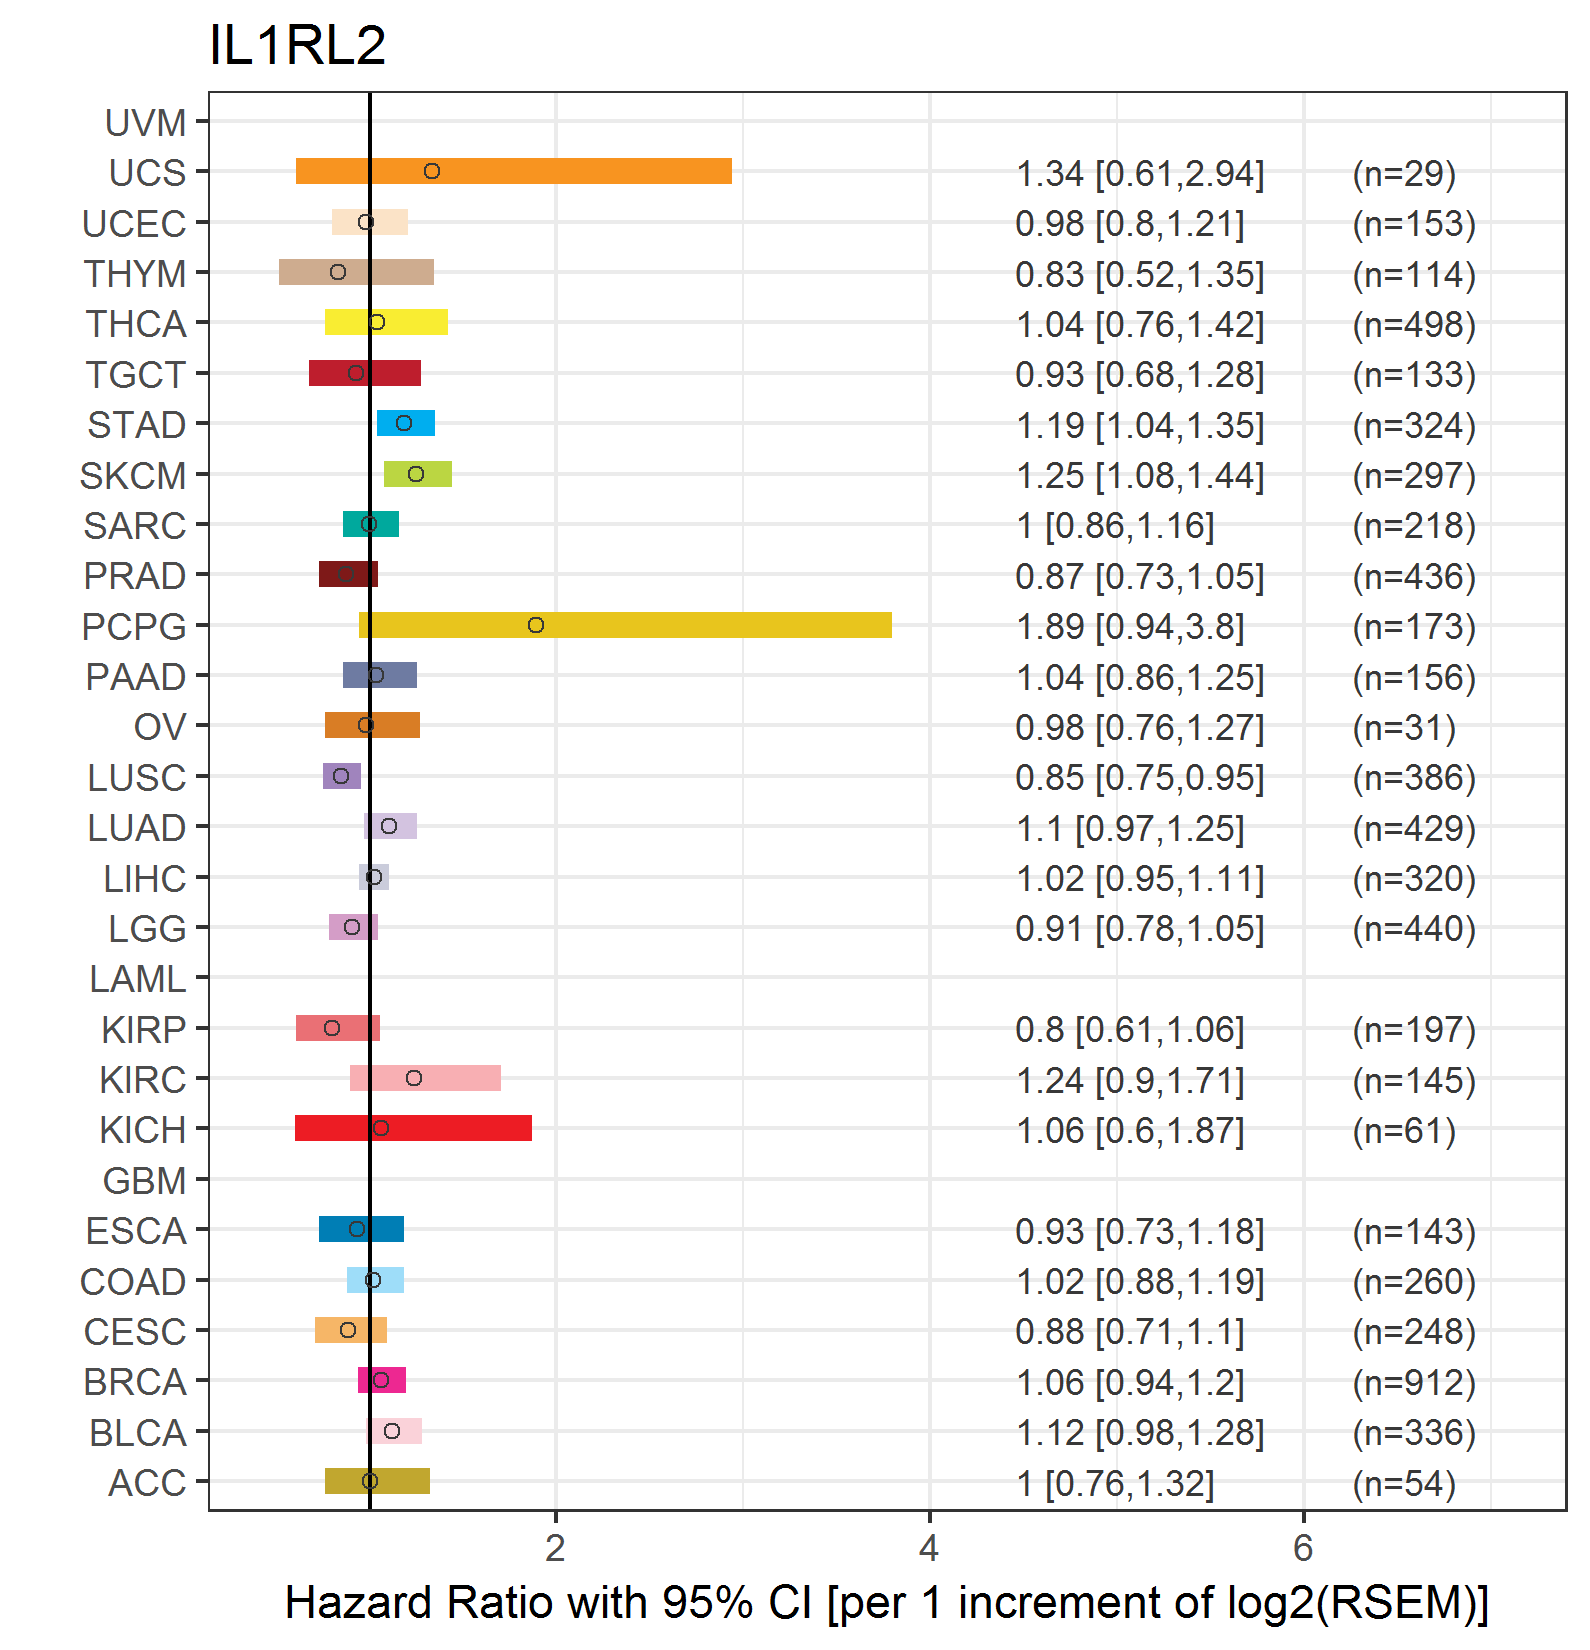
| Forest plot of Cox proportional hazard ratio (HR) and 95% CI of overall survival (OS) using 28 cancer types (TCGA IlluminaHiSeq_RNASeqV2, pan-cancer normalized log2(norm_counts+1) data, version 2016-08-16) (TCGA clinicalMatrix, phenotype data, version 2016-04-27) * Click on the image enlarge it in a new window. |
 |
| Forest plot of Cox proportional hazard ratio (HR) and 95% CI of relapse free survival (RFS) using 28 cancer types (TCGA IlluminaHiSeq_RNASeqV2, pan-cancer normalized log2(norm_counts+1) data, version 2016-08-16) (TCGA clinicalMatrix, phenotype data, version 2016-04-27) * Click on the image enlarge it in a new window. |
 |
| Top |
| TissGeneClin for IL1RL2 |
| TissGeneDrug for IL1RL2 |
| Drug information targeting TissGene (DrugBank Version 5.0.6, 2017-04-01) |
| DrugBank ID | Drug name | Drug activity | Drug type | Drug status |
| Top |
| TissGeneDisease for IL1RL2 |
| Disease information associated with TissGene (DisGeNet, 2016-06-01) |
| Disease ID | Disease name | # pubmeds | Source |
| umls:C0029408 | Degenerative polyarthritis | 2 | GAD |
| umls:C0007570 | Celiac Disease | 1 | GAD |
| umls:C0021818 | Intervertebral Disk Displacement | 1 | GAD |
| umls:C0023434 | Chronic Lymphocytic Leukemia | 1 | GAD |
| umls:C0028797 | Occupational Diseases | 1 | GAD |
| umls:C0030567 | Parkinson Disease | 1 | GAD |
| umls:C0033860 | Psoriasis | 1 | BeFree |
| umls:C0037268 | Skin Abnormalities | 1 | BeFree |
| umls:C0151449 | Primary Sj�gren's syndrome | 1 | BeFree |
|
Copyright 2016-Present - The University of Texas Health Science Center at Houston (UTHealth) Web File Viewing | How to Report, Fraud, Waste and Abuse | State of Texas | Statewide Search | Texas Homeland Security | Site Policies |