 |
| |
| |
| |
| |
| |
| |
|

| TissGeneSummary for ASIC3 |
 Gene summary Gene summary |
| Basic gene information | Gene symbol | ASIC3 |
| Gene name | acid-sensing (proton-gated) ion channel 3 | |
| Synonyms | ACCN3|DRASIC|SLNAC1|TNaC1 | |
| Cytomap | UCSC genome browser: 7q35 | |
| Type of gene | protein-coding | |
| RefGenes | NM_004769.3, NM_020321.3,NM_020322.3,NR_046401.1, | |
| Description | acid-sensing ion channel 3amiloride-sensitive cation channel 3, testismodulatory subunit of ASIC2aneuronal amiloride-sensitive cation channel 3proton-gated cation channel subunittestis sodium channel 1 | |
| Modification date | 20141207 | |
| dbXrefs | MIM : 611741 | |
| HGNC : HGNC | ||
| Ensembl : ENSG00000213199 | ||
| HPRD : 10626 | ||
| Vega : OTTHUMG00000158685 | ||
| Protein | UniProt: go to UniProt's Cross Reference DB Table | |
| Expression | CleanEX: HS_ASIC3 | |
| BioGPS: 9311 | ||
| Pathway | NCI Pathway Interaction Database: ASIC3 | |
| KEGG: ASIC3 | ||
| REACTOME: ASIC3 | ||
| Pathway Commons: ASIC3 | ||
| Context | iHOP: ASIC3 | |
| ligand binding site mutation search in PubMed: ASIC3 | ||
| UCL Cancer Institute: ASIC3 | ||
| Assigned class in TissGDB* | C | |
| Included tissue-specific gene expression resources | TiGER,GTEx | |
| Specific-tissues in normal samples (assigned by TissGDB using HPA, TiGER, and GTEx) | Testis | |
| Cancer types related to the specific-tissues in cancer samples (assigned by TissGDB using TCGA) | TGCT | |
| Reference showing the relevant tissue of ASIC3 | ||
| Description by TissGene annotations | ||
| * Class A consists of genes with literature evidence and is part of the cTissGenes. Class B consists of only cTissGenes without additional evidence. The remaining genes belong to Class C. |
| Gene ontology having evidence of Inferred from Direct Assay (IDA) from Entrez |
| GO ID | GO term | PubMed ID |
| Top |
| TissGeneExp for ASIC3 |
| Gene expressions across 28 cancer types (X-axis: cancer type and Y-axis: log2(norm_counts+1)) (TCGA IlluminaHiSeq_RNASeqV2, pan-cancer normalized log2(norm_counts+1) data, version 2016-08-16) |
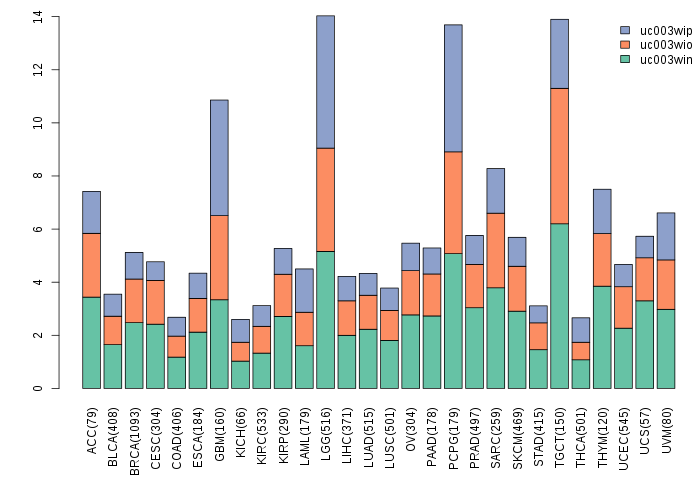
| Gene isoform expressions across 28 cancer types (X-axis: cancer type and Y-axis: log2(norm_counts+1)) (TCGA pan-cancer tcga_rsem_isoform_tpm, version 2016-09-01) |
 |
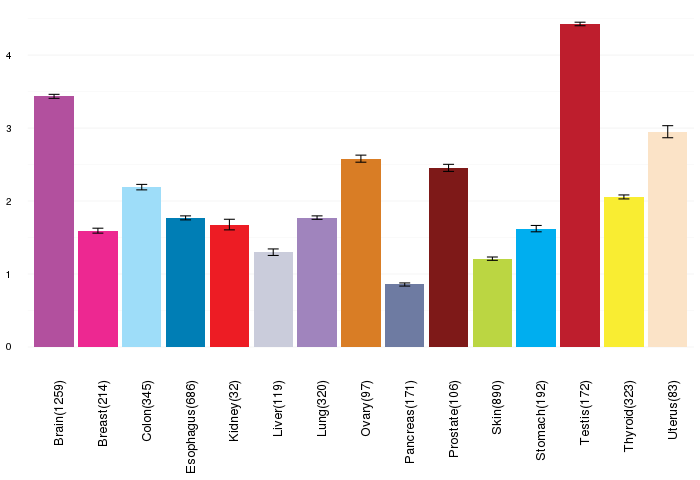
| Gene expressions across normal tissues of GTEx data (GTEx GTEx_Analysis_v6_RNA-seq_RNA-SeQCv1.1.8_gene_rpkm.gct) - Here, we shows the matched tissue types only among our 28 cancer types. |
 |
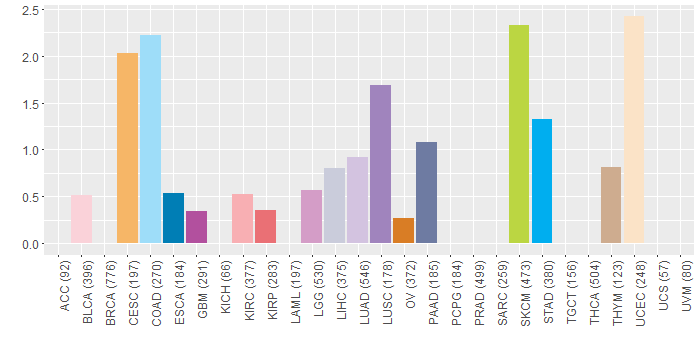
| Different expressions across 14 cancer types with more than 10 samples between matched tumors and normals (X-axis: cancer type and Y-axis: log2(norm_counts+1)) (TCGA IlluminaHiSeq_RNASeqV2, pan-cancer normalized log2(norm_counts+1) data, version 2016-08-16) |
| - Significantly differentially expressed cancer types and information. (|Fold change|>1 and FDR<0.05) |
| Cancer type | Mean(exp) in tumor | Mean(exp) in matched normal | Log2FC | P-val. | FDR |
| Top |
| TissGene-miRNA for ASIC3 |
| Significantly anti-correlated miRNAs of TissGene across 28 cancer types (Gene-miRNA relations from TargetScanHuman Relsease 7.1, Conserved_Site_Context_Scores.txt.zip, 06.01.2016) (TCGA IlluminaHiSeq_miRNASeq, log2(RPM+1) data, version 2016-11-21) (TCGA IlluminaHiSeq_RNASeqV2, log2(normalized_count+1) data, version 2016-08-16) (Spearman’s Rank Correlation (p-value<0.05 and coefficient<-0.25)) |
| Cancer type | miRNA id | miRNA accession | P-val. | Coeff. | # samples |
| Top |
| TissGeneMut for ASIC3 |
| TissGeneSNV for ASIC3 |
| nsSNV counts per each loci. Different colors of circles represent different cancer types. Circle size denotes number of samples. (TCGA somatic mutation (SNPs and small INDELs) data, version 2016-04-25) * Click on the image to enlarge it in a new window. |
 |
 |
| Somatic nucleotide variants of TissGene across 28 cancer types (X-axis: cancer type and Y-axis: % of mutated samples) The numbers in parentheses are numbers of samples with mutation (nsSNVs). (TCGA somatic mutation (SNPs and small INDELs) data, version 2016-04-25) |
 |
| - nsSNVs sorted by frequency. |
| AAchange | Cancer type | # samples |
| p.E219K | SKCM | 2 |
| p.C543S | SKCM | 1 |
| p.F144C | PAAD | 1 |
| p.E421K | HNSC | 1 |
| p.G195V | LUAD | 1 |
| p.M528V | UCEC | 1 |
| p.D281N | CESC | 1 |
| p.V423M | COAD | 1 |
| p.P293A | LIHC | 1 |
| p.D77E | DLBC | 1 |
| p.R165C | STAD | 1 |
| p.R165C | COAD | 1 |
| p.E430K | SKCM | 1 |
| p.R494C | SKCM | 1 |
| p.T103M | CESC | 1 |
| p.P520L | SKCM | 1 |
| p.N290S | LUAD | 1 |
| p.G209R | HNSC | 1 |
| p.S432L | LUSC | 1 |
| p.G439E | SKCM | 1 |
| p.P520L | STAD | 1 |
| p.S112F | LUAD | 1 |
| p.E320K | UCEC | 1 |
| p.A417T | SKCM | 1 |
| p.G195R | LUAD | 1 |
| p.P520S | LGG | 1 |
| p.P510H | LUAD | 1 |
| p.R127H | ESCA | 1 |
| p.A113V | STAD | 1 |
| p.T4A | COAD | 1 |
| p.D118N | SKCM | 1 |
| p.M1T | LIHC | 1 |
| p.G207S | LUSC | 1 |
| p.R12Q | STAD | 1 |
| p.S37R | LUAD | 1 |
| p.A428V | KIRC | 1 |
| p.E78K | HNSC | 1 |
| p.R127C | KIRP | 1 |
| p.P87L | PAAD | 1 |
| p.P499S | CESC | 1 |
| p.G546X | THYM | 1 |
| p.E220K | BLCA | 1 |
| p.V517L | SKCM | 1 |
| p.A513V | LGG | 1 |
| p.R480K | SKCM | 1 |
| p.S519L | COAD | 1 |
| p.N190T | SKCM | 1 |
| p.P259S | OV | 1 |
| p.L508V | CESC | 1 |
| p.M213L | UCEC | 1 |
| p.N349S | UCEC | 1 |
| p.P277L | STAD | 1 |
| p.S305R | LGG | 1 |
| p.T55N | KIRC | 1 |
| p.P520S | GBM | 1 |
| p.V49M | PAAD | 1 |
| p.R494C | HNSC | 1 |
| p.H504Q | BLCA | 1 |
| p.R522H | UCEC | 1 |
| p.T422A | LIHC | 1 |
| p.T177I | SKCM | 1 |
| p.V49M | COAD | 1 |
| p.F274V | COAD | 1 |
| p.T358M | UCEC | 1 |
| p.F70L | LGG | 1 |
| p.R167H | HNSC | 1 |
| p.E512K | COAD | 1 |
| p.H72Q | LUSC | 1 |
| p.P248S | UCEC | 1 |
| Top |
| TissGeneCNV for ASIC3 |
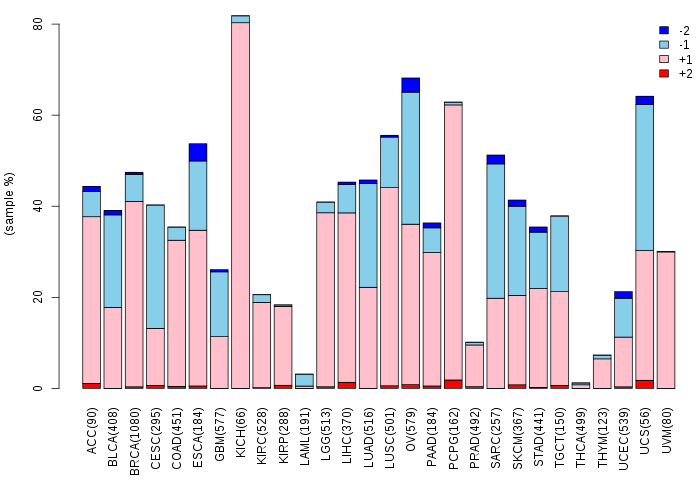
| Copy number variations of TissGene across 28 cancer types (X-axis: cancer type and Y-axis: % of CNV samples) (TCGA Gistic2_CopyNumber_Gistic2_all_data_by_genes, Gistic2 copy number data, version 2016-08-16) |
 |
| Top |
| TissGeneFusions for ASIC3 |
| Fusion genes including TissGene (ChimerDB 3.0, 2016-12-01 and TCGA fusion Portal 2015-12-01) |
| Database | Src | Cancer type | Sample | Fusion gene | ORF | 5'-gene BP | 3'-gene BP |
| Chimerdb3.0 | ChiTaRs | NA | AA429417 | ASIC3-ASIC3 | chr7:150747842 | chr7:150745979 |
| Top |
| TissGeneNet for ASIC3 |
| Co-expressed gene networks based on protein-protein interaction data (CePIN) (TCGA IlluminaHiSeq_RNASeqV2, pan-cancer normalized log2(norm_counts+1) data, version 2016-08-16) (PINA2 ppi data) |
| Top |
| TissGeneProg for ASIC3 |
| Kaplan-Meier plots with logrank tests of overall survival (OS) using 28 cancer types (TCGA IlluminaHiSeq_RNASeqV2, pan-cancer normalized log2(norm_counts+1) data, version 2016-08-16) (TCGA clinicalMatrix, phenotype data, version 2016-04-27) * Click on the image to enlarge it in a new window. |
| Kaplan-Meier plots with logrank test of relapse free survival (RFS) using 28 cancer types (TCGA IlluminaHiSeq_RNASeqV2, pan-cancer normalized log2(norm_counts+1) data, version 2016-08-16) (TCGA clinicalMatrix, phenotype data, version 2016-04-27) * Click on the image enlarge it in a new window. |
| Forest plot of Cox proportional hazard ratio (HR) and 95% CI of overall survival (OS) using 28 cancer types (TCGA IlluminaHiSeq_RNASeqV2, pan-cancer normalized log2(norm_counts+1) data, version 2016-08-16) (TCGA clinicalMatrix, phenotype data, version 2016-04-27) * Click on the image enlarge it in a new window. |
| Forest plot of Cox proportional hazard ratio (HR) and 95% CI of relapse free survival (RFS) using 28 cancer types (TCGA IlluminaHiSeq_RNASeqV2, pan-cancer normalized log2(norm_counts+1) data, version 2016-08-16) (TCGA clinicalMatrix, phenotype data, version 2016-04-27) * Click on the image enlarge it in a new window. |
| Top |
| TissGeneClin for ASIC3 |
| TissGeneDrug for ASIC3 |
| Drug information targeting TissGene (DrugBank Version 5.0.6, 2017-04-01) |
| DrugBank ID | Drug name | Drug activity | Drug type | Drug status |
| Top |
| TissGeneDisease for ASIC3 |
| Disease information associated with TissGene (DisGeNet, 2016-06-01) |
| Disease ID | Disease name | # pubmeds | Source |
| umls:C0010054 | Coronary Arteriosclerosis | 2 | BeFree |
| umls:C0015672 | Fatigue | 2 | BeFree |
| umls:C0151744 | Myocardial Ischemia | 2 | BeFree |
| umls:C0003864 | Arthritis | 1 | BeFree |
| umls:C0003873 | Rheumatoid Arthritis | 1 | BeFree |
| umls:C0011127 | Pressure Ulcer | 1 | BeFree |
| umls:C0016053 | Fibromyalgia | 1 | BeFree |
| umls:C0020429 | Hyperalgesia | 1 | BeFree |
| umls:C0020538 | Hypertensive disease | 1 | GAD |
| umls:C0021368 | Inflammation | 1 | CTD_human |
| umls:C0021655 | Insulin Resistance | 1 | GAD |
| umls:C0231528 | Myalgia | 1 | BeFree |
| umls:C0234251 | Inflammatory pain | 1 | BeFree |
| umls:C0262385 | Autonomic nervous system imbalance | 1 | BeFree |
| umls:C0271650 | Impaired glucose tolerance | 1 | BeFree |
| umls:C0751211 | Hyperalgesia, Primary | 1 | BeFree |
|
Copyright 2016-Present - The University of Texas Health Science Center at Houston (UTHealth) Web File Viewing | How to Report, Fraud, Waste and Abuse | State of Texas | Statewide Search | Texas Homeland Security | Site Policies |