 |
| |
| |
| |
| |
| |
| |
|

| TissGeneSummary for A1BG |
 Gene summary Gene summary |
| Basic gene information | Gene symbol | A1BG |
| Gene name | alpha-1-B glycoprotein | |
| Synonyms | A1B|ABG|GAB|HYST2477 | |
| Cytomap | UCSC genome browser: 19q13.4 | |
| Type of gene | protein-coding | |
| RefGenes | NM_130786.3, | |
| Description | HEL-S-163pAalpha-1B-glycoproteinepididymis secretory sperm binding protein Li 163pA | |
| Modification date | 20141207 | |
| dbXrefs | MIM : 138670 | |
| HGNC : HGNC | ||
| Ensembl : ENSG00000121410 | ||
| HPRD : 00726 | ||
| Vega : OTTHUMG00000183507 | ||
| Protein | UniProt: go to UniProt's Cross Reference DB Table | |
| Expression | CleanEX: HS_A1BG | |
| BioGPS: 1 | ||
| Pathway | NCI Pathway Interaction Database: A1BG | |
| KEGG: A1BG | ||
| REACTOME: A1BG | ||
| Pathway Commons: A1BG | ||
| Context | iHOP: A1BG | |
| ligand binding site mutation search in PubMed: A1BG | ||
| UCL Cancer Institute: A1BG | ||
| Assigned class in TissGDB* | B | |
| Included tissue-specific gene expression resources | HPA,TiGER,GTEx | |
| Specific-tissues in normal samples (assigned by TissGDB using HPA, TiGER, and GTEx) | Liver | |
| Cancer types related to the specific-tissues in cancer samples (assigned by TissGDB using TCGA) | LIHC | |
| Reference showing the relevant tissue of A1BG | ||
| Description by TissGene annotations | ||
| * Class A consists of genes with literature evidence and is part of the cTissGenes. Class B consists of only cTissGenes without additional evidence. The remaining genes belong to Class C. |
| Gene ontology having evidence of Inferred from Direct Assay (IDA) from Entrez |
| GO ID | GO term | PubMed ID |
| Top |
| TissGeneExp for A1BG |
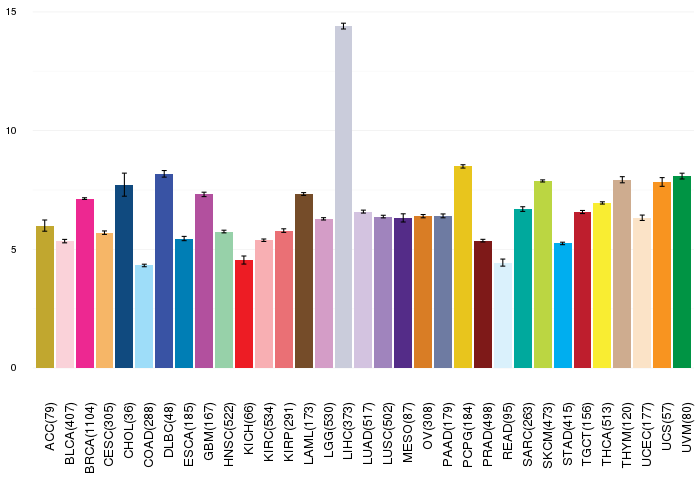
| Gene expressions across 28 cancer types (X-axis: cancer type and Y-axis: log2(norm_counts+1)) (TCGA IlluminaHiSeq_RNASeqV2, pan-cancer normalized log2(norm_counts+1) data, version 2016-08-16) |
 |
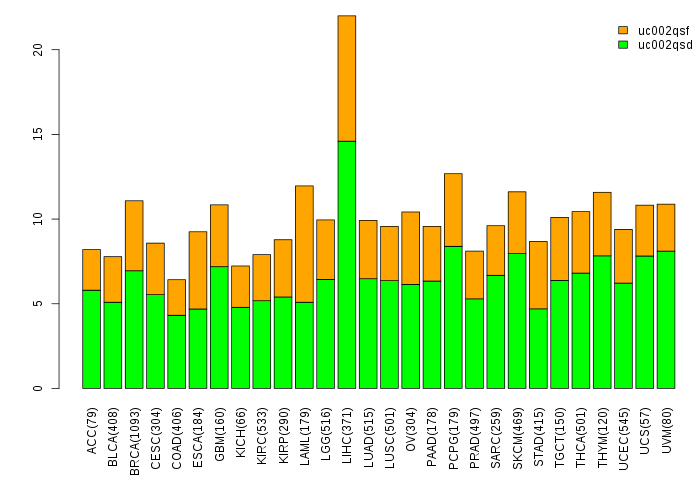
| Gene isoform expressions across 28 cancer types (X-axis: cancer type and Y-axis: log2(norm_counts+1)) (TCGA pan-cancer tcga_rsem_isoform_tpm, version 2016-09-01) |
 |
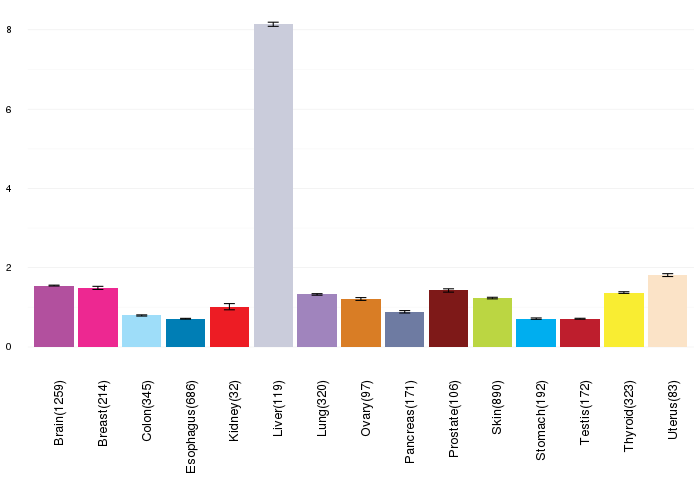
| Gene expressions across normal tissues of GTEx data (GTEx GTEx_Analysis_v6_RNA-seq_RNA-SeQCv1.1.8_gene_rpkm.gct) - Here, we shows the matched tissue types only among our 28 cancer types. |
 |
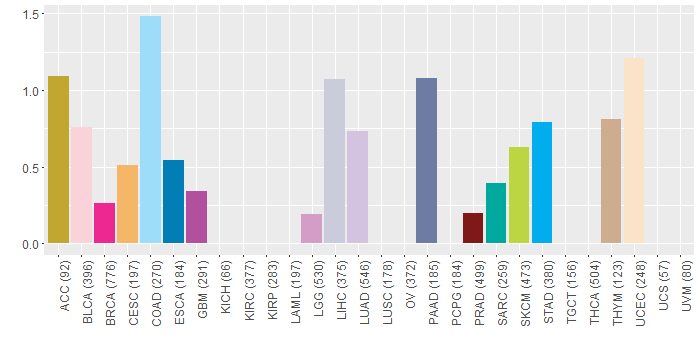
| Different expressions across 14 cancer types with more than 10 samples between matched tumors and normals (X-axis: cancer type and Y-axis: log2(norm_counts+1)) (TCGA IlluminaHiSeq_RNASeqV2, pan-cancer normalized log2(norm_counts+1) data, version 2016-08-16) |
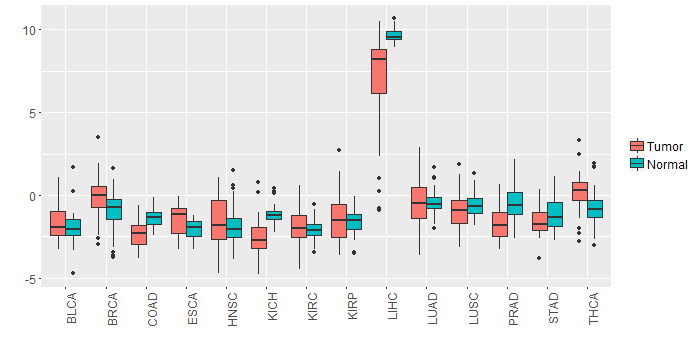 |
| - Significantly differentially expressed cancer types and information. (|Fold change|>1 and FDR<0.05) |
| Cancer type | Mean(exp) in tumor | Mean(exp) in matched normal | Log2FC | P-val. | FDR |
| PRAD | -1.664039893 | -0.428436047 | -1.235603846 | 7.76E-09 | 9.94E-08 |
| LIHC | 7.137020492 | 9.649960492 | -2.51294 | 7.18E-08 | 5.25E-07 |
| KICH | -2.547003508 | -1.113267508 | -1.433736 | 1.63E-05 | 4.91E-05 |
| Top |
| TissGene-miRNA for A1BG |
| Significantly anti-correlated miRNAs of TissGene across 28 cancer types (Gene-miRNA relations from TargetScanHuman Relsease 7.1, Conserved_Site_Context_Scores.txt.zip, 06.01.2016) (TCGA IlluminaHiSeq_miRNASeq, log2(RPM+1) data, version 2016-11-21) (TCGA IlluminaHiSeq_RNASeqV2, log2(normalized_count+1) data, version 2016-08-16) (Spearman’s Rank Correlation (p-value<0.05 and coefficient<-0.25)) |
| Cancer type | miRNA id | miRNA accession | P-val. | Coeff. | # samples |
| Top |
| TissGeneMut for A1BG |
| TissGeneSNV for A1BG |
| nsSNV counts per each loci. Different colors of circles represent different cancer types. Circle size denotes number of samples. (TCGA somatic mutation (SNPs and small INDELs) data, version 2016-04-25) * Click on the image to enlarge it in a new window. |
 |
 |
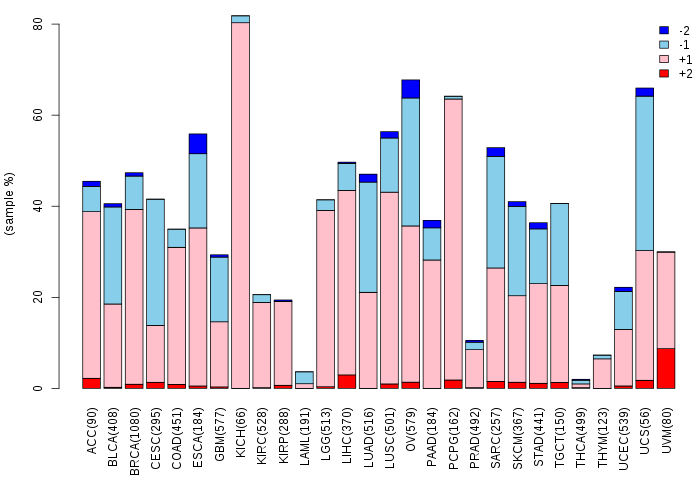
| Somatic nucleotide variants of TissGene across 28 cancer types (X-axis: cancer type and Y-axis: % of mutated samples) The numbers in parentheses are numbers of samples with mutation (nsSNVs). (TCGA somatic mutation (SNPs and small INDELs) data, version 2016-04-25) |
 |
| - nsSNVs sorted by frequency. |
| AAchange | Cancer type | # samples |
| p.A191T | COAD | 2 |
| p.K106* | HNSC | 1 |
| p.L31Q | LIHC | 1 |
| p.G225D | UCEC | 1 |
| p.C182Y | COAD | 1 |
| p.V138A | LIHC | 1 |
| p.R90C | BRCA | 1 |
| p.Q50* | HNSC | 1 |
| p.R94H | THYM | 1 |
| p.R254K | HNSC | 1 |
| p.P113T | SARC | 1 |
| p.H52Y | HNSC | 1 |
| p.R245C | PRAD | 1 |
| p.F264S | STAD | 1 |
| p.E437D | SKCM | 1 |
| p.F81L | LUAD | 1 |
| p.P69L | LGG | 1 |
| p.P296L | LIHC | 1 |
| p.A268V | UCEC | 1 |
| p.V6I | PAAD | 1 |
| p.G466D | GBM | 1 |
| p.G274R | HNSC | 1 |
| p.L31M | LUAD | 1 |
| p.G246R | BLCA | 1 |
| p.S37* | BLCA | 1 |
| p.R94H | ACC | 1 |
| p.R261C | PAAD | 1 |
| p.P162L | LUAD | 1 |
| p.S193F | LIHC | 1 |
| p.D260G | UCEC | 1 |
| p.E481K | STAD | 1 |
| p.D273N | STAD | 1 |
| p.D187N | SKCM | 1 |
| p.A295T | BRCA | 1 |
| p.F241L | HNSC | 1 |
| p.C182F | ESCA | 1 |
| p.R94H | CESC | 1 |
| p.E203Q | BLCA | 1 |
| p.V297I | SKCM | 1 |
| p.R185W | LUAD | 1 |
| p.R261C | COAD | 1 |
| Top |
| TissGeneCNV for A1BG |
| Copy number variations of TissGene across 28 cancer types (X-axis: cancer type and Y-axis: % of CNV samples) (TCGA Gistic2_CopyNumber_Gistic2_all_data_by_genes, Gistic2 copy number data, version 2016-08-16) |
 |
| Top |
| TissGeneFusions for A1BG |
| Fusion genes including TissGene (ChimerDB 3.0, 2016-12-01 and TCGA fusion Portal 2015-12-01) |
| Database | Src | Cancer type | Sample | Fusion gene | ORF | 5'-gene BP | 3'-gene BP |
| Chimerdb3.0 | ChiTaRs | NA | CB162062 | A1BG-A1BG | chr19:58863007 | chr19:58858971 |
| Top |
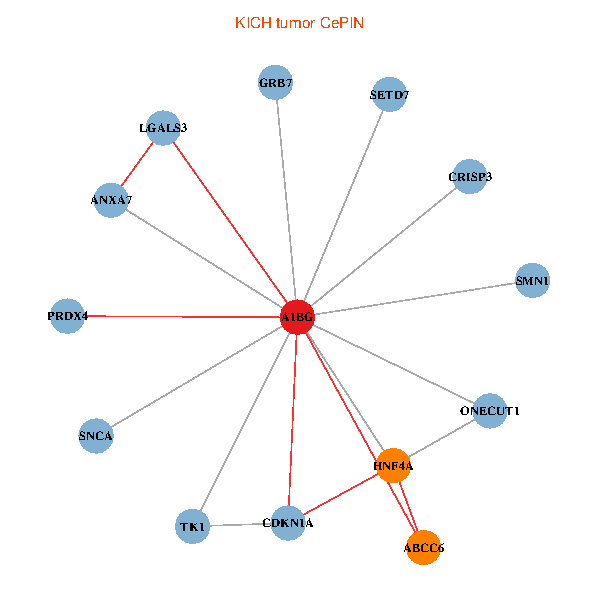
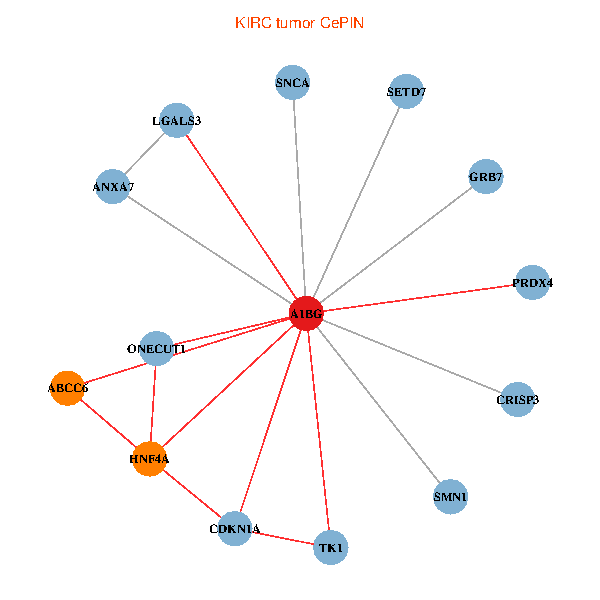
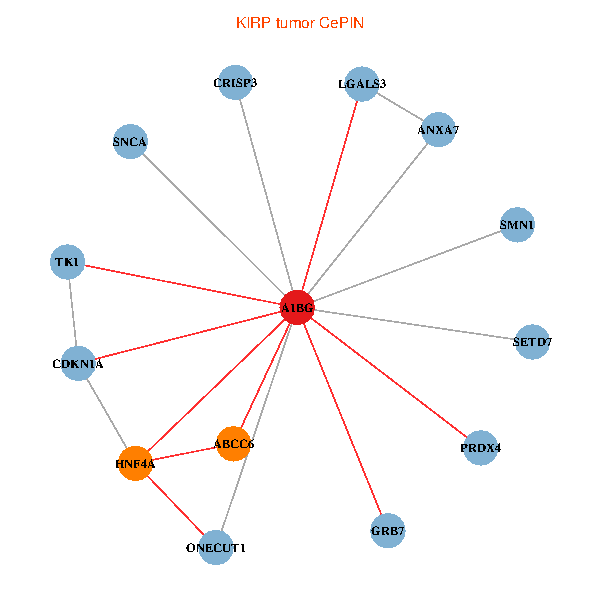
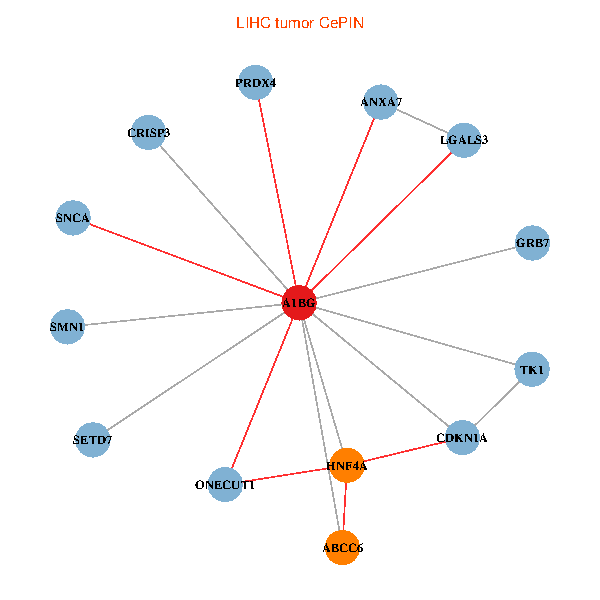
| TissGeneNet for A1BG |
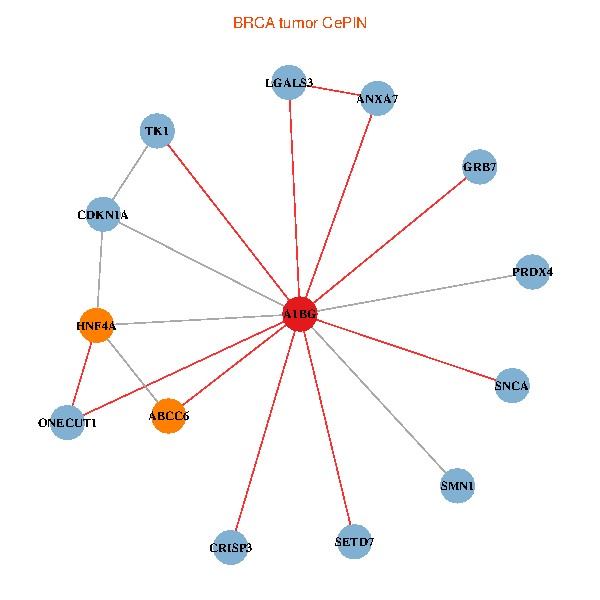
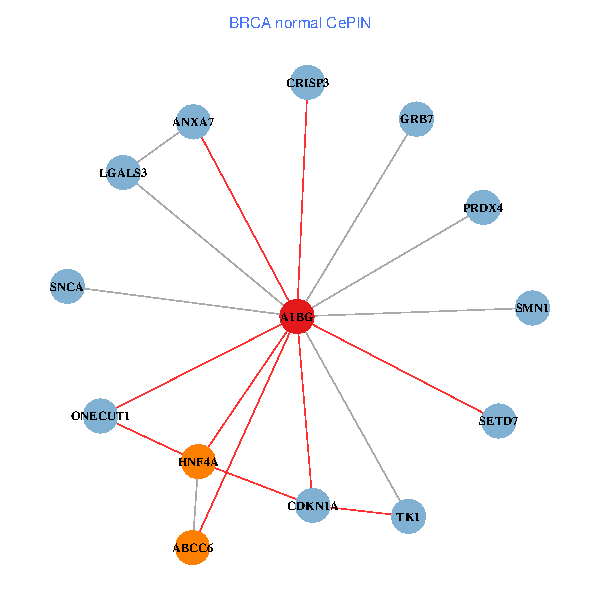
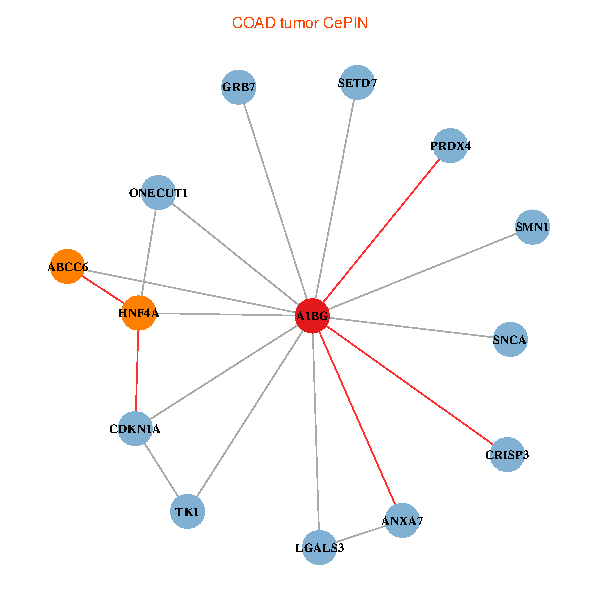
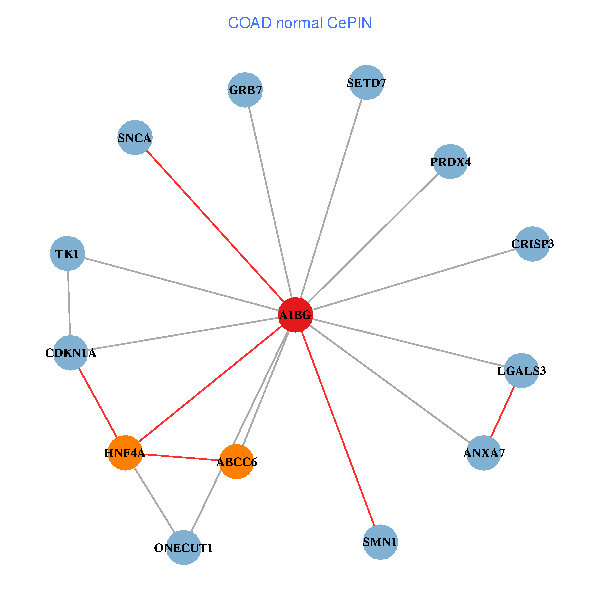
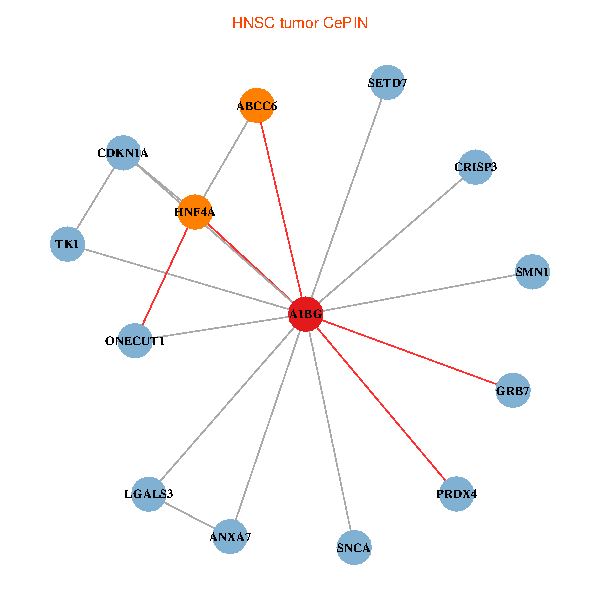
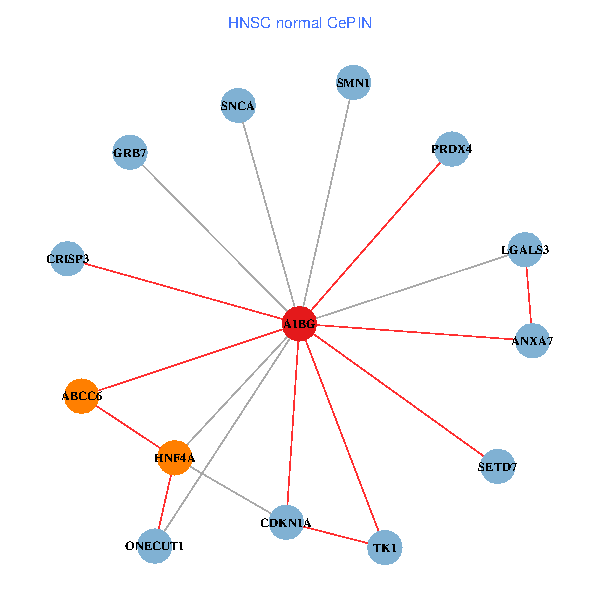
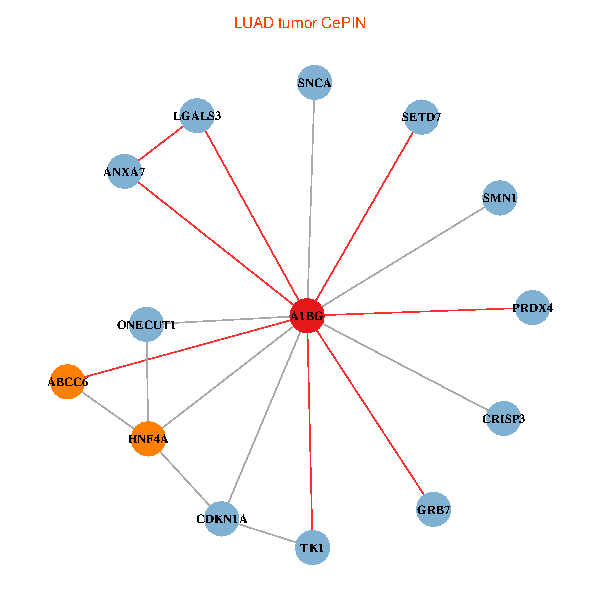
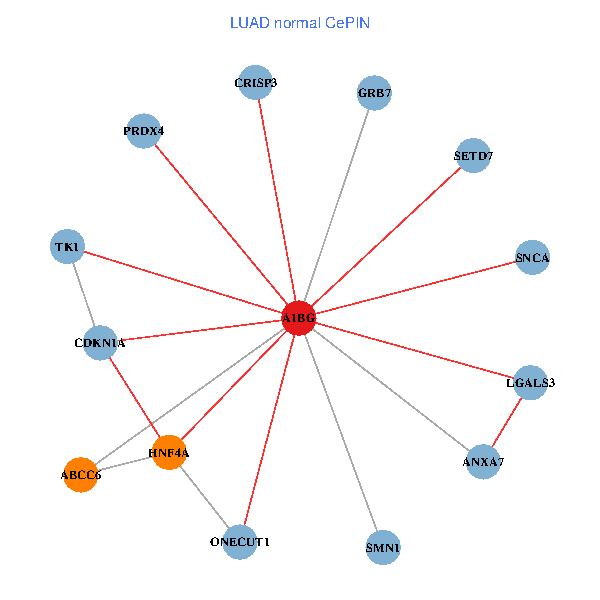
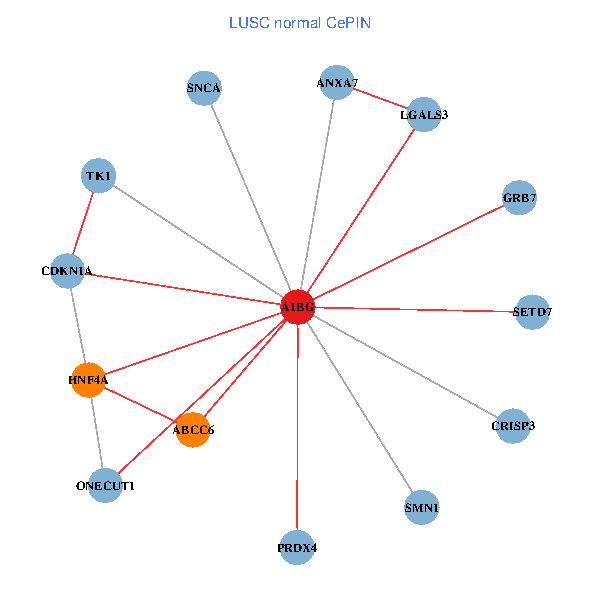
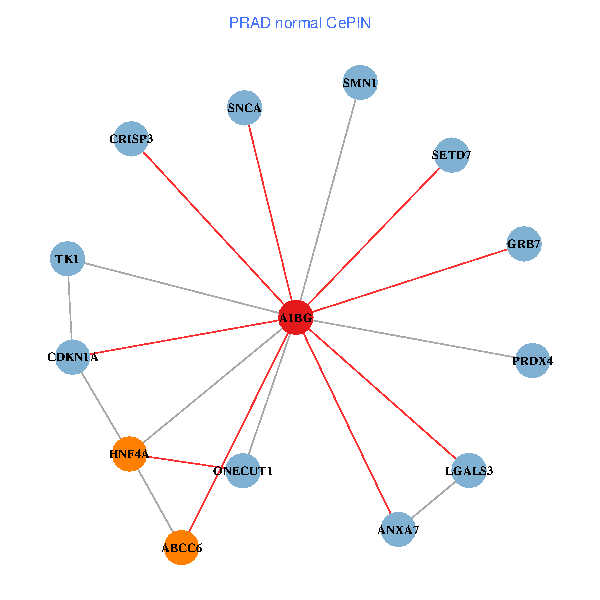
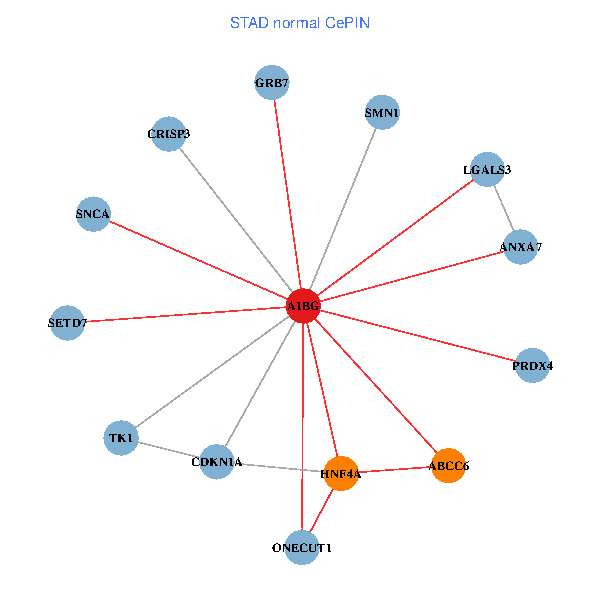
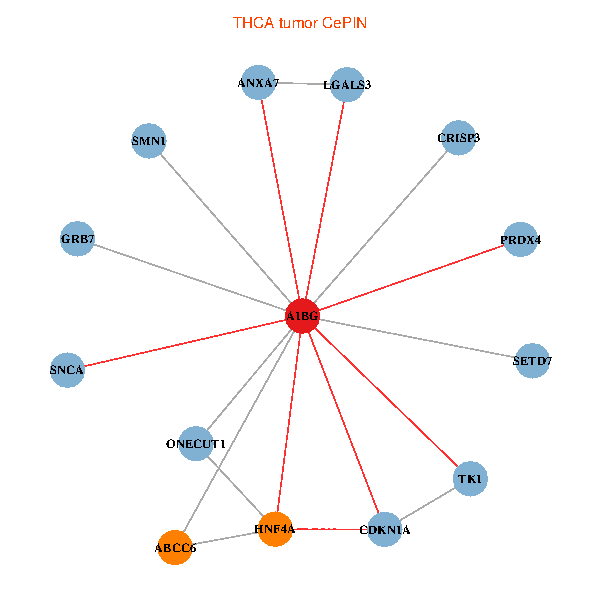
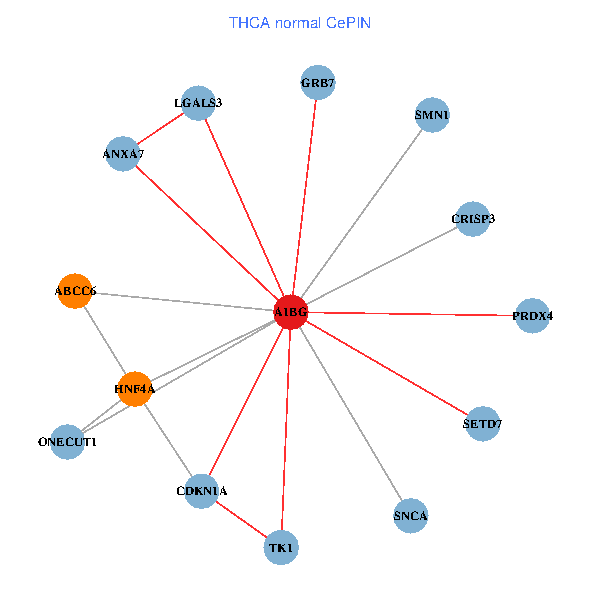
| Co-expressed gene networks based on protein-protein interaction data (CePIN) (TCGA IlluminaHiSeq_RNASeqV2, pan-cancer normalized log2(norm_counts+1) data, version 2016-08-16) (PINA2 ppi data) |
| BRCA (tumor) | BRCA (normal) |
| A1BG, HNF4A, ONECUT1, CDKN1A, SMN1, PRDX4, TK1, ANXA7, LGALS3, GRB7, SNCA, SETD7, ABCC6, CRISP3 (tumor) | A1BG, HNF4A, ONECUT1, CDKN1A, SMN1, PRDX4, TK1, ANXA7, LGALS3, GRB7, SNCA, SETD7, ABCC6, CRISP3 (normal) |
 |  |
| COAD (tumor) | COAD (normal) |
| A1BG, HNF4A, ONECUT1, CDKN1A, SMN1, PRDX4, TK1, ANXA7, LGALS3, GRB7, SNCA, SETD7, ABCC6, CRISP3 (tumor) | A1BG, HNF4A, ONECUT1, CDKN1A, SMN1, PRDX4, TK1, ANXA7, LGALS3, GRB7, SNCA, SETD7, ABCC6, CRISP3 (normal) |
 |  |
| HNSC (tumor) | HNSC (normal) |
| A1BG, HNF4A, ONECUT1, CDKN1A, SMN1, PRDX4, TK1, ANXA7, LGALS3, GRB7, SNCA, SETD7, ABCC6, CRISP3 (tumor) | A1BG, HNF4A, ONECUT1, CDKN1A, SMN1, PRDX4, TK1, ANXA7, LGALS3, GRB7, SNCA, SETD7, ABCC6, CRISP3 (normal) |
 |  |
| KICH (tumor) | KICH (normal) |
| A1BG, HNF4A, ONECUT1, CDKN1A, SMN1, PRDX4, TK1, ANXA7, LGALS3, GRB7, SNCA, SETD7, ABCC6, CRISP3 (tumor) | A1BG, HNF4A, ONECUT1, CDKN1A, SMN1, PRDX4, TK1, ANXA7, LGALS3, GRB7, SNCA, SETD7, ABCC6, CRISP3 (normal) |
 |  |
| KIRC (tumor) | KIRC (normal) |
| A1BG, HNF4A, ONECUT1, CDKN1A, SMN1, PRDX4, TK1, ANXA7, LGALS3, GRB7, SNCA, SETD7, ABCC6, CRISP3 (tumor) | A1BG, HNF4A, ONECUT1, CDKN1A, SMN1, PRDX4, TK1, ANXA7, LGALS3, GRB7, SNCA, SETD7, ABCC6, CRISP3 (normal) |
 |  |
| KIRP (tumor) | KIRP (normal) |
| A1BG, HNF4A, ONECUT1, CDKN1A, SMN1, PRDX4, TK1, ANXA7, LGALS3, GRB7, SNCA, SETD7, ABCC6, CRISP3 (tumor) | A1BG, HNF4A, ONECUT1, CDKN1A, SMN1, PRDX4, TK1, ANXA7, LGALS3, GRB7, SNCA, SETD7, ABCC6, CRISP3 (normal) |
 |  |
| LIHC (tumor) | LIHC (normal) |
| A1BG, HNF4A, ONECUT1, CDKN1A, SMN1, PRDX4, TK1, ANXA7, LGALS3, GRB7, SNCA, SETD7, ABCC6, CRISP3 (tumor) | A1BG, HNF4A, ONECUT1, CDKN1A, SMN1, PRDX4, TK1, ANXA7, LGALS3, GRB7, SNCA, SETD7, ABCC6, CRISP3 (normal) |
 |  |
| LUAD (tumor) | LUAD (normal) |
| A1BG, HNF4A, ONECUT1, CDKN1A, SMN1, PRDX4, TK1, ANXA7, LGALS3, GRB7, SNCA, SETD7, ABCC6, CRISP3 (tumor) | A1BG, HNF4A, ONECUT1, CDKN1A, SMN1, PRDX4, TK1, ANXA7, LGALS3, GRB7, SNCA, SETD7, ABCC6, CRISP3 (normal) |
 |  |
| LUSC (tumor) | LUSC (normal) |
| A1BG, HNF4A, ONECUT1, CDKN1A, SMN1, PRDX4, TK1, ANXA7, LGALS3, GRB7, SNCA, SETD7, ABCC6, CRISP3 (tumor) | A1BG, HNF4A, ONECUT1, CDKN1A, SMN1, PRDX4, TK1, ANXA7, LGALS3, GRB7, SNCA, SETD7, ABCC6, CRISP3 (normal) |
 |  |
| PRAD (tumor) | PRAD (normal) |
| A1BG, HNF4A, ONECUT1, CDKN1A, SMN1, PRDX4, TK1, ANXA7, LGALS3, GRB7, SNCA, SETD7, ABCC6, CRISP3 (tumor) | A1BG, HNF4A, ONECUT1, CDKN1A, SMN1, PRDX4, TK1, ANXA7, LGALS3, GRB7, SNCA, SETD7, ABCC6, CRISP3 (normal) |
 |  |
| STAD (tumor) | STAD (normal) |
| A1BG, HNF4A, ONECUT1, CDKN1A, SMN1, PRDX4, TK1, ANXA7, LGALS3, GRB7, SNCA, SETD7, ABCC6, CRISP3 (tumor) | A1BG, HNF4A, ONECUT1, CDKN1A, SMN1, PRDX4, TK1, ANXA7, LGALS3, GRB7, SNCA, SETD7, ABCC6, CRISP3 (normal) |
 |  |
| THCA (tumor) | THCA (normal) |
| A1BG, HNF4A, ONECUT1, CDKN1A, SMN1, PRDX4, TK1, ANXA7, LGALS3, GRB7, SNCA, SETD7, ABCC6, CRISP3 (tumor) | A1BG, HNF4A, ONECUT1, CDKN1A, SMN1, PRDX4, TK1, ANXA7, LGALS3, GRB7, SNCA, SETD7, ABCC6, CRISP3 (normal) |
 |  |
| Top |
| TissGeneProg for A1BG |
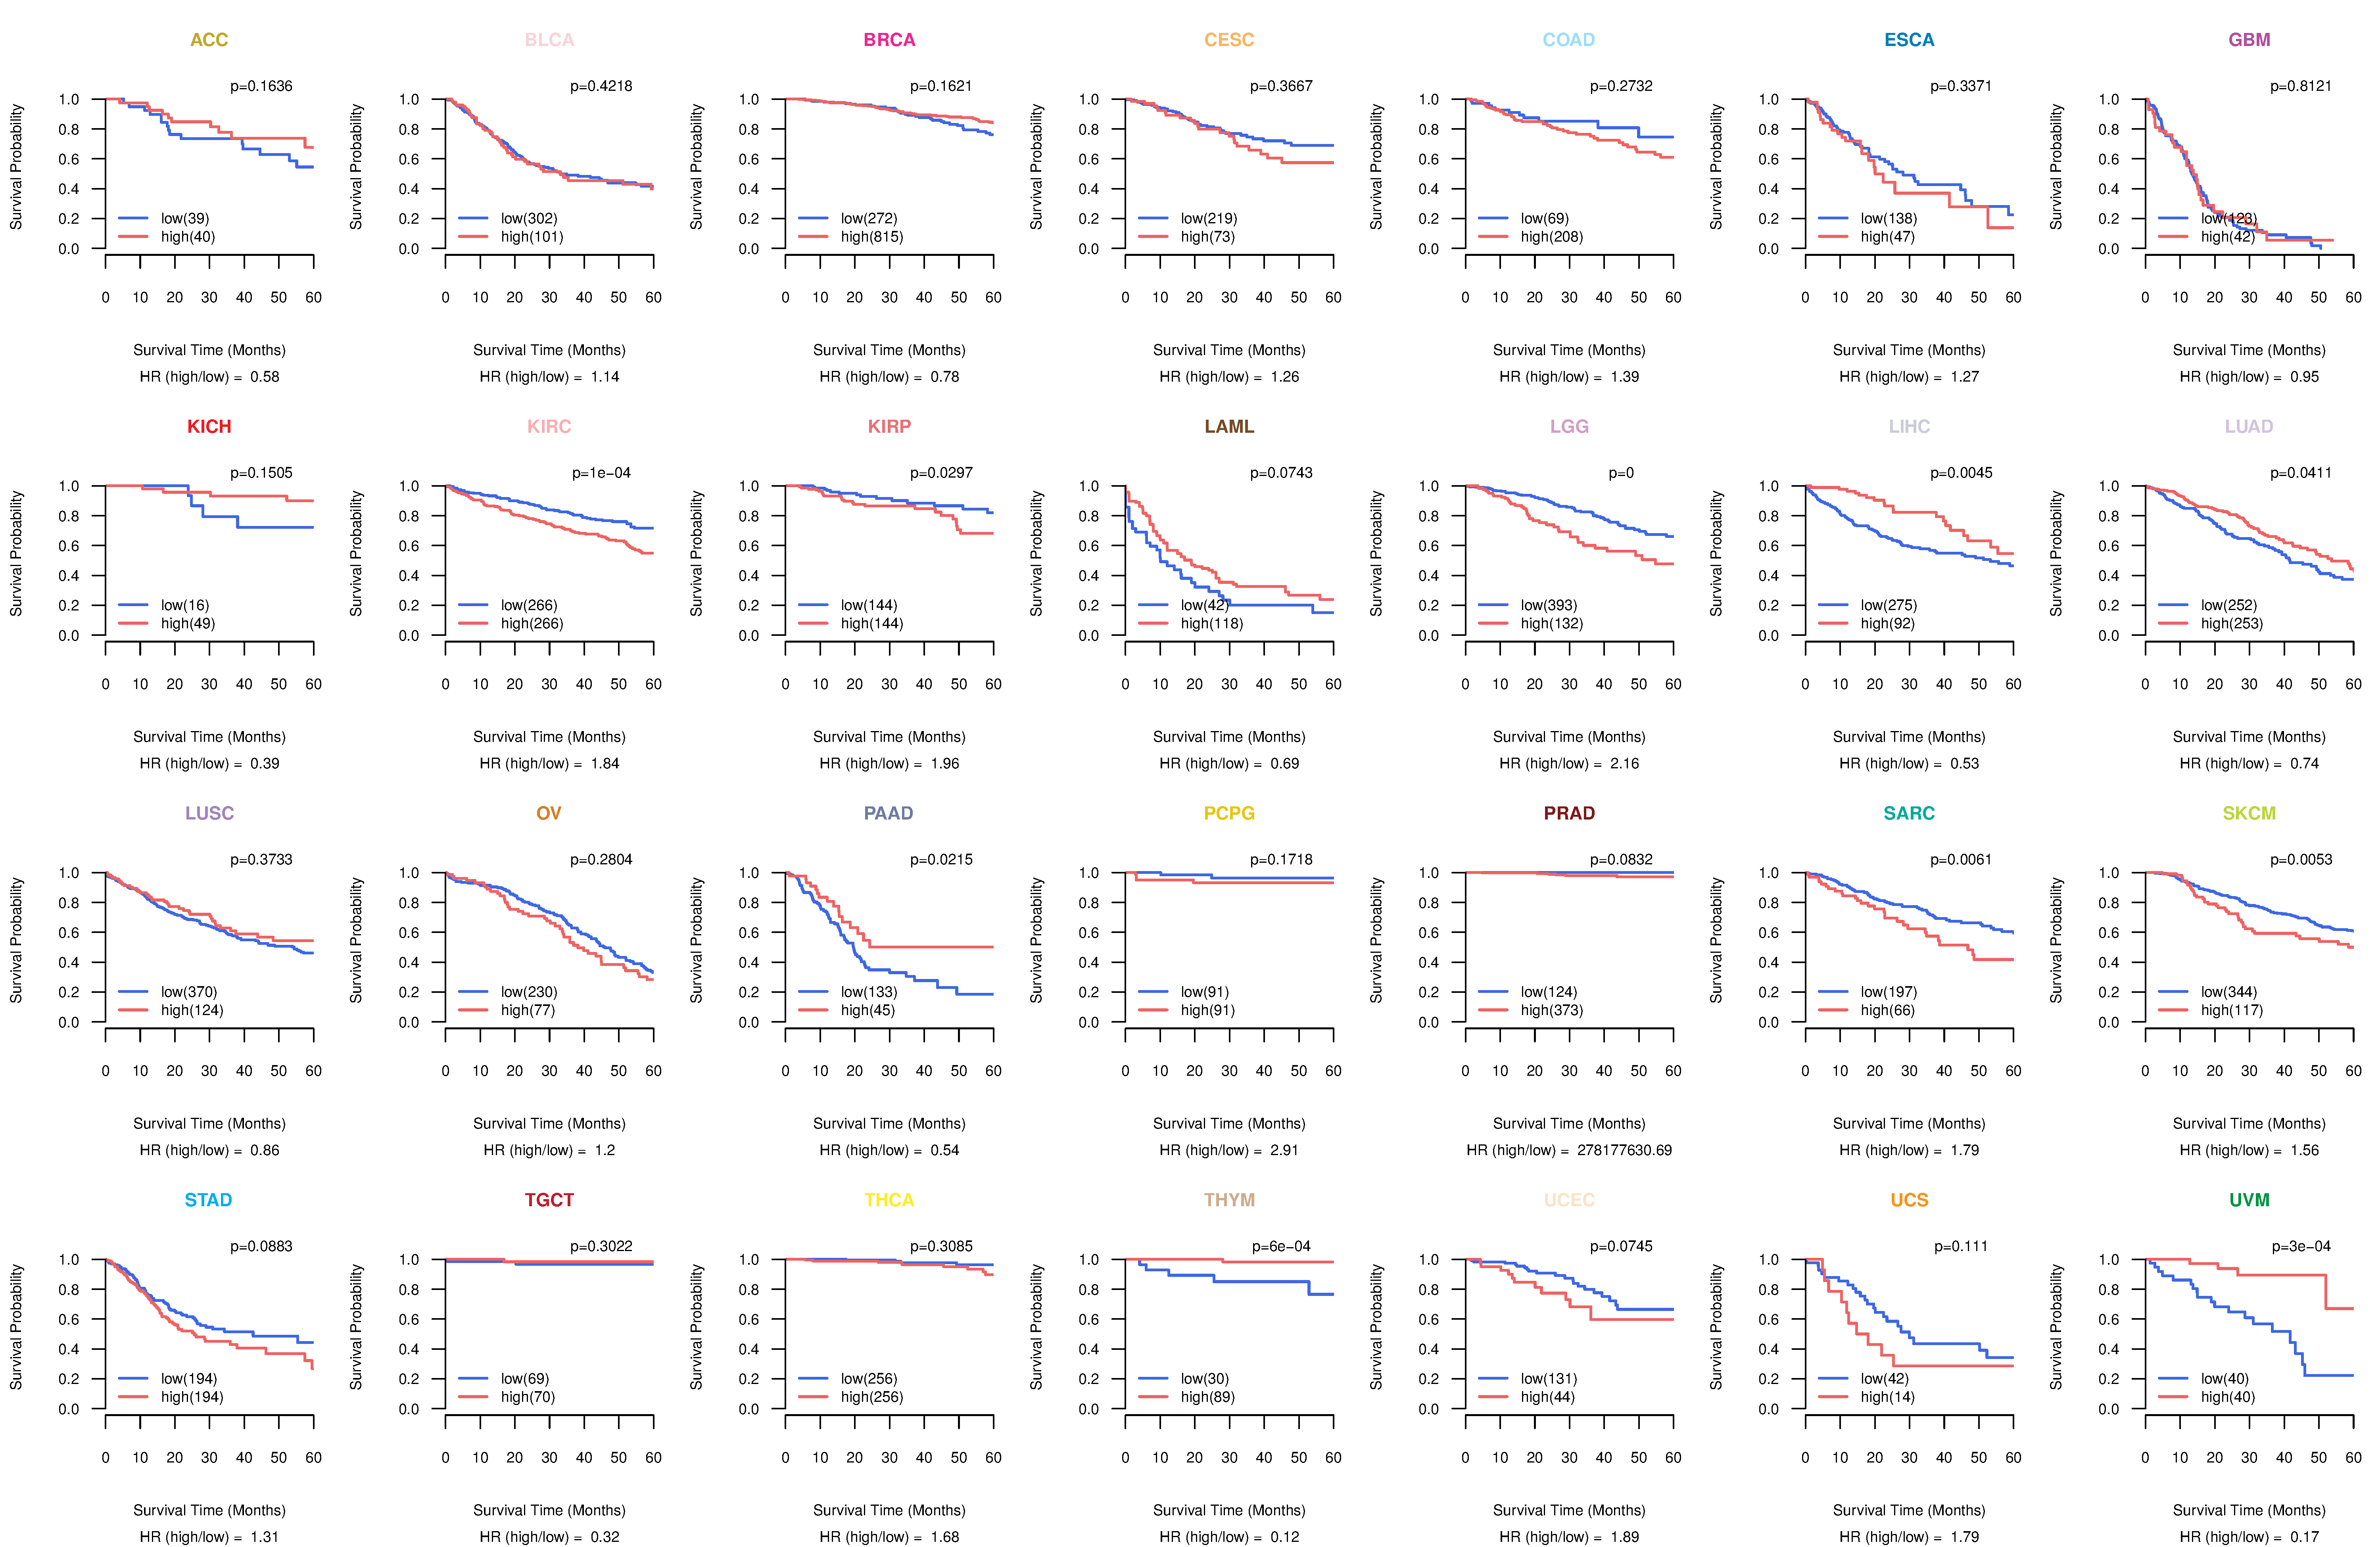
| Kaplan-Meier plots with logrank tests of overall survival (OS) using 28 cancer types (TCGA IlluminaHiSeq_RNASeqV2, pan-cancer normalized log2(norm_counts+1) data, version 2016-08-16) (TCGA clinicalMatrix, phenotype data, version 2016-04-27) * Click on the image to enlarge it in a new window. |
 |
| Kaplan-Meier plots with logrank test of relapse free survival (RFS) using 28 cancer types (TCGA IlluminaHiSeq_RNASeqV2, pan-cancer normalized log2(norm_counts+1) data, version 2016-08-16) (TCGA clinicalMatrix, phenotype data, version 2016-04-27) * Click on the image enlarge it in a new window. |
 |
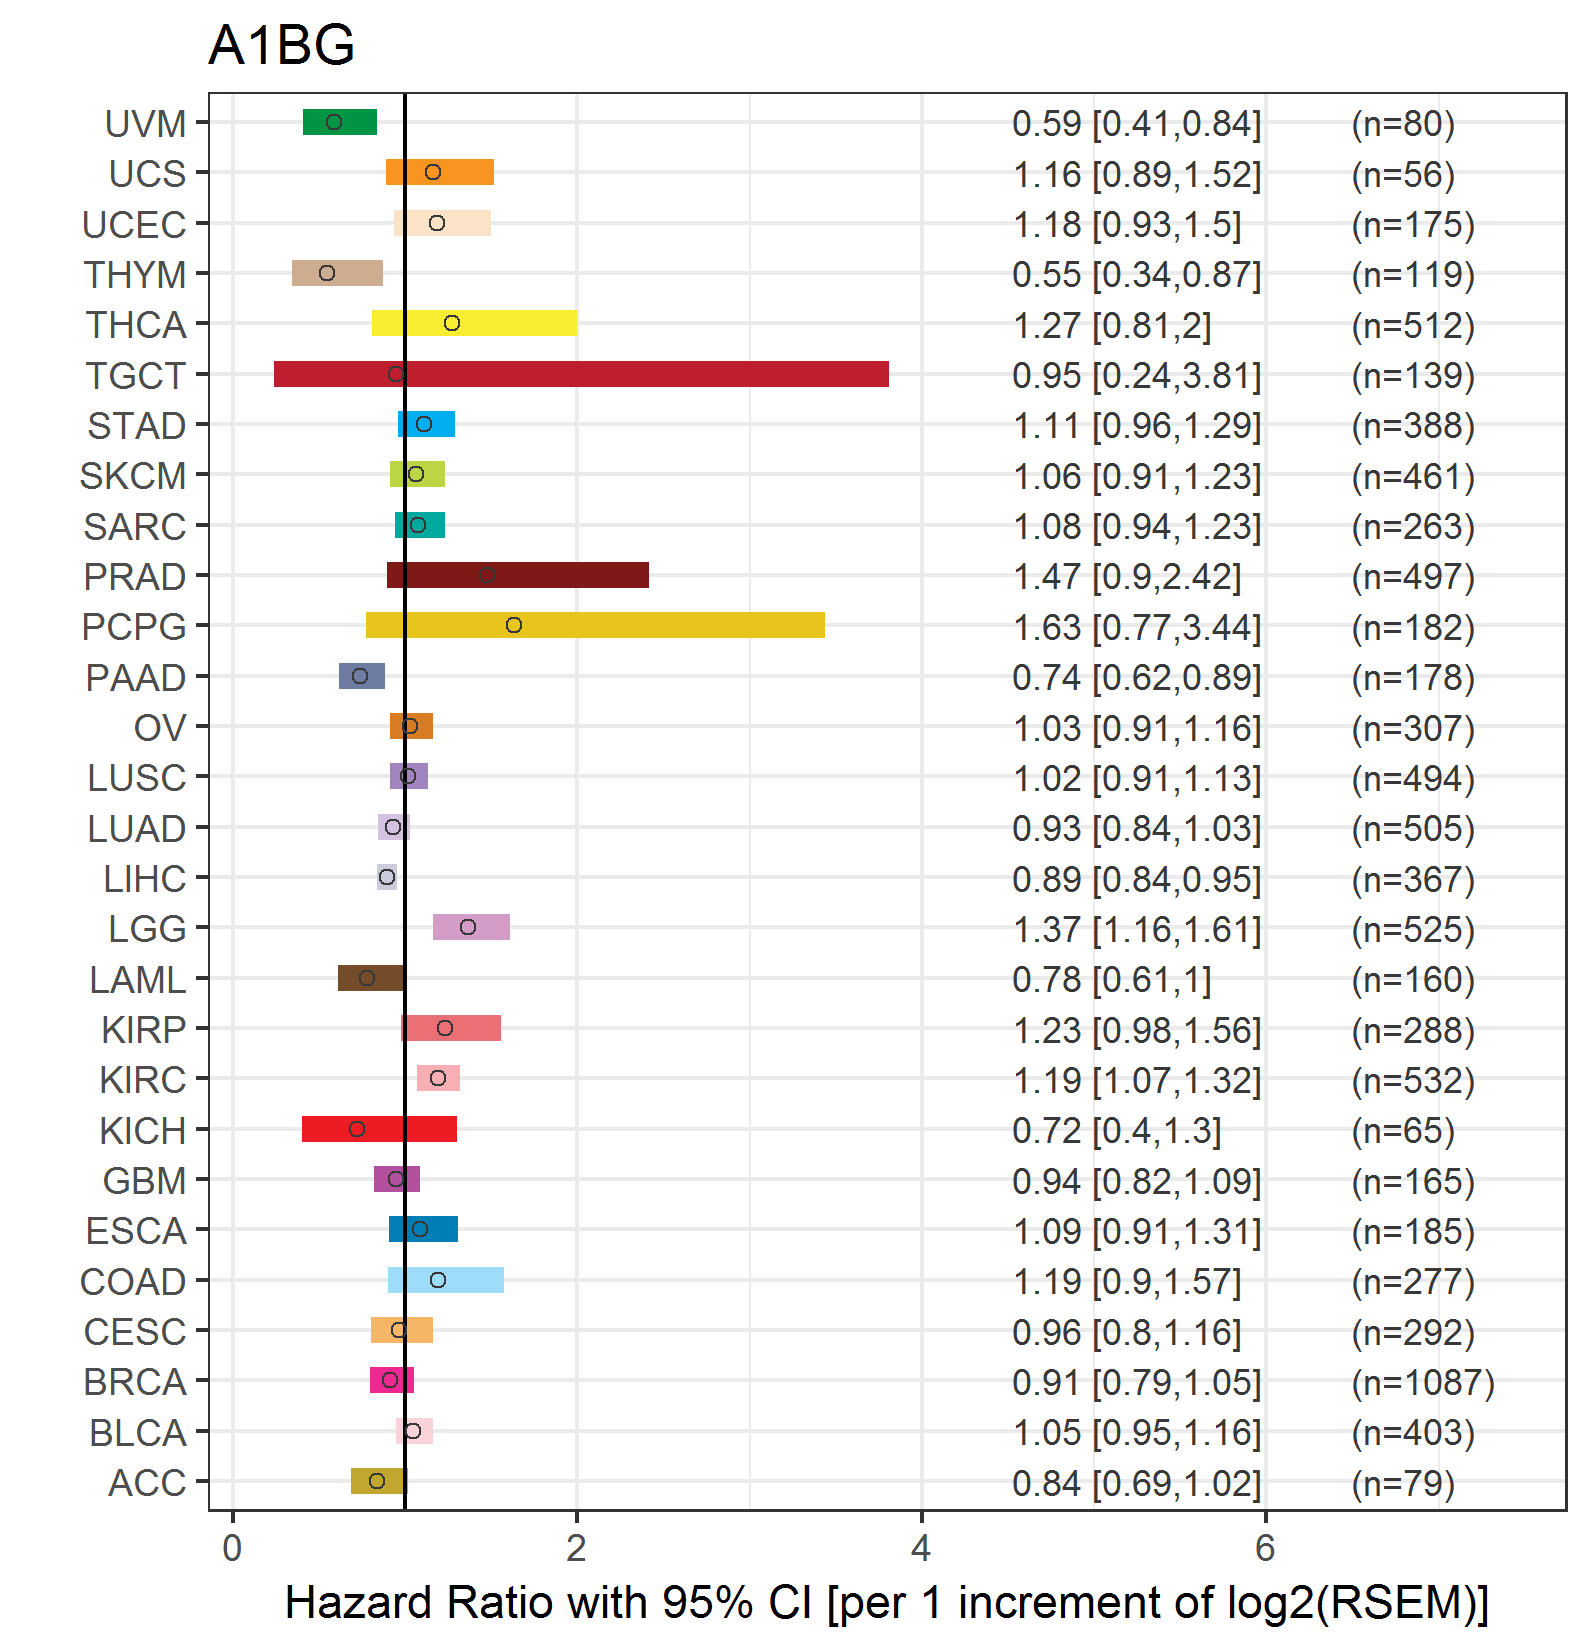
| Forest plot of Cox proportional hazard ratio (HR) and 95% CI of overall survival (OS) using 28 cancer types (TCGA IlluminaHiSeq_RNASeqV2, pan-cancer normalized log2(norm_counts+1) data, version 2016-08-16) (TCGA clinicalMatrix, phenotype data, version 2016-04-27) * Click on the image enlarge it in a new window. |
 |
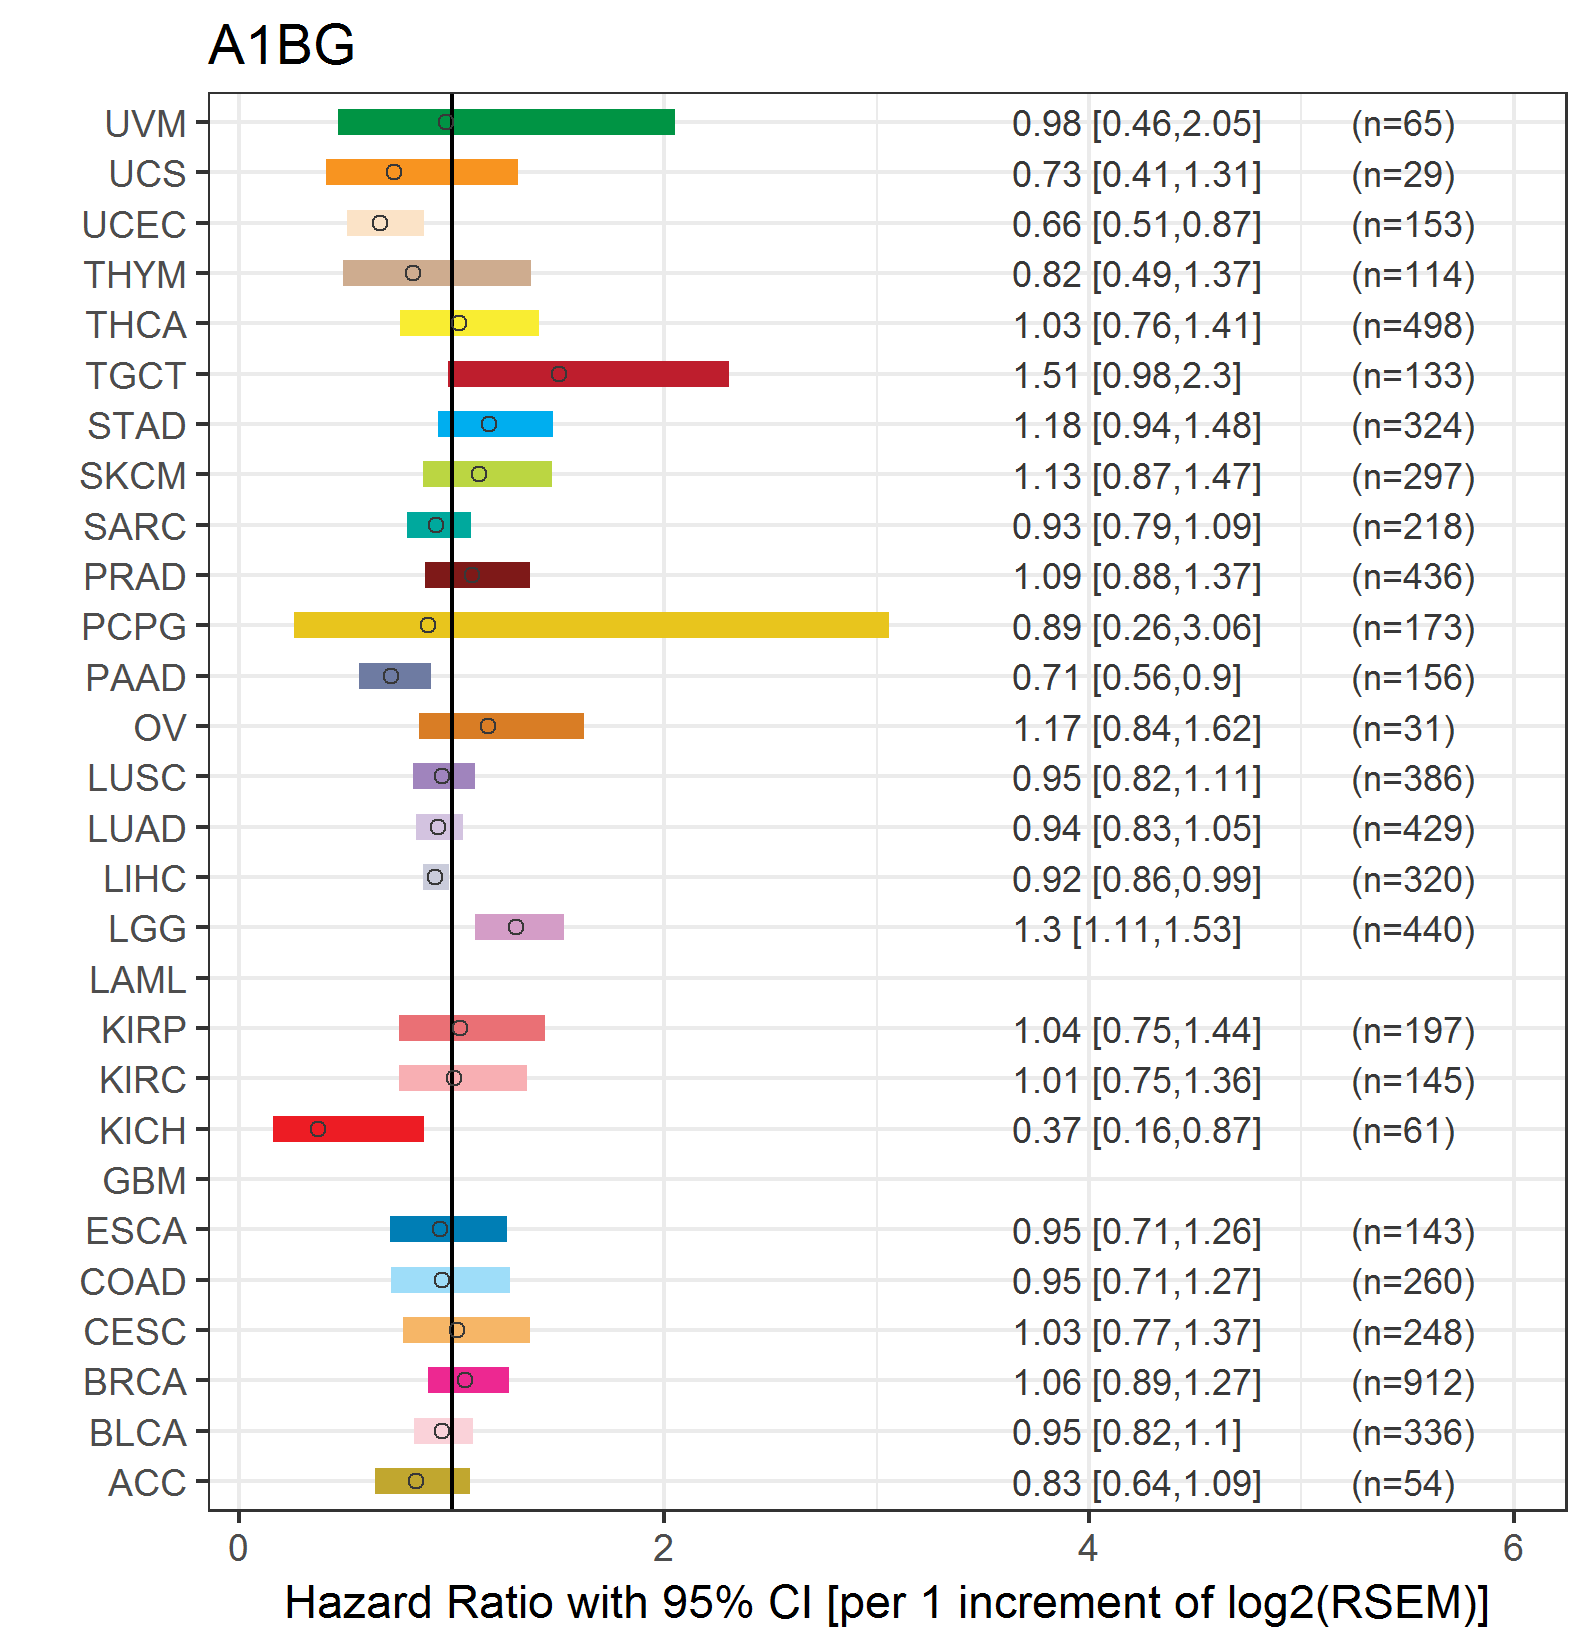
| Forest plot of Cox proportional hazard ratio (HR) and 95% CI of relapse free survival (RFS) using 28 cancer types (TCGA IlluminaHiSeq_RNASeqV2, pan-cancer normalized log2(norm_counts+1) data, version 2016-08-16) (TCGA clinicalMatrix, phenotype data, version 2016-04-27) * Click on the image enlarge it in a new window. |
 |
| Top |
| TissGeneClin for A1BG |
| TissGeneDrug for A1BG |
| Drug information targeting TissGene (DrugBank Version 5.0.6, 2017-04-01) |
| DrugBank ID | Drug name | Drug activity | Drug type | Drug status |
| Top |
| TissGeneDisease for A1BG |
| Disease information associated with TissGene (DisGeNet, 2016-06-01) |
| Disease ID | Disease name | # pubmeds | Source |
| umls:C0001418 | Adenocarcinoma | 1 | LHGDN |
| umls:C0002736 | Amyotrophic Lateral Sclerosis | 1 | BeFree |
| umls:C0007222 | Cardiovascular Diseases | 1 | BeFree |
| umls:C0013080 | Down Syndrome | 1 | BeFree |
| umls:C0015230 | Exanthema | 1 | BeFree |
| umls:C0017636 | Glioblastoma | 1 | BeFree |
| umls:C0019693 | HIV Infections | 1 | BeFree |
| umls:C0848332 | Spots on skin | 1 | BeFree |
|
Copyright 2016-Present - The University of Texas Health Science Center at Houston (UTHealth) Web File Viewing | How to Report, Fraud, Waste and Abuse | State of Texas | Statewide Search | Texas Homeland Security | Site Policies |