 |
| |
| |
| |
| |
| |
| |
|

| TissGeneSummary for ITGB6 |
 Gene summary Gene summary |
| Basic gene information | Gene symbol | ITGB6 |
| Gene name | ||
| Synonyms | ||
| Cytomap | UCSC genome browser: | |
| Type of gene | ||
| RefGenes | ||
| Description | ||
| Modification date | ||
| dbXrefs | ||
| Protein | UniProt: go to UniProt's Cross Reference DB Table | |
| Expression | CleanEX: HS_ITGB6 | |
| BioGPS: 100505984 | ||
| Pathway | NCI Pathway Interaction Database: ITGB6 | |
| KEGG: ITGB6 | ||
| REACTOME: ITGB6 | ||
| Pathway Commons: ITGB6 | ||
| Context | iHOP: ITGB6 | |
| ligand binding site mutation search in PubMed: ITGB6 | ||
| UCL Cancer Institute: ITGB6 | ||
| Assigned class in TissGDB* | C | |
| Included tissue-specific gene expression resources | TiGER,GTEx | |
| Specific-tissues in normal samples (assigned by TissGDB using HPA, TiGER, and GTEx) | KidneyPancreas | |
| Cancer types related to the specific-tissues in cancer samples (assigned by TissGDB using TCGA) | KIRC,KIRP,KICHPAAD | |
| Reference showing the relevant tissue of ITGB6 | ||
| Description by TissGene annotations | Risk TissGene in OS Protective TissGene in OS Risk TissGene in RFS Protective TissGene in RFS Fused withOncogene Fused withTSGene | |
| * Class A consists of genes with literature evidence and is part of the cTissGenes. Class B consists of only cTissGenes without additional evidence. The remaining genes belong to Class C. |
| Gene ontology having evidence of Inferred from Direct Assay (IDA) from Entrez |
| GO ID | GO term | PubMed ID |
| Top |
| TissGeneExp for ITGB6 |
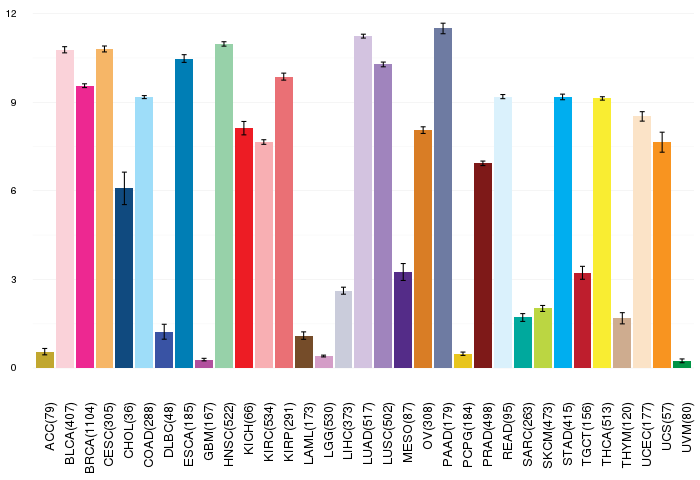
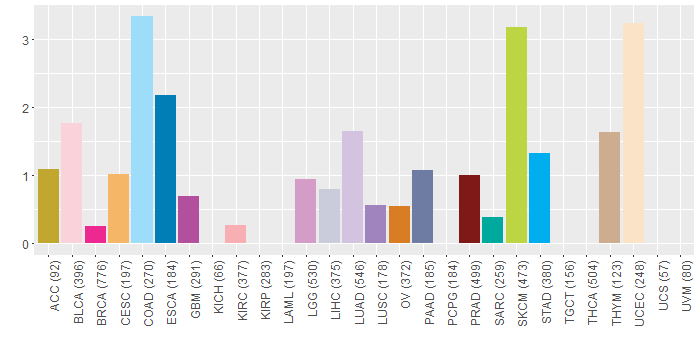
| Gene expressions across 28 cancer types (X-axis: cancer type and Y-axis: log2(norm_counts+1)) (TCGA IlluminaHiSeq_RNASeqV2, pan-cancer normalized log2(norm_counts+1) data, version 2016-08-16) |
 |
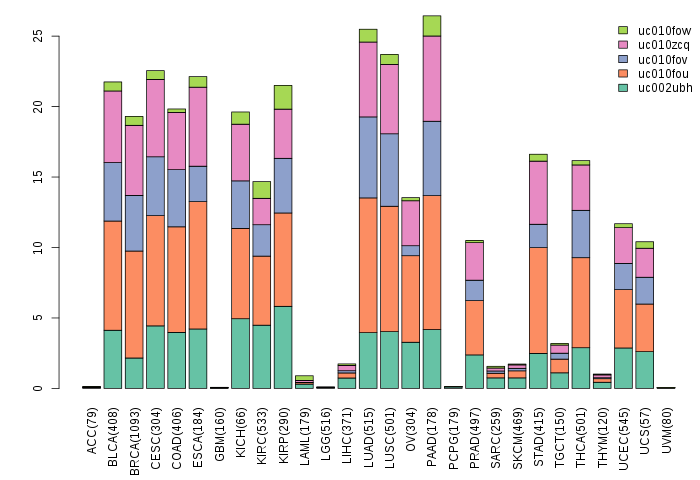
| Gene isoform expressions across 28 cancer types (X-axis: cancer type and Y-axis: log2(norm_counts+1)) (TCGA pan-cancer tcga_rsem_isoform_tpm, version 2016-09-01) |
 |
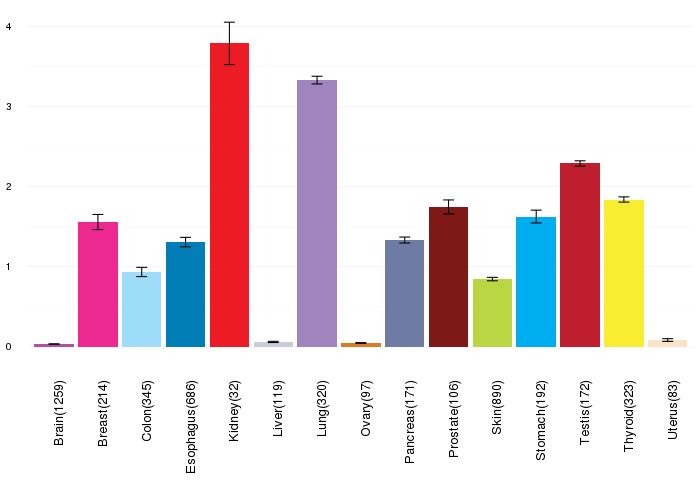
| Gene expressions across normal tissues of GTEx data (GTEx GTEx_Analysis_v6_RNA-seq_RNA-SeQCv1.1.8_gene_rpkm.gct) - Here, we shows the matched tissue types only among our 28 cancer types. |
 |
| Different expressions across 14 cancer types with more than 10 samples between matched tumors and normals (X-axis: cancer type and Y-axis: log2(norm_counts+1)) (TCGA IlluminaHiSeq_RNASeqV2, pan-cancer normalized log2(norm_counts+1) data, version 2016-08-16) |
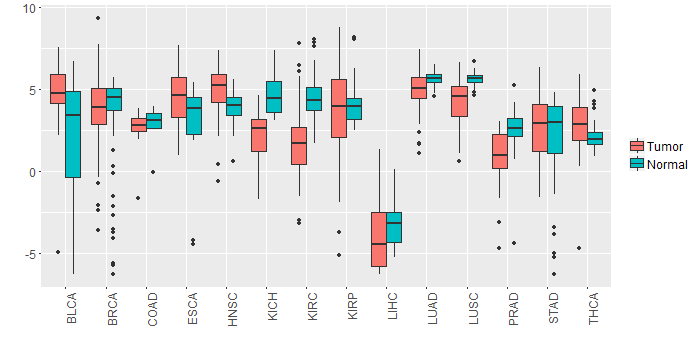 |
| - Significantly differentially expressed cancer types and information. (|Fold change|>1 and FDR<0.05) |
| Cancer type | Mean(exp) in tumor | Mean(exp) in matched normal | Log2FC | P-val. | FDR |
| LUSC | 4.037045929 | 5.60574985 | -1.568703922 | 9.82E-10 | 3.36E-09 |
| KICH | 2.053092752 | 4.666760752 | -2.613668 | 3.23E-08 | 1.60E-07 |
| PRAD | 0.936485521 | 2.519693214 | -1.583207692 | 1.58E-07 | 1.41E-06 |
| KIRC | 1.620993641 | 4.50180753 | -2.880813889 | 1.97E-18 | 1.34E-17 |
| Top |
| TissGene-miRNA for ITGB6 |
| Significantly anti-correlated miRNAs of TissGene across 28 cancer types (Gene-miRNA relations from TargetScanHuman Relsease 7.1, Conserved_Site_Context_Scores.txt.zip, 06.01.2016) (TCGA IlluminaHiSeq_miRNASeq, log2(RPM+1) data, version 2016-11-21) (TCGA IlluminaHiSeq_RNASeqV2, log2(normalized_count+1) data, version 2016-08-16) (Spearman’s Rank Correlation (p-value<0.05 and coefficient<-0.25)) |
| Cancer type | miRNA id | miRNA accession | P-val. | Coeff. | # samples |
| Top |
| TissGeneMut for ITGB6 |
| TissGeneSNV for ITGB6 |
| nsSNV counts per each loci. Different colors of circles represent different cancer types. Circle size denotes number of samples. (TCGA somatic mutation (SNPs and small INDELs) data, version 2016-04-25) * Click on the image to enlarge it in a new window. |
 |
 |
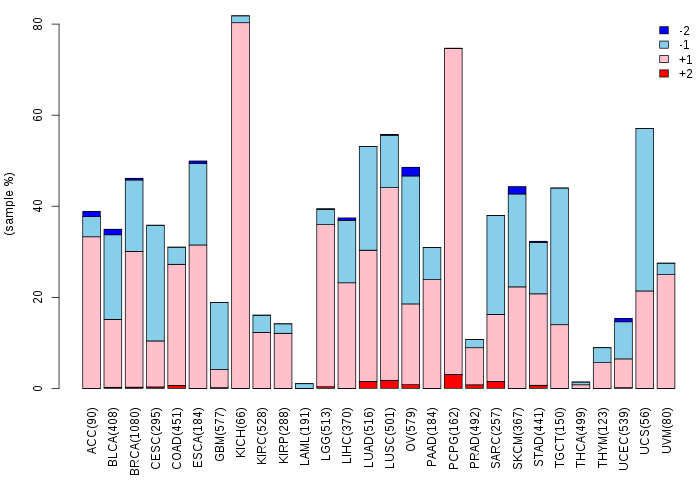
| Somatic nucleotide variants of TissGene across 28 cancer types (X-axis: cancer type and Y-axis: % of mutated samples) The numbers in parentheses are numbers of samples with mutation (nsSNVs). (TCGA somatic mutation (SNPs and small INDELs) data, version 2016-04-25) |
 |
| - nsSNVs sorted by frequency. |
| AAchange | Cancer type | # samples |
| p.R739C | SKCM | 2 |
| p.R749Q | SKCM | 2 |
| p.H336Y | SKCM | 2 |
| p.H402N | THYM | 1 |
| p.R739S | THYM | 1 |
| p.V419M | PRAD | 1 |
| p.N195K | ESCA | 1 |
| p.E376Q | KIRC | 1 |
| p.D148N | BLCA | 1 |
| p.S53C | LUAD | 1 |
| p.I327M | BLCA | 1 |
| p.C604Y | PRAD | 1 |
| p.V545M | STAD | 1 |
| p.R222I | CHOL | 1 |
| p.G385E | SKCM | 1 |
| p.A392T | ACC | 1 |
| p.D296N | UCEC | 1 |
| p.G358R | LGG | 1 |
| p.A105V | COAD | 1 |
| p.R259Q | STAD | 1 |
| p.D738G | LGG | 1 |
| p.R594H | COAD | 1 |
| p.Q314R | LUAD | 1 |
| p.E677* | UCEC | 1 |
| p.E586K | LUAD | 1 |
| p.T50I | HNSC | 1 |
| p.Q95H | STAD | 1 |
| p.G723R | UCEC | 1 |
| p.T605P | SKCM | 1 |
| p.V725I | PAAD | 1 |
| p.D271N | SKCM | 1 |
| p.S297I | PAAD | 1 |
| p.A637V | BRCA | 1 |
| p.R739H | PRAD | 1 |
| p.G22S | LIHC | 1 |
| p.E374K | BLCA | 1 |
| p.S144F | SKCM | 1 |
| p.G26R | SKCM | 1 |
| p.G175R | MESO | 1 |
| p.G477W | PRAD | 1 |
| p.H51Y | LUSC | 1 |
| p.C649Y | BLCA | 1 |
| p.C702F | LUAD | 1 |
| p.Y762C | COAD | 1 |
| p.L65F | LIHC | 1 |
| p.R126H | LIHC | 1 |
| p.A249V | PRAD | 1 |
| p.K404N | BRCA | 1 |
| p.H402Q | OV | 1 |
| p.C7* | LUAD | 1 |
| p.L353F | LGG | 1 |
| p.L497M | LGG | 1 |
| p.G723R | CESC | 1 |
| p.P703S | LUAD | 1 |
| p.I523V | OV | 1 |
| p.H51Y | BLCA | 1 |
| p.E240K | COAD | 1 |
| p.S510F | SKCM | 1 |
| p.L497P | COAD | 1 |
| p.E57K | READ | 1 |
| p.E4K | LUAD | 1 |
| p.G2R | SKCM | 1 |
| p.L90H | COAD | 1 |
| p.R777K | SKCM | 1 |
| p.S274C | LUAD | 1 |
| p.S765F | BLCA | 1 |
| p.D442N | SKCM | 1 |
| p.Q107* | HNSC | 1 |
| p.C197Y | COAD | 1 |
| p.S585P | UCEC | 1 |
| p.C517* | ESCA | 1 |
| p.V324M | GBM | 1 |
| p.I200V | ESCA | 1 |
| p.L172P | STAD | 1 |
| p.S373C | BLCA | 1 |
| p.S274C | CESC | 1 |
| p.I232M | UCEC | 1 |
| p.S80F | SKCM | 1 |
| p.G385R | SKCM | 1 |
| p.C252F | LUAD | 1 |
| p.A143T | STAD | 1 |
| p.L307F | COAD | 1 |
| p.R749Q | BLCA | 1 |
| p.E240K | LGG | 1 |
| p.C59Y | LGG | 1 |
| p.E459X | COAD | 1 |
| p.C394Y | HNSC | 1 |
| p.K691N | READ | 1 |
| p.P39L | ESCA | 1 |
| p.S274F | HNSC | 1 |
| p.L85I | UCEC | 1 |
| p.M712T | GBM | 1 |
| p.Q640E | SARC | 1 |
| p.E748Q | LUAD | 1 |
| p.R642Q | LGG | 1 |
| p.R222I | UCEC | 1 |
| p.I729S | UCEC | 1 |
| Top |
| TissGeneCNV for ITGB6 |
| Copy number variations of TissGene across 28 cancer types (X-axis: cancer type and Y-axis: % of CNV samples) (TCGA Gistic2_CopyNumber_Gistic2_all_data_by_genes, Gistic2 copy number data, version 2016-08-16) |
 |
| Top |
| TissGeneFusions for ITGB6 |
| Fusion genes including TissGene (ChimerDB 3.0, 2016-12-01 and TCGA fusion Portal 2015-12-01) |
| Database | Src | Cancer type | Sample | Fusion gene | ORF | 5'-gene BP | 3'-gene BP |
| Chimerdb3.0 | FusionScan | ESCA | TCGA-L5-A8NE-01A | BAZ2B-ITGB6 | 5'UTR-CDS | chr2:160472752 | chr2:161030650 |
| Chimerdb3.0 | TopHat-Fusion | BRCA | TCGA-C8-A26W-01A | ITGB6-BAZ2B | CDS-5'UTR | chr2:160964189 | chr2:160335231 |
| Chimerdb3.0 | TopHat-Fusion | BRCA | TCGA-D8-A1XK-01A | ITGB6-RBMS1 | In-Frame | chr2:161030484 | chr2:161159997 |
| TCGAfusionPortal | PRADA | BLCA | TCGA-BT-A20W-01A | ITGB6-RBMS1 | In-frame | Chr2:161051880 | Chr2:161174738 |
| TCGAfusionPortal | PRADA | BLCA | TCGA-DK-A2I6-01A | ITGB6-RBMS1 | In-frame | Chr2:160964190 | Chr2:161141555 |
| TCGAfusionPortal | PRADA | BRCA | TCGA-D8-A1XK-01A | ITGB6-RBMS1 | In-frame | Chr2:161030485 | Chr2:161159998 |
| TCGAfusionPortal | PRADA | BRCA | TCGA-E2-A14Z-01A | STK39-ITGB6 | In-frame | Chr2:168921829 | Chr2:160994710 |
| TCGAfusionPortal | PRADA | HNSC | TCGA-CR-7370-01A | PLA2R1-ITGB6 | In-frame | Chr2:160832579 | Chr2:160998582 |
| Top |
| TissGeneNet for ITGB6 |
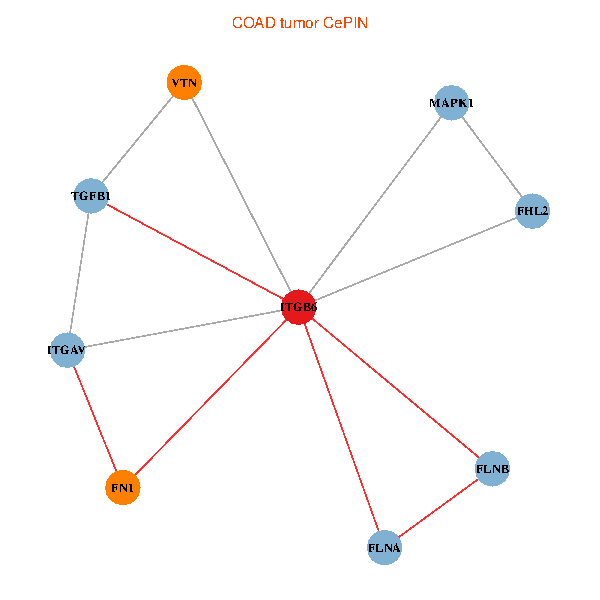
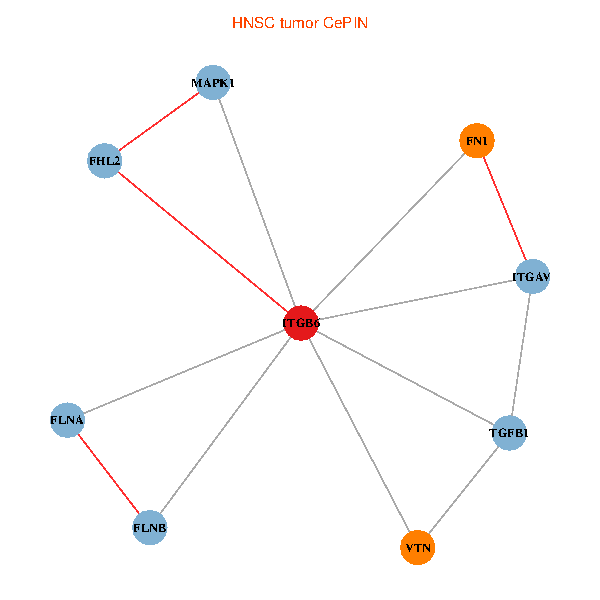
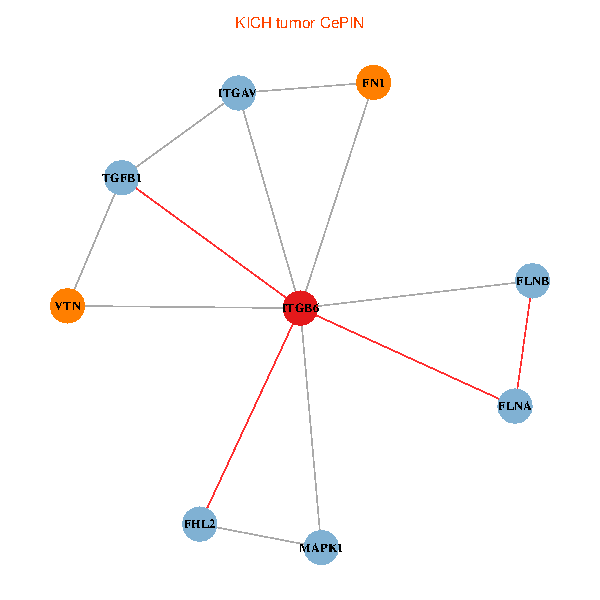
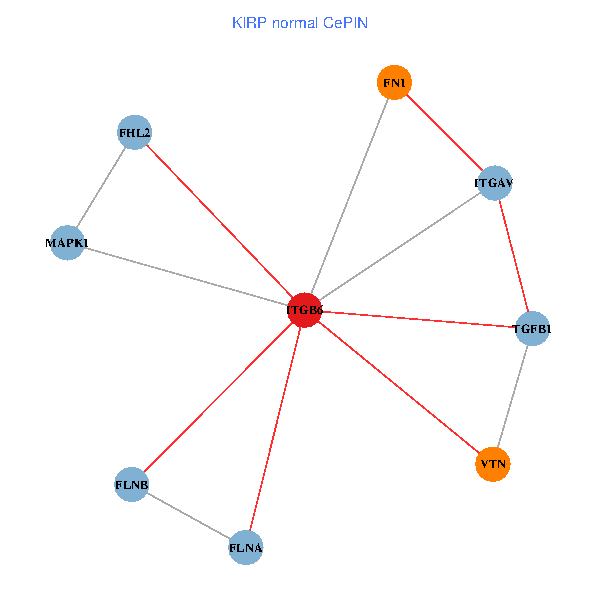
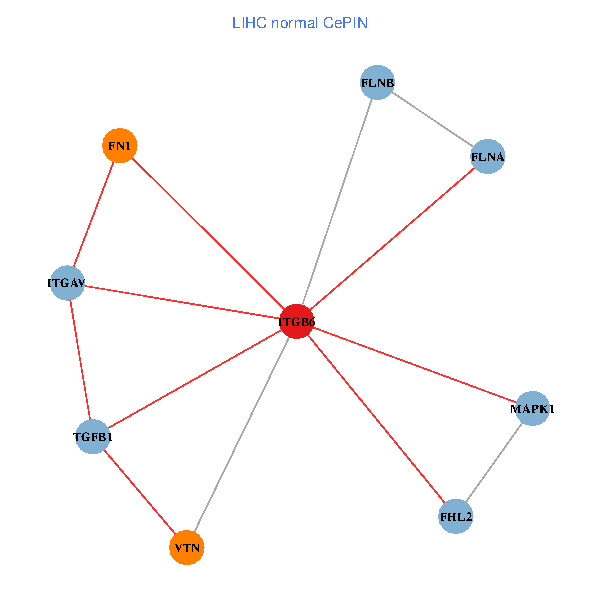
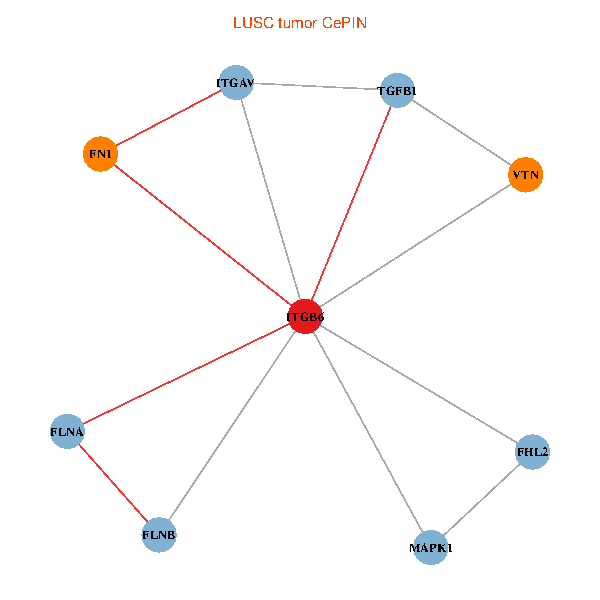
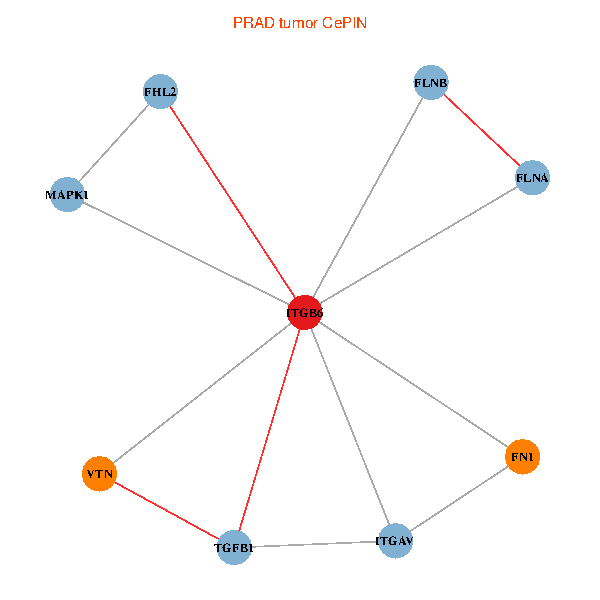
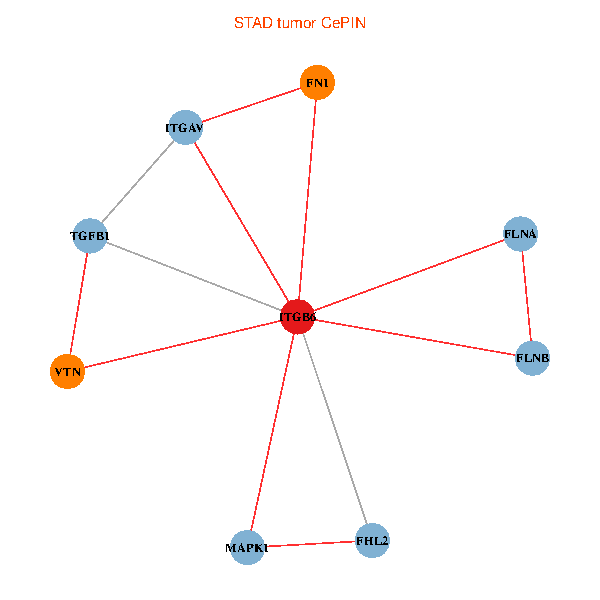
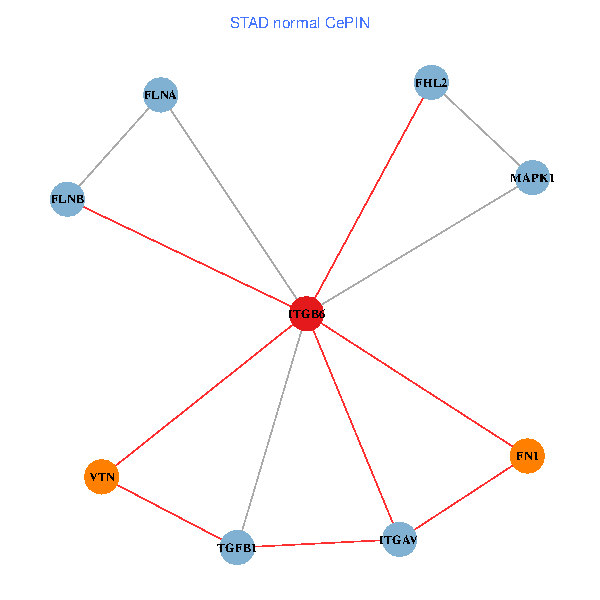
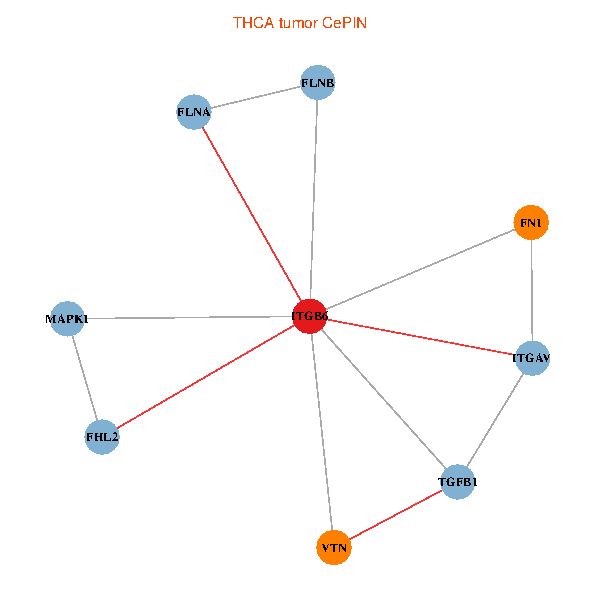
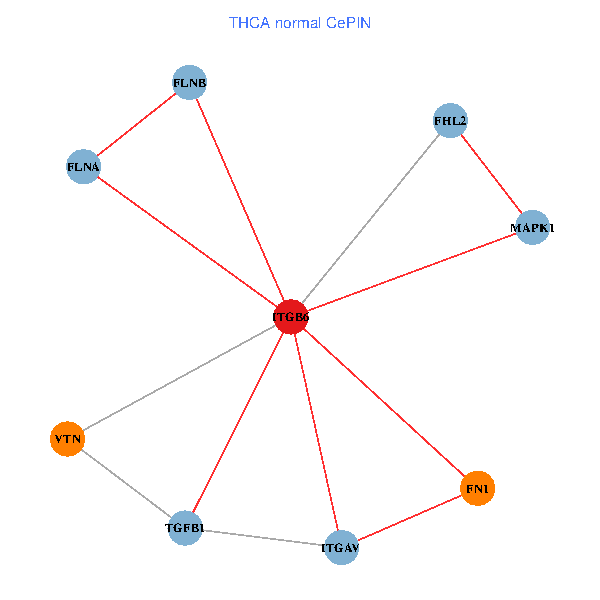
| Co-expressed gene networks based on protein-protein interaction data (CePIN) (TCGA IlluminaHiSeq_RNASeqV2, pan-cancer normalized log2(norm_counts+1) data, version 2016-08-16) (PINA2 ppi data) |
| BRCA (tumor) | BRCA (normal) |
| ITGB6, FLNB, MAPK1, FN1, FLNA, ITGAV, TGFB1, FHL2, VTN (tumor) | ITGB6, FLNB, MAPK1, FN1, FLNA, ITGAV, TGFB1, FHL2, VTN (normal) |
 |  |
| COAD (tumor) | COAD (normal) |
| ITGB6, FLNB, MAPK1, FN1, FLNA, ITGAV, TGFB1, FHL2, VTN (tumor) | ITGB6, FLNB, MAPK1, FN1, FLNA, ITGAV, TGFB1, FHL2, VTN (normal) |
 |  |
| HNSC (tumor) | HNSC (normal) |
| ITGB6, FLNB, MAPK1, FN1, FLNA, ITGAV, TGFB1, FHL2, VTN (tumor) | ITGB6, FLNB, MAPK1, FN1, FLNA, ITGAV, TGFB1, FHL2, VTN (normal) |
 |  |
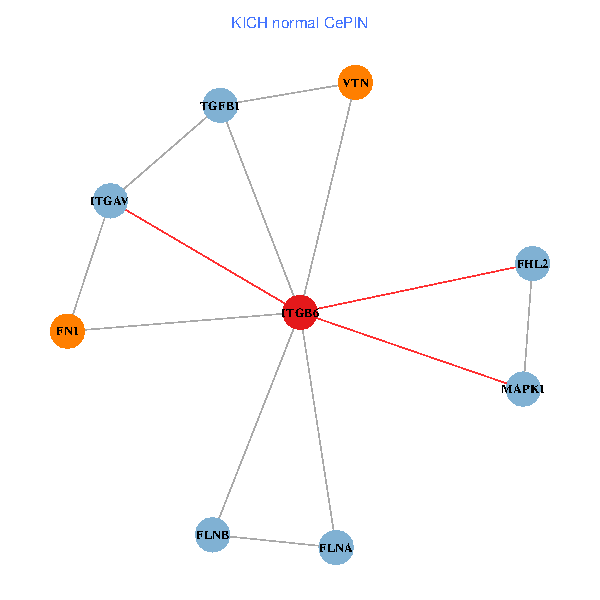
| KICH (tumor) | KICH (normal) |
| ITGB6, FLNB, MAPK1, FN1, FLNA, ITGAV, TGFB1, FHL2, VTN (tumor) | ITGB6, FLNB, MAPK1, FN1, FLNA, ITGAV, TGFB1, FHL2, VTN (normal) |
 |  |
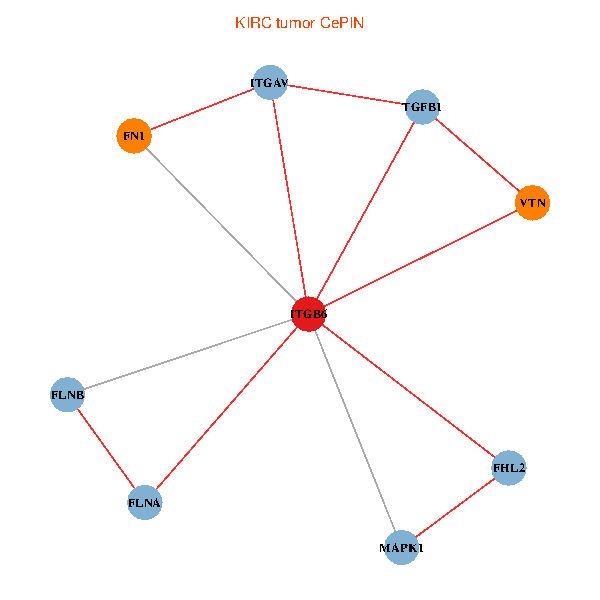
| KIRC (tumor) | KIRC (normal) |
| ITGB6, FLNB, MAPK1, FN1, FLNA, ITGAV, TGFB1, FHL2, VTN (tumor) | ITGB6, FLNB, MAPK1, FN1, FLNA, ITGAV, TGFB1, FHL2, VTN (normal) |
 |  |
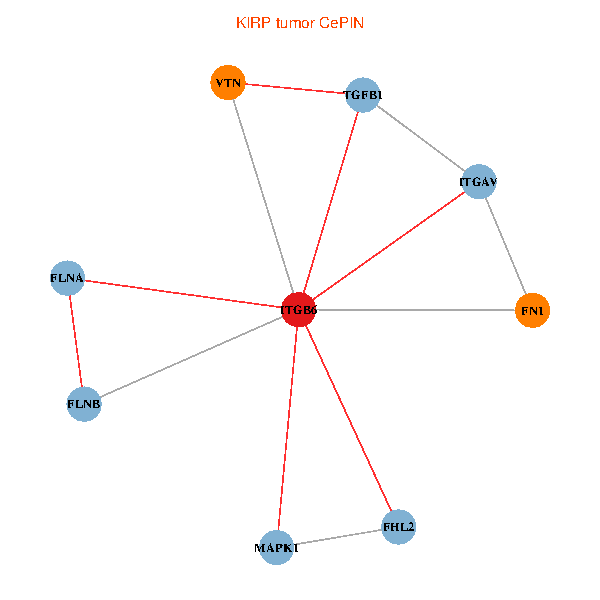
| KIRP (tumor) | KIRP (normal) |
| ITGB6, FLNB, MAPK1, FN1, FLNA, ITGAV, TGFB1, FHL2, VTN (tumor) | ITGB6, FLNB, MAPK1, FN1, FLNA, ITGAV, TGFB1, FHL2, VTN (normal) |
 |  |
| LIHC (tumor) | LIHC (normal) |
| ITGB6, FLNB, MAPK1, FN1, FLNA, ITGAV, TGFB1, FHL2, VTN (tumor) | ITGB6, FLNB, MAPK1, FN1, FLNA, ITGAV, TGFB1, FHL2, VTN (normal) |
 |  |
| LUAD (tumor) | LUAD (normal) |
| ITGB6, FLNB, MAPK1, FN1, FLNA, ITGAV, TGFB1, FHL2, VTN (tumor) | ITGB6, FLNB, MAPK1, FN1, FLNA, ITGAV, TGFB1, FHL2, VTN (normal) |
 |  |
| LUSC (tumor) | LUSC (normal) |
| ITGB6, FLNB, MAPK1, FN1, FLNA, ITGAV, TGFB1, FHL2, VTN (tumor) | ITGB6, FLNB, MAPK1, FN1, FLNA, ITGAV, TGFB1, FHL2, VTN (normal) |
 |  |
| PRAD (tumor) | PRAD (normal) |
| ITGB6, FLNB, MAPK1, FN1, FLNA, ITGAV, TGFB1, FHL2, VTN (tumor) | ITGB6, FLNB, MAPK1, FN1, FLNA, ITGAV, TGFB1, FHL2, VTN (normal) |
 |  |
| STAD (tumor) | STAD (normal) |
| ITGB6, FLNB, MAPK1, FN1, FLNA, ITGAV, TGFB1, FHL2, VTN (tumor) | ITGB6, FLNB, MAPK1, FN1, FLNA, ITGAV, TGFB1, FHL2, VTN (normal) |
 |  |
| THCA (tumor) | THCA (normal) |
| ITGB6, FLNB, MAPK1, FN1, FLNA, ITGAV, TGFB1, FHL2, VTN (tumor) | ITGB6, FLNB, MAPK1, FN1, FLNA, ITGAV, TGFB1, FHL2, VTN (normal) |
 |  |
| Top |
| TissGeneProg for ITGB6 |
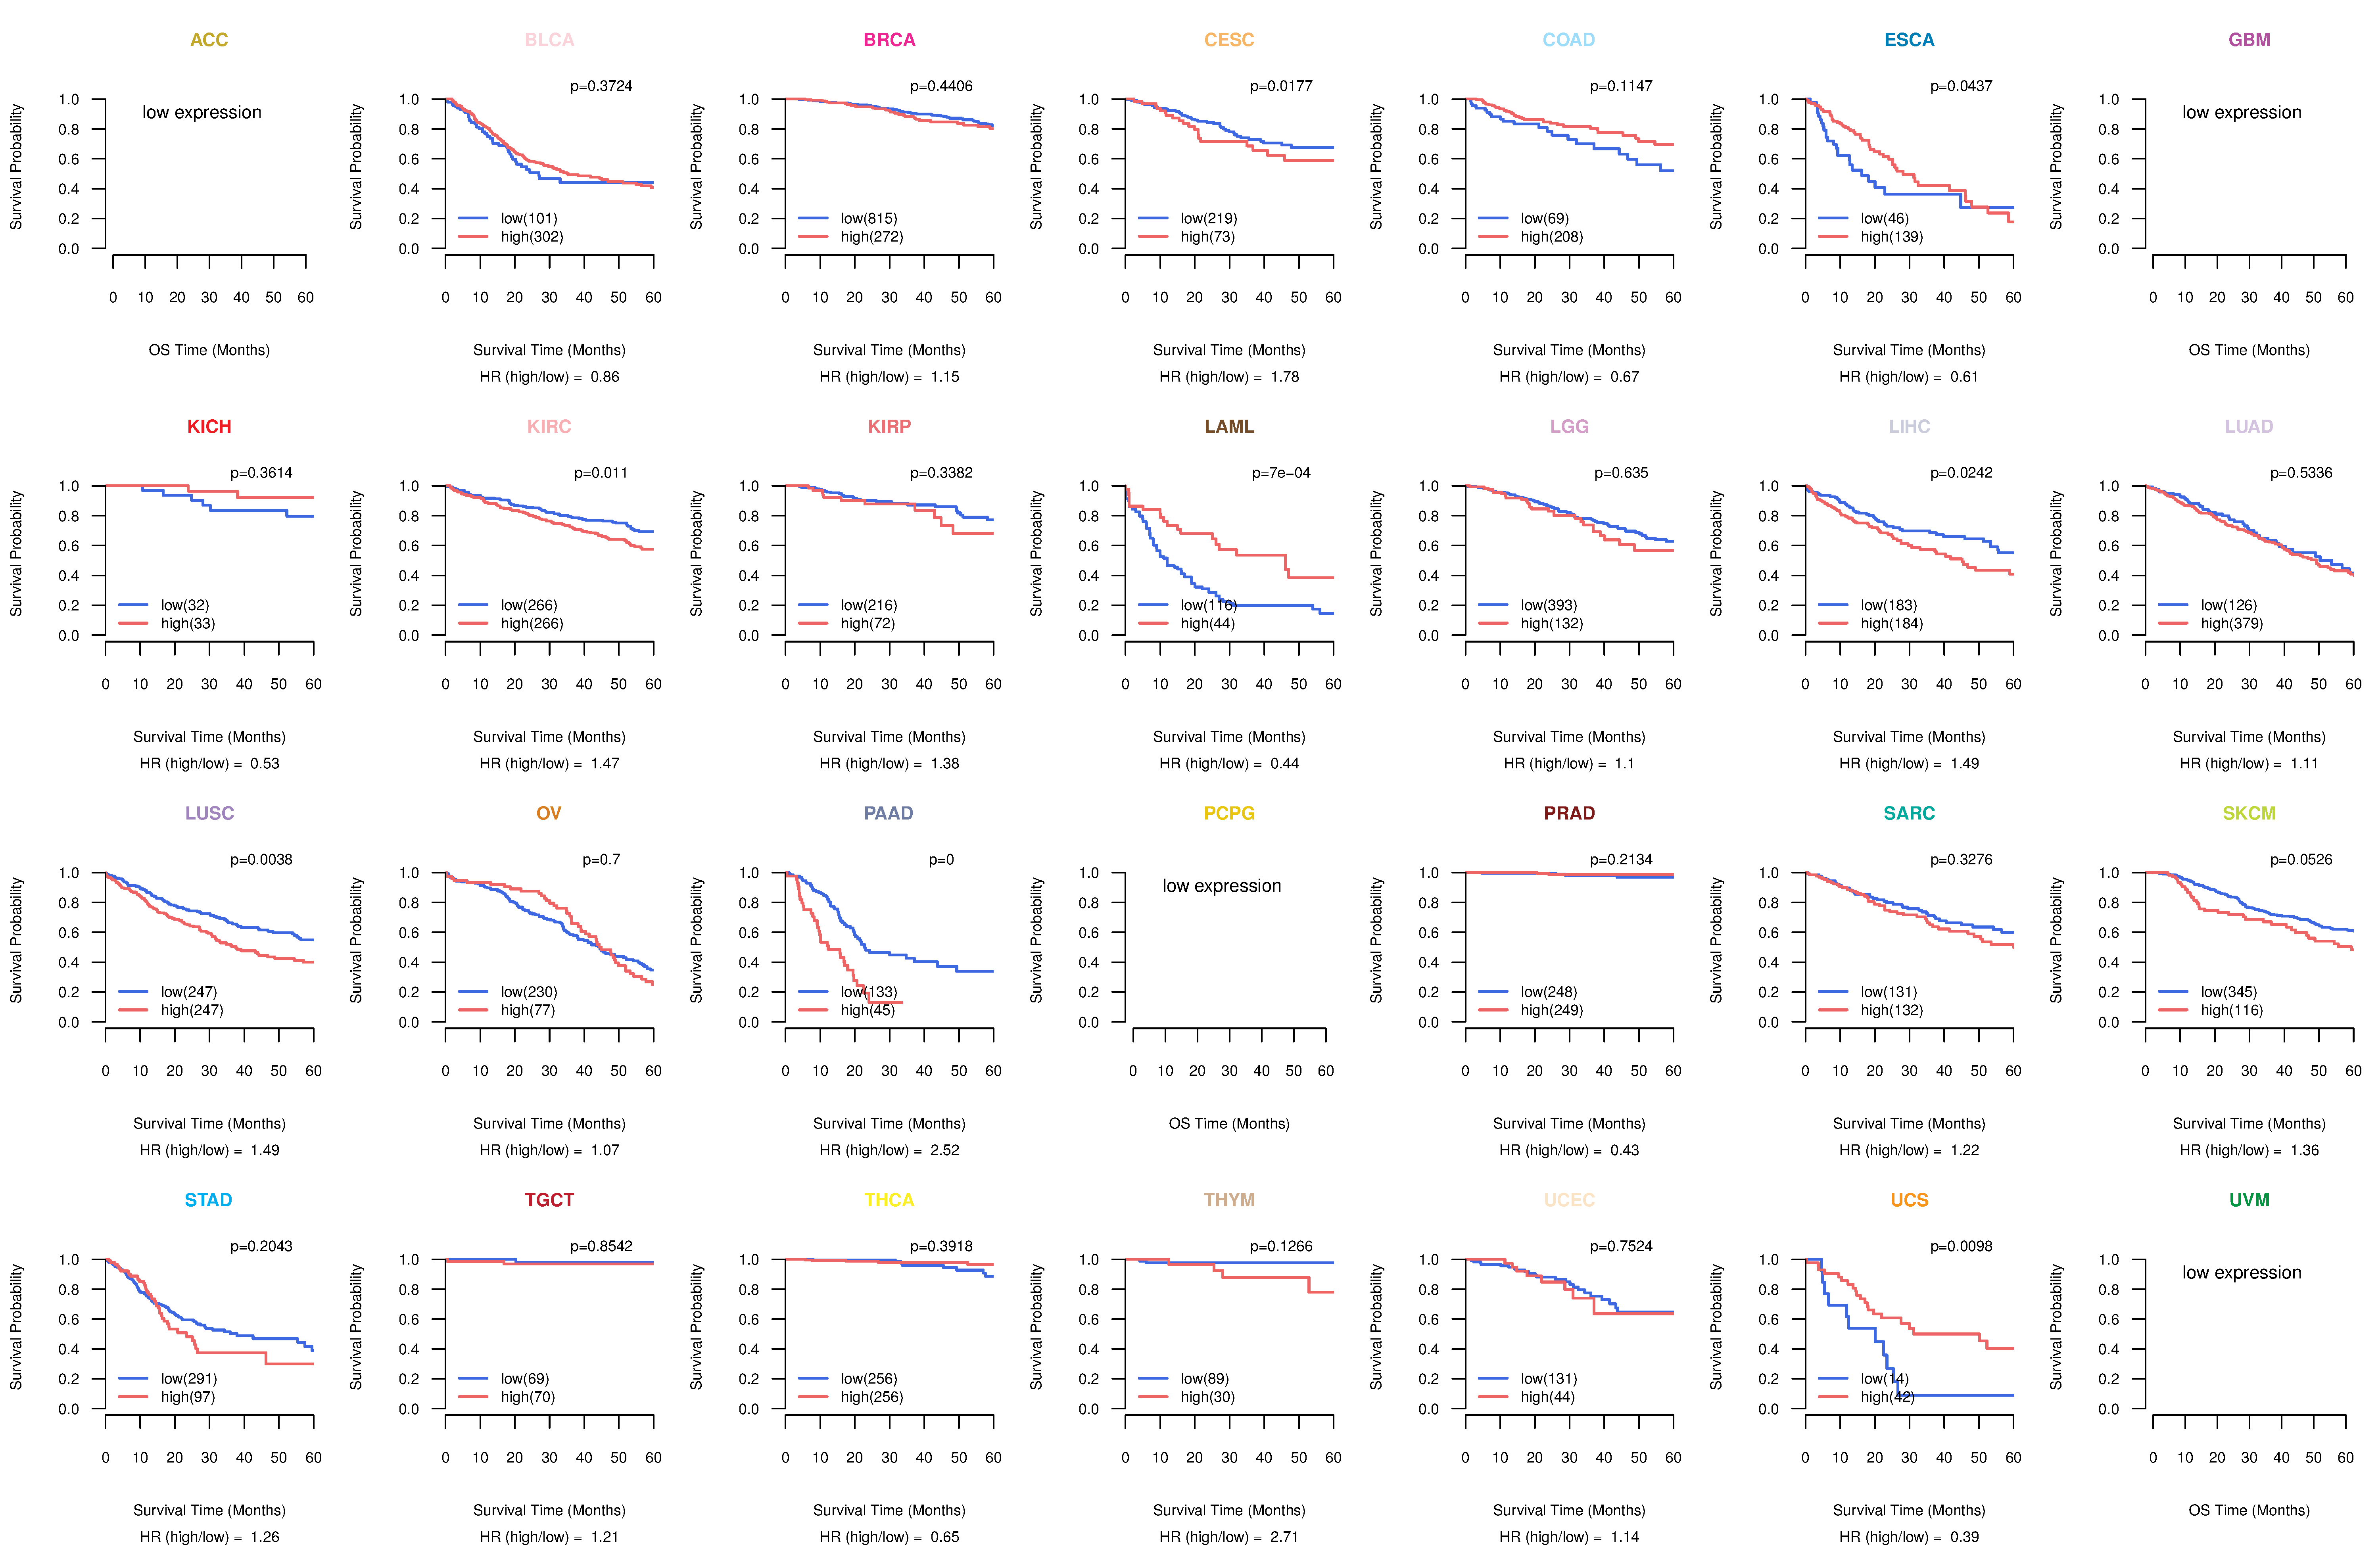
| Kaplan-Meier plots with logrank tests of overall survival (OS) using 28 cancer types (TCGA IlluminaHiSeq_RNASeqV2, pan-cancer normalized log2(norm_counts+1) data, version 2016-08-16) (TCGA clinicalMatrix, phenotype data, version 2016-04-27) * Click on the image to enlarge it in a new window. |
 |
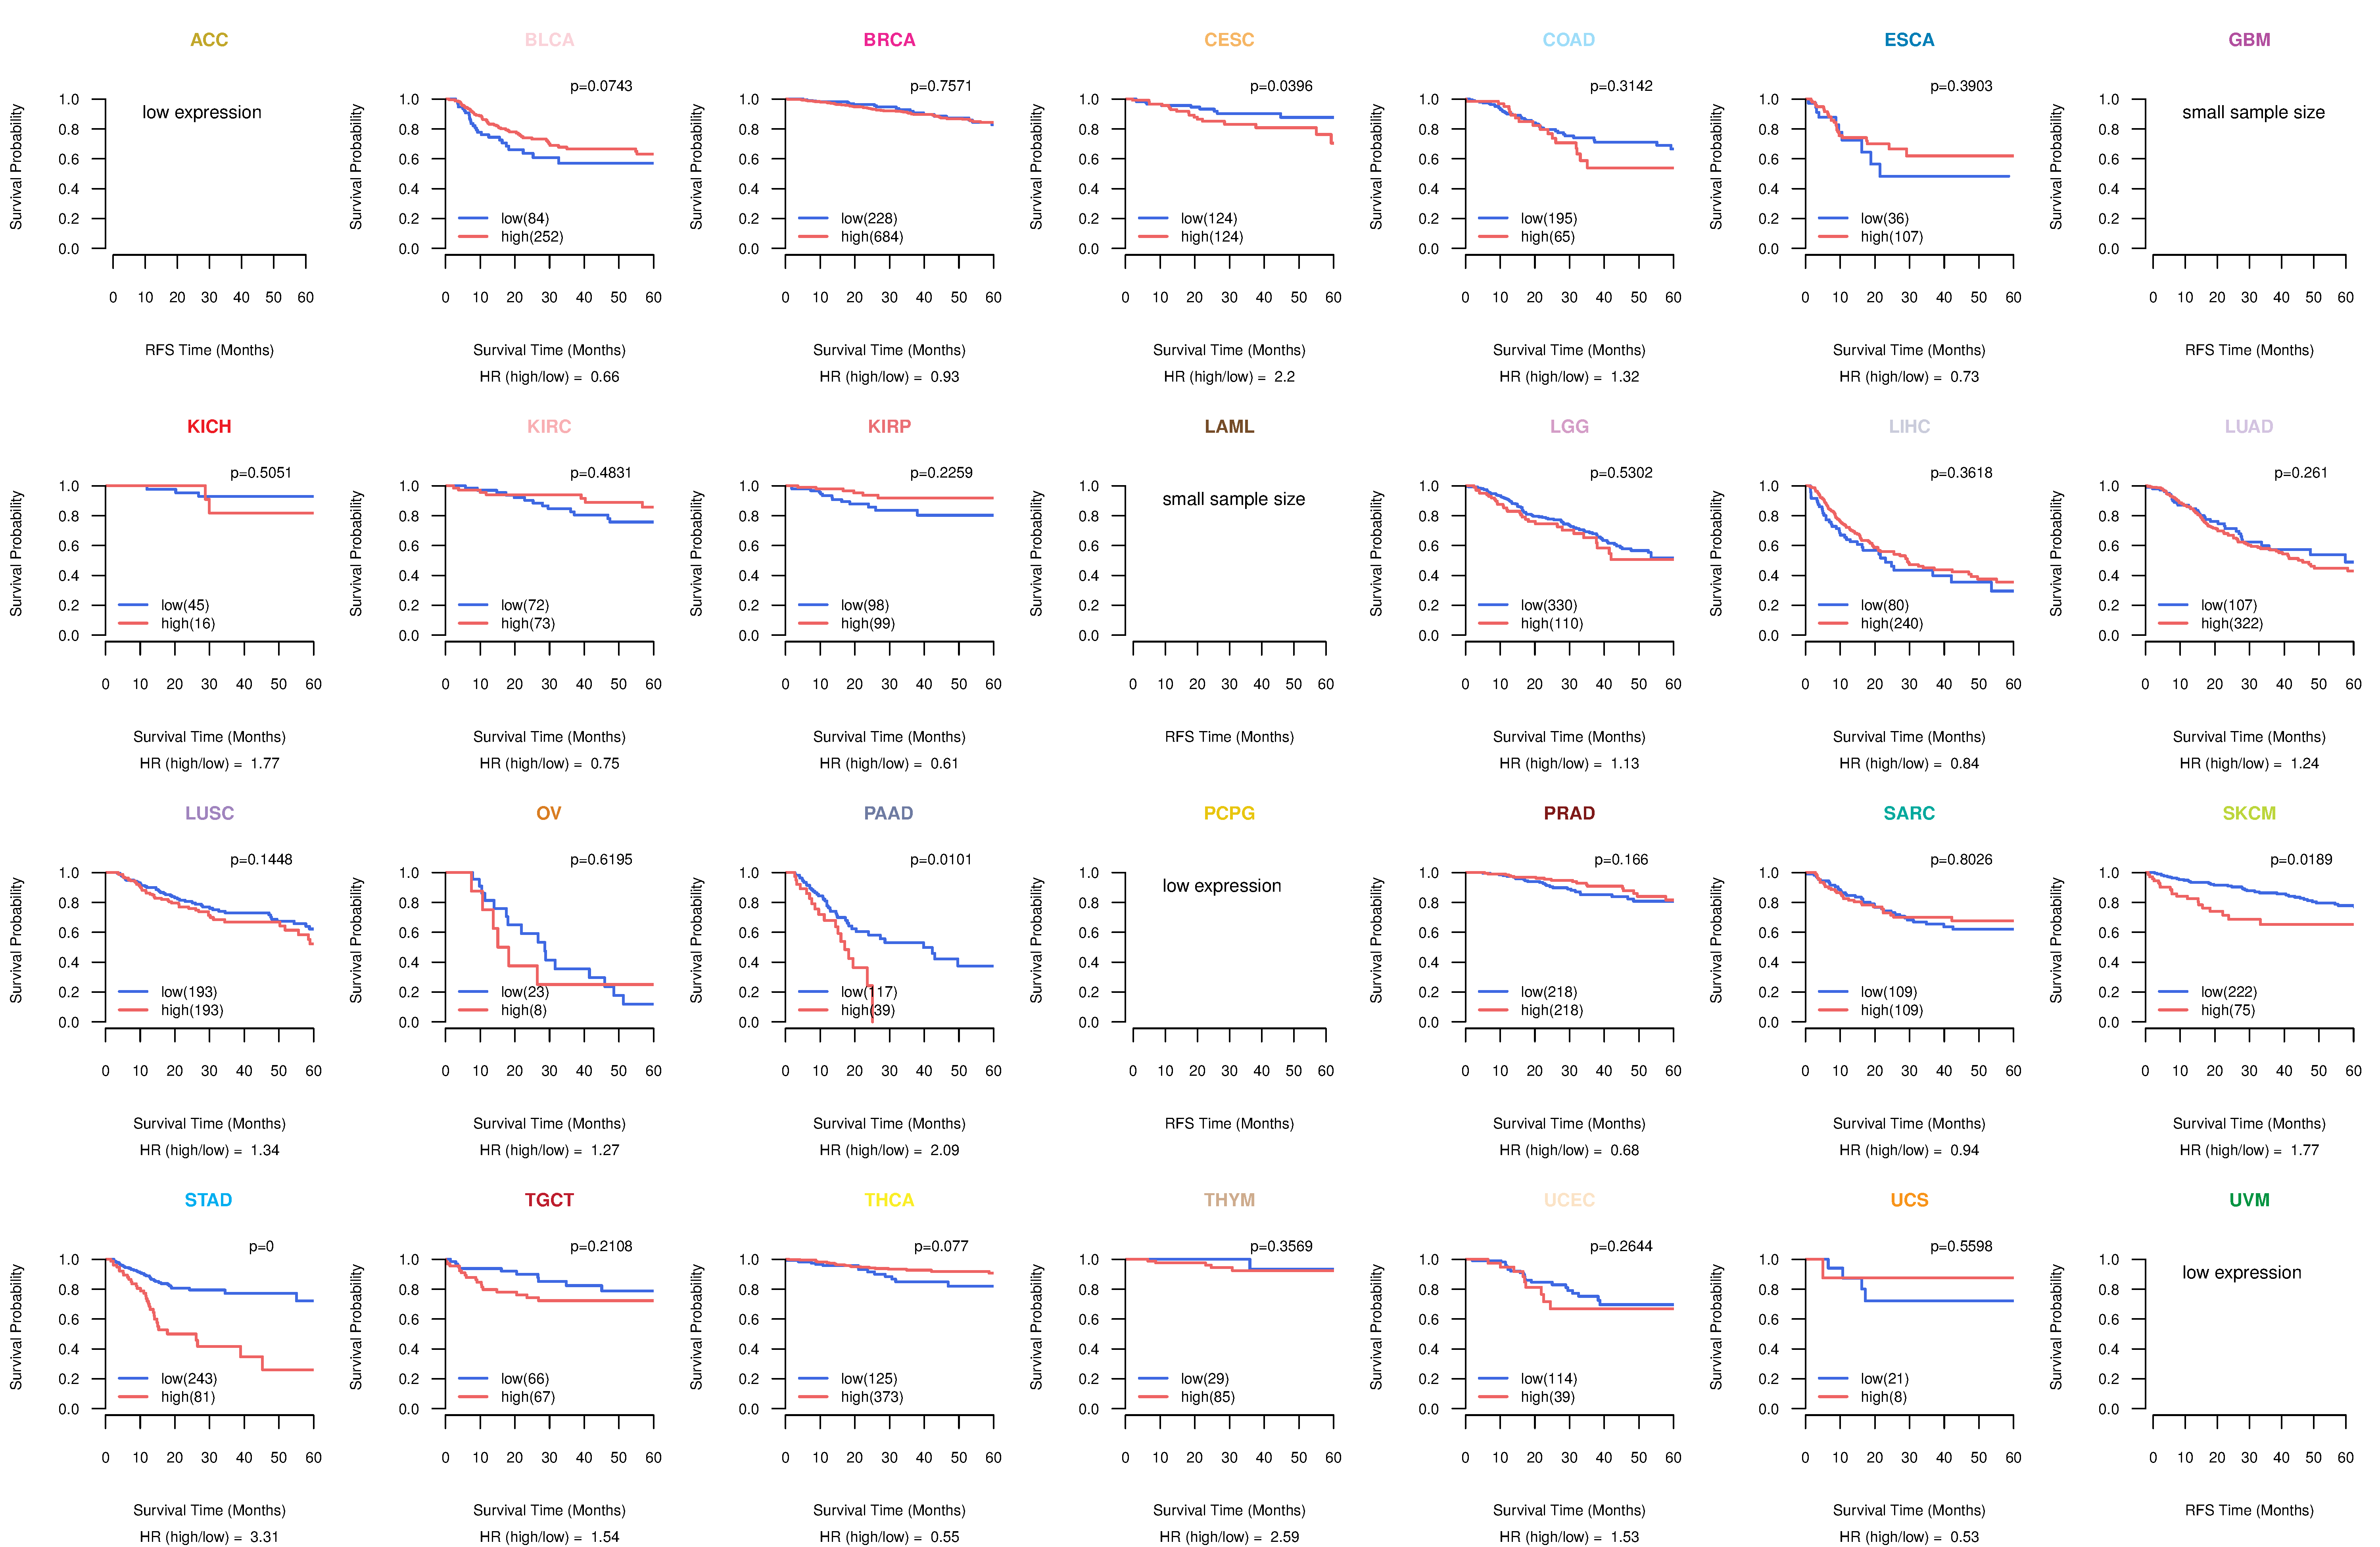
| Kaplan-Meier plots with logrank test of relapse free survival (RFS) using 28 cancer types (TCGA IlluminaHiSeq_RNASeqV2, pan-cancer normalized log2(norm_counts+1) data, version 2016-08-16) (TCGA clinicalMatrix, phenotype data, version 2016-04-27) * Click on the image enlarge it in a new window. |
 |
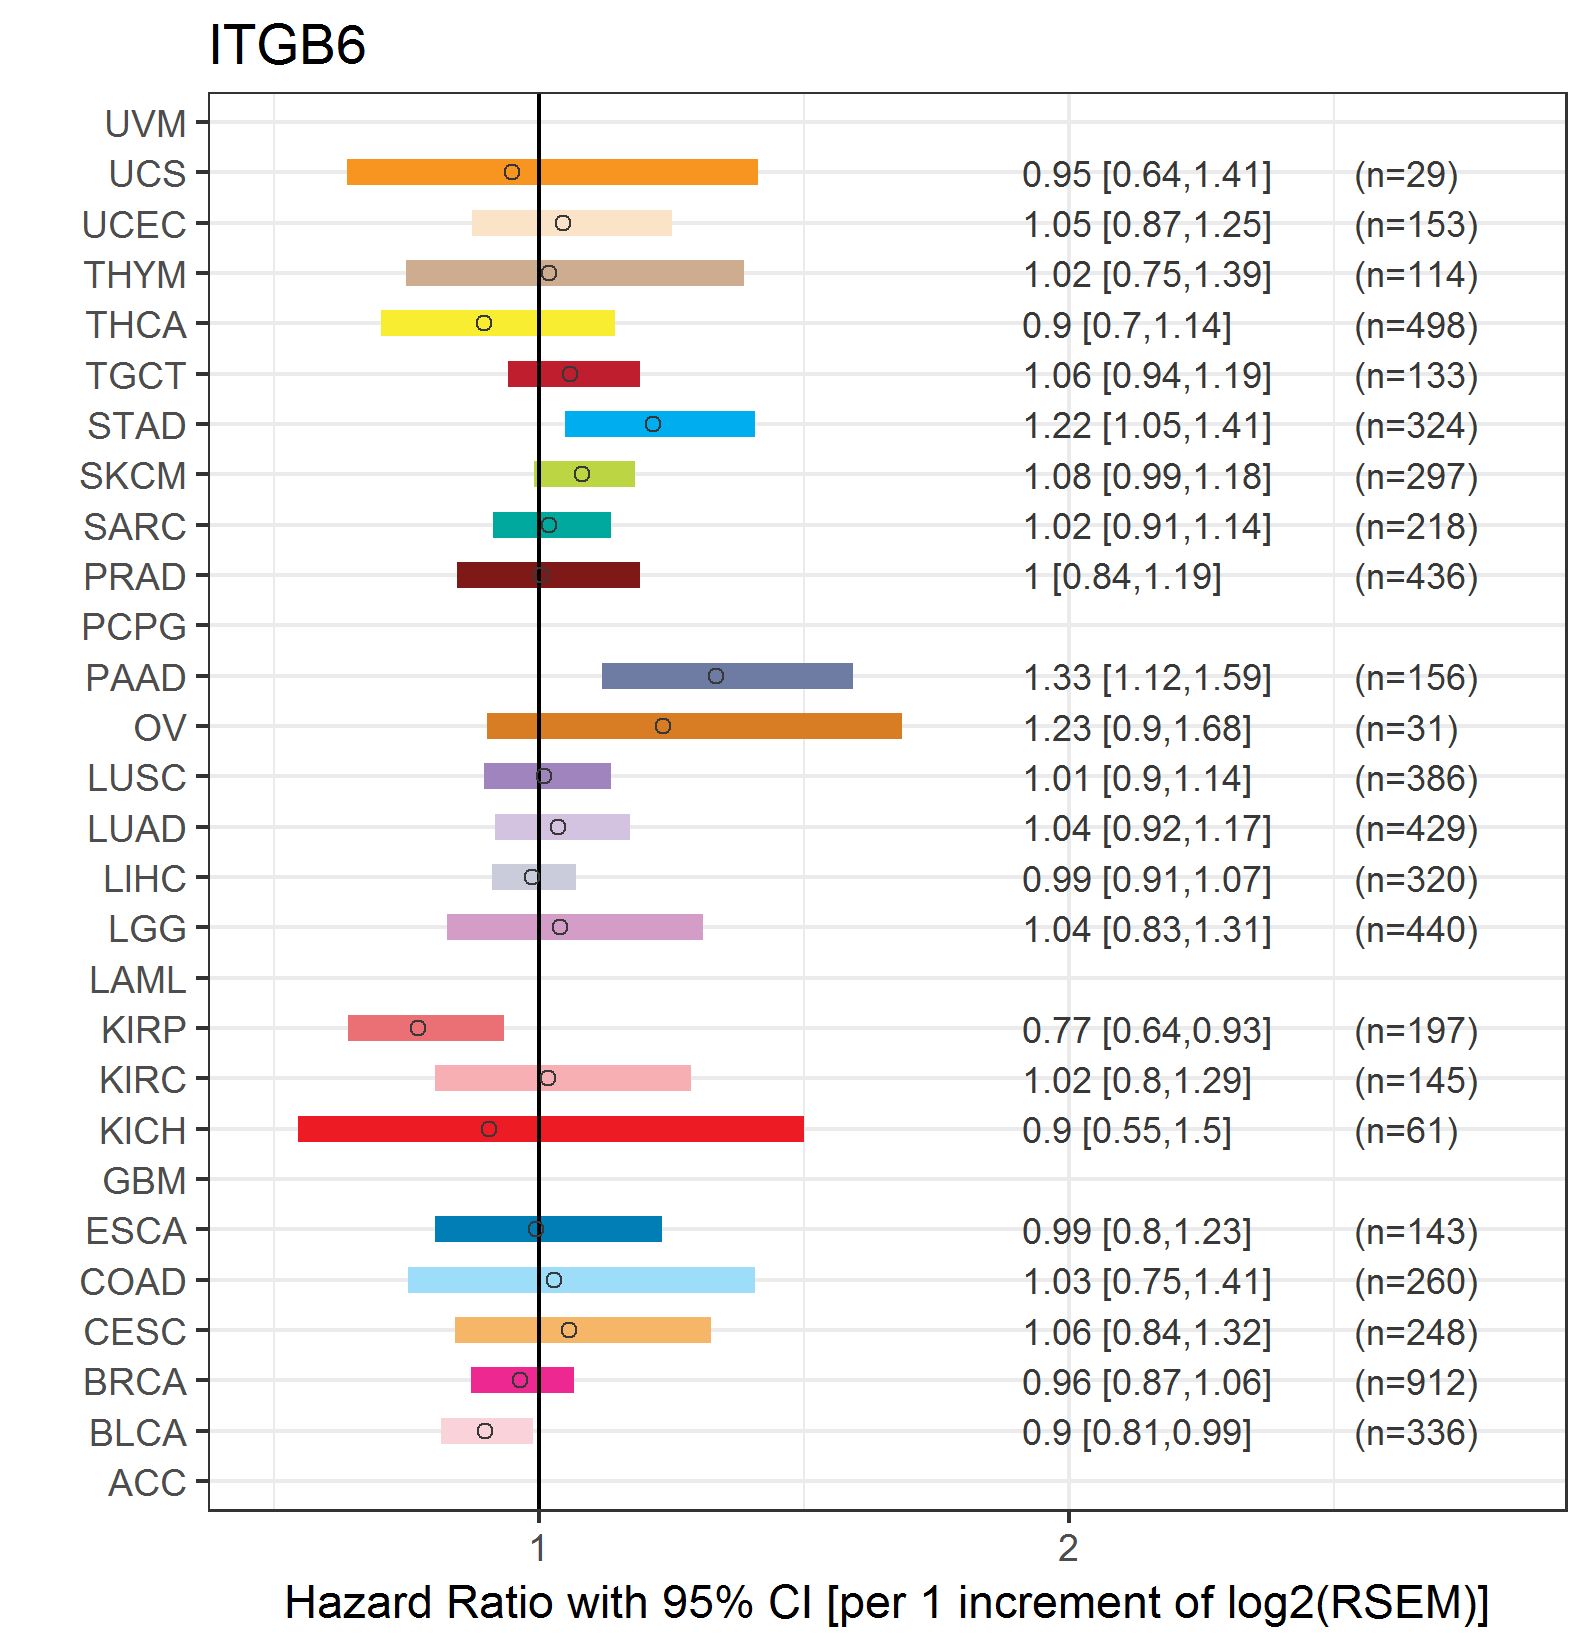
| Forest plot of Cox proportional hazard ratio (HR) and 95% CI of overall survival (OS) using 28 cancer types (TCGA IlluminaHiSeq_RNASeqV2, pan-cancer normalized log2(norm_counts+1) data, version 2016-08-16) (TCGA clinicalMatrix, phenotype data, version 2016-04-27) * Click on the image enlarge it in a new window. |
 |
| Forest plot of Cox proportional hazard ratio (HR) and 95% CI of relapse free survival (RFS) using 28 cancer types (TCGA IlluminaHiSeq_RNASeqV2, pan-cancer normalized log2(norm_counts+1) data, version 2016-08-16) (TCGA clinicalMatrix, phenotype data, version 2016-04-27) * Click on the image enlarge it in a new window. |
 |
| Top |
| TissGeneClin for ITGB6 |
| TissGeneDrug for ITGB6 |
| Drug information targeting TissGene (DrugBank Version 5.0.6, 2017-04-01) |
| DrugBank ID | Drug name | Drug activity | Drug type | Drug status |
| Top |
| TissGeneDisease for ITGB6 |
| Disease information associated with TissGene (DisGeNet, 2016-06-01) |
| Disease ID | Disease name | # pubmeds | Source |
| umls:C0034067 | Pulmonary Emphysema | 3 | BeFree,CTD_human |
| umls:C0002452 | Amelogenesis Imperfecta | 2 | BeFree |
| umls:C0007137 | Squamous cell carcinoma | 2 | BeFree,LHGDN |
| umls:C0009375 | Colonic Neoplasms | 2 | BeFree,LHGDN |
| umls:C0023893 | Liver Cirrhosis, Experimental | 2 | CTD_human,RGD |
| umls:C0038454 | Cerebrovascular accident | 2 | GAD |
| umls:C4015557 | AMELOGENESIS IMPERFECTA, TYPE IH | 2 | UNIPROT |
| umls:C0000768 | Congenital Abnormality | 1 | BeFree |
| umls:C0000786 | Spontaneous abortion | 1 | CTD_human |
| umls:C0006142 | Malignant neoplasm of breast | 1 | BeFree |
| umls:C0007102 | Malignant tumor of colon | 1 | BeFree |
| umls:C0007786 | Brain Ischemia | 1 | GAD |
| umls:C0011860 | Diabetes Mellitus, Non-Insulin-Dependent | 1 | GAD |
| umls:C0017638 | Glioma | 1 | BeFree |
| umls:C0023895 | Liver diseases | 1 | CTD_human |
| umls:C0034063 | Pulmonary Edema | 1 | BeFree |
| umls:C0524910 | Hepatitis C, Chronic | 1 | CTD_human |
| umls:C0678222 | Breast Carcinoma | 1 | BeFree |
| umls:C0699790 | Colon Carcinoma | 1 | BeFree |
| umls:C0746102 | Chronic lung disease | 1 | BeFree |
| umls:C0796085 | Nance-Horan syndrome | 1 | BeFree |
| umls:C1271104 | Blood pressure finding | 1 | GAD |
| umls:C1272641 | Systemic arterial pressure | 1 | GAD |
| umls:C0399376 | Amelogenesis Imperfecta, Type III | 0 | ORPHANET |
| umls:C1851718 | Emphysema, Hereditary Pulmonary | 0 | MGD |
| umls:C1869116 | ASTHMA, SUSCEPTIBILITY TO (finding) | 0 | MGD |
|
Copyright 2016-Present - The University of Texas Health Science Center at Houston (UTHealth) Web File Viewing | How to Report, Fraud, Waste and Abuse | State of Texas | Statewide Search | Texas Homeland Security | Site Policies |