 |
| |
| |
| |
| |
| |
| |
|

| TissGeneSummary for SAA4 |
 Gene summary Gene summary |
| Basic gene information | Gene symbol | SAA4 |
| Gene name | ||
| Synonyms | ||
| Cytomap | UCSC genome browser: | |
| Type of gene | ||
| RefGenes | ||
| Description | ||
| Modification date | ||
| dbXrefs | ||
| Protein | UniProt: go to UniProt's Cross Reference DB Table | |
| Expression | CleanEX: HS_SAA4 | |
| BioGPS: 100528017 | ||
| Pathway | NCI Pathway Interaction Database: SAA4 | |
| KEGG: SAA4 | ||
| REACTOME: SAA4 | ||
| Pathway Commons: SAA4 | ||
| Context | iHOP: SAA4 | |
| ligand binding site mutation search in PubMed: SAA4 | ||
| UCL Cancer Institute: SAA4 | ||
| Assigned class in TissGDB* | B | |
| Included tissue-specific gene expression resources | HPA,TiGER,GTEx | |
| Specific-tissues in normal samples (assigned by TissGDB using HPA, TiGER, and GTEx) | Liver | |
| Cancer types related to the specific-tissues in cancer samples (assigned by TissGDB using TCGA) | LIHC | |
| Reference showing the relevant tissue of SAA4 | ||
| Description by TissGene annotations | Significant down-regulated DEG TissgsKTS CNV lost TissGeneKTS | |
| * Class A consists of genes with literature evidence and is part of the cTissGenes. Class B consists of only cTissGenes without additional evidence. The remaining genes belong to Class C. |
| Gene ontology having evidence of Inferred from Direct Assay (IDA) from Entrez |
| GO ID | GO term | PubMed ID |
| Top |
| TissGeneExp for SAA4 |
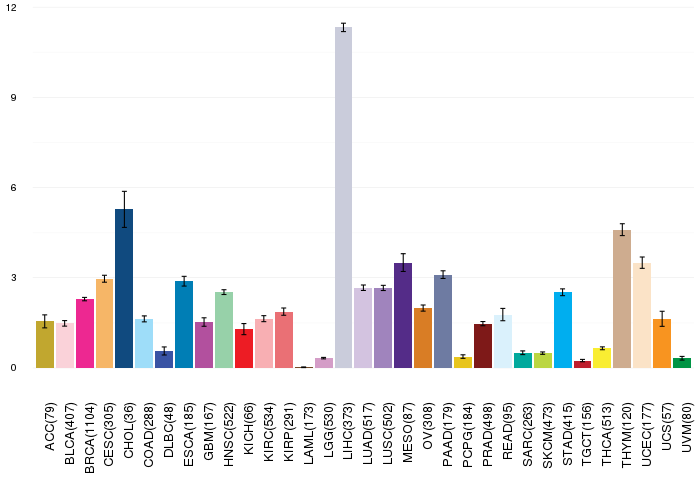
| Gene expressions across 28 cancer types (X-axis: cancer type and Y-axis: log2(norm_counts+1)) (TCGA IlluminaHiSeq_RNASeqV2, pan-cancer normalized log2(norm_counts+1) data, version 2016-08-16) |
 |
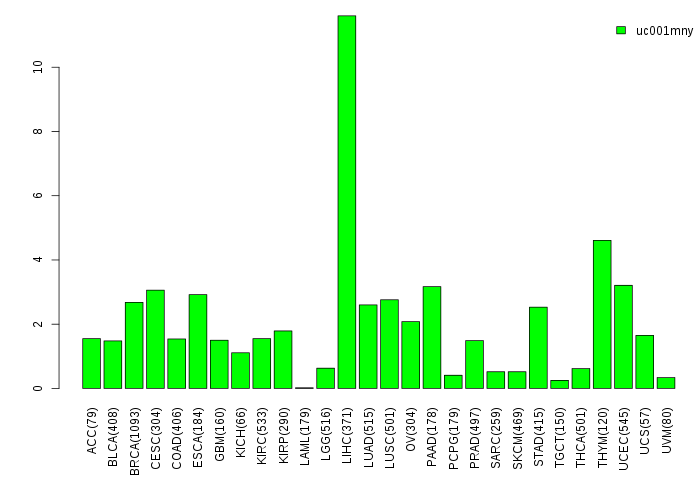
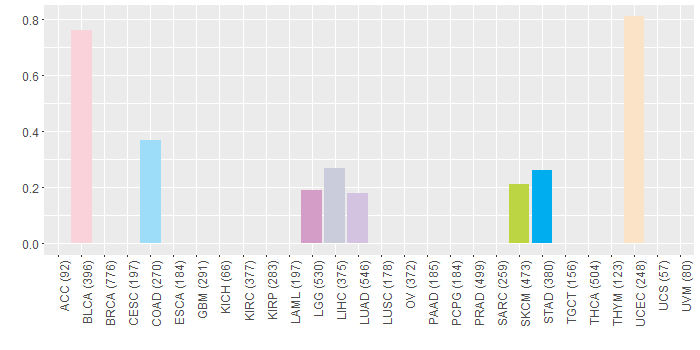
| Gene isoform expressions across 28 cancer types (X-axis: cancer type and Y-axis: log2(norm_counts+1)) (TCGA pan-cancer tcga_rsem_isoform_tpm, version 2016-09-01) |
 |
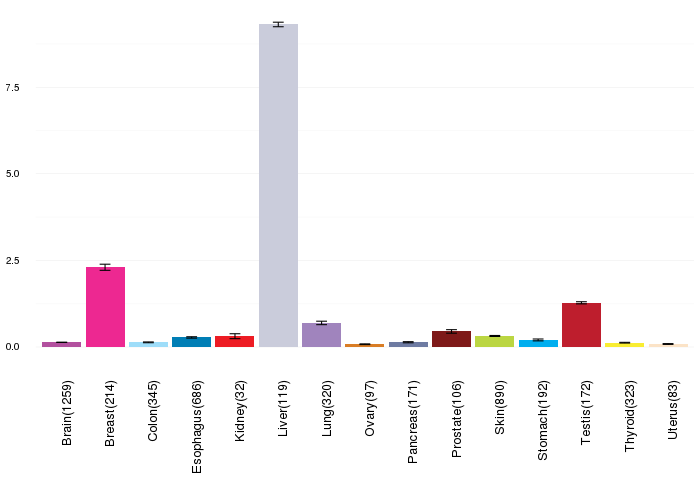
| Gene expressions across normal tissues of GTEx data (GTEx GTEx_Analysis_v6_RNA-seq_RNA-SeQCv1.1.8_gene_rpkm.gct) - Here, we shows the matched tissue types only among our 28 cancer types. |
 |
| Different expressions across 14 cancer types with more than 10 samples between matched tumors and normals (X-axis: cancer type and Y-axis: log2(norm_counts+1)) (TCGA IlluminaHiSeq_RNASeqV2, pan-cancer normalized log2(norm_counts+1) data, version 2016-08-16) |
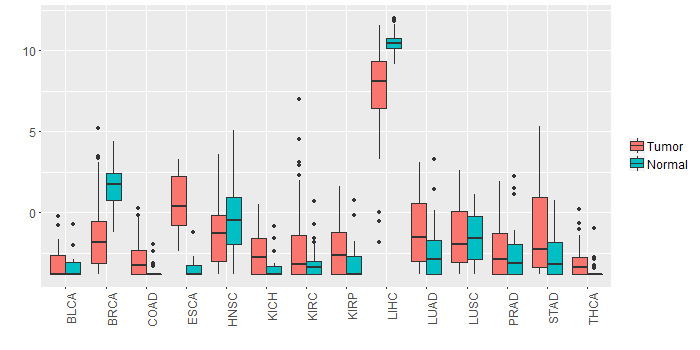 |
| - Significantly differentially expressed cancer types and information. (|Fold change|>1 and FDR<0.05) |
| Cancer type | Mean(exp) in tumor | Mean(exp) in matched normal | Log2FC | P-val. | FDR |
| BRCA | -1.549138422 | 1.724171227 | -3.273309649 | 4.41E-36 | 8.72E-35 |
| LIHC | 7.332296947 | 10.51611295 | -3.183816 | 3.31E-10 | 3.97E-09 |
| STAD | -1.100784803 | -2.600894178 | 1.500109375 | 0.00809 | 0.029064553 |
| ESCA | 0.587658947 | -3.357150144 | 3.944809091 | 3.99E-05 | 0.001706492 |
| LUAD | -1.194325536 | -2.44047726 | 1.246151724 | 0.000271 | 0.000639172 |
| KIRC | -2.155714665 | -3.247431331 | 1.091716667 | 0.000264 | 0.000532995 |
| Top |
| TissGene-miRNA for SAA4 |
| Significantly anti-correlated miRNAs of TissGene across 28 cancer types (Gene-miRNA relations from TargetScanHuman Relsease 7.1, Conserved_Site_Context_Scores.txt.zip, 06.01.2016) (TCGA IlluminaHiSeq_miRNASeq, log2(RPM+1) data, version 2016-11-21) (TCGA IlluminaHiSeq_RNASeqV2, log2(normalized_count+1) data, version 2016-08-16) (Spearman’s Rank Correlation (p-value<0.05 and coefficient<-0.25)) |
| Cancer type | miRNA id | miRNA accession | P-val. | Coeff. | # samples |
| Top |
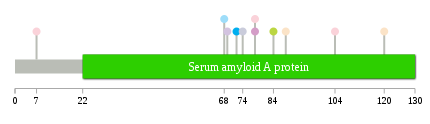
| TissGeneMut for SAA4 |
| TissGeneSNV for SAA4 |
| nsSNV counts per each loci. Different colors of circles represent different cancer types. Circle size denotes number of samples. (TCGA somatic mutation (SNPs and small INDELs) data, version 2016-04-25) * Click on the image to enlarge it in a new window. |
 |
 |
| Somatic nucleotide variants of TissGene across 28 cancer types (X-axis: cancer type and Y-axis: % of mutated samples) The numbers in parentheses are numbers of samples with mutation (nsSNVs). (TCGA somatic mutation (SNPs and small INDELs) data, version 2016-04-25) |
 |
| - nsSNVs sorted by frequency. |
| AAchange | Cancer type | # samples |
| p.A72T | STAD | 1 |
| p.G68E | COAD | 1 |
| p.I7F | BLCA | 1 |
| p.R120H | UCEC | 1 |
| p.G15X | READ | 1 |
| p.K74E | LIHC | 1 |
| p.D88Y | UCEC | 1 |
| p.R78H | LGG | 1 |
| p.S104F | BLCA | 1 |
| p.N49H | READ | 1 |
| p.R78H | BLCA | 1 |
| p.M43I | HNSC | 1 |
| p.G69C | LUAD | 1 |
| p.Q84* | SKCM | 1 |
| Top |
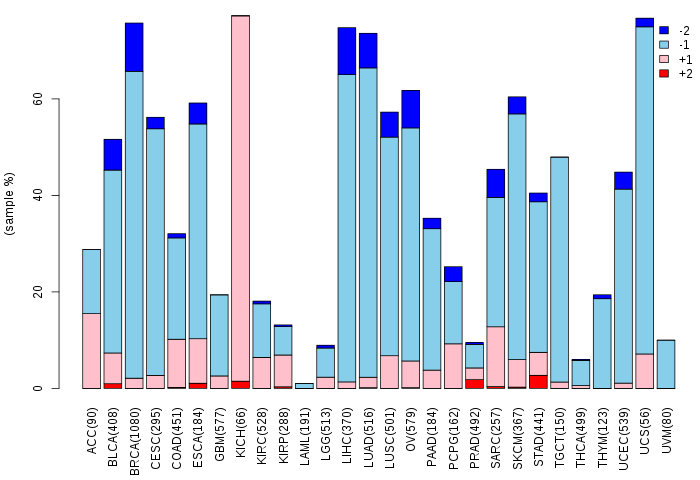
| TissGeneCNV for SAA4 |
| Copy number variations of TissGene across 28 cancer types (X-axis: cancer type and Y-axis: % of CNV samples) (TCGA Gistic2_CopyNumber_Gistic2_all_data_by_genes, Gistic2 copy number data, version 2016-08-16) |
 |
| Top |
| TissGeneFusions for SAA4 |
| Fusion genes including TissGene (ChimerDB 3.0, 2016-12-01 and TCGA fusion Portal 2015-12-01) |
| Database | Src | Cancer type | Sample | Fusion gene | ORF | 5'-gene BP | 3'-gene BP |
| Top |
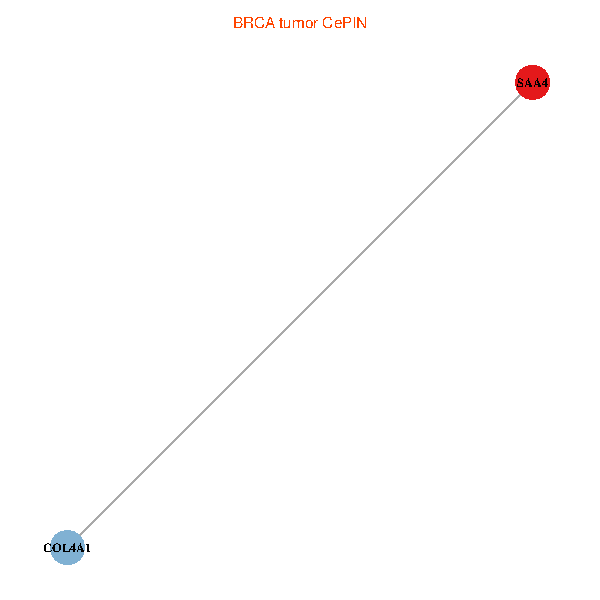
| TissGeneNet for SAA4 |
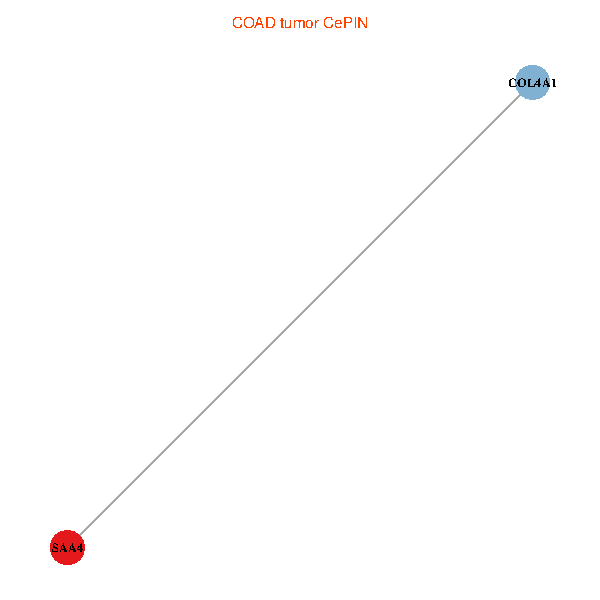
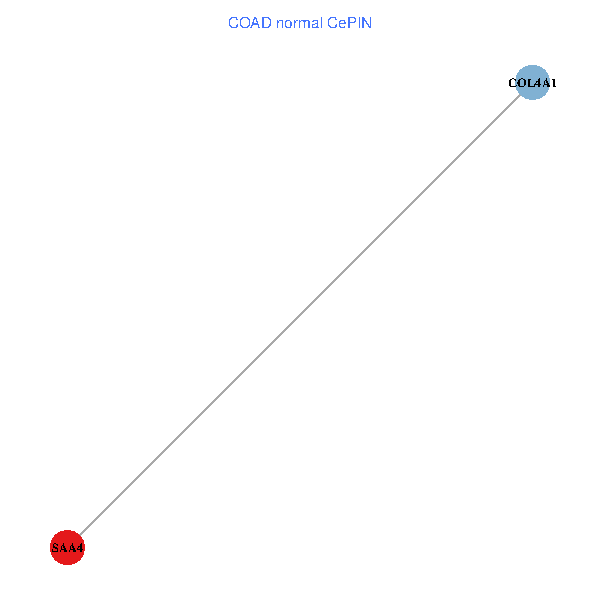
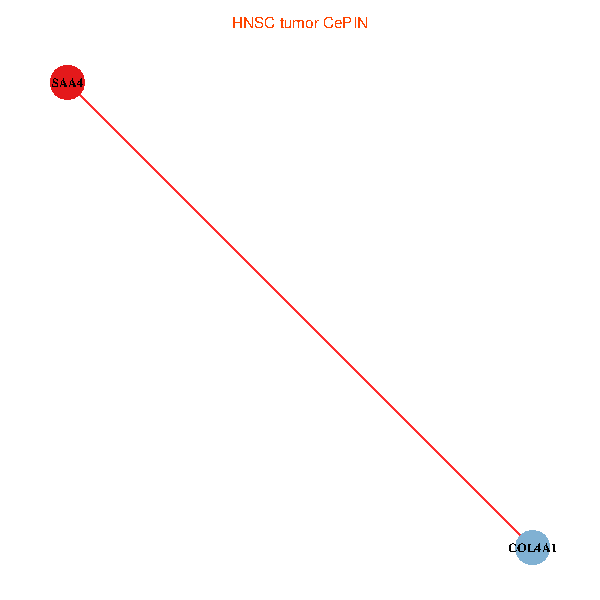
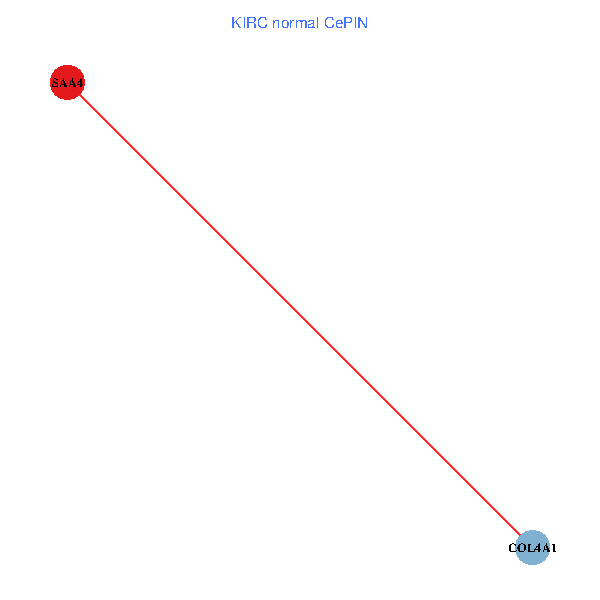
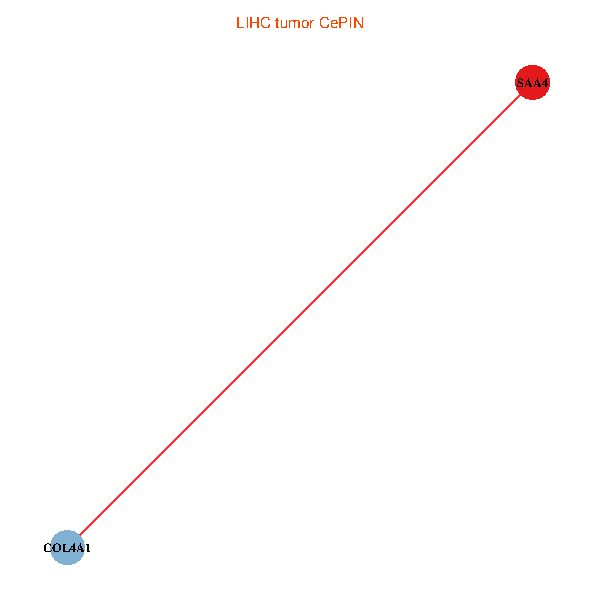
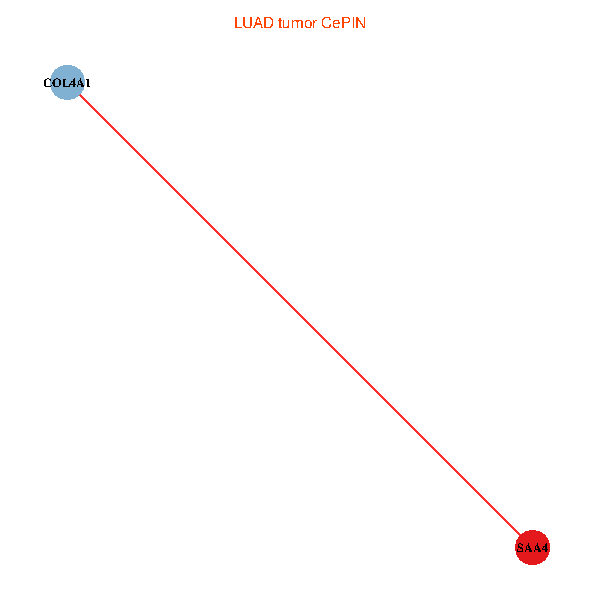
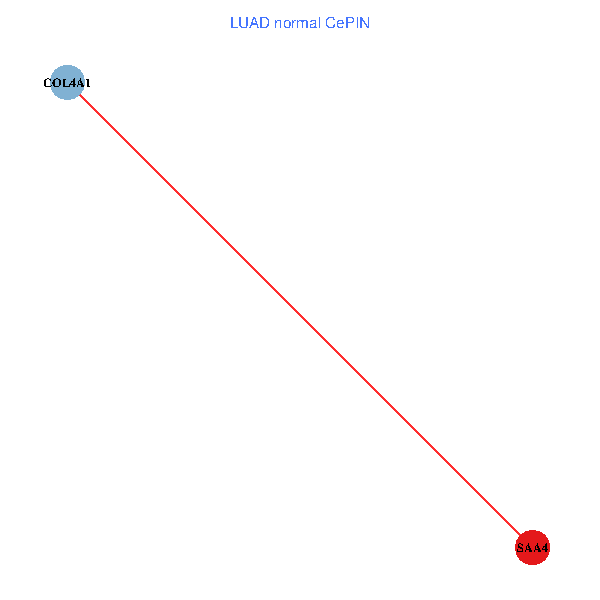
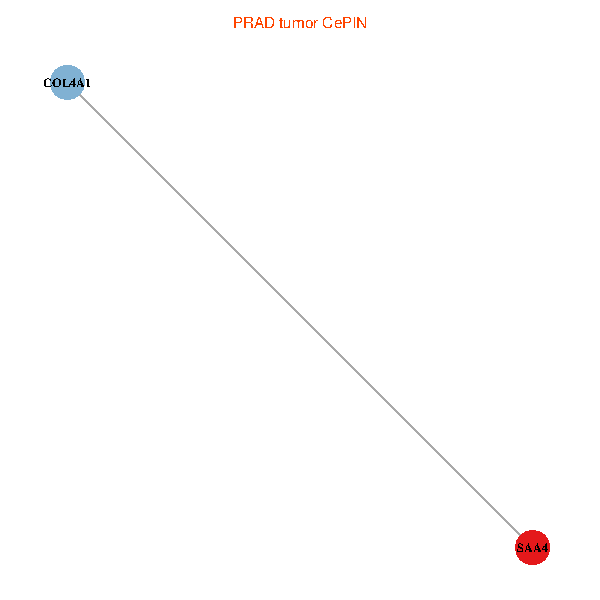
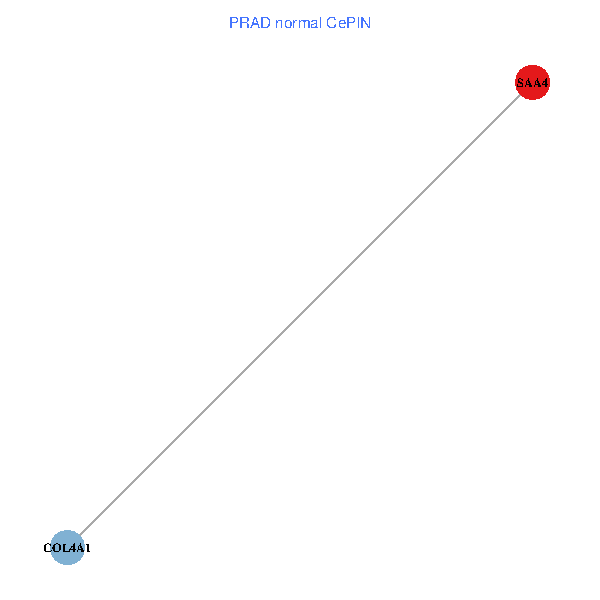
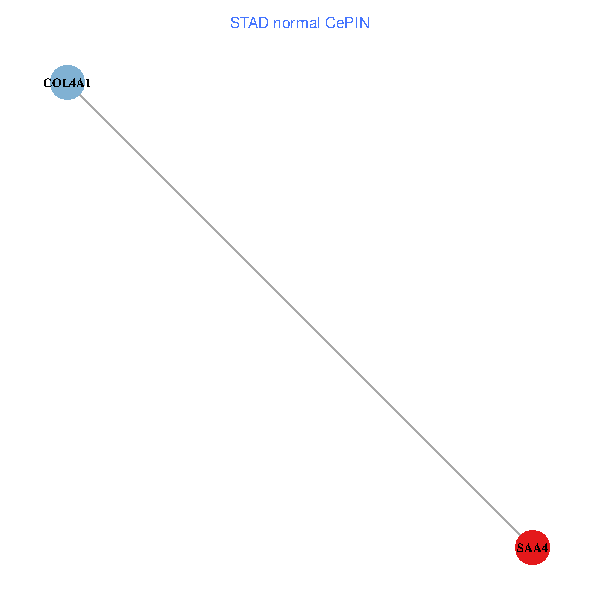
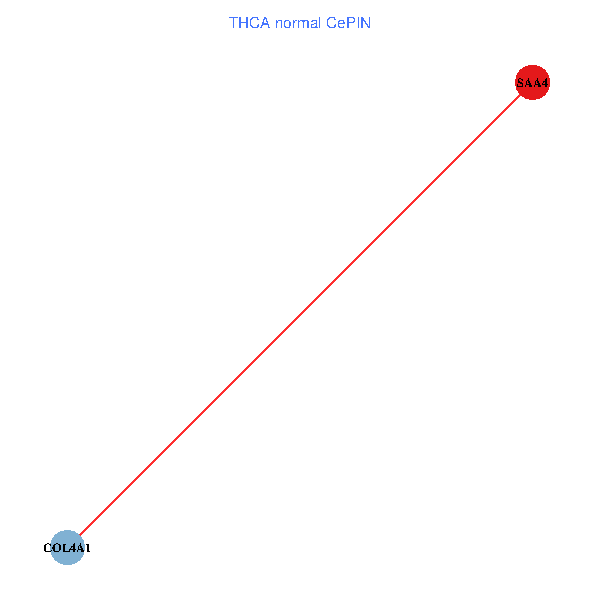
| Co-expressed gene networks based on protein-protein interaction data (CePIN) (TCGA IlluminaHiSeq_RNASeqV2, pan-cancer normalized log2(norm_counts+1) data, version 2016-08-16) (PINA2 ppi data) |
| BRCA (tumor) | BRCA (normal) |
| SAA4, COL4A1 (tumor) | SAA4, COL4A1 (normal) |
 |  |
| COAD (tumor) | COAD (normal) |
| SAA4, COL4A1 (tumor) | SAA4, COL4A1 (normal) |
 |  |
| HNSC (tumor) | HNSC (normal) |
| SAA4, COL4A1 (tumor) | SAA4, COL4A1 (normal) |
 |  |
| KICH (tumor) | KICH (normal) |
| SAA4, COL4A1 (tumor) | SAA4, COL4A1 (normal) |
 |  |
| KIRC (tumor) | KIRC (normal) |
| SAA4, COL4A1 (tumor) | SAA4, COL4A1 (normal) |
 |  |
| KIRP (tumor) | KIRP (normal) |
| SAA4, COL4A1 (tumor) | SAA4, COL4A1 (normal) |
 |  |
| LIHC (tumor) | LIHC (normal) |
| SAA4, COL4A1 (tumor) | SAA4, COL4A1 (normal) |
 |  |
| LUAD (tumor) | LUAD (normal) |
| SAA4, COL4A1 (tumor) | SAA4, COL4A1 (normal) |
 |  |
| LUSC (tumor) | LUSC (normal) |
| SAA4, COL4A1 (tumor) | SAA4, COL4A1 (normal) |
 |  |
| PRAD (tumor) | PRAD (normal) |
| SAA4, COL4A1 (tumor) | SAA4, COL4A1 (normal) |
 |  |
| STAD (tumor) | STAD (normal) |
| SAA4, COL4A1 (tumor) | SAA4, COL4A1 (normal) |
 |  |
| THCA (tumor) | THCA (normal) |
| SAA4, COL4A1 (tumor) | SAA4, COL4A1 (normal) |
 |  |
| Top |
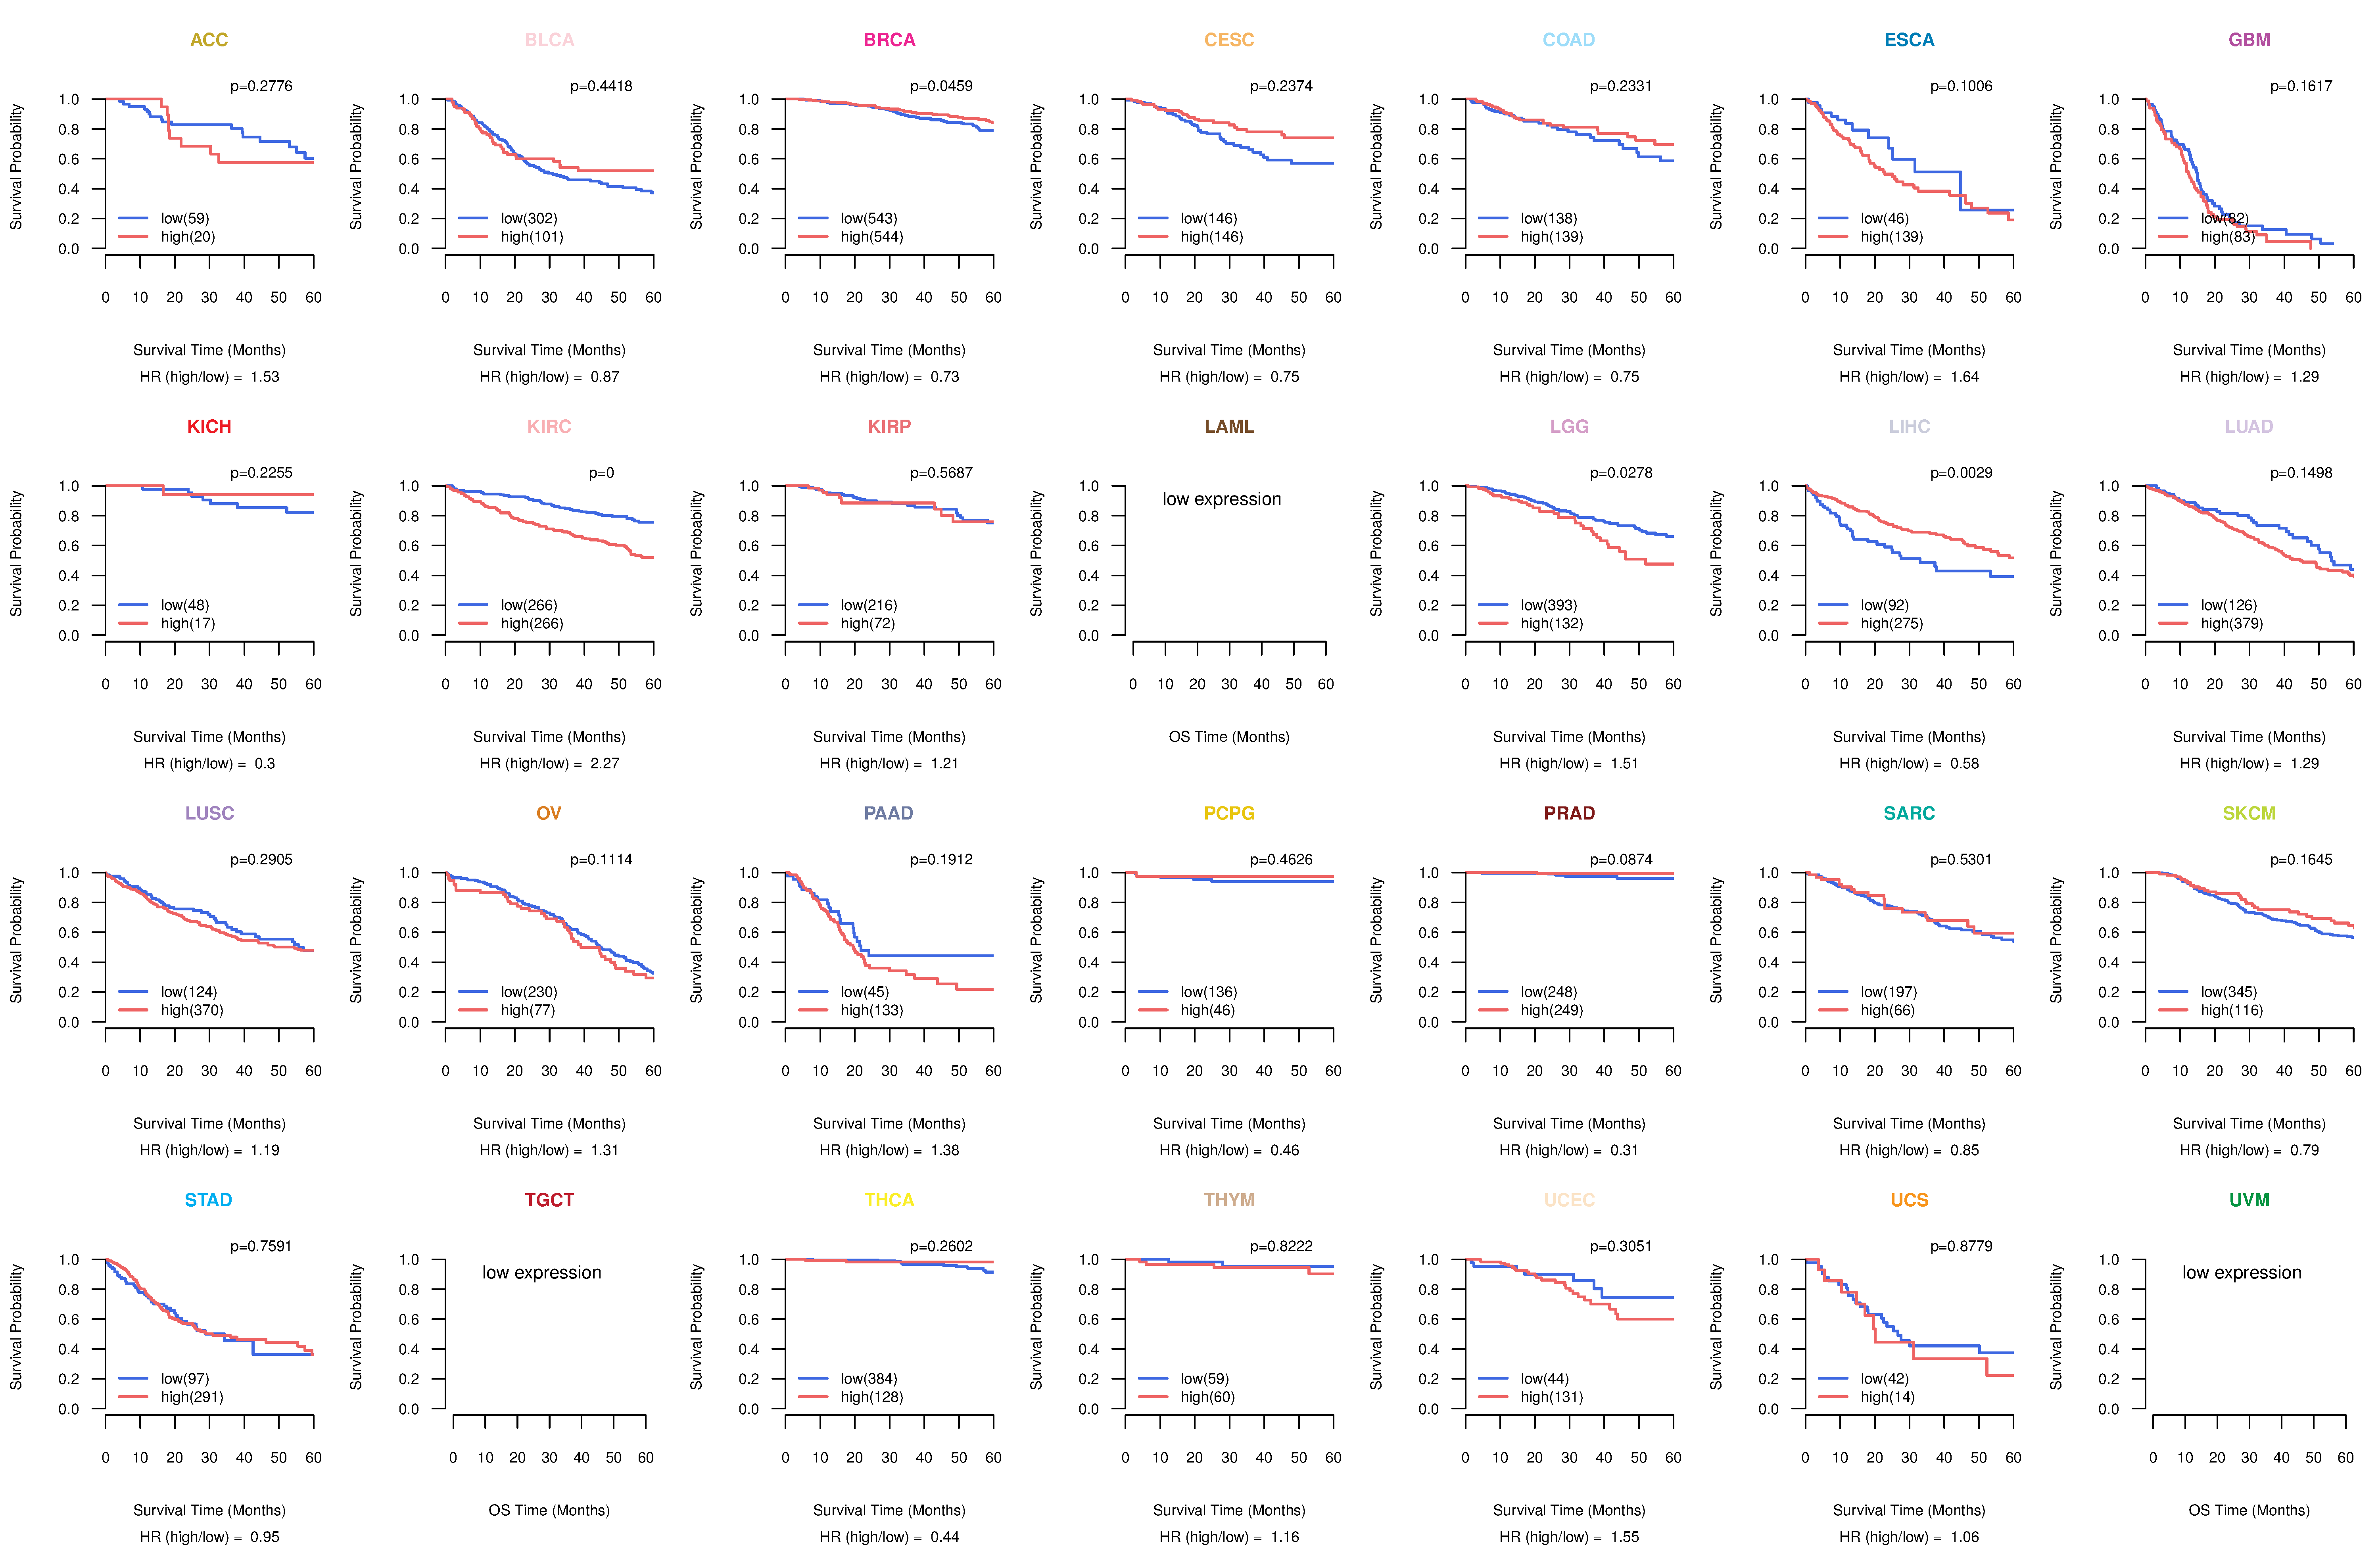
| TissGeneProg for SAA4 |
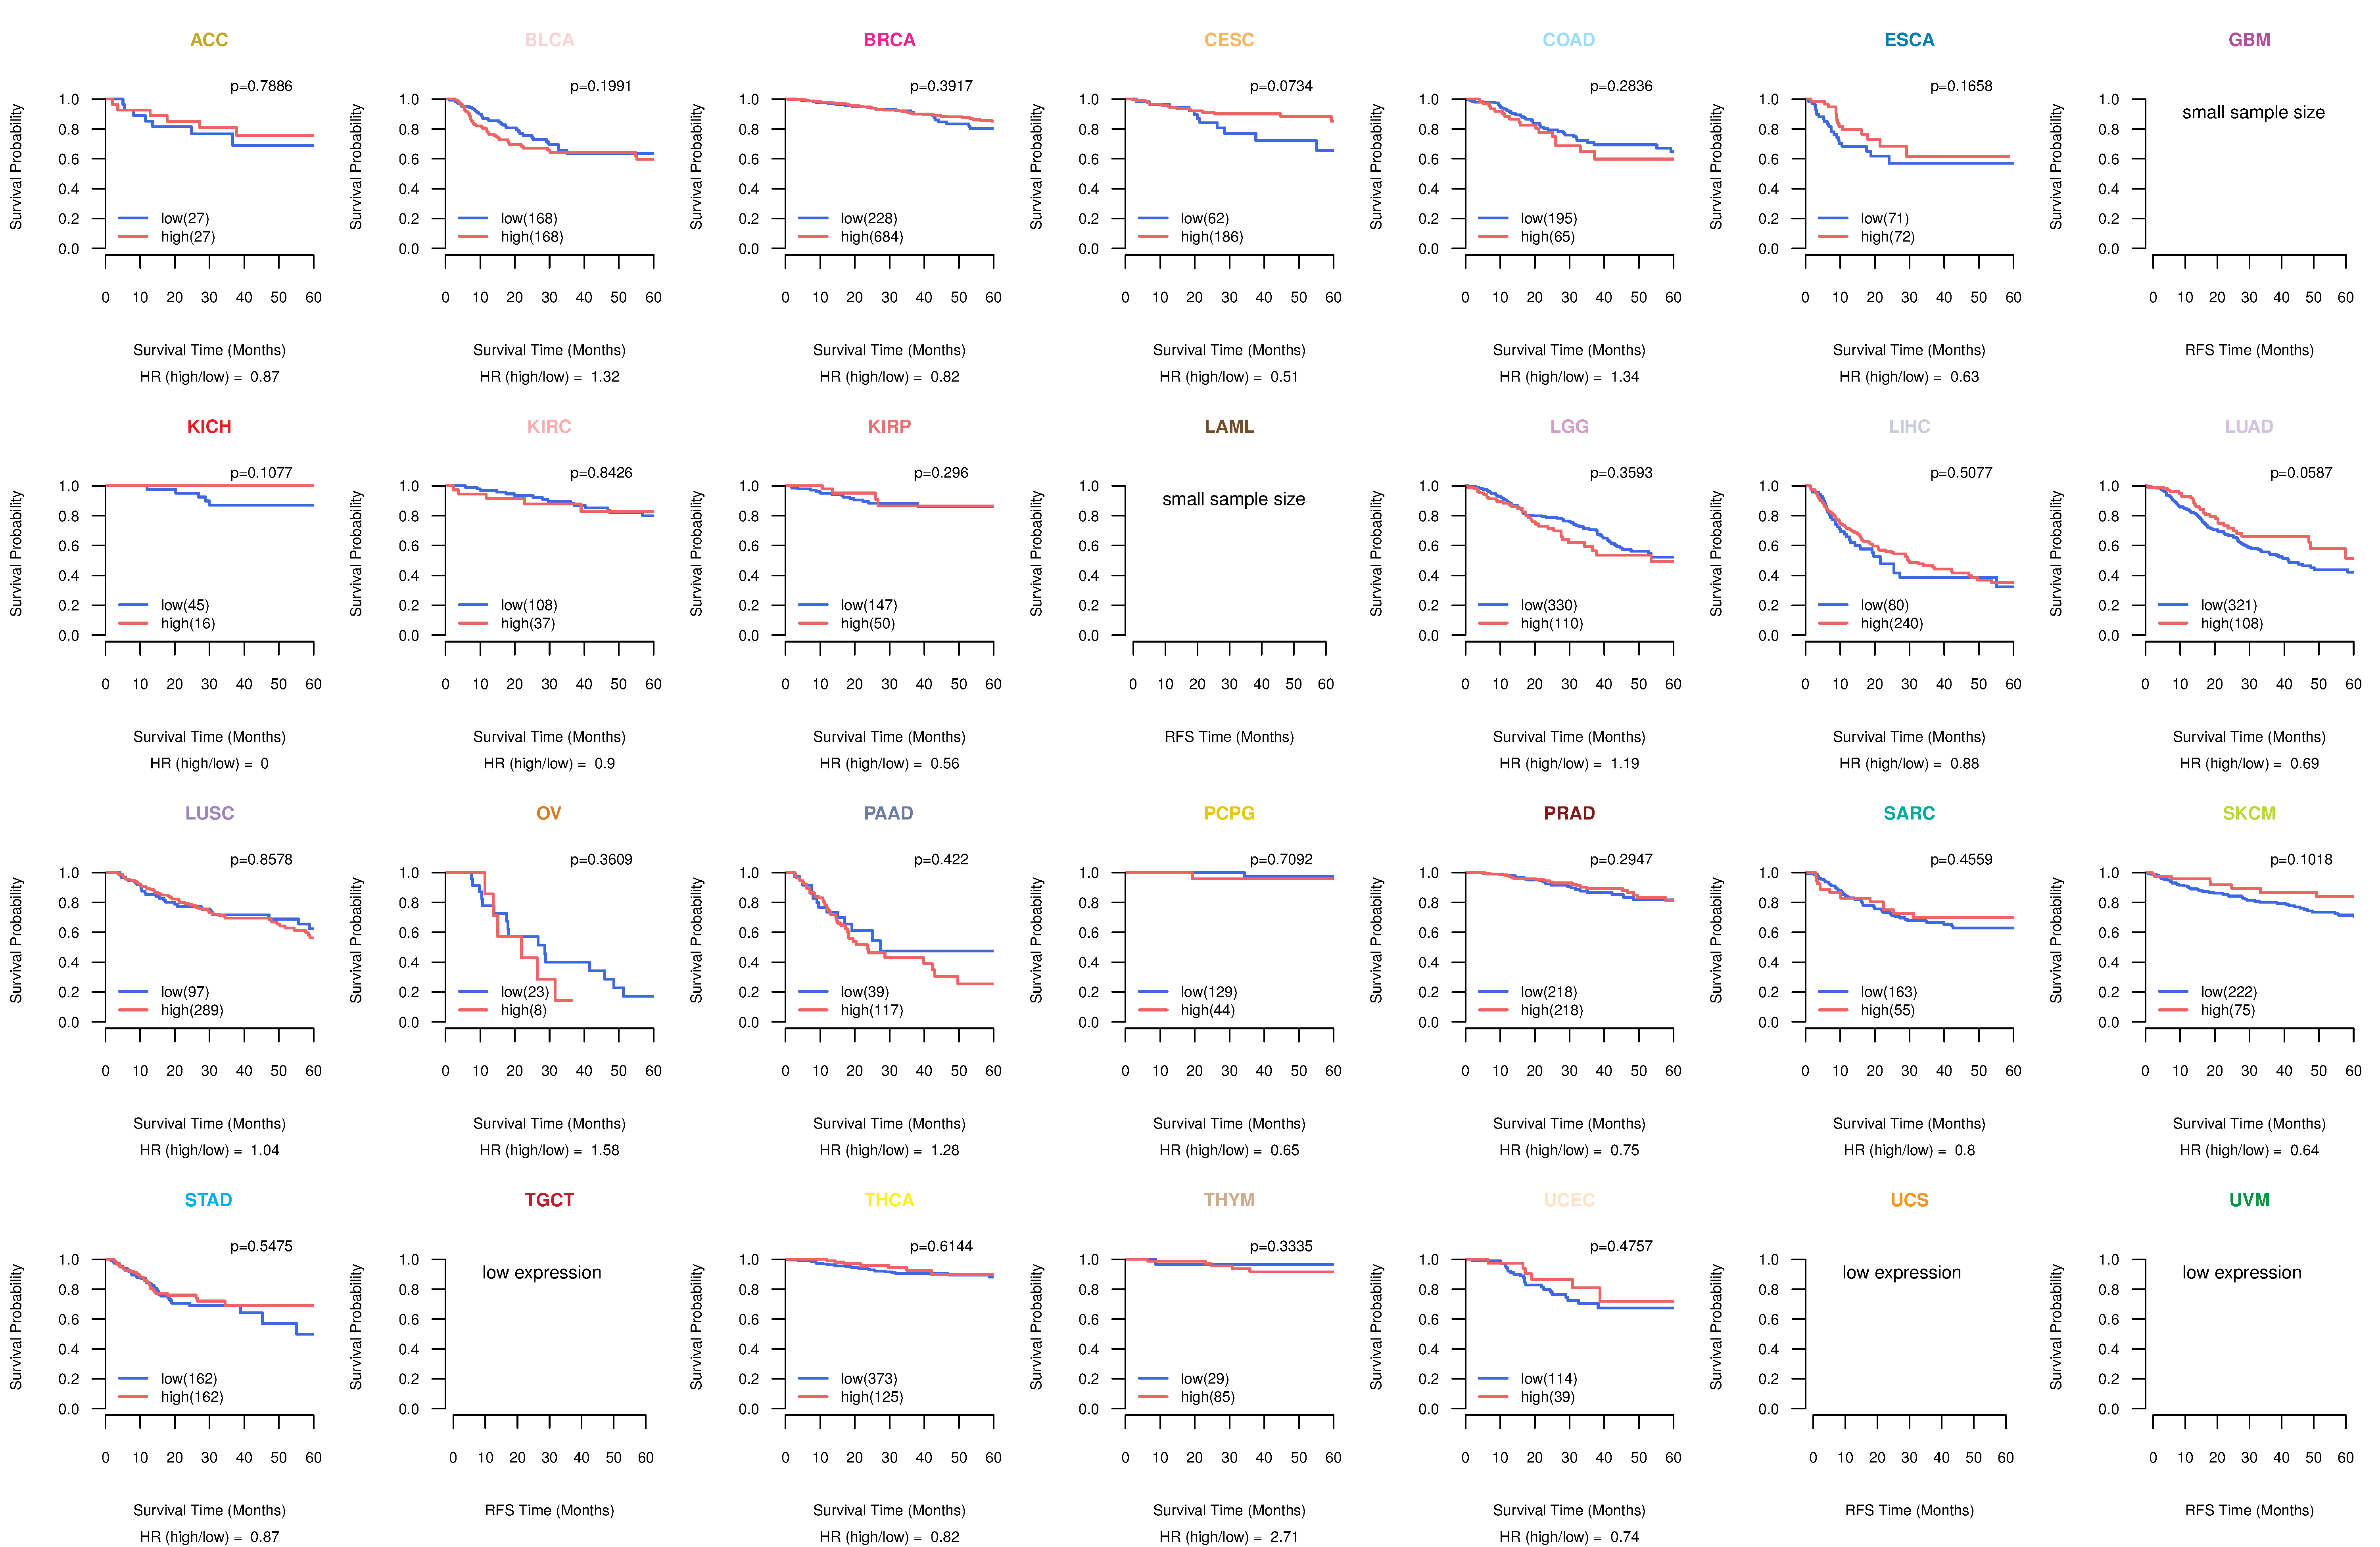
| Kaplan-Meier plots with logrank tests of overall survival (OS) using 28 cancer types (TCGA IlluminaHiSeq_RNASeqV2, pan-cancer normalized log2(norm_counts+1) data, version 2016-08-16) (TCGA clinicalMatrix, phenotype data, version 2016-04-27) * Click on the image to enlarge it in a new window. |
 |
| Kaplan-Meier plots with logrank test of relapse free survival (RFS) using 28 cancer types (TCGA IlluminaHiSeq_RNASeqV2, pan-cancer normalized log2(norm_counts+1) data, version 2016-08-16) (TCGA clinicalMatrix, phenotype data, version 2016-04-27) * Click on the image enlarge it in a new window. |
 |
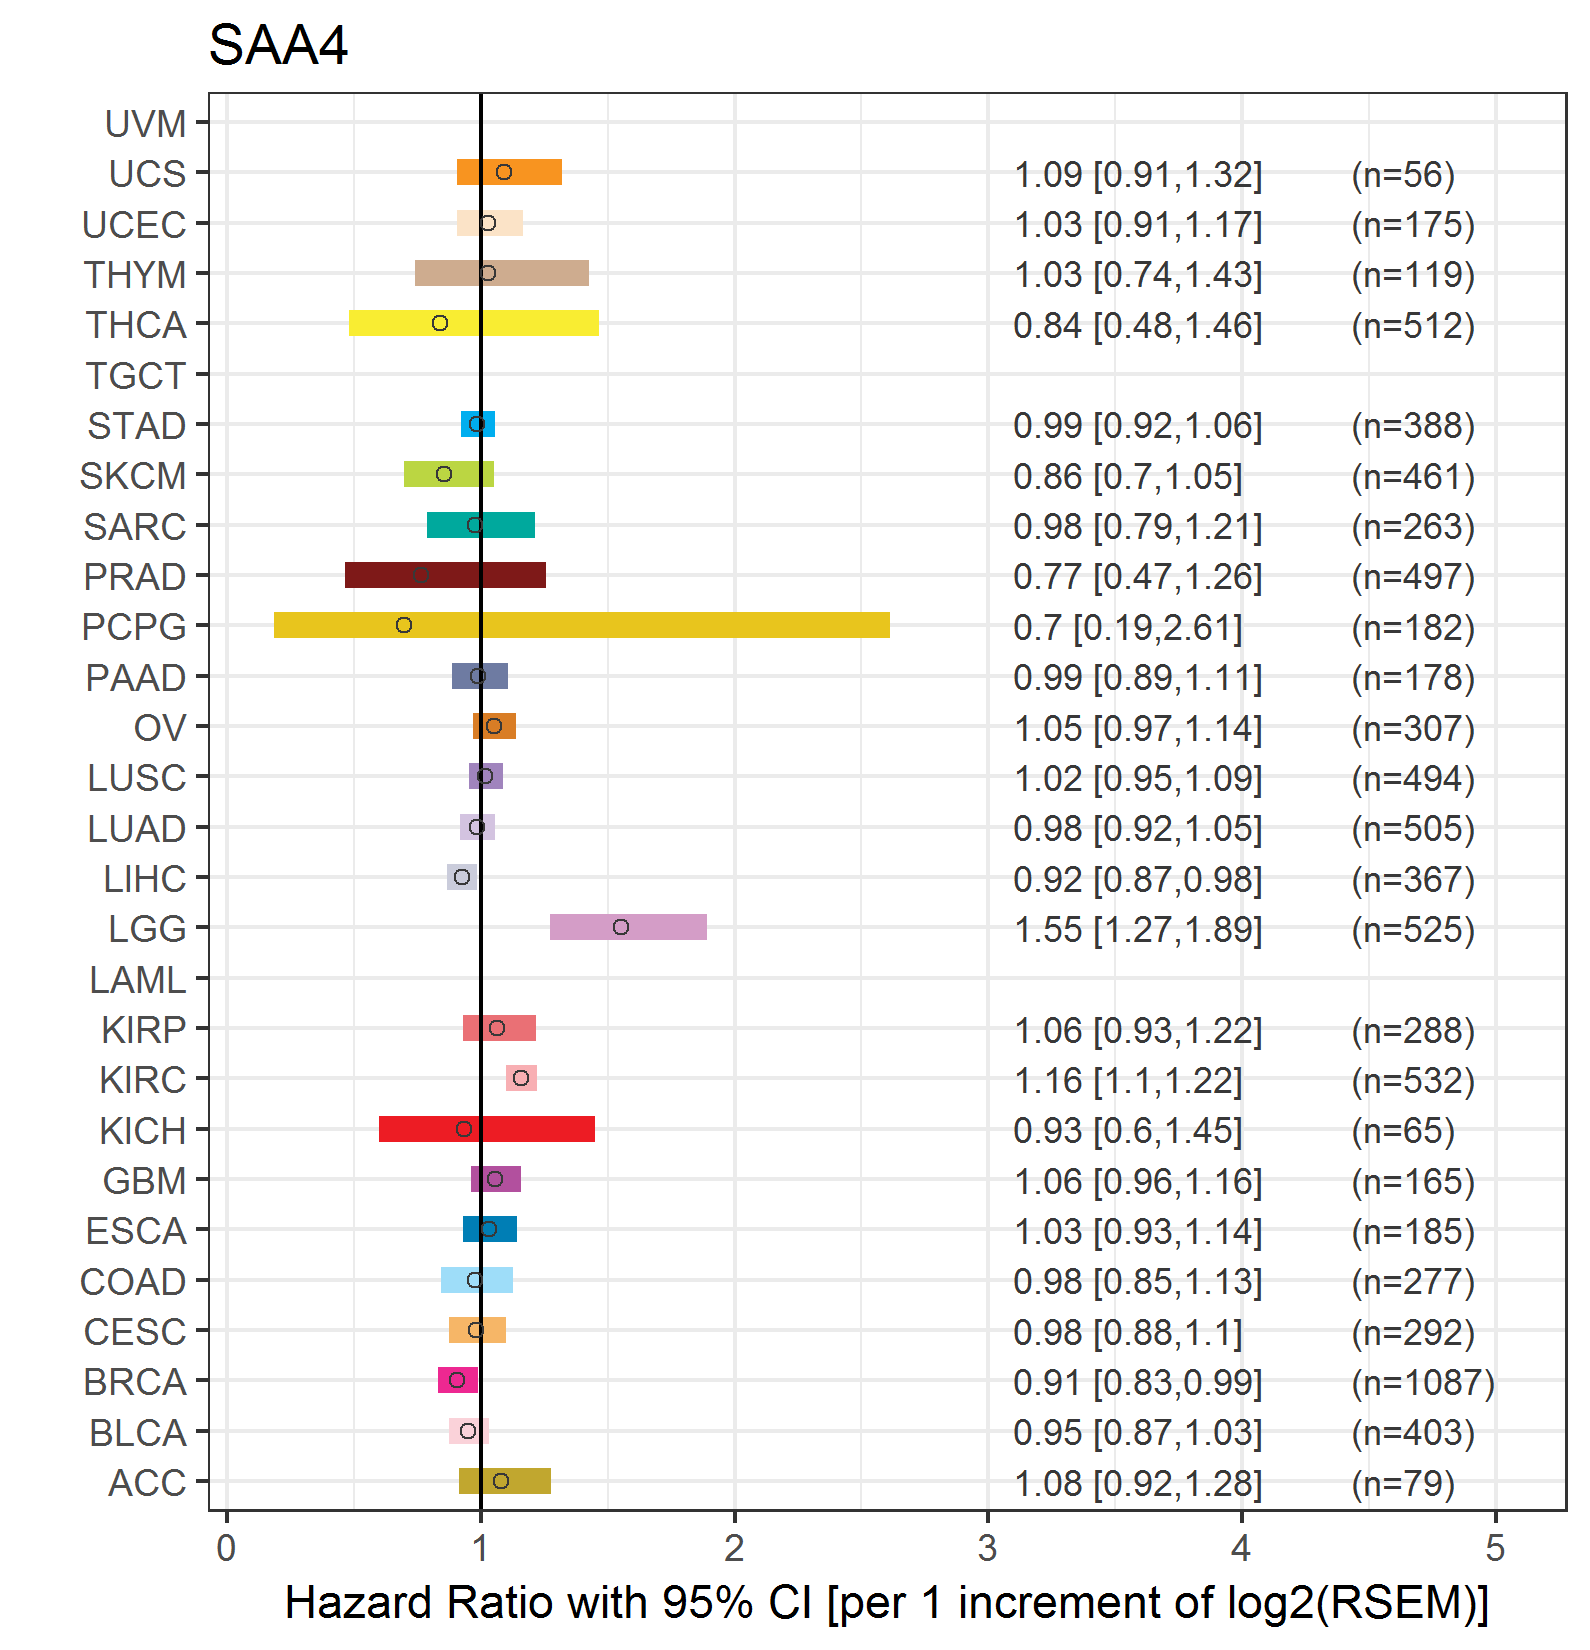
| Forest plot of Cox proportional hazard ratio (HR) and 95% CI of overall survival (OS) using 28 cancer types (TCGA IlluminaHiSeq_RNASeqV2, pan-cancer normalized log2(norm_counts+1) data, version 2016-08-16) (TCGA clinicalMatrix, phenotype data, version 2016-04-27) * Click on the image enlarge it in a new window. |
 |
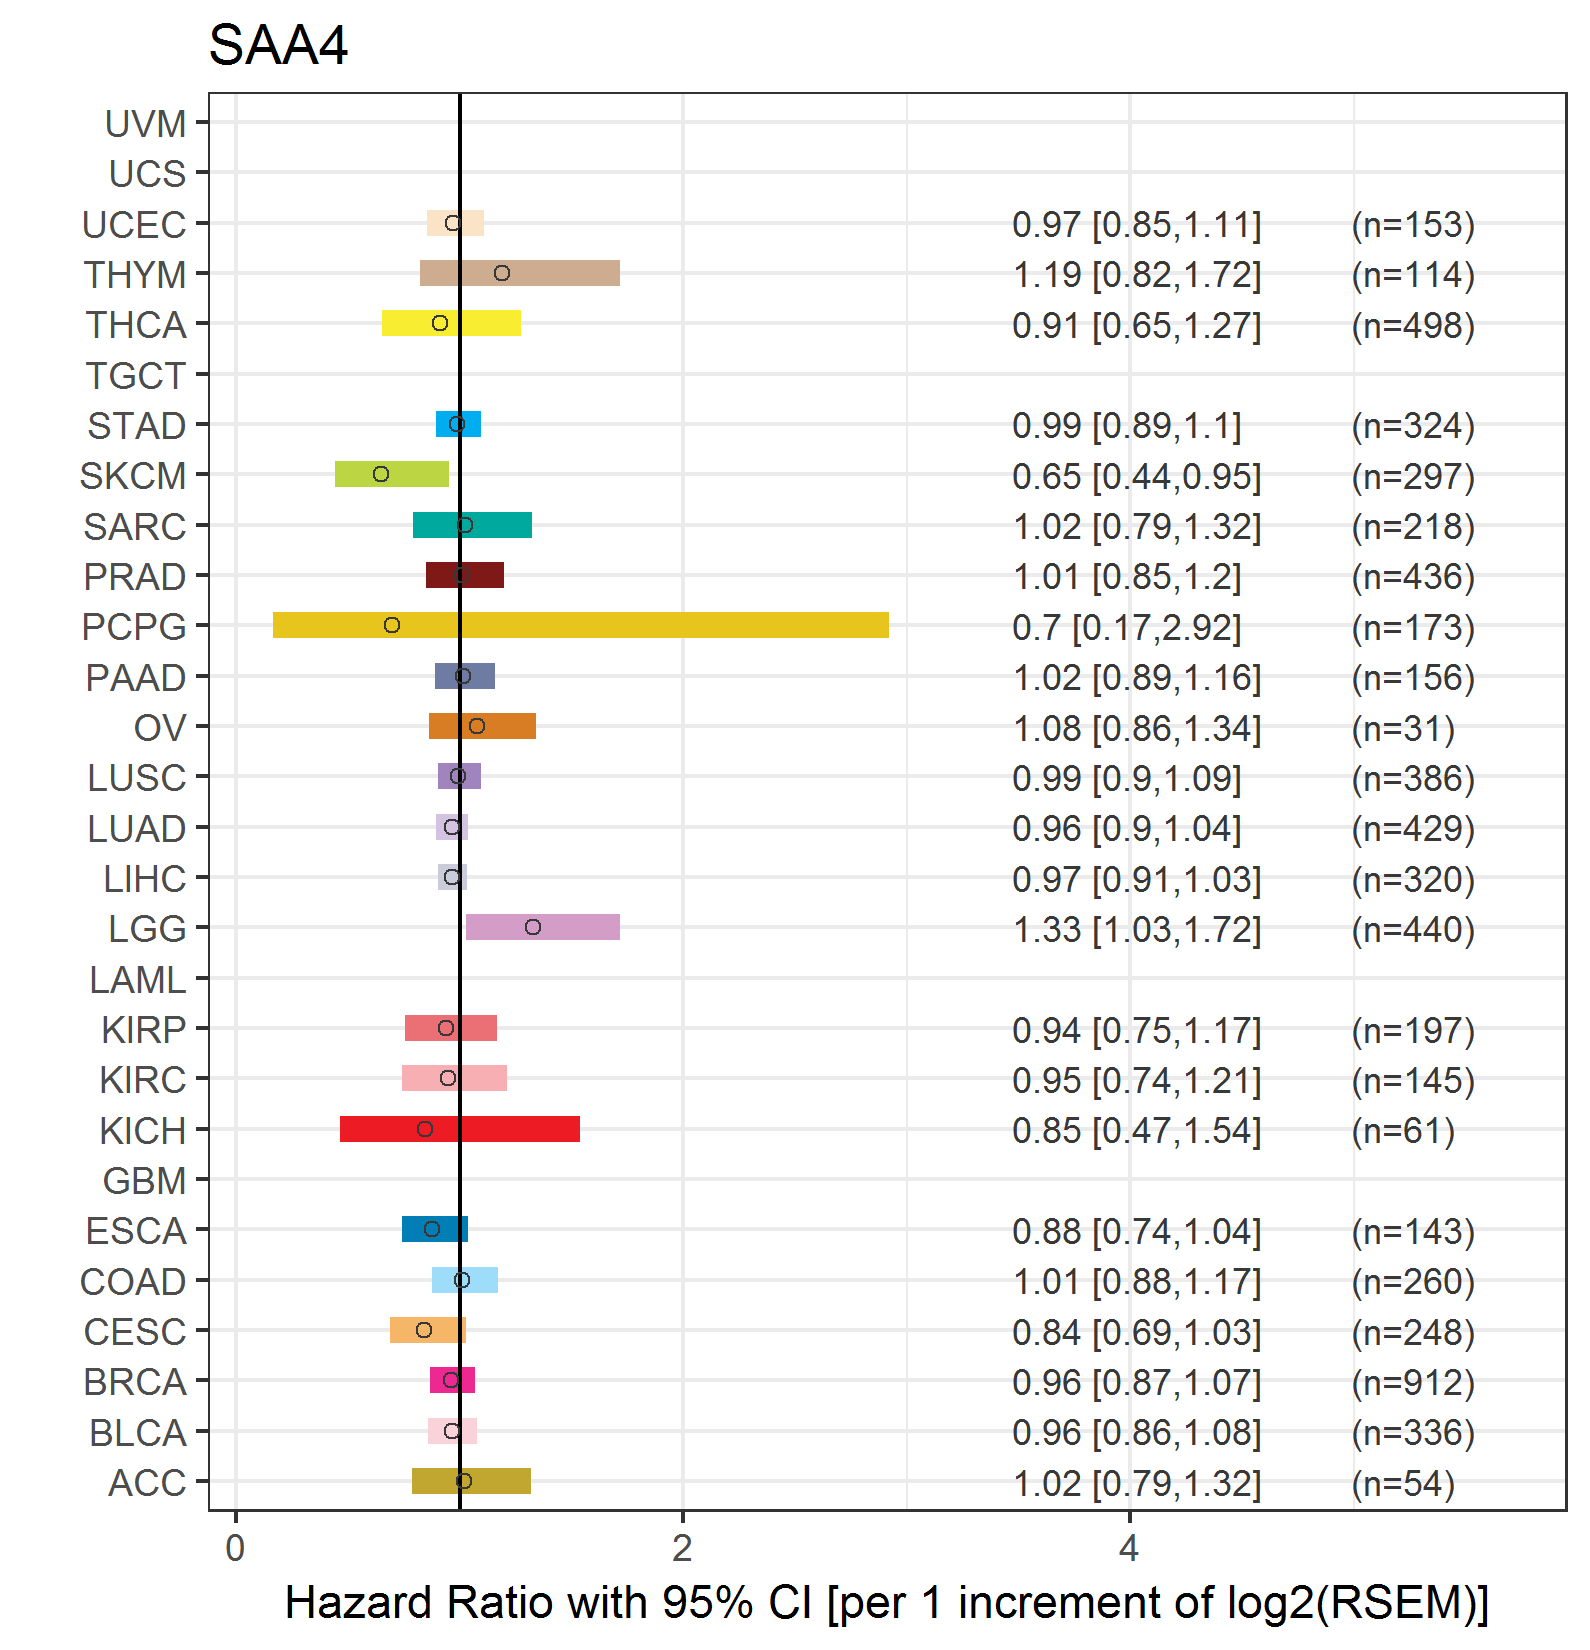
| Forest plot of Cox proportional hazard ratio (HR) and 95% CI of relapse free survival (RFS) using 28 cancer types (TCGA IlluminaHiSeq_RNASeqV2, pan-cancer normalized log2(norm_counts+1) data, version 2016-08-16) (TCGA clinicalMatrix, phenotype data, version 2016-04-27) * Click on the image enlarge it in a new window. |
 |
| Top |
| TissGeneClin for SAA4 |
| TissGeneDrug for SAA4 |
| Drug information targeting TissGene (DrugBank Version 5.0.6, 2017-04-01) |
| DrugBank ID | Drug name | Drug activity | Drug type | Drug status |
| Top |
| TissGeneDisease for SAA4 |
| Disease information associated with TissGene (DisGeNet, 2016-06-01) |
| Disease ID | Disease name | # pubmeds | Source |
| umls:C0010068 | Coronary heart disease | 1 | GAD |
| umls:C0017638 | Glioma | 1 | BeFree |
| umls:C0021368 | Inflammation | 1 | GAD |
| umls:C0021655 | Insulin Resistance | 1 | GAD |
| umls:C0029463 | Osteosarcoma | 1 | BeFree |
| umls:C0221014 | Reactive systemic amyloidosis | 1 | BeFree |
| umls:C0585442 | Osteosarcoma of bone | 1 | BeFree |
| umls:C3536715 | AA amyloidosis | 1 | BeFree |
|
Copyright 2016-Present - The University of Texas Health Science Center at Houston (UTHealth) Web File Viewing | How to Report, Fraud, Waste and Abuse | State of Texas | Statewide Search | Texas Homeland Security | Site Policies |