 |
| |
| |
| |
| |
| |
| |
|

| TissGeneSummary for MAGEA12 |
 Gene summary Gene summary |
| Basic gene information | Gene symbol | MAGEA12 |
| Gene name | ||
| Synonyms | ||
| Cytomap | UCSC genome browser: | |
| Type of gene | ||
| RefGenes | ||
| Description | ||
| Modification date | ||
| dbXrefs | ||
| Protein | UniProt: go to UniProt's Cross Reference DB Table | |
| Expression | CleanEX: HS_MAGEA12 | |
| BioGPS: 101060230 | ||
| Pathway | NCI Pathway Interaction Database: MAGEA12 | |
| KEGG: MAGEA12 | ||
| REACTOME: MAGEA12 | ||
| Pathway Commons: MAGEA12 | ||
| Context | iHOP: MAGEA12 | |
| ligand binding site mutation search in PubMed: MAGEA12 | ||
| UCL Cancer Institute: MAGEA12 | ||
| Assigned class in TissGDB* | B | |
| Included tissue-specific gene expression resources | HPA,TiGER,GTEx | |
| Specific-tissues in normal samples (assigned by TissGDB using HPA, TiGER, and GTEx) | SkinTestis | |
| Cancer types related to the specific-tissues in cancer samples (assigned by TissGDB using TCGA) | SKCMTGCT | |
| Reference showing the relevant tissue of MAGEA12 | ||
| Description by TissGene annotations | ||
| * Class A consists of genes with literature evidence and is part of the cTissGenes. Class B consists of only cTissGenes without additional evidence. The remaining genes belong to Class C. |
| Gene ontology having evidence of Inferred from Direct Assay (IDA) from Entrez |
| GO ID | GO term | PubMed ID |
| Top |
| TissGeneExp for MAGEA12 |
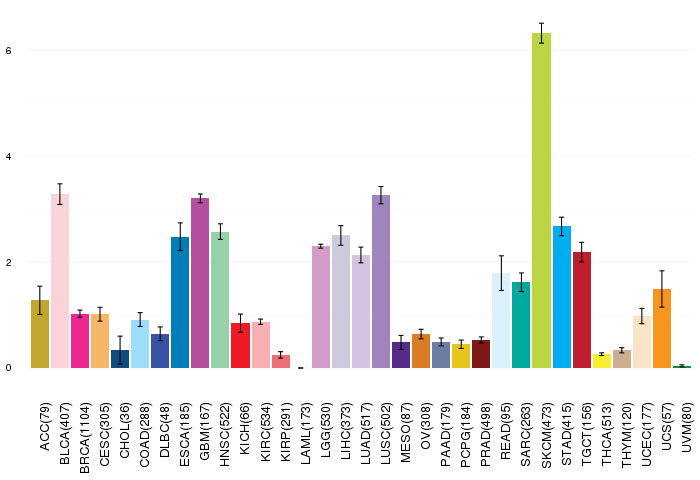
| Gene expressions across 28 cancer types (X-axis: cancer type and Y-axis: log2(norm_counts+1)) (TCGA IlluminaHiSeq_RNASeqV2, pan-cancer normalized log2(norm_counts+1) data, version 2016-08-16) |
 |
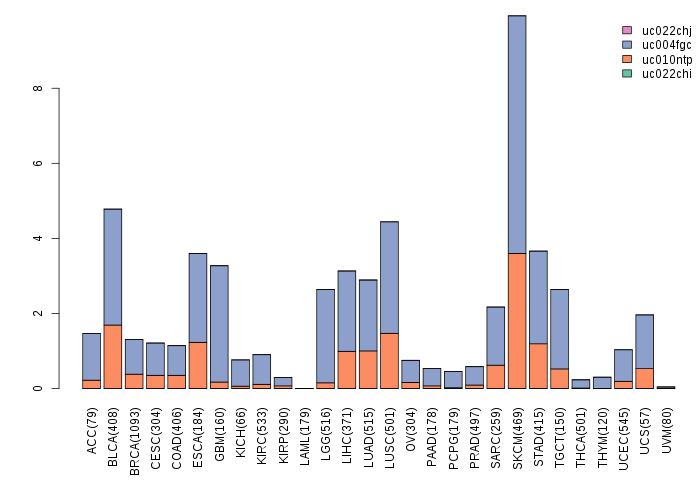
| Gene isoform expressions across 28 cancer types (X-axis: cancer type and Y-axis: log2(norm_counts+1)) (TCGA pan-cancer tcga_rsem_isoform_tpm, version 2016-09-01) |
 |
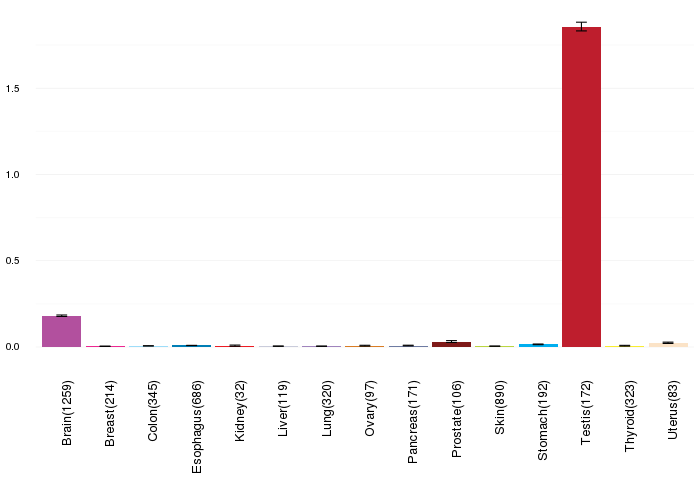
| Gene expressions across normal tissues of GTEx data (GTEx GTEx_Analysis_v6_RNA-seq_RNA-SeQCv1.1.8_gene_rpkm.gct) - Here, we shows the matched tissue types only among our 28 cancer types. |
 |
| Different expressions across 14 cancer types with more than 10 samples between matched tumors and normals (X-axis: cancer type and Y-axis: log2(norm_counts+1)) (TCGA IlluminaHiSeq_RNASeqV2, pan-cancer normalized log2(norm_counts+1) data, version 2016-08-16) |
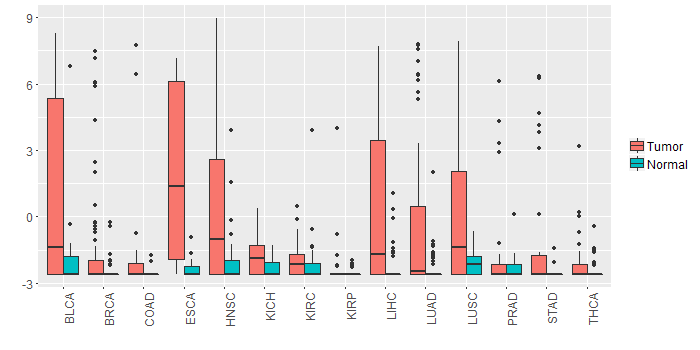 |
| - Significantly differentially expressed cancer types and information. (|Fold change|>1 and FDR<0.05) |
| Cancer type | Mean(exp) in tumor | Mean(exp) in matched normal | Log2FC | P-val. | FDR |
| LUSC | 0.131105327 | -2.053114281 | 2.184219608 | 3.34E-05 | 7.23E-05 |
| LIHC | 0.587070699 | -2.235947301 | 2.823018 | 3.97E-06 | 1.87E-05 |
| STAD | -0.978041426 | -2.525678926 | 1.5476375 | 0.00487 | 0.018851343 |
| LUAD | -0.459978818 | -2.305965025 | 1.845986207 | 0.000155 | 0.000379962 |
| HNSC | 0.605192513 | -2.041105161 | 2.646297674 | 8.02E-05 | 0.000367515 |
| Top |
| TissGene-miRNA for MAGEA12 |
| Significantly anti-correlated miRNAs of TissGene across 28 cancer types (Gene-miRNA relations from TargetScanHuman Relsease 7.1, Conserved_Site_Context_Scores.txt.zip, 06.01.2016) (TCGA IlluminaHiSeq_miRNASeq, log2(RPM+1) data, version 2016-11-21) (TCGA IlluminaHiSeq_RNASeqV2, log2(normalized_count+1) data, version 2016-08-16) (Spearman’s Rank Correlation (p-value<0.05 and coefficient<-0.25)) |
| Cancer type | miRNA id | miRNA accession | P-val. | Coeff. | # samples |
| Top |
| TissGeneMut for MAGEA12 |
| TissGeneSNV for MAGEA12 |
| nsSNV counts per each loci. Different colors of circles represent different cancer types. Circle size denotes number of samples. (TCGA somatic mutation (SNPs and small INDELs) data, version 2016-04-25) * Click on the image to enlarge it in a new window. |
 |
 |
| Somatic nucleotide variants of TissGene across 28 cancer types (X-axis: cancer type and Y-axis: % of mutated samples) The numbers in parentheses are numbers of samples with mutation (nsSNVs). (TCGA somatic mutation (SNPs and small INDELs) data, version 2016-04-25) |
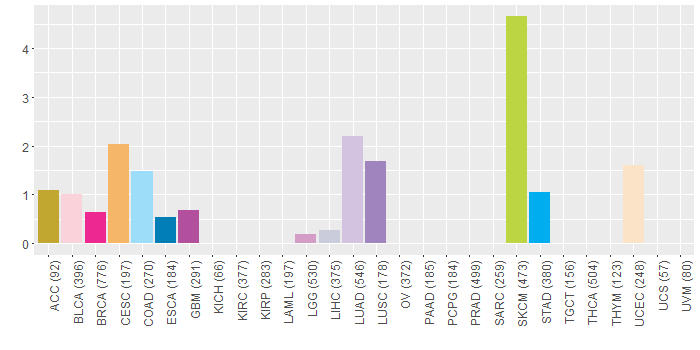 |
| - nsSNVs sorted by frequency. |
| AAchange | Cancer type | # samples |
| p.F130V | CESC | 3 |
| p.E90Q | CESC | 3 |
| p.L109I | CESC | 3 |
| p.V107A | CESC | 3 |
| p.A114V | CESC | 3 |
| p.G20R | SKCM | 3 |
| p.S300F | SKCM | 2 |
| p.R125* | SKCM | 2 |
| p.R125Q | SKCM | 2 |
| p.R125X | SKCM | 2 |
| p.T247I | CESC | 2 |
| p.I140L | CESC | 2 |
| p.G296E | CESC | 2 |
| p.S81R | CESC | 2 |
| p.Q19R | CESC | 2 |
| p.A108P | LUAD | 1 |
| p.P65T | COAD | 1 |
| p.P242H | UCEC | 1 |
| p.N76K | UCEC | 1 |
| p.R171S | LIHC | 1 |
| p.L120V | HNSC | 1 |
| p.K123T | ESCA | 1 |
| p.E52D | LUSC | 1 |
| p.F143C | ACC | 1 |
| p.V166A | STAD | 1 |
| p.S87P | LUAD | 1 |
| p.P303H | LUAD | 1 |
| p.H9Q | UCEC | 1 |
| p.S43A | LUAD | 1 |
| p.P62L | SKCM | 1 |
| p.P31S | SKCM | 1 |
| p.D192E | LGG | 1 |
| p.D265N | SKCM | 1 |
| p.E235K | UCEC | 1 |
| p.L291V | LUAD | 1 |
| p.E37Q | CESC | 1 |
| p.R51Q | BLCA | 1 |
| p.S294G | CESC | 1 |
| p.D214N | CESC | 1 |
| p.P275S | SKCM | 1 |
| p.S69F | BLCA | 1 |
| p.P59L | LUSC | 1 |
| p.I209V | STAD | 1 |
| p.E235K | SKCM | 1 |
| p.P217S | SKCM | 1 |
| p.E91Q | BRCA | 1 |
| p.T247M | LUAD | 1 |
| p.P266S | STAD | 1 |
| p.G94V | GBM | 1 |
| p.Q248H | COAD | 1 |
| p.R171H | COAD | 1 |
| p.F130I | HNSC | 1 |
| p.Q19R | HNSC | 1 |
| p.E314Q | HNSC | 1 |
| p.Y269* | LUAD | 1 |
| p.D214N | SKCM | 1 |
| p.V139I | LUAD | 1 |
| p.D84N | SKCM | 1 |
| p.G137E | CESC | 1 |
| p.F239I | STAD | 1 |
| p.V117I | SKCM | 1 |
| p.K292R | BLCA | 1 |
| p.P217H | BRCA | 1 |
| p.E313K | SKCM | 1 |
| p.G263C | LUAD | 1 |
| p.T247I | LUAD | 1 |
| p.P129Q | LUAD | 1 |
| p.D187N | SKCM | 1 |
| p.K198* | BRCA | 1 |
| p.P61S | SKCM | 1 |
| p.G183V | LUSC | 1 |
| p.G67V | LUAD | 1 |
| p.E253K | SKCM | 1 |
| p.E128K | BRCA | 1 |
| p.K198N | GBM | 1 |
| p.Q92E | CESC | 1 |
| p.I221M | BRCA | 1 |
| p.L250F | BLCA | 1 |
| p.K123N | LUAD | 1 |
| p.F143C | CESC | 1 |
| p.G20V | SKCM | 1 |
| p.E90K | SKCM | 1 |
| p.R259Q | COAD | 1 |
| Top |
| TissGeneCNV for MAGEA12 |
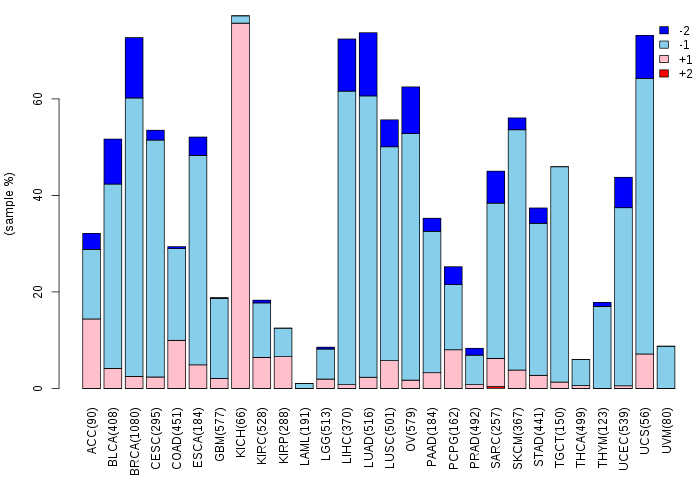
| Copy number variations of TissGene across 28 cancer types (X-axis: cancer type and Y-axis: % of CNV samples) (TCGA Gistic2_CopyNumber_Gistic2_all_data_by_genes, Gistic2 copy number data, version 2016-08-16) |
 |
| Top |
| TissGeneFusions for MAGEA12 |
| Fusion genes including TissGene (ChimerDB 3.0, 2016-12-01 and TCGA fusion Portal 2015-12-01) |
| Database | Src | Cancer type | Sample | Fusion gene | ORF | 5'-gene BP | 3'-gene BP |
| Top |
| TissGeneNet for MAGEA12 |
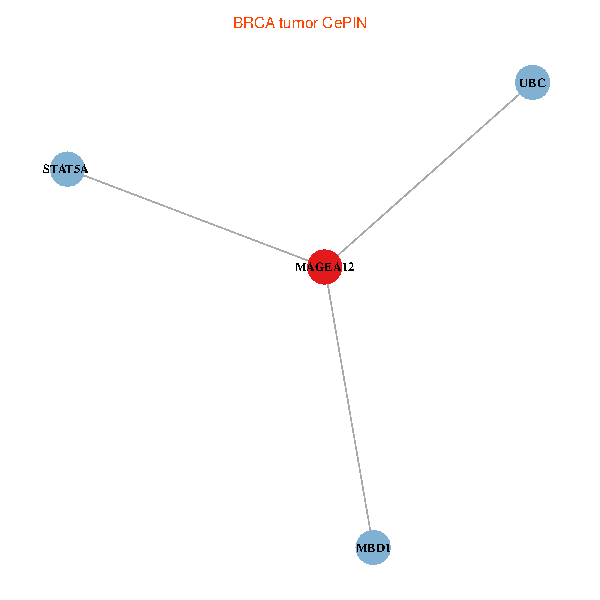
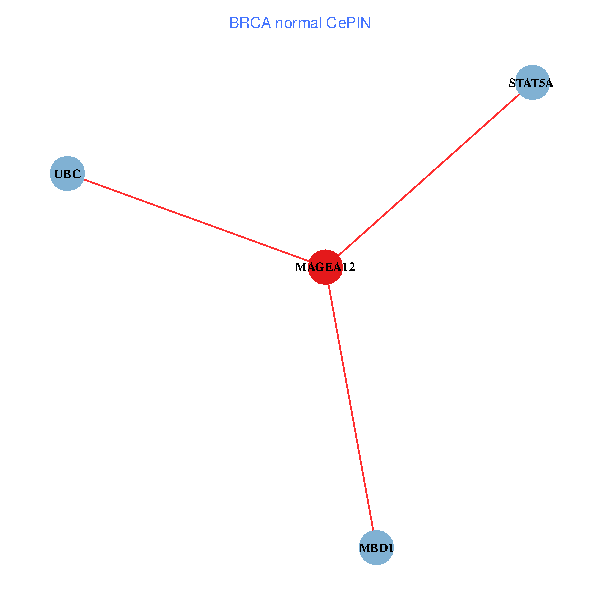
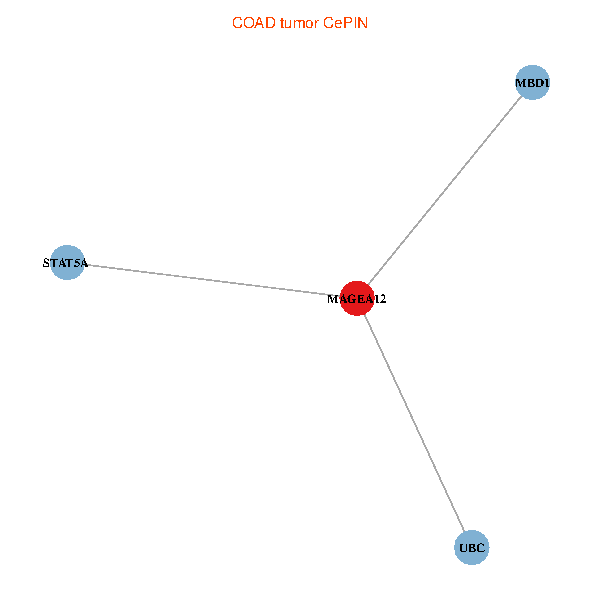
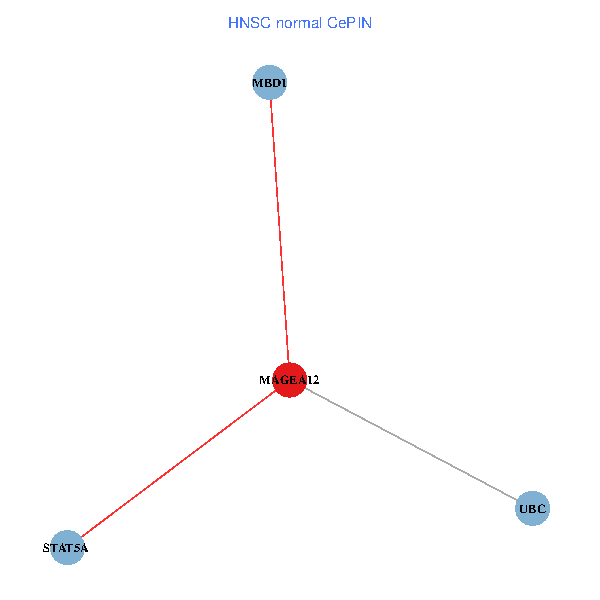
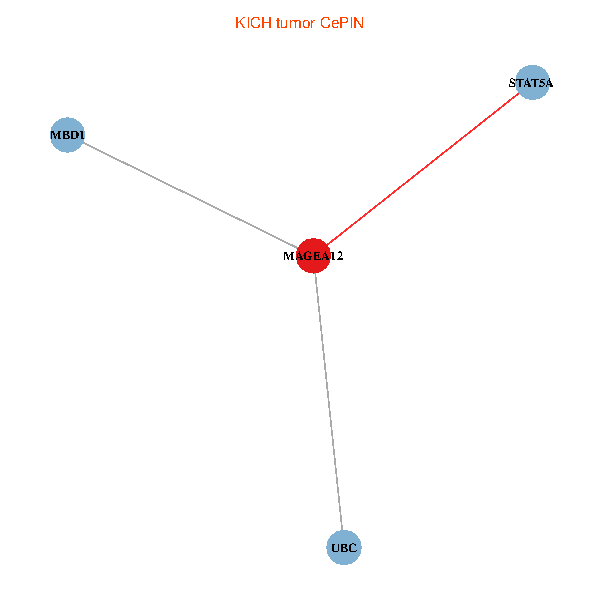
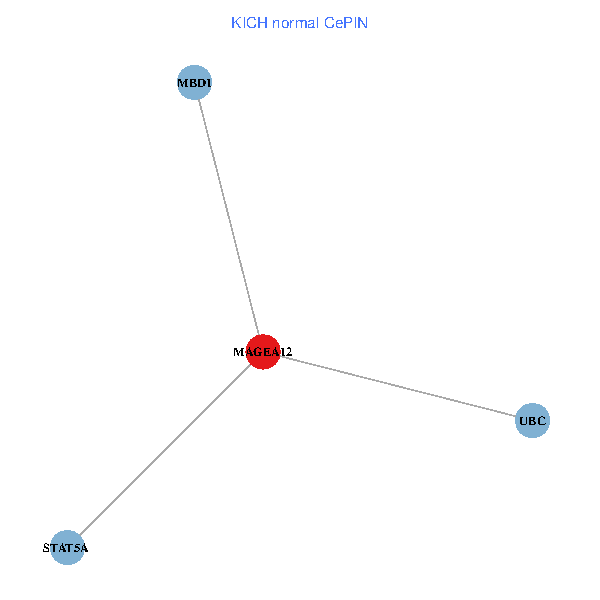
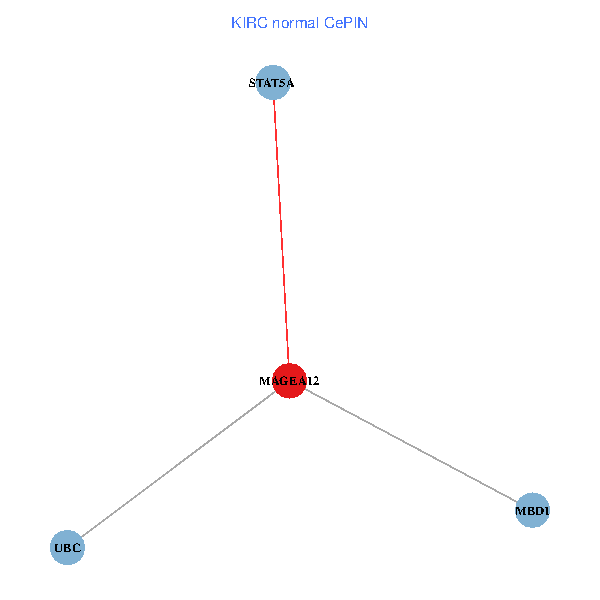
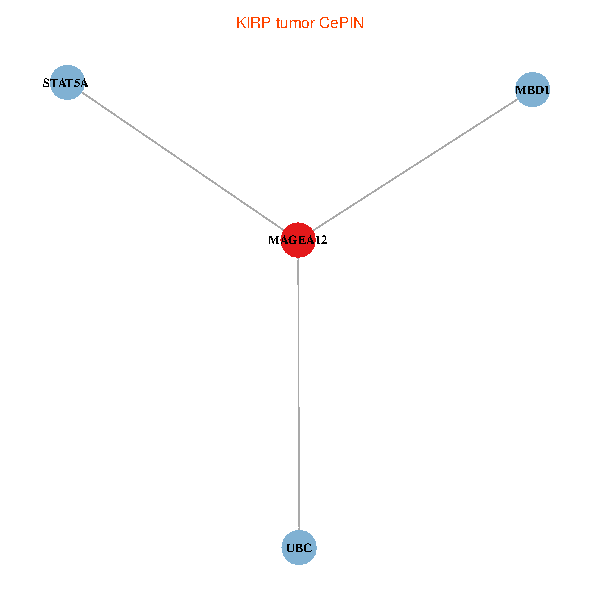
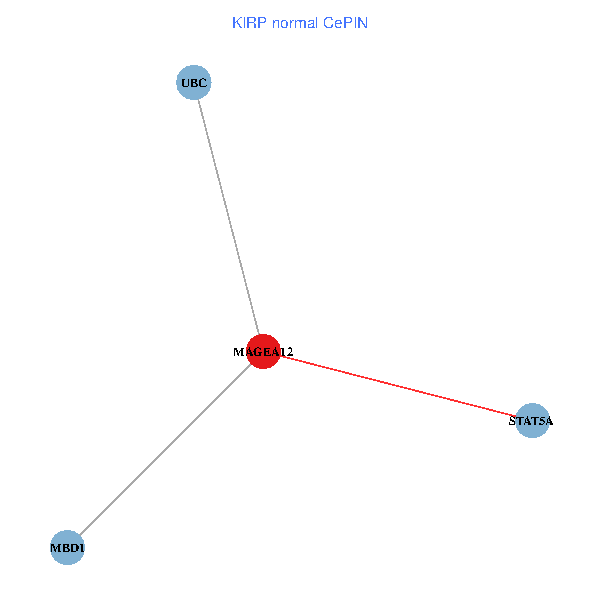
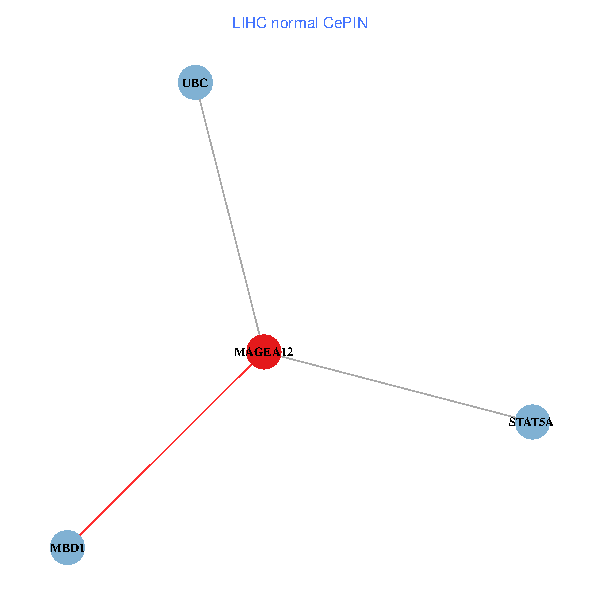
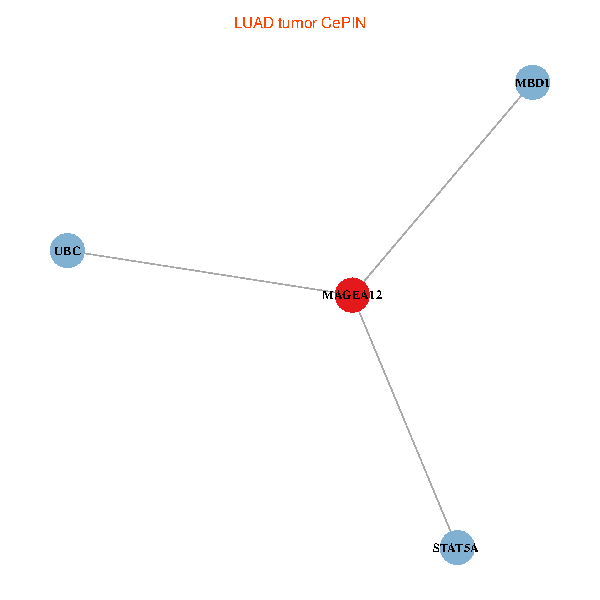
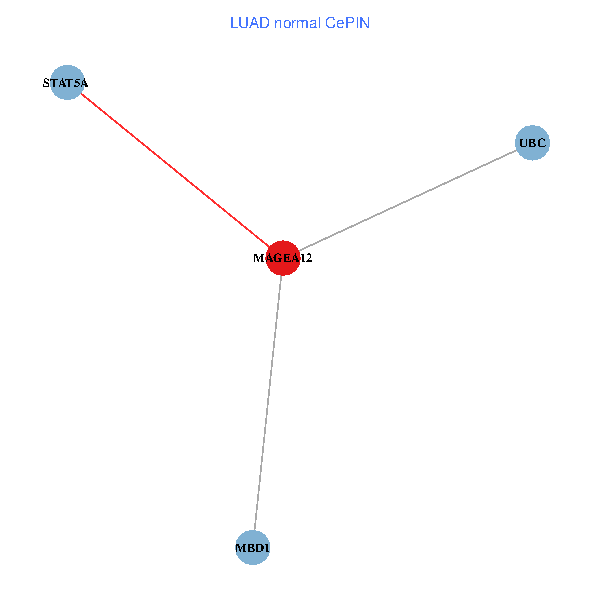
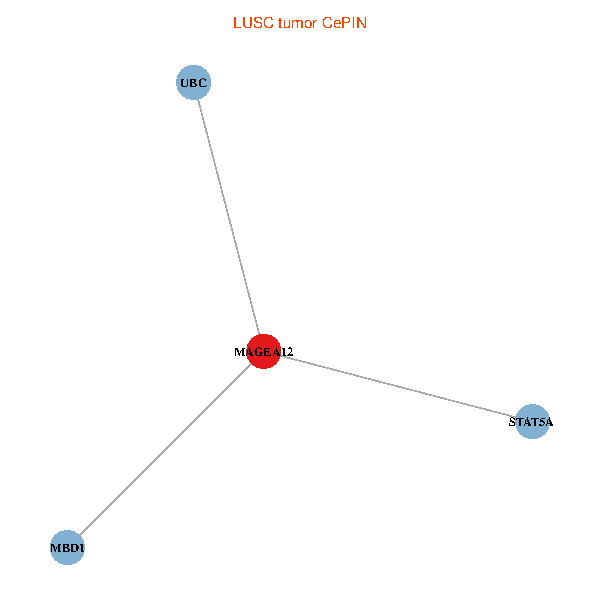
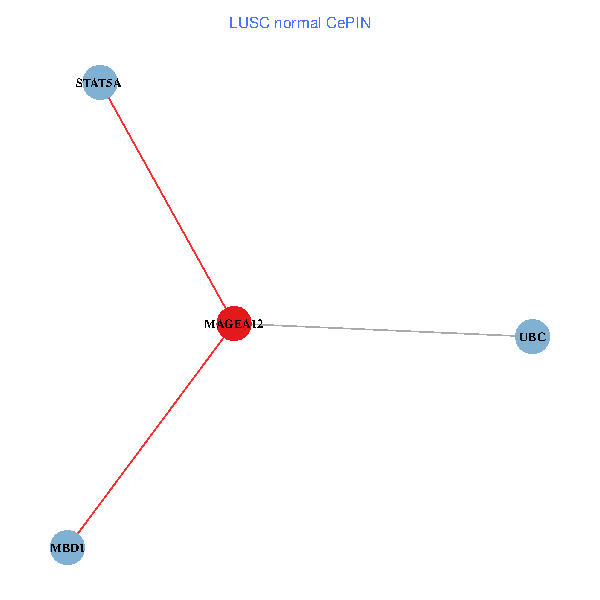
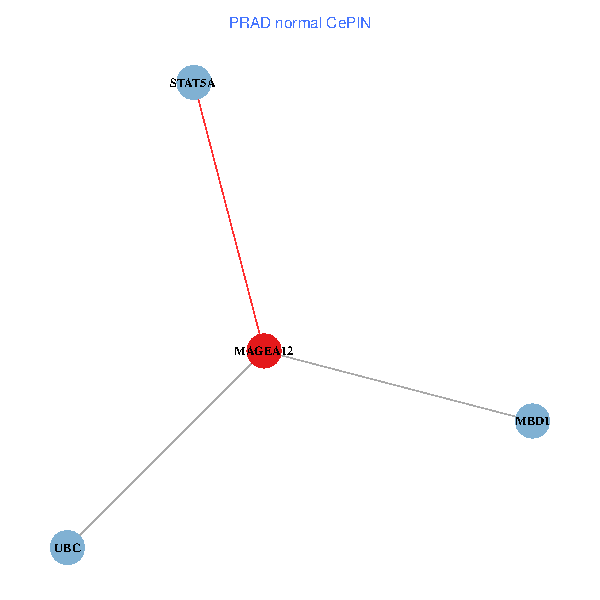
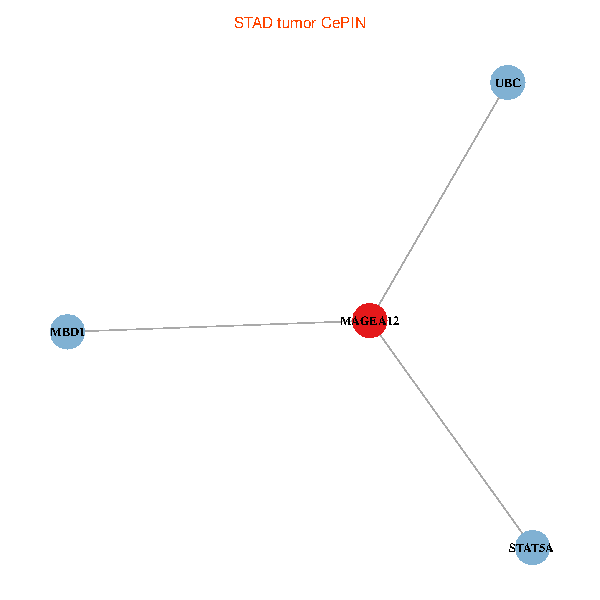
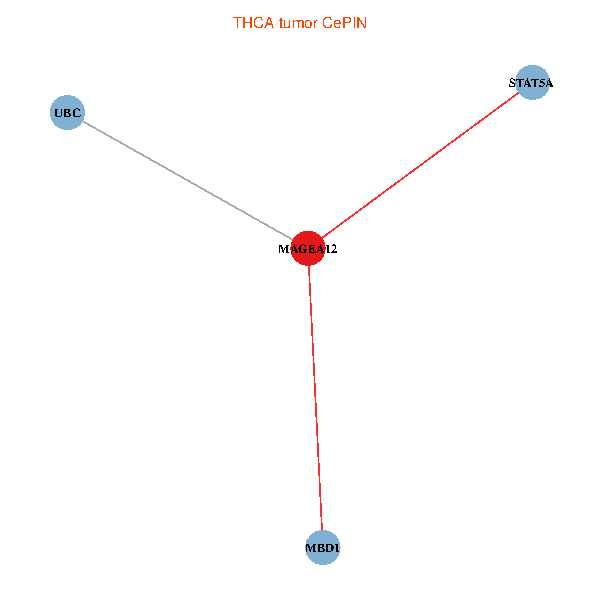
| Co-expressed gene networks based on protein-protein interaction data (CePIN) (TCGA IlluminaHiSeq_RNASeqV2, pan-cancer normalized log2(norm_counts+1) data, version 2016-08-16) (PINA2 ppi data) |
| BRCA (tumor) | BRCA (normal) |
| MAGEA12, UBC, MBD1, STAT5A (tumor) | MAGEA12, UBC, MBD1, STAT5A (normal) |
 |  |
| COAD (tumor) | COAD (normal) |
| MAGEA12, UBC, MBD1, STAT5A (tumor) | MAGEA12, UBC, MBD1, STAT5A (normal) |
 |  |
| HNSC (tumor) | HNSC (normal) |
| MAGEA12, UBC, MBD1, STAT5A (tumor) | MAGEA12, UBC, MBD1, STAT5A (normal) |
 |  |
| KICH (tumor) | KICH (normal) |
| MAGEA12, UBC, MBD1, STAT5A (tumor) | MAGEA12, UBC, MBD1, STAT5A (normal) |
 |  |
| KIRC (tumor) | KIRC (normal) |
| MAGEA12, UBC, MBD1, STAT5A (tumor) | MAGEA12, UBC, MBD1, STAT5A (normal) |
 |  |
| KIRP (tumor) | KIRP (normal) |
| MAGEA12, UBC, MBD1, STAT5A (tumor) | MAGEA12, UBC, MBD1, STAT5A (normal) |
 |  |
| LIHC (tumor) | LIHC (normal) |
| MAGEA12, UBC, MBD1, STAT5A (tumor) | MAGEA12, UBC, MBD1, STAT5A (normal) |
 |  |
| LUAD (tumor) | LUAD (normal) |
| MAGEA12, UBC, MBD1, STAT5A (tumor) | MAGEA12, UBC, MBD1, STAT5A (normal) |
 |  |
| LUSC (tumor) | LUSC (normal) |
| MAGEA12, UBC, MBD1, STAT5A (tumor) | MAGEA12, UBC, MBD1, STAT5A (normal) |
 |  |
| PRAD (tumor) | PRAD (normal) |
| MAGEA12, UBC, MBD1, STAT5A (tumor) | MAGEA12, UBC, MBD1, STAT5A (normal) |
 |  |
| STAD (tumor) | STAD (normal) |
| MAGEA12, UBC, MBD1, STAT5A (tumor) | MAGEA12, UBC, MBD1, STAT5A (normal) |
 |  |
| THCA (tumor) | THCA (normal) |
| MAGEA12, UBC, MBD1, STAT5A (tumor) | MAGEA12, UBC, MBD1, STAT5A (normal) |
 |  |
| Top |
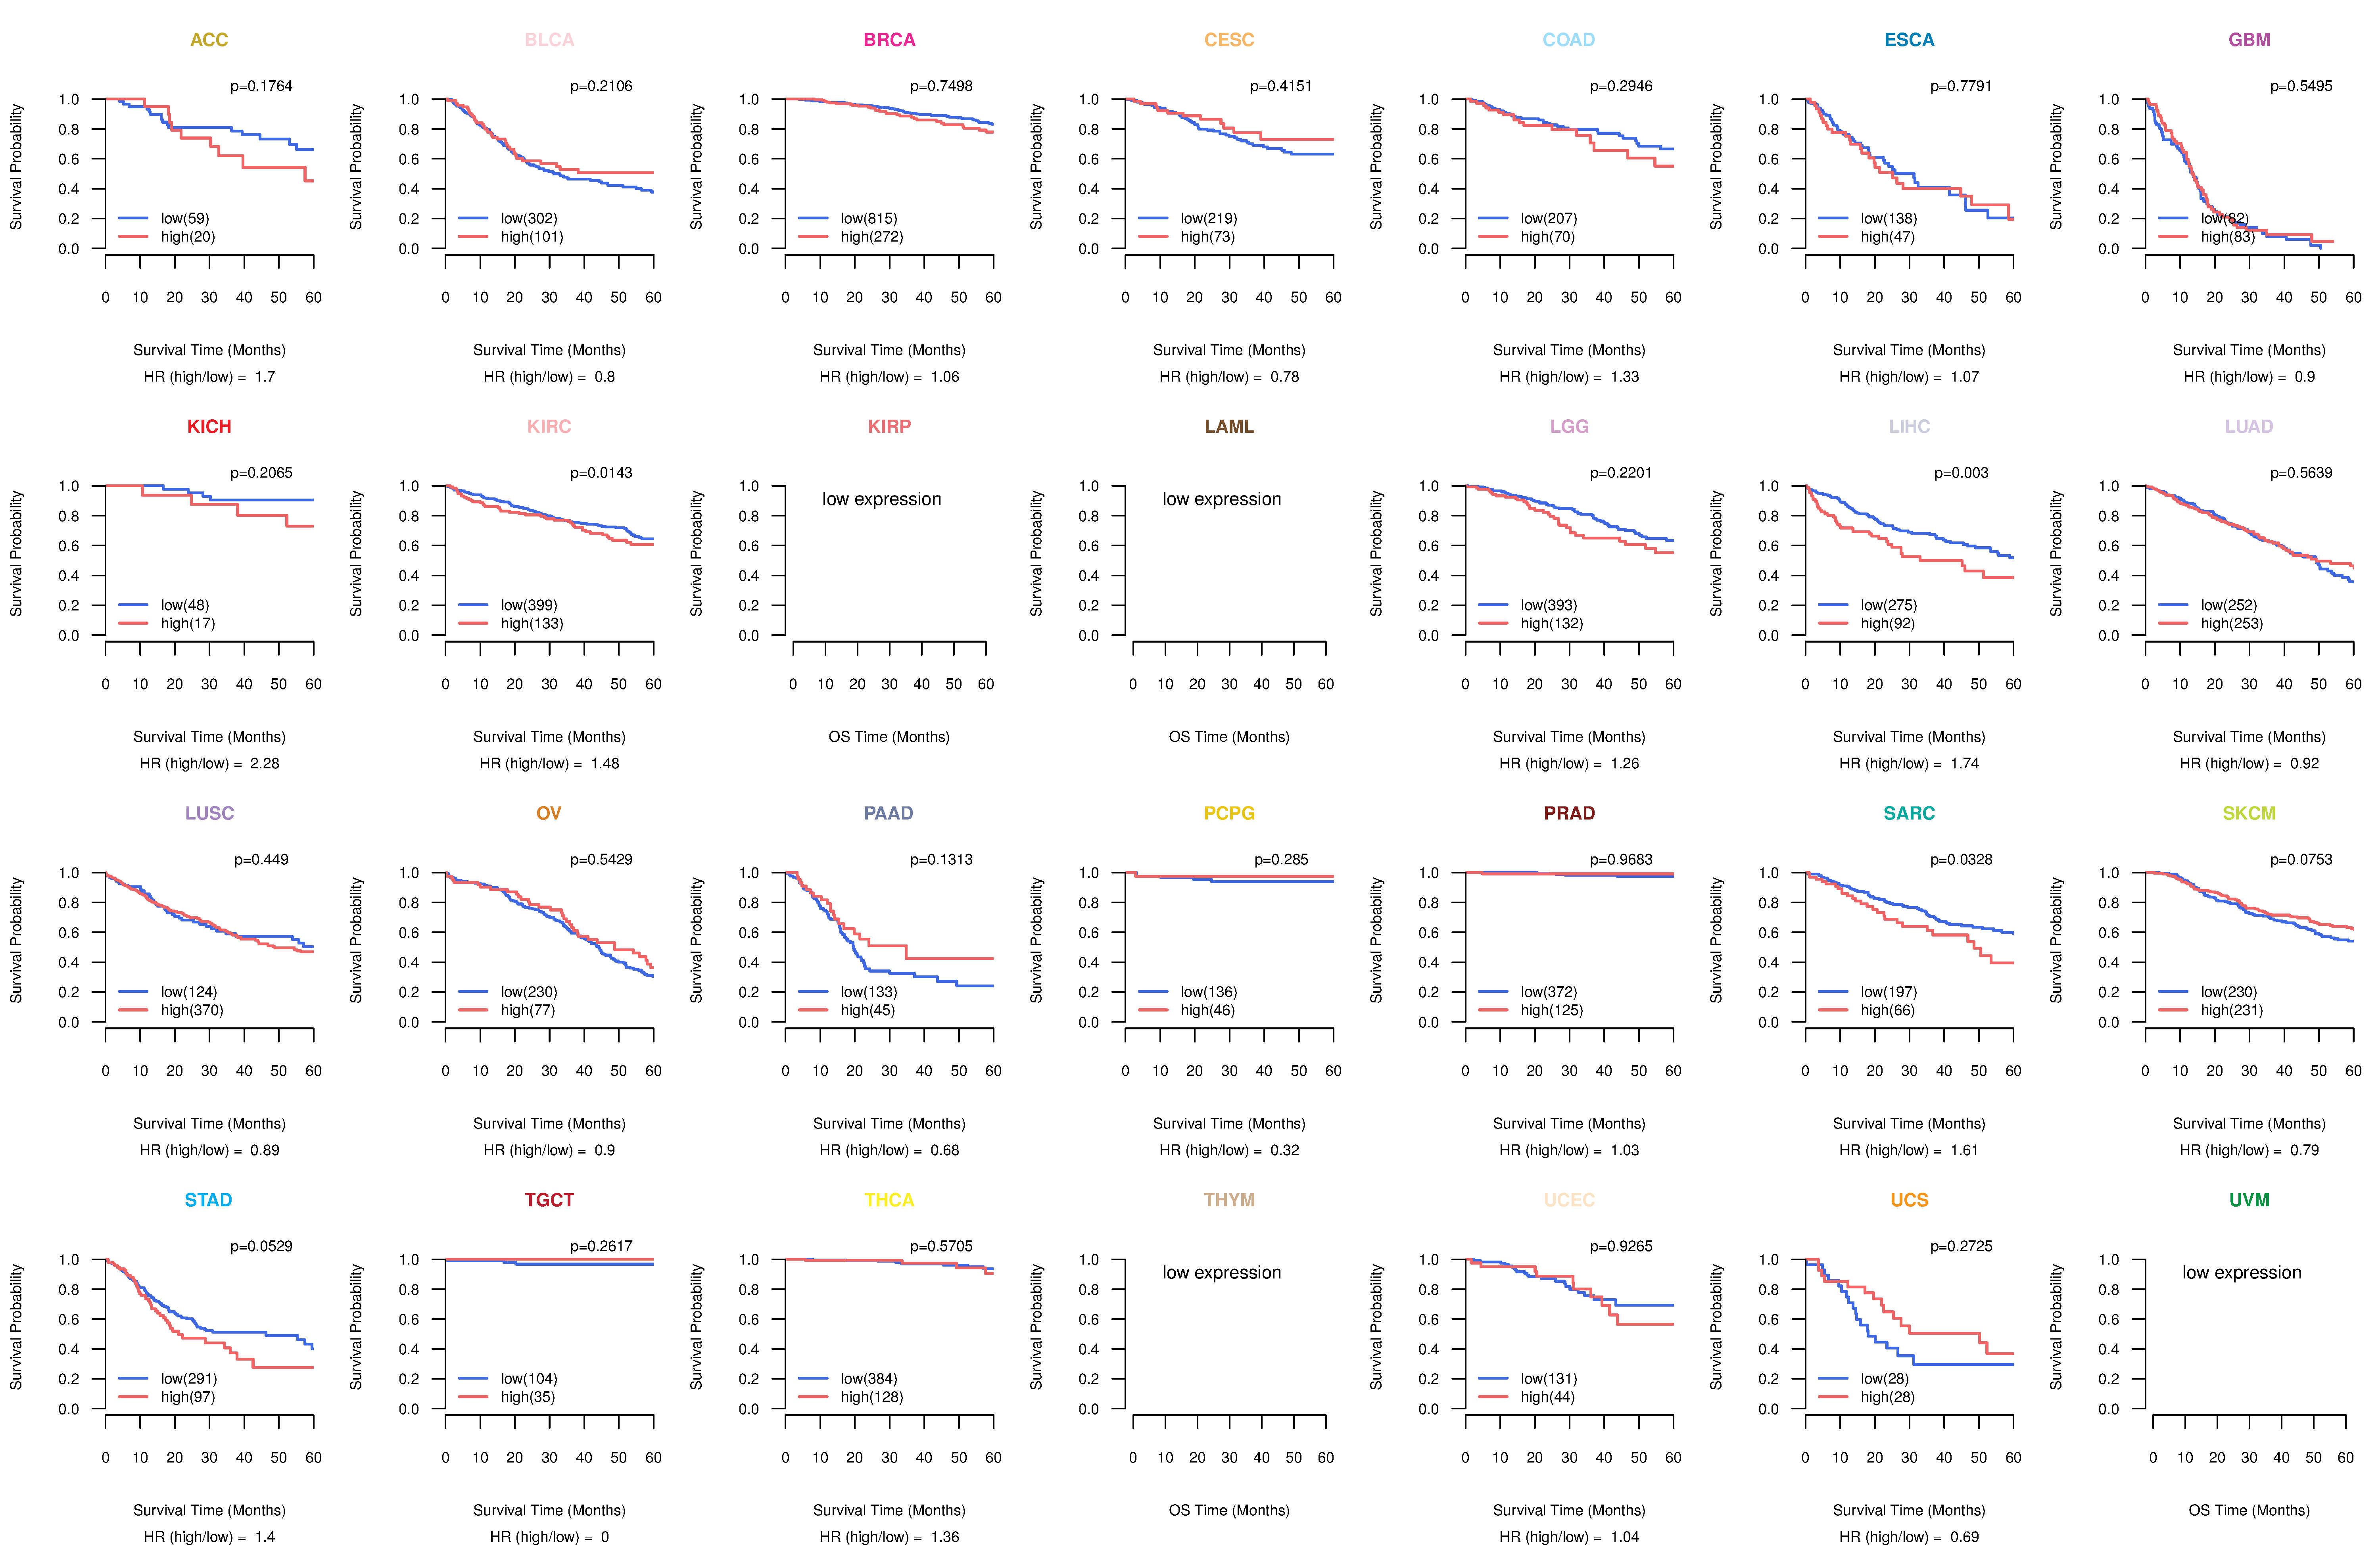
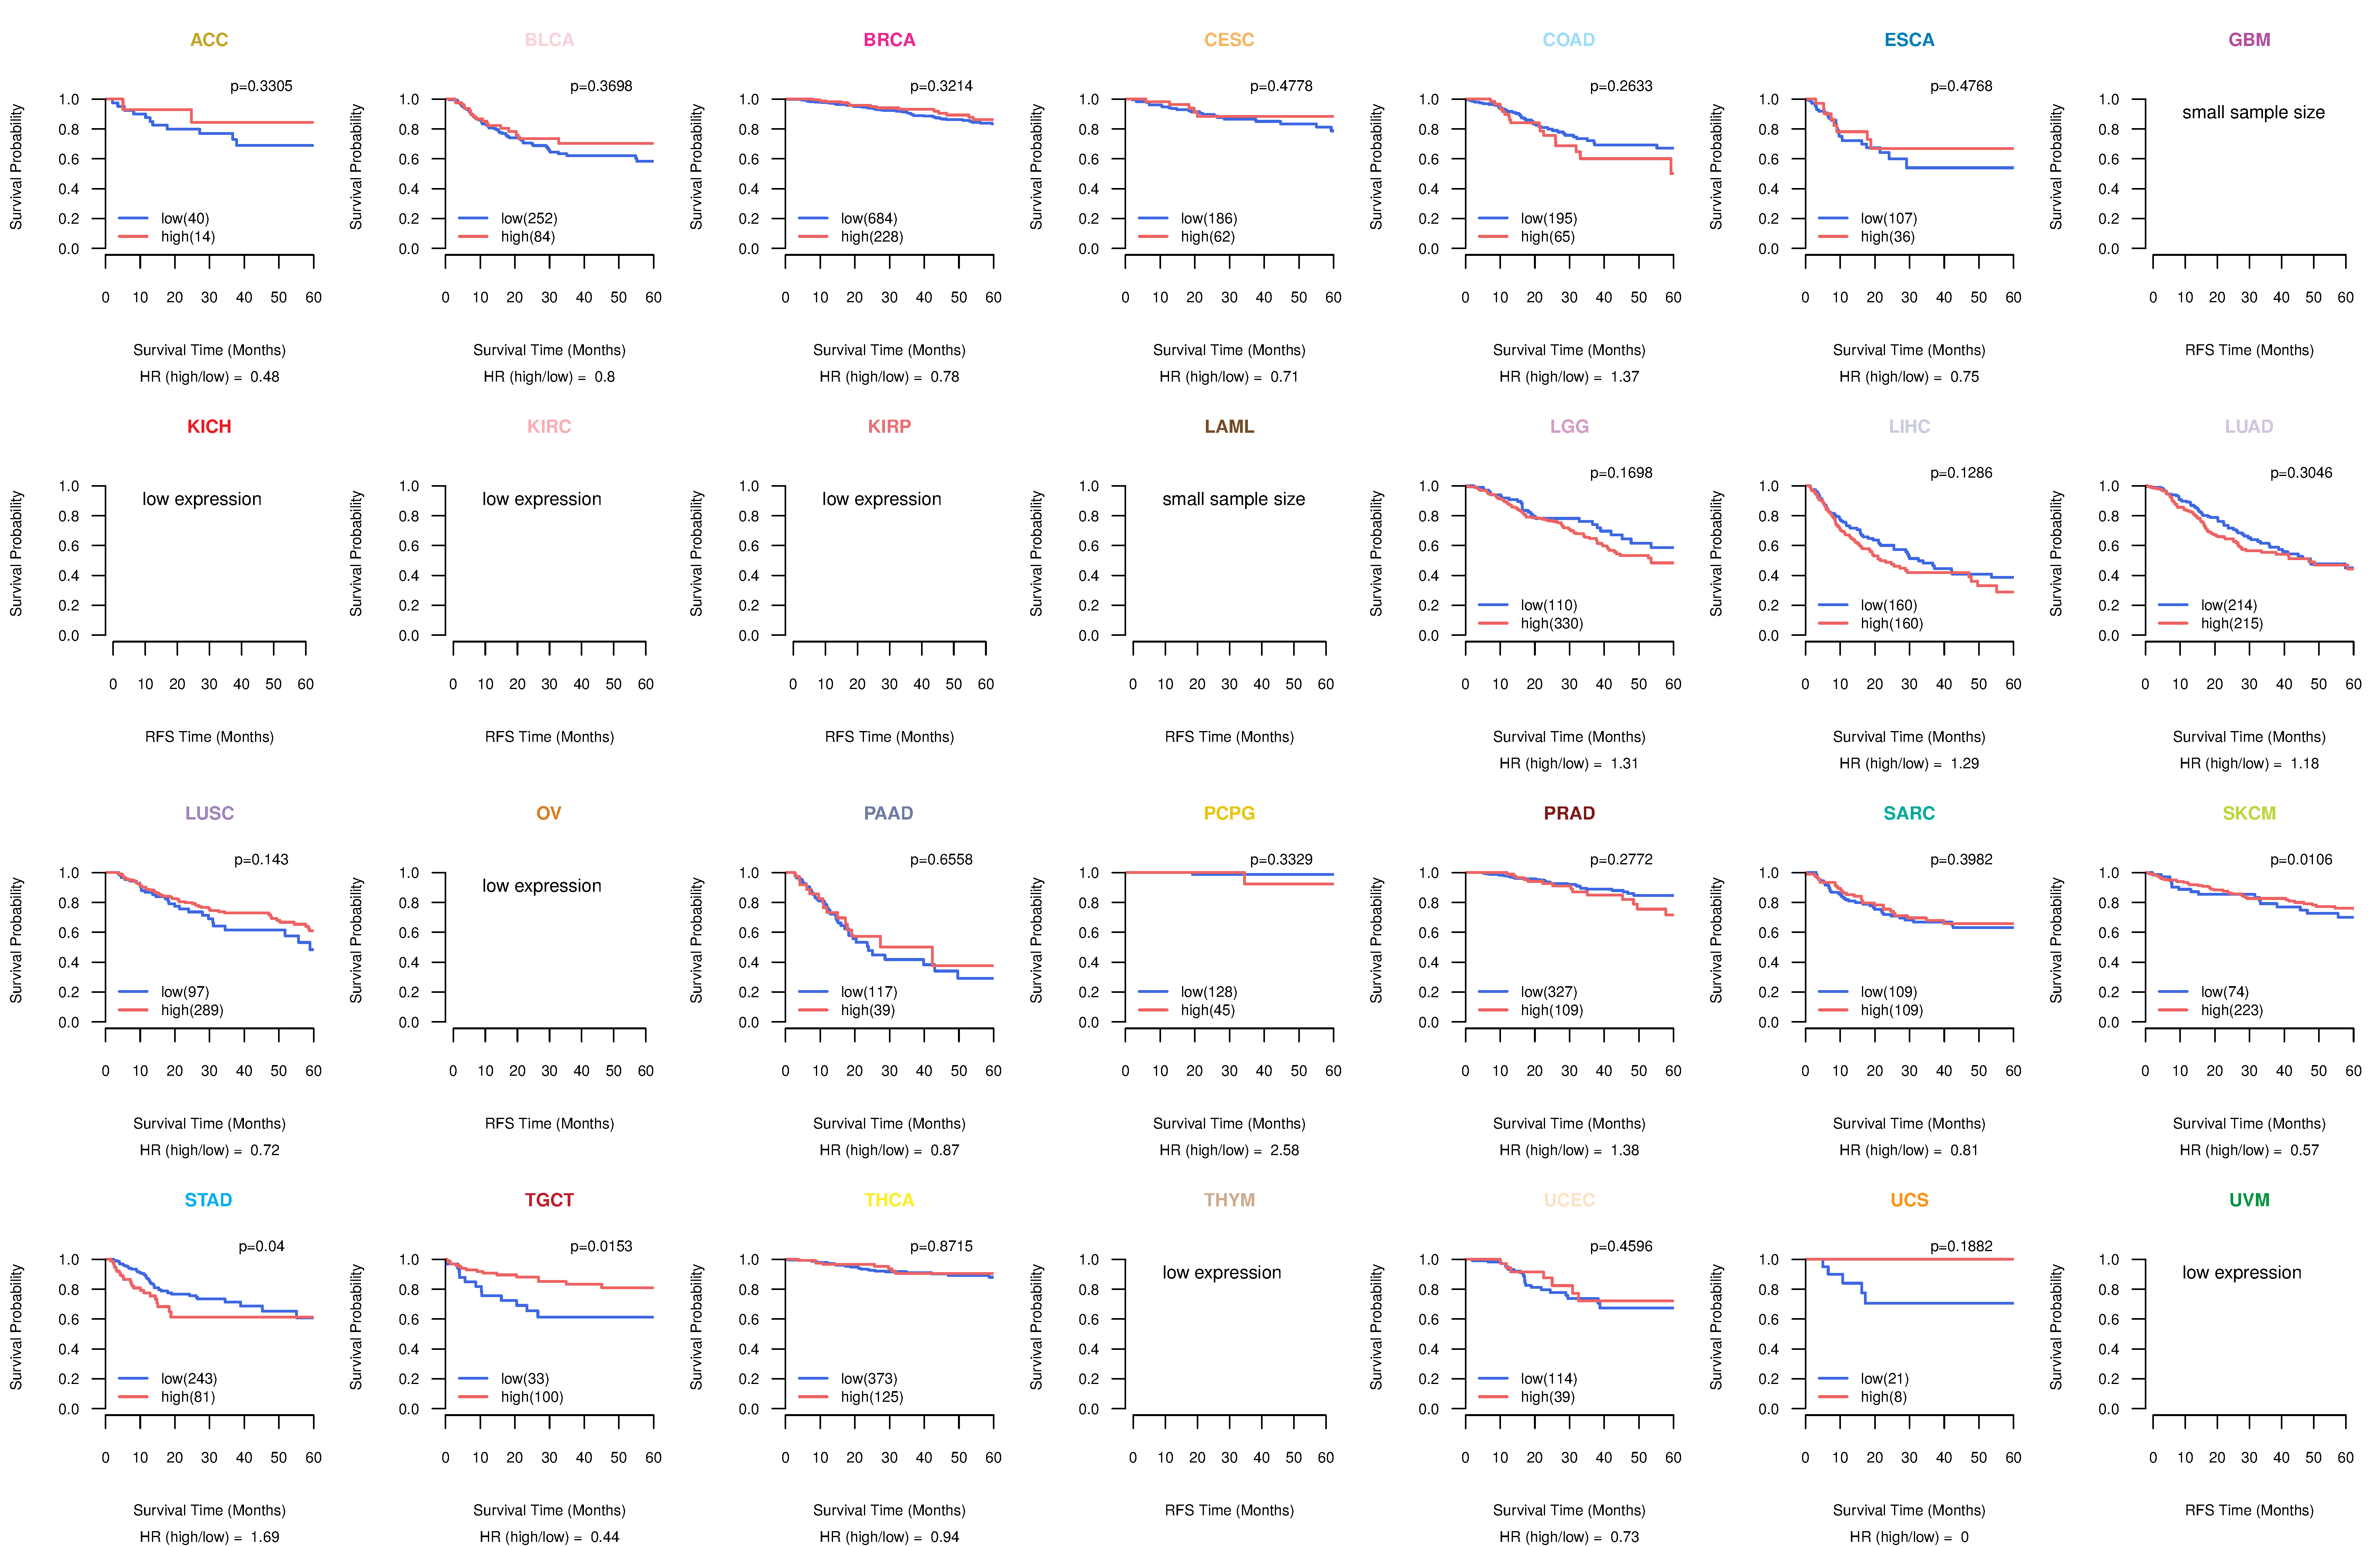
| TissGeneProg for MAGEA12 |
| Kaplan-Meier plots with logrank tests of overall survival (OS) using 28 cancer types (TCGA IlluminaHiSeq_RNASeqV2, pan-cancer normalized log2(norm_counts+1) data, version 2016-08-16) (TCGA clinicalMatrix, phenotype data, version 2016-04-27) * Click on the image to enlarge it in a new window. |
 |
| Kaplan-Meier plots with logrank test of relapse free survival (RFS) using 28 cancer types (TCGA IlluminaHiSeq_RNASeqV2, pan-cancer normalized log2(norm_counts+1) data, version 2016-08-16) (TCGA clinicalMatrix, phenotype data, version 2016-04-27) * Click on the image enlarge it in a new window. |
 |
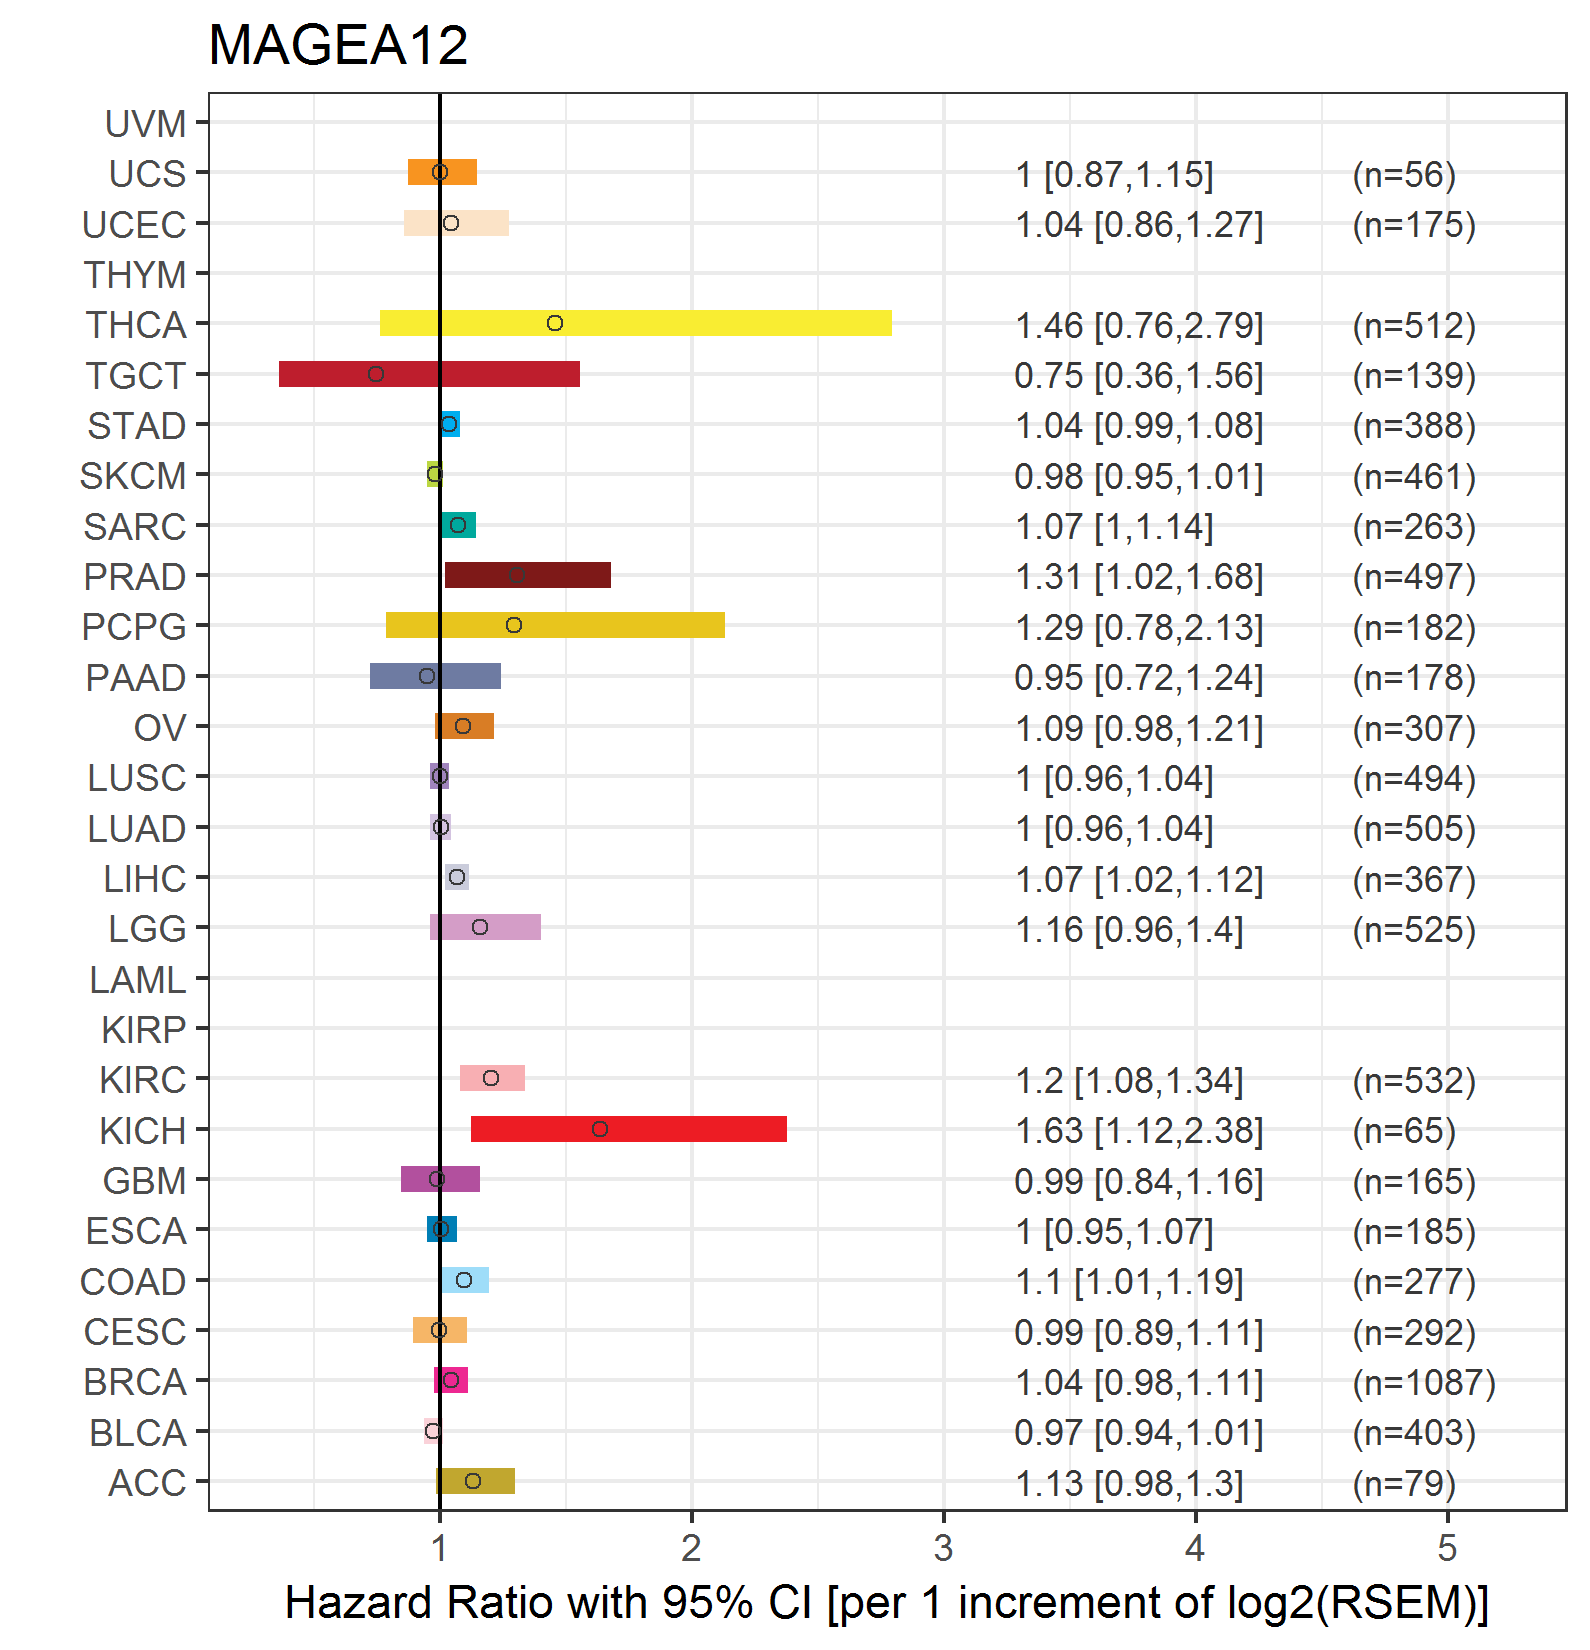
| Forest plot of Cox proportional hazard ratio (HR) and 95% CI of overall survival (OS) using 28 cancer types (TCGA IlluminaHiSeq_RNASeqV2, pan-cancer normalized log2(norm_counts+1) data, version 2016-08-16) (TCGA clinicalMatrix, phenotype data, version 2016-04-27) * Click on the image enlarge it in a new window. |
 |
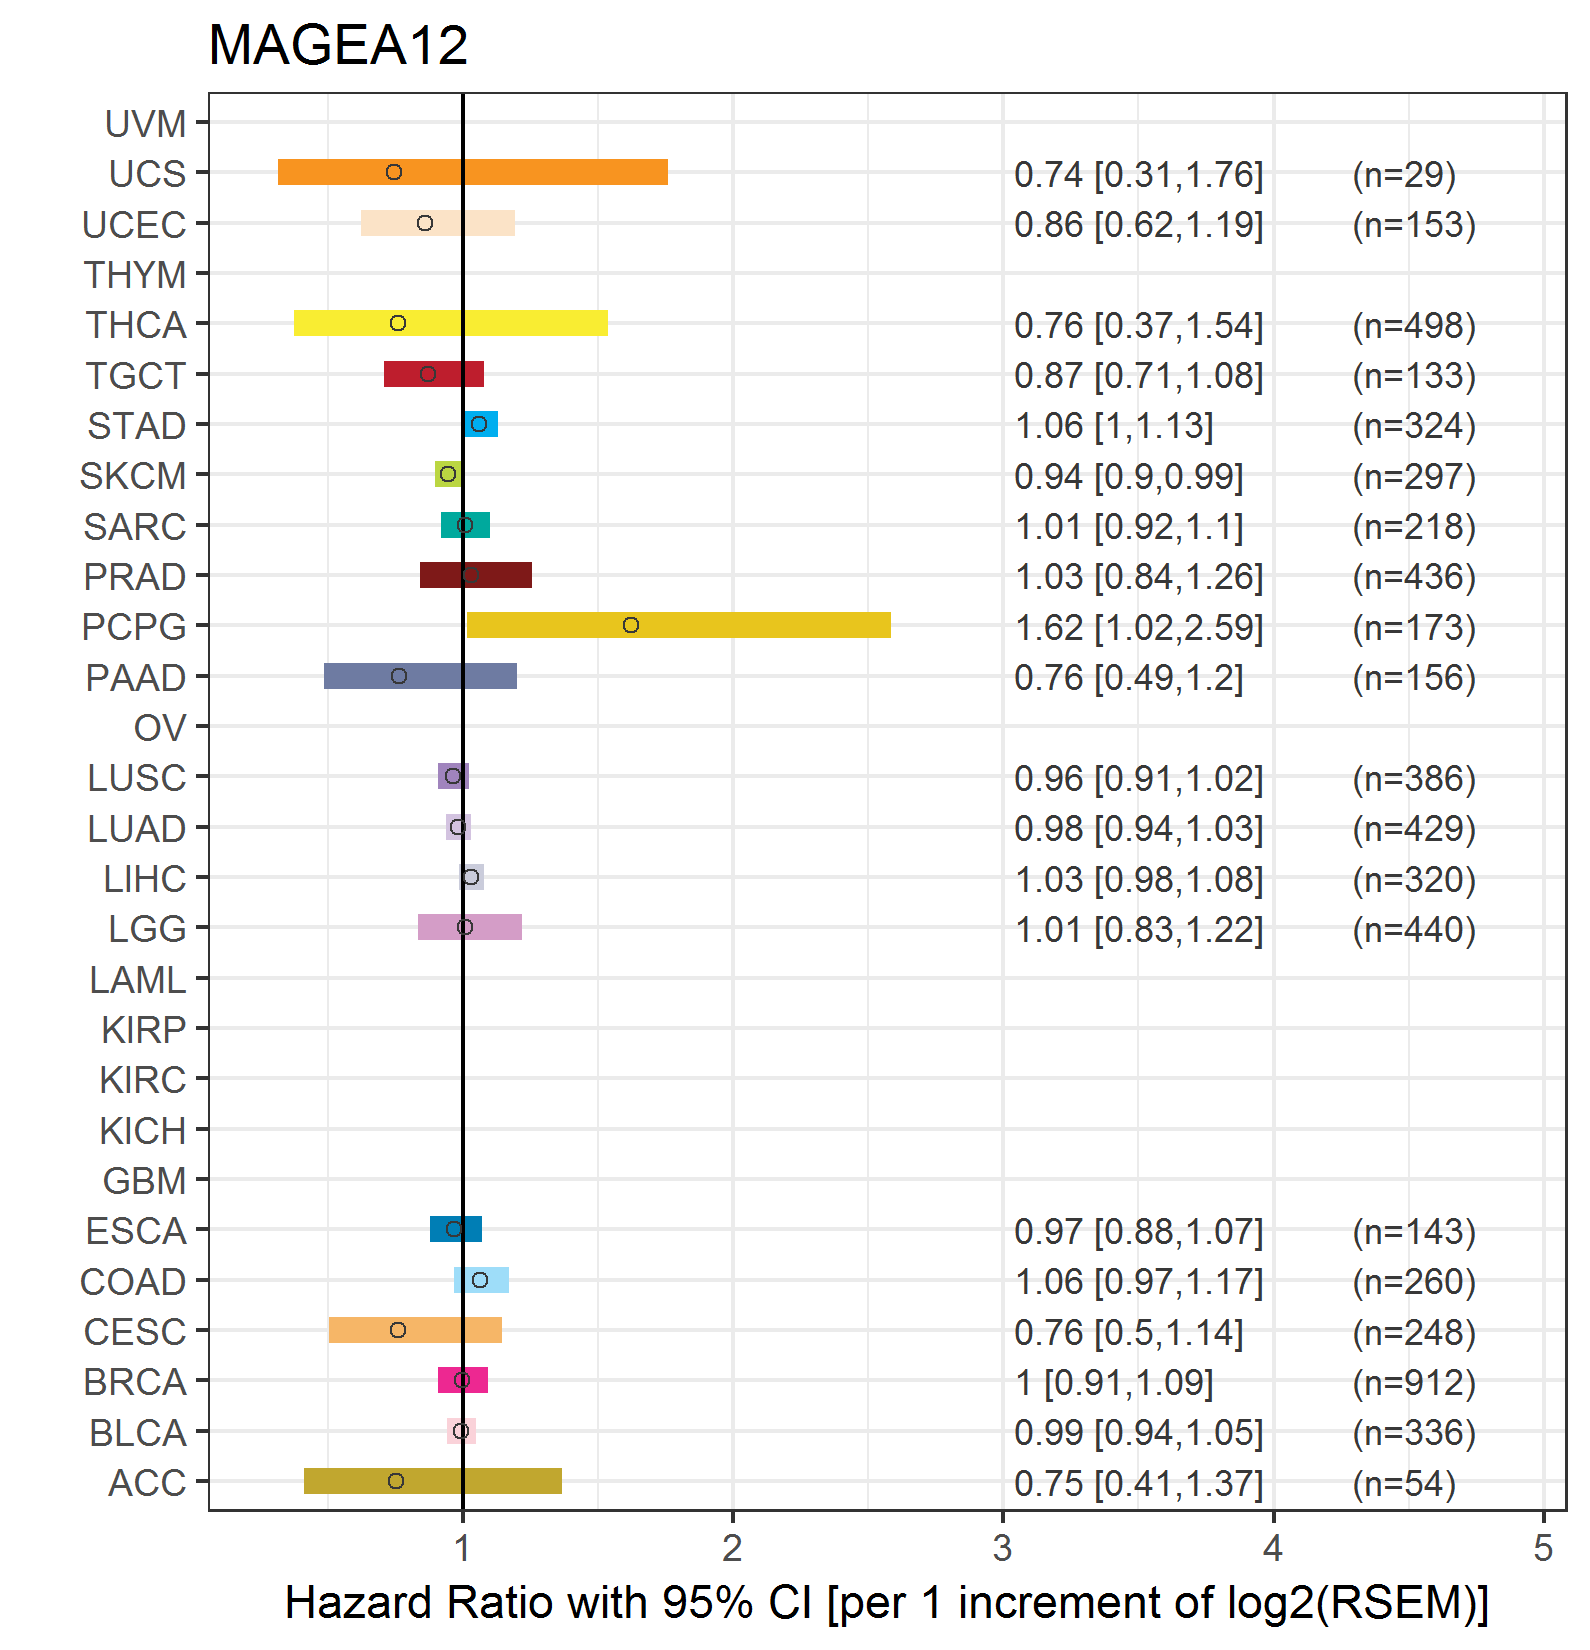
| Forest plot of Cox proportional hazard ratio (HR) and 95% CI of relapse free survival (RFS) using 28 cancer types (TCGA IlluminaHiSeq_RNASeqV2, pan-cancer normalized log2(norm_counts+1) data, version 2016-08-16) (TCGA clinicalMatrix, phenotype data, version 2016-04-27) * Click on the image enlarge it in a new window. |
 |
| Top |
| TissGeneClin for MAGEA12 |
| TissGeneDrug for MAGEA12 |
| Drug information targeting TissGene (DrugBank Version 5.0.6, 2017-04-01) |
| DrugBank ID | Drug name | Drug activity | Drug type | Drug status |
| Top |
| TissGeneDisease for MAGEA12 |
| Disease information associated with TissGene (DisGeNet, 2016-06-01) |
| Disease ID | Disease name | # pubmeds | Source |
| umls:C0025202 | melanoma | 3 | BeFree |
| umls:C0007137 | Squamous cell carcinoma | 1 | LHGDN |
| umls:C0027627 | Neoplasm Metastasis | 1 | BeFree |
|
Copyright 2016-Present - The University of Texas Health Science Center at Houston (UTHealth) Web File Viewing | How to Report, Fraud, Waste and Abuse | State of Texas | Statewide Search | Texas Homeland Security | Site Policies |