 |
| |
| |
| |
| |
| |
| |
|

| TissGeneSummary for C1orf186 |
 Gene summary Gene summary |
| Basic gene information | Gene symbol | C1orf186 |
| Gene name | ||
| Synonyms | ||
| Cytomap | UCSC genome browser: | |
| Type of gene | ||
| RefGenes | ||
| Description | ||
| Modification date | ||
| dbXrefs | ||
| Protein | UniProt: go to UniProt's Cross Reference DB Table | |
| Expression | CleanEX: HS_C1orf186 | |
| BioGPS: 101929219 | ||
| Pathway | NCI Pathway Interaction Database: C1orf186 | |
| KEGG: C1orf186 | ||
| REACTOME: C1orf186 | ||
| Pathway Commons: C1orf186 | ||
| Context | iHOP: C1orf186 | |
| ligand binding site mutation search in PubMed: C1orf186 | ||
| UCL Cancer Institute: C1orf186 | ||
| Assigned class in TissGDB* | C | |
| Included tissue-specific gene expression resources | TiGER,GTEx | |
| Specific-tissues in normal samples (assigned by TissGDB using HPA, TiGER, and GTEx) | KidneyUterus | |
| Cancer types related to the specific-tissues in cancer samples (assigned by TissGDB using TCGA) | KIRC,KIRP,KICHUCEC,UCS | |
| Reference showing the relevant tissue of C1orf186 | ||
| Description by TissGene annotations | ||
| * Class A consists of genes with literature evidence and is part of the cTissGenes. Class B consists of only cTissGenes without additional evidence. The remaining genes belong to Class C. |
| Gene ontology having evidence of Inferred from Direct Assay (IDA) from Entrez |
| GO ID | GO term | PubMed ID |
| Top |
| TissGeneExp for C1orf186 |
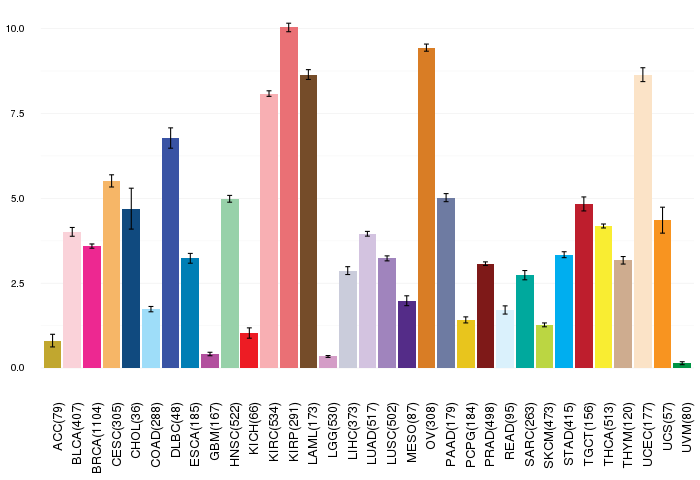
| Gene expressions across 28 cancer types (X-axis: cancer type and Y-axis: log2(norm_counts+1)) (TCGA IlluminaHiSeq_RNASeqV2, pan-cancer normalized log2(norm_counts+1) data, version 2016-08-16) |
 |
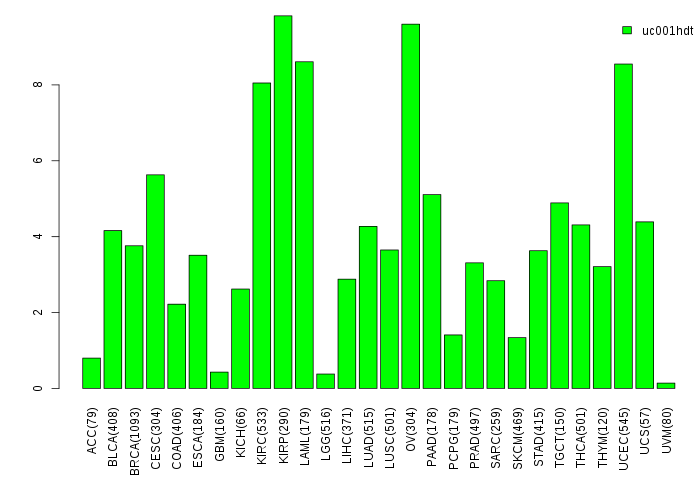
| Gene isoform expressions across 28 cancer types (X-axis: cancer type and Y-axis: log2(norm_counts+1)) (TCGA pan-cancer tcga_rsem_isoform_tpm, version 2016-09-01) |
 |
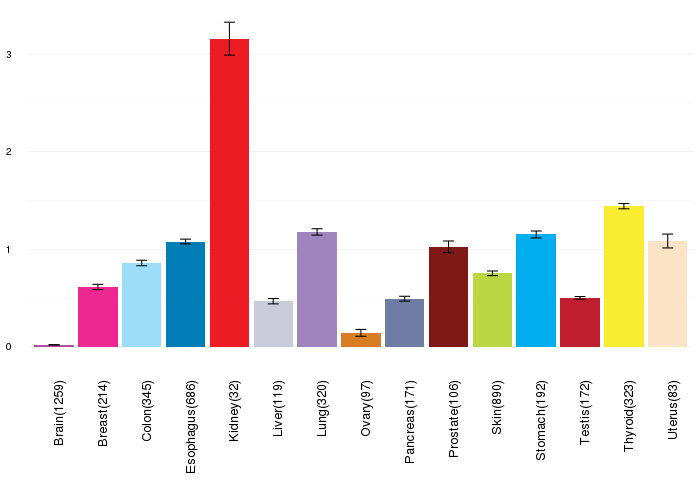
| Gene expressions across normal tissues of GTEx data (GTEx GTEx_Analysis_v6_RNA-seq_RNA-SeQCv1.1.8_gene_rpkm.gct) - Here, we shows the matched tissue types only among our 28 cancer types. |
 |
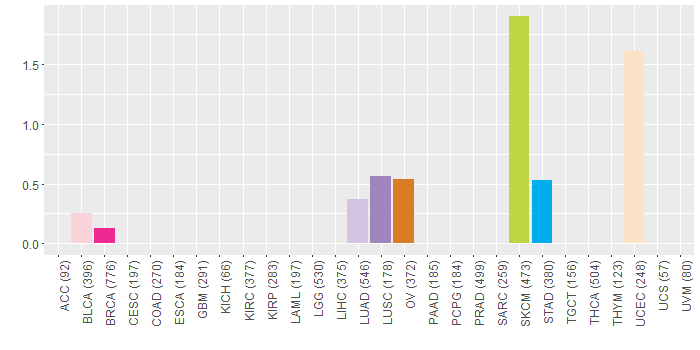
| Different expressions across 14 cancer types with more than 10 samples between matched tumors and normals (X-axis: cancer type and Y-axis: log2(norm_counts+1)) (TCGA IlluminaHiSeq_RNASeqV2, pan-cancer normalized log2(norm_counts+1) data, version 2016-08-16) |
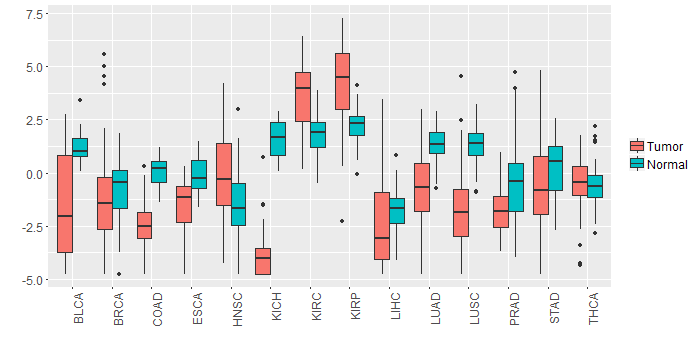 |
| - Significantly differentially expressed cancer types and information. (|Fold change|>1 and FDR<0.05) |
| Cancer type | Mean(exp) in tumor | Mean(exp) in matched normal | Log2FC | P-val. | FDR |
| PRAD | -1.73397676 | -0.259363298 | -1.474613462 | 1.49E-05 | 7.86E-05 |
| LUSC | -1.636141277 | 1.325860683 | -2.962001961 | 5.16E-16 | 3.67E-15 |
| KIRC | 3.61171918 | 1.808990014 | 1.802729167 | 4.77E-16 | 2.59E-15 |
| COAD | -2.529632529 | 0.119205932 | -2.648838462 | 1.37E-11 | 2.59E-10 |
| LUAD | -0.658044996 | 1.320087763 | -1.978132759 | 2.14E-12 | 1.61E-11 |
| KICH | -3.713002375 | 1.616221625 | -5.329224 | 1.79E-19 | 1.13E-17 |
| HNSC | -0.048330561 | -1.443679399 | 1.395348837 | 0.00147 | 0.004738539 |
| BLCA | -1.614265323 | 1.230913625 | -2.845178947 | 0.000102 | 0.001117424 |
| KIRP | 4.037873 | 2.21675425 | 1.82111875 | 1.00E-04 | 0.000341768 |
| Top |
| TissGene-miRNA for C1orf186 |
| Significantly anti-correlated miRNAs of TissGene across 28 cancer types (Gene-miRNA relations from TargetScanHuman Relsease 7.1, Conserved_Site_Context_Scores.txt.zip, 06.01.2016) (TCGA IlluminaHiSeq_miRNASeq, log2(RPM+1) data, version 2016-11-21) (TCGA IlluminaHiSeq_RNASeqV2, log2(normalized_count+1) data, version 2016-08-16) (Spearman’s Rank Correlation (p-value<0.05 and coefficient<-0.25)) |
| Cancer type | miRNA id | miRNA accession | P-val. | Coeff. | # samples |
| Top |
| TissGeneMut for C1orf186 |
| TissGeneSNV for C1orf186 |
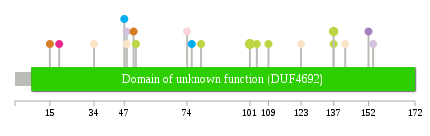
| nsSNV counts per each loci. Different colors of circles represent different cancer types. Circle size denotes number of samples. (TCGA somatic mutation (SNPs and small INDELs) data, version 2016-04-25) * Click on the image to enlarge it in a new window. |
 |
 |
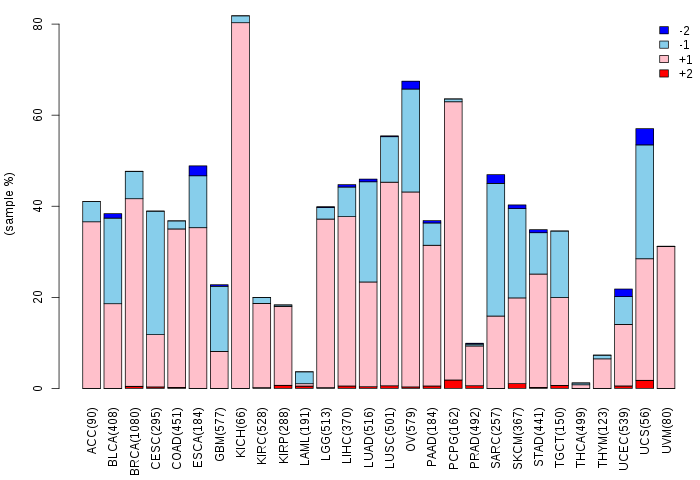
| Somatic nucleotide variants of TissGene across 28 cancer types (X-axis: cancer type and Y-axis: % of mutated samples) The numbers in parentheses are numbers of samples with mutation (nsSNVs). (TCGA somatic mutation (SNPs and small INDELs) data, version 2016-04-25) |
 |
| - nsSNVs sorted by frequency. |
| AAchange | Cancer type | # samples |
| p.S101L | SKCM | 3 |
| p.E137K | SKCM | 2 |
| p.A47V | STAD | 1 |
| p.S34N | UCEC | 1 |
| p.S152C | LUSC | 1 |
| p.A15V | OV | 1 |
| p.A104V | SKCM | 1 |
| p.W154R | LUAD | 1 |
| p.A48T | UCEC | 1 |
| p.L19V | BRCA | 1 |
| p.E109K | SKCM | 1 |
| p.V52L | SKCM | 1 |
| p.E137D | SKCM | 1 |
| p.A48S | LUAD | 1 |
| p.Q51H | OV | 1 |
| p.D76H | STAD | 1 |
| p.V142A | UCEC | 1 |
| p.A28T | HNSC | 1 |
| p.L19I | CHOL | 1 |
| p.H86Y | READ | 1 |
| p.E74K | BLCA | 1 |
| p.E123* | UCEC | 1 |
| p.S80F | SKCM | 1 |
| Top |
| TissGeneCNV for C1orf186 |
| Copy number variations of TissGene across 28 cancer types (X-axis: cancer type and Y-axis: % of CNV samples) (TCGA Gistic2_CopyNumber_Gistic2_all_data_by_genes, Gistic2 copy number data, version 2016-08-16) |
 |
| Top |
| TissGeneFusions for C1orf186 |
| Fusion genes including TissGene (ChimerDB 3.0, 2016-12-01 and TCGA fusion Portal 2015-12-01) |
| Database | Src | Cancer type | Sample | Fusion gene | ORF | 5'-gene BP | 3'-gene BP |
| Chimerdb3.0 | ChiTaRs | NA | AI624663 | NFIC-C1orf186 | chr19:3469152 | chr1:206243898 | |
| Chimerdb3.0 | FusionScan | UCEC | TCGA-D1-A3DG-01A | TRIP10-C1orf186 | In-Frame | chr19:6750644 | chr1:206241676 |
| TCGAfusionPortal | PRADA | BRCA | TCGA-BH-A203-01A | PDE4DIP-C1orf186 | In-frame | Chr1:144915445 | Chr1:206239579 |
| Top |
| TissGeneNet for C1orf186 |
| Co-expressed gene networks based on protein-protein interaction data (CePIN) (TCGA IlluminaHiSeq_RNASeqV2, pan-cancer normalized log2(norm_counts+1) data, version 2016-08-16) (PINA2 ppi data) |
| Top |
| TissGeneProg for C1orf186 |
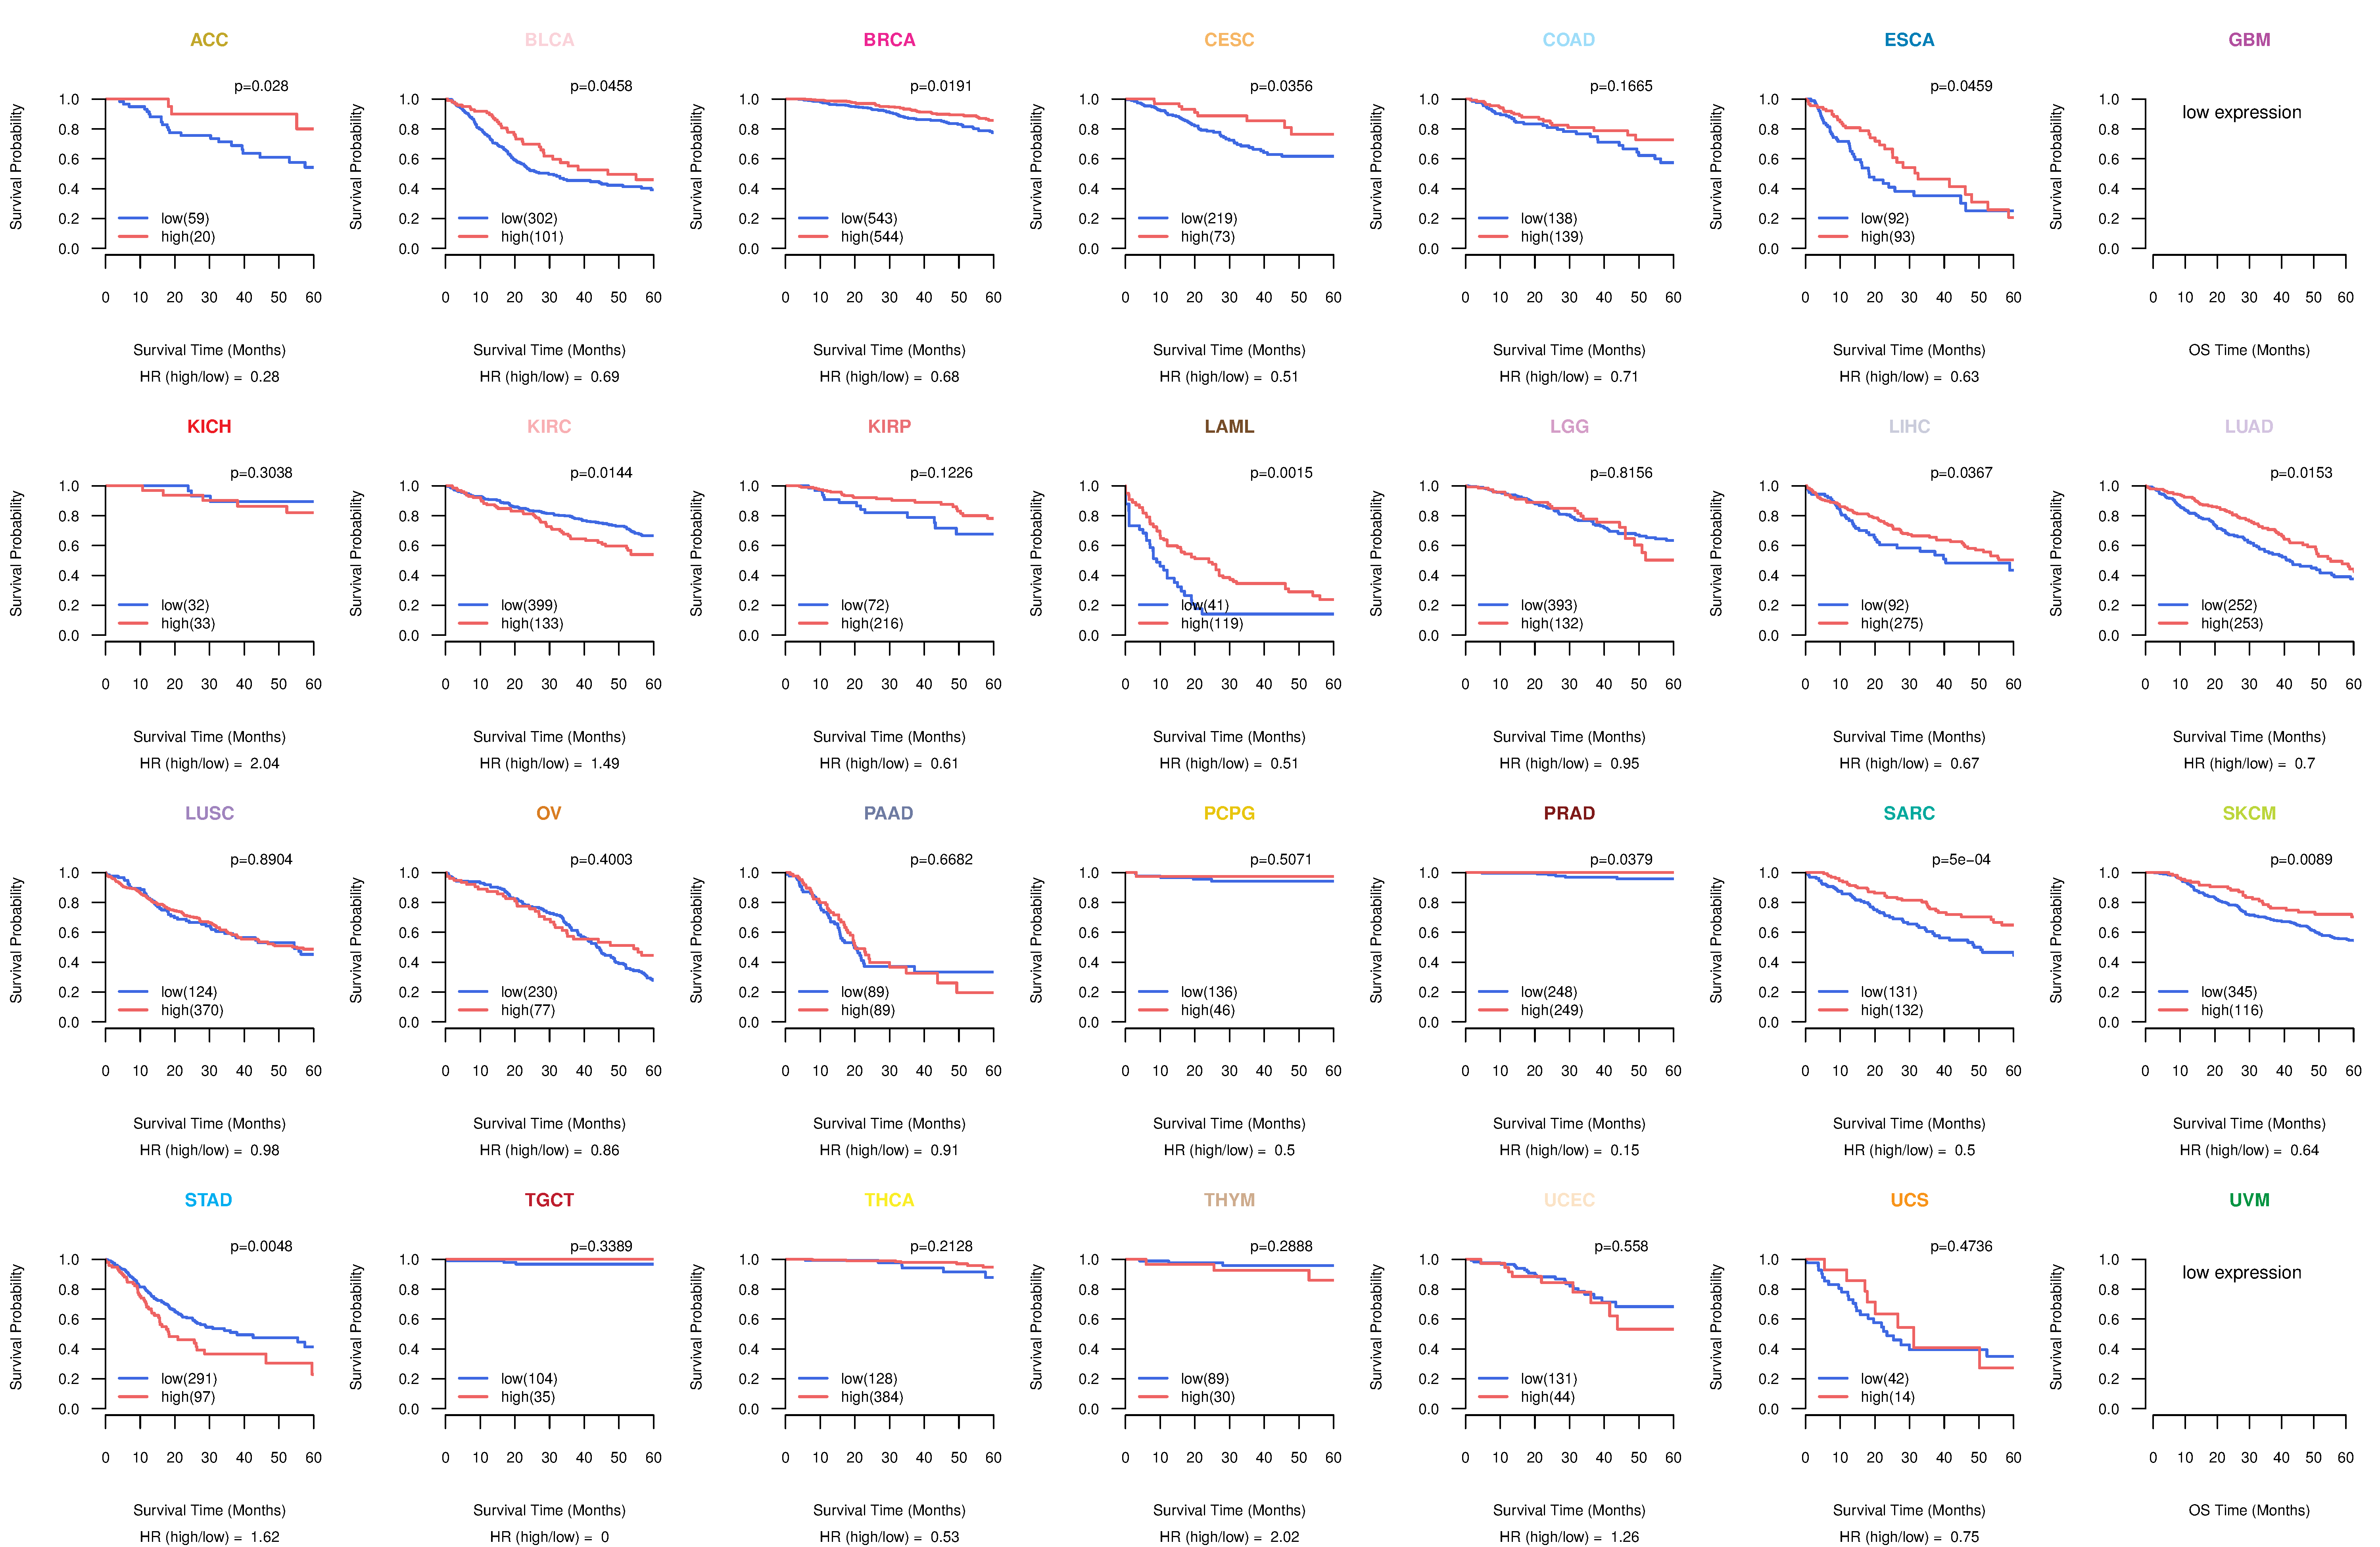
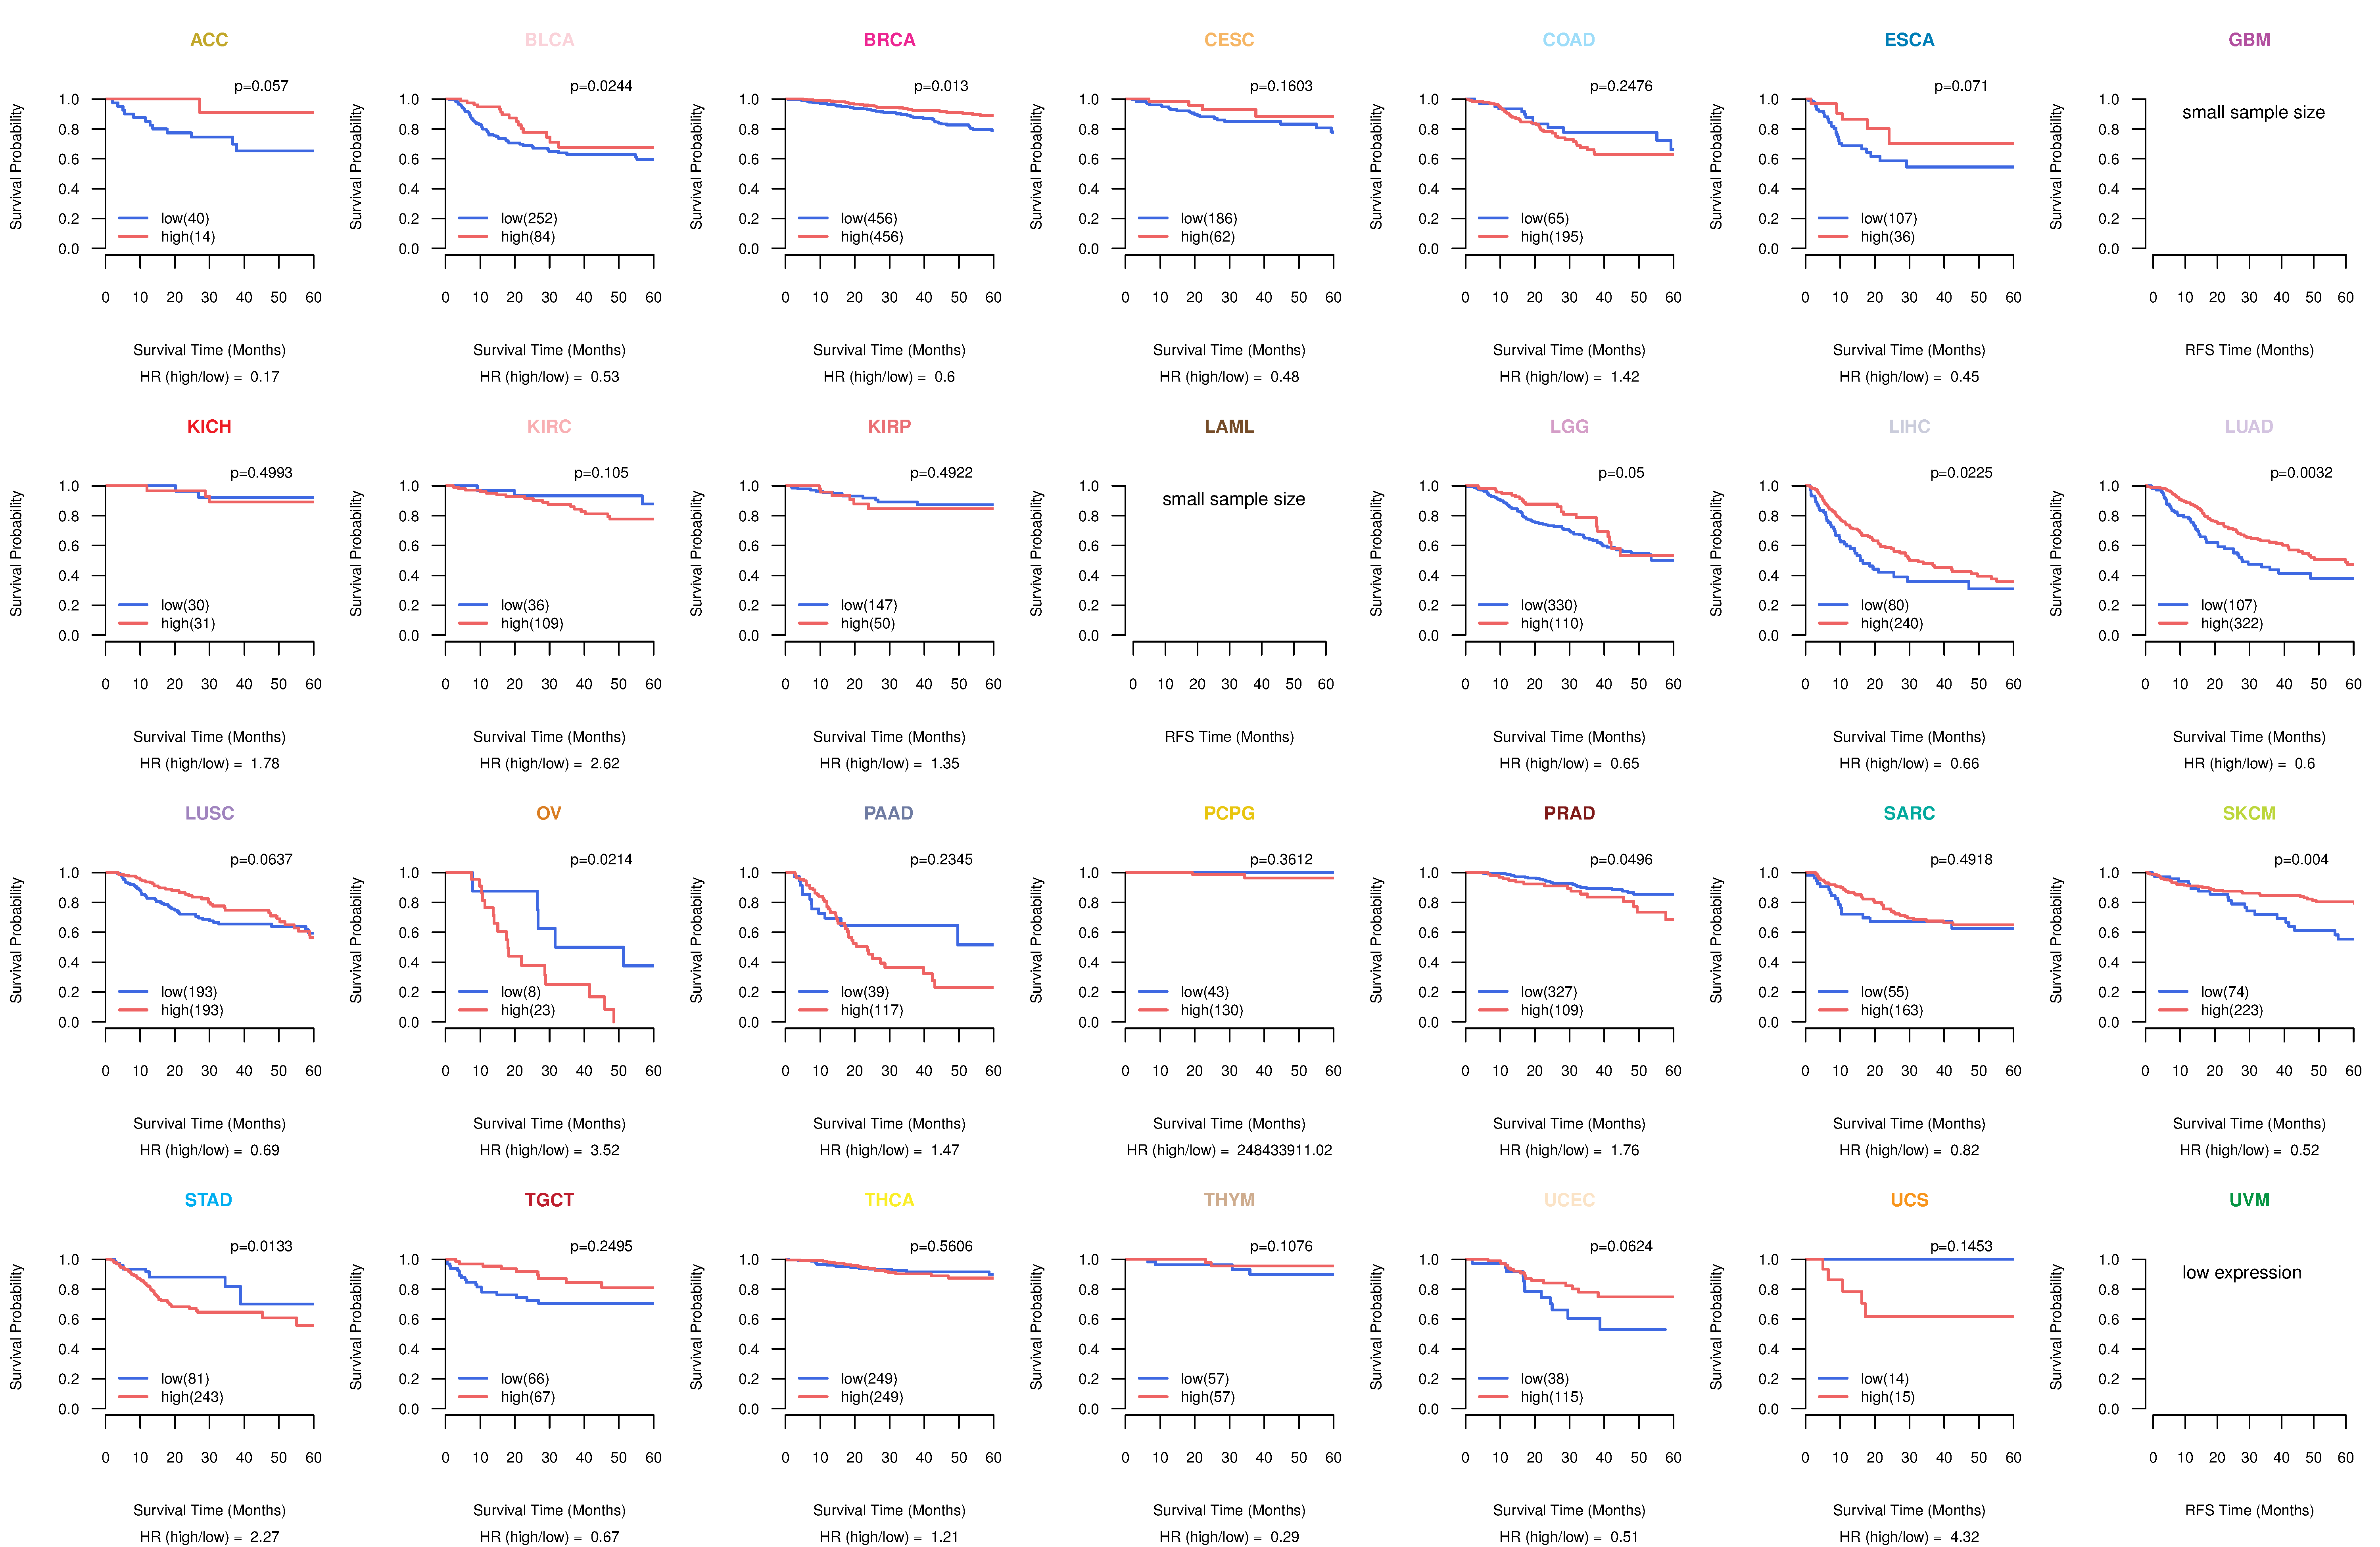
| Kaplan-Meier plots with logrank tests of overall survival (OS) using 28 cancer types (TCGA IlluminaHiSeq_RNASeqV2, pan-cancer normalized log2(norm_counts+1) data, version 2016-08-16) (TCGA clinicalMatrix, phenotype data, version 2016-04-27) * Click on the image to enlarge it in a new window. |
 |
| Kaplan-Meier plots with logrank test of relapse free survival (RFS) using 28 cancer types (TCGA IlluminaHiSeq_RNASeqV2, pan-cancer normalized log2(norm_counts+1) data, version 2016-08-16) (TCGA clinicalMatrix, phenotype data, version 2016-04-27) * Click on the image enlarge it in a new window. |
 |
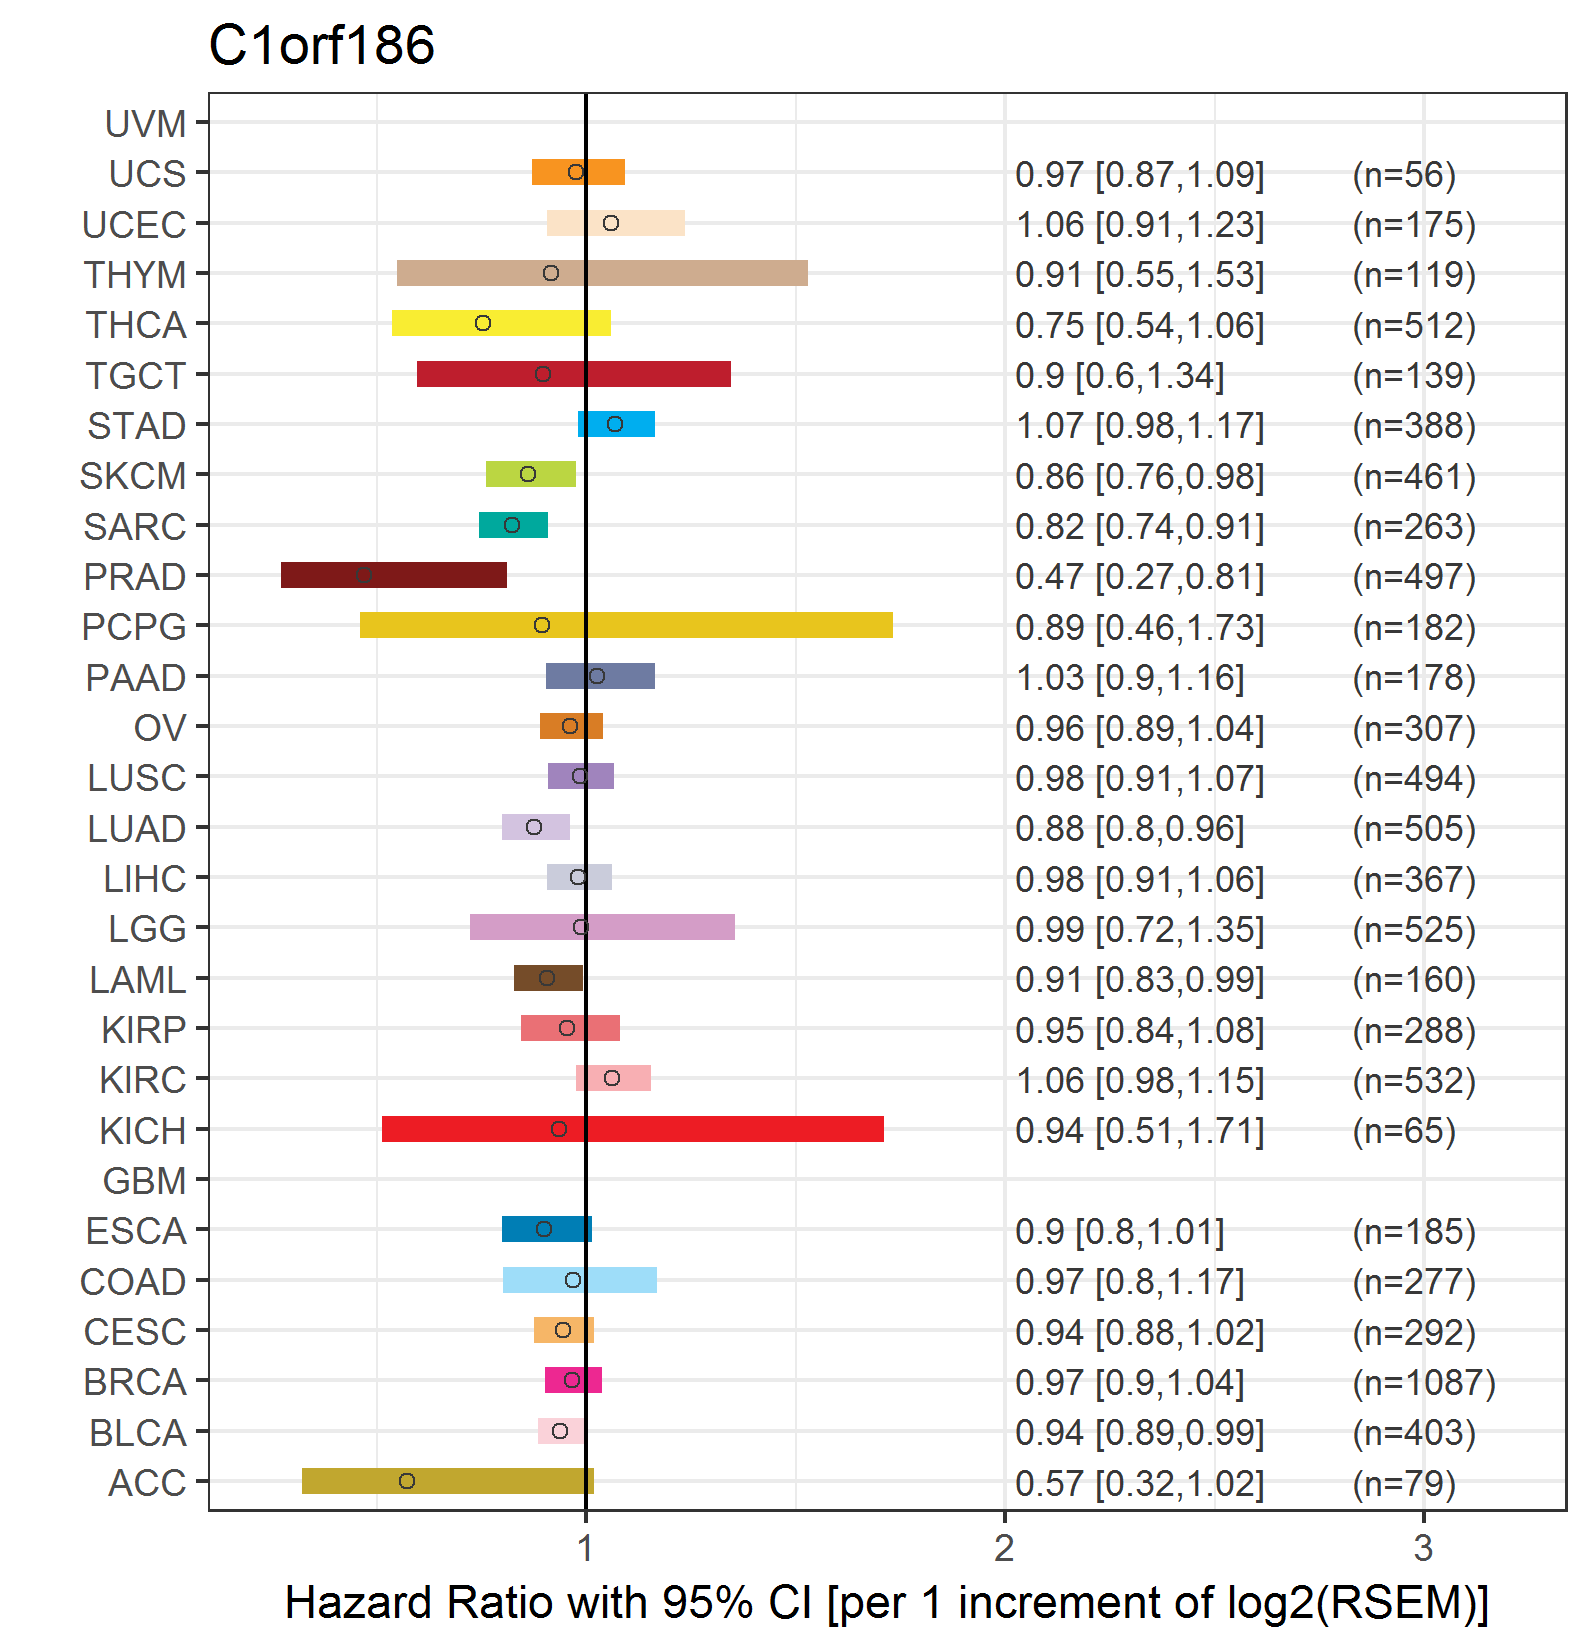
| Forest plot of Cox proportional hazard ratio (HR) and 95% CI of overall survival (OS) using 28 cancer types (TCGA IlluminaHiSeq_RNASeqV2, pan-cancer normalized log2(norm_counts+1) data, version 2016-08-16) (TCGA clinicalMatrix, phenotype data, version 2016-04-27) * Click on the image enlarge it in a new window. |
 |
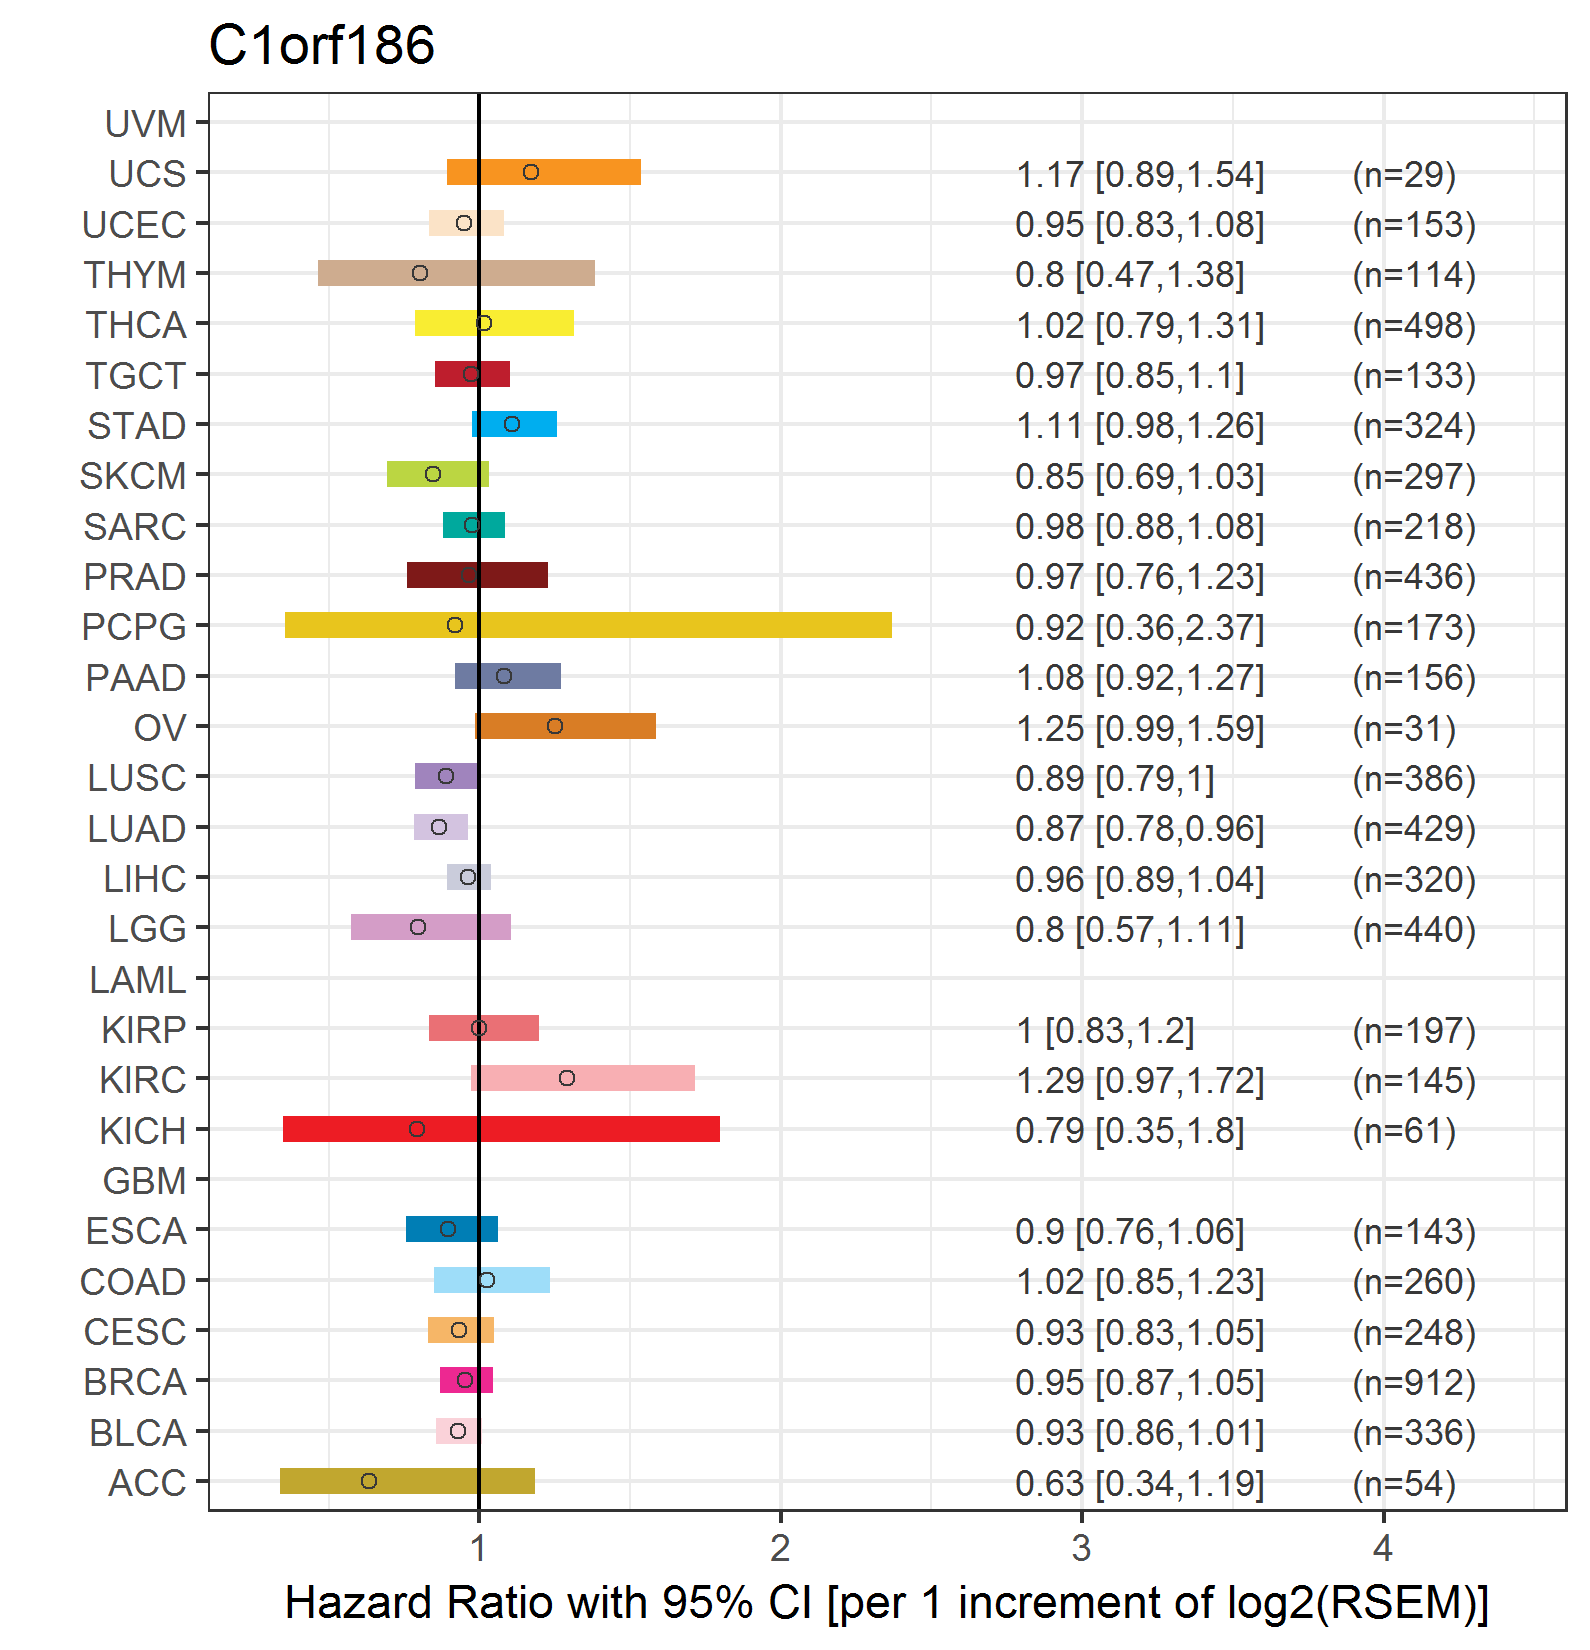
| Forest plot of Cox proportional hazard ratio (HR) and 95% CI of relapse free survival (RFS) using 28 cancer types (TCGA IlluminaHiSeq_RNASeqV2, pan-cancer normalized log2(norm_counts+1) data, version 2016-08-16) (TCGA clinicalMatrix, phenotype data, version 2016-04-27) * Click on the image enlarge it in a new window. |
 |
| Top |
| TissGeneClin for C1orf186 |
| TissGeneDrug for C1orf186 |
| Drug information targeting TissGene (DrugBank Version 5.0.6, 2017-04-01) |
| DrugBank ID | Drug name | Drug activity | Drug type | Drug status |
| Top |
| TissGeneDisease for C1orf186 |
| Disease information associated with TissGene (DisGeNet, 2016-06-01) |
| Disease ID | Disease name | # pubmeds | Source |
|
Copyright 2016-Present - The University of Texas Health Science Center at Houston (UTHealth) Web File Viewing | How to Report, Fraud, Waste and Abuse | State of Texas | Statewide Search | Texas Homeland Security | Site Policies |