 |
| |
| |
| |
| |
| |
| |
|

| TissGeneSummary for GPA33 |
 Gene summary Gene summary |
| Basic gene information | Gene symbol | GPA33 |
| Gene name | glycoprotein A33 (transmembrane) | |
| Synonyms | A33 | |
| Cytomap | UCSC genome browser: 1q24.1 | |
| Type of gene | protein-coding | |
| RefGenes | NM_005814.1, | |
| Description | cell surface A33 antigentransmembrane glycoprotein A33 | |
| Modification date | 20141207 | |
| dbXrefs | MIM : 602171 | |
| HGNC : HGNC | ||
| Ensembl : ENSG00000143167 | ||
| HPRD : 03704 | ||
| Vega : OTTHUMG00000034435 | ||
| Protein | UniProt: go to UniProt's Cross Reference DB Table | |
| Expression | CleanEX: HS_GPA33 | |
| BioGPS: 10223 | ||
| Pathway | NCI Pathway Interaction Database: GPA33 | |
| KEGG: GPA33 | ||
| REACTOME: GPA33 | ||
| Pathway Commons: GPA33 | ||
| Context | iHOP: GPA33 | |
| ligand binding site mutation search in PubMed: GPA33 | ||
| UCL Cancer Institute: GPA33 | ||
| Assigned class in TissGDB* | C | |
| Included tissue-specific gene expression resources | TiGER,GTEx | |
| Specific-tissues in normal samples (assigned by TissGDB using HPA, TiGER, and GTEx) | Colon | |
| Cancer types related to the specific-tissues in cancer samples (assigned by TissGDB using TCGA) | COAD | |
| Reference showing the relevant tissue of GPA33 | ||
| Description by TissGene annotations | ||
| * Class A consists of genes with literature evidence and is part of the cTissGenes. Class B consists of only cTissGenes without additional evidence. The remaining genes belong to Class C. |
| Gene ontology having evidence of Inferred from Direct Assay (IDA) from Entrez |
| GO ID | GO term | PubMed ID |
| Top |
| TissGeneExp for GPA33 |
| Gene expressions across 28 cancer types (X-axis: cancer type and Y-axis: log2(norm_counts+1)) (TCGA IlluminaHiSeq_RNASeqV2, pan-cancer normalized log2(norm_counts+1) data, version 2016-08-16) |
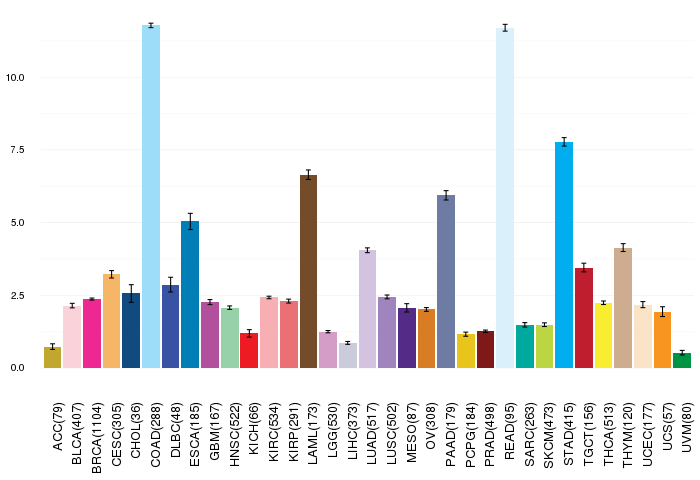 |
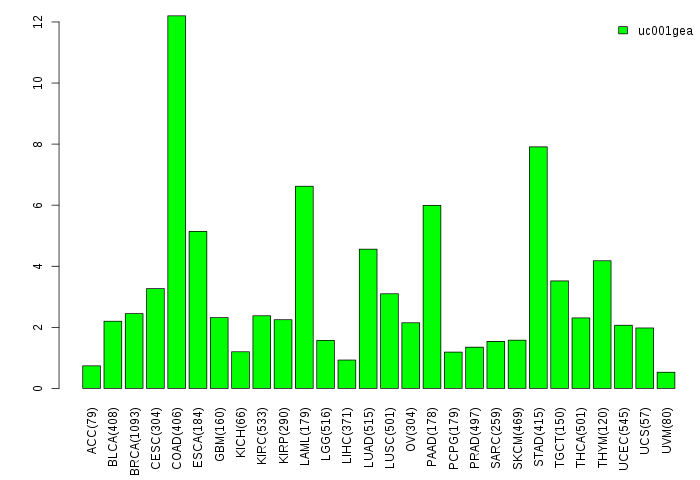
| Gene isoform expressions across 28 cancer types (X-axis: cancer type and Y-axis: log2(norm_counts+1)) (TCGA pan-cancer tcga_rsem_isoform_tpm, version 2016-09-01) |
 |
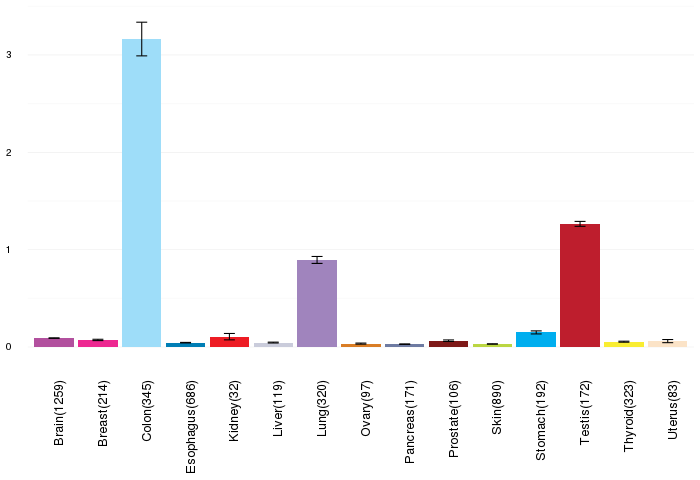
| Gene expressions across normal tissues of GTEx data (GTEx GTEx_Analysis_v6_RNA-seq_RNA-SeQCv1.1.8_gene_rpkm.gct) - Here, we shows the matched tissue types only among our 28 cancer types. |
 |
| Different expressions across 14 cancer types with more than 10 samples between matched tumors and normals (X-axis: cancer type and Y-axis: log2(norm_counts+1)) (TCGA IlluminaHiSeq_RNASeqV2, pan-cancer normalized log2(norm_counts+1) data, version 2016-08-16) |
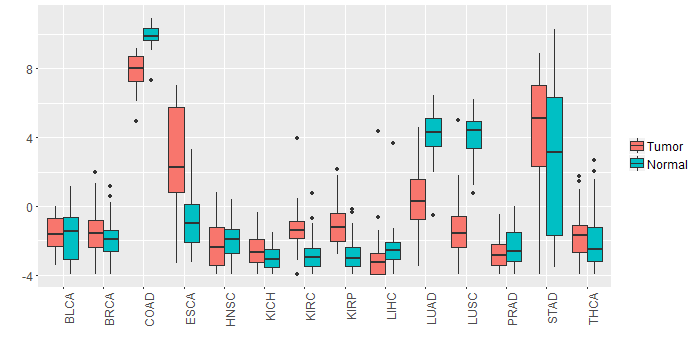 |
| - Significantly differentially expressed cancer types and information. (|Fold change|>1 and FDR<0.05) |
| Cancer type | Mean(exp) in tumor | Mean(exp) in matched normal | Log2FC | P-val. | FDR |
| COAD | 7.832578066 | 9.887497296 | -2.054919231 | 5.94E-10 | 6.89E-09 |
| KIRP | -1.060458713 | -2.835730588 | 1.775271875 | 7.29E-08 | 4.53E-07 |
| KIRC | -1.351801422 | -2.852455588 | 1.500654167 | 5.11E-16 | 2.77E-15 |
| LUSC | -1.381153382 | 4.076097598 | -5.45725098 | 1.38E-35 | 2.07E-33 |
| LUAD | 0.263692257 | 4.244775015 | -3.981082759 | 2.62E-28 | 1.78E-26 |
| Top |
| TissGene-miRNA for GPA33 |
| Significantly anti-correlated miRNAs of TissGene across 28 cancer types (Gene-miRNA relations from TargetScanHuman Relsease 7.1, Conserved_Site_Context_Scores.txt.zip, 06.01.2016) (TCGA IlluminaHiSeq_miRNASeq, log2(RPM+1) data, version 2016-11-21) (TCGA IlluminaHiSeq_RNASeqV2, log2(normalized_count+1) data, version 2016-08-16) (Spearman’s Rank Correlation (p-value<0.05 and coefficient<-0.25)) |
| Cancer type | miRNA id | miRNA accession | P-val. | Coeff. | # samples |
| Top |
| TissGeneMut for GPA33 |
| TissGeneSNV for GPA33 |
| nsSNV counts per each loci. Different colors of circles represent different cancer types. Circle size denotes number of samples. (TCGA somatic mutation (SNPs and small INDELs) data, version 2016-04-25) * Click on the image to enlarge it in a new window. |
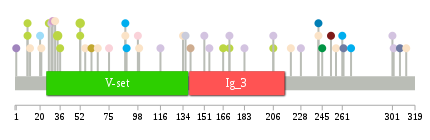 |
 |
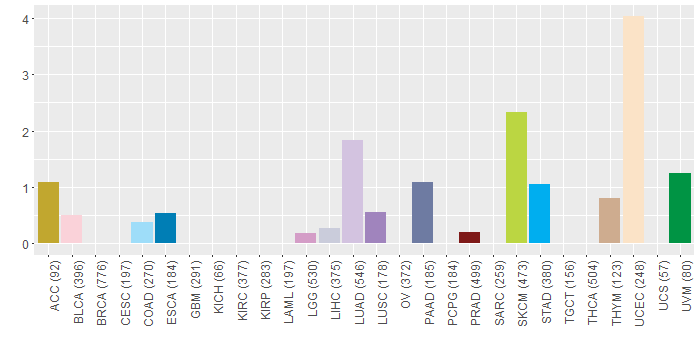
| Somatic nucleotide variants of TissGene across 28 cancer types (X-axis: cancer type and Y-axis: % of mutated samples) The numbers in parentheses are numbers of samples with mutation (nsSNVs). (TCGA somatic mutation (SNPs and small INDELs) data, version 2016-04-25) |
 |
| - nsSNVs sorted by frequency. |
| AAchange | Cancer type | # samples |
| p.S34L | SKCM | 2 |
| p.R52Q | SKCM | 2 |
| p.V89I | STAD | 1 |
| p.Q220H | UCEC | 1 |
| p.W10* | SKCM | 1 |
| p.G36E | SKCM | 1 |
| p.M1I | LUSC | 1 |
| p.R307M | PAAD | 1 |
| p.A242V | ESCA | 1 |
| p.P140S | THYM | 1 |
| p.I56L | UCEC | 1 |
| p.P144Q | HNSC | 1 |
| p.R134H | UCEC | 1 |
| p.P171H | LUAD | 1 |
| p.S206L | SKCM | 1 |
| p.Q183* | LUAD | 1 |
| p.L61I | ACC | 1 |
| p.A242T | UCEC | 1 |
| p.E312* | UCEC | 1 |
| p.C261R | STAD | 1 |
| p.Y301* | LUAD | 1 |
| p.S75L | BLCA | 1 |
| p.W10X | SKCM | 1 |
| p.R302M | LUAD | 1 |
| p.A21V | UCEC | 1 |
| p.V228I | LUAD | 1 |
| p.E166K | SKCM | 1 |
| p.E151D | LUAD | 1 |
| p.S98C | BLCA | 1 |
| p.P171S | SKCM | 1 |
| p.D20N | COAD | 1 |
| p.I252T | PRAD | 1 |
| p.R52* | SKCM | 1 |
| p.R262* | PAAD | 1 |
| p.R88H | UCEC | 1 |
| p.V30I | LGG | 1 |
| p.V245M | UVM | 1 |
| p.R88H | STAD | 1 |
| p.P27S | SKCM | 1 |
| p.S206* | LUAD | 1 |
| p.R32W | UCEC | 1 |
| p.I256T | UCEC | 1 |
| p.T66P | UCEC | 1 |
| p.L136F | LIHC | 1 |
| p.T268A | STAD | 1 |
| p.G155W | LUAD | 1 |
| p.D99A | UCEC | 1 |
| p.L12V | UCEC | 1 |
| p.E116K | LUAD | 1 |
| p.D29A | LUAD | 1 |
| Top |
| TissGeneCNV for GPA33 |
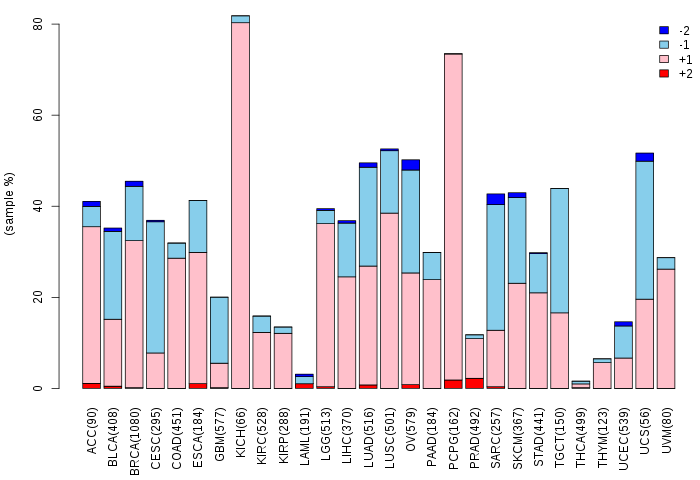
| Copy number variations of TissGene across 28 cancer types (X-axis: cancer type and Y-axis: % of CNV samples) (TCGA Gistic2_CopyNumber_Gistic2_all_data_by_genes, Gistic2 copy number data, version 2016-08-16) |
 |
| Top |
| TissGeneFusions for GPA33 |
| Fusion genes including TissGene (ChimerDB 3.0, 2016-12-01 and TCGA fusion Portal 2015-12-01) |
| Database | Src | Cancer type | Sample | Fusion gene | ORF | 5'-gene BP | 3'-gene BP |
| Chimerdb3.0 | ChiTaRs | NA | AW376283 | GPA33-SOD1 | chr1:167042668 | chr21:33031961 |
| Top |
| TissGeneNet for GPA33 |
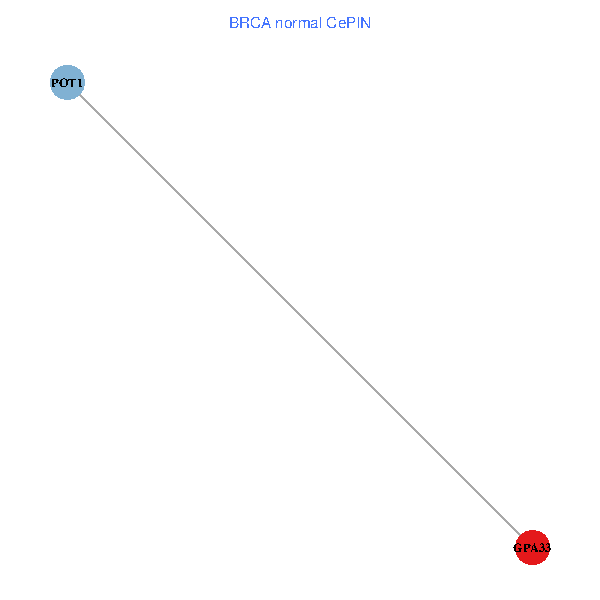
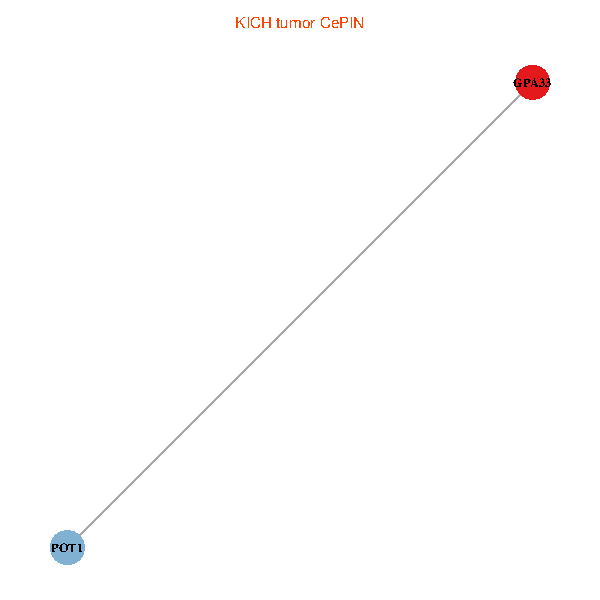
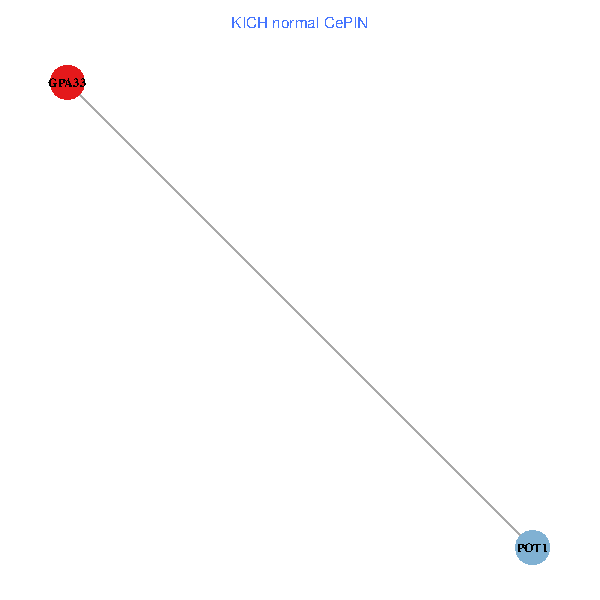
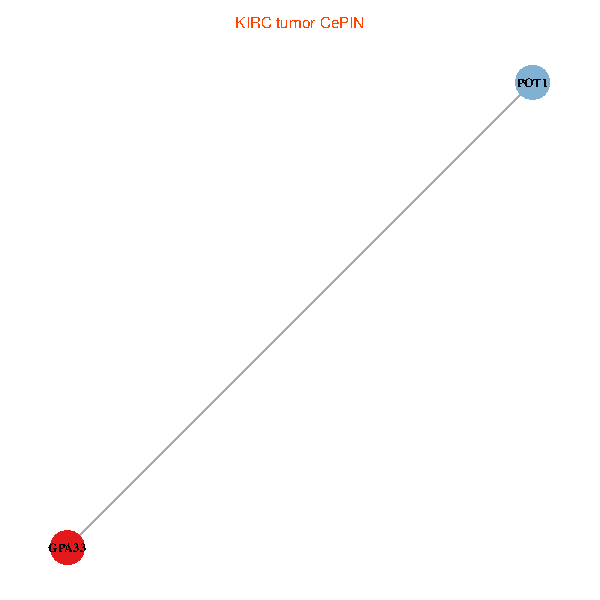
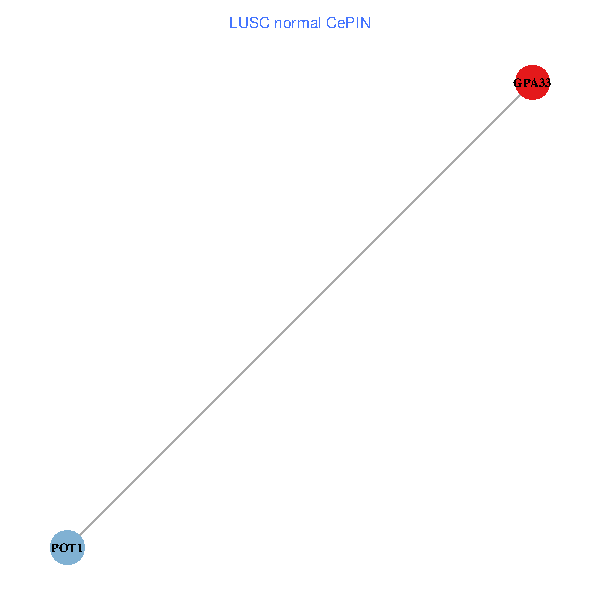
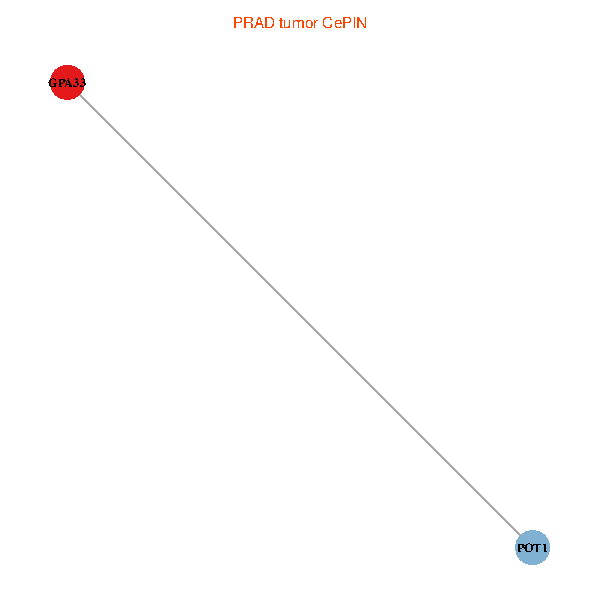
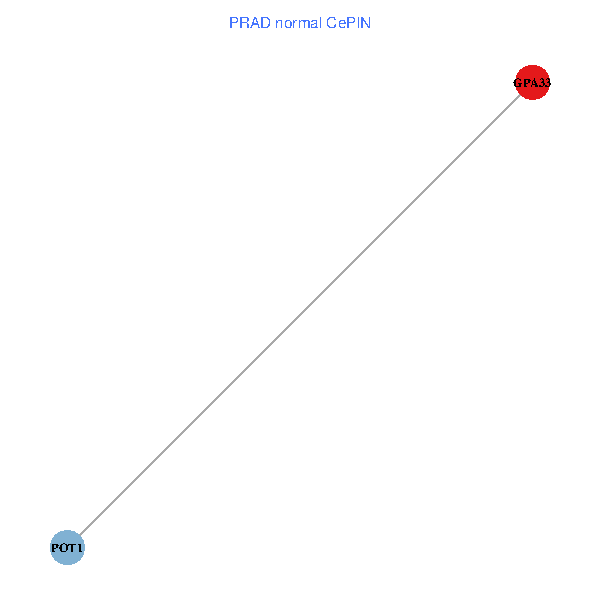
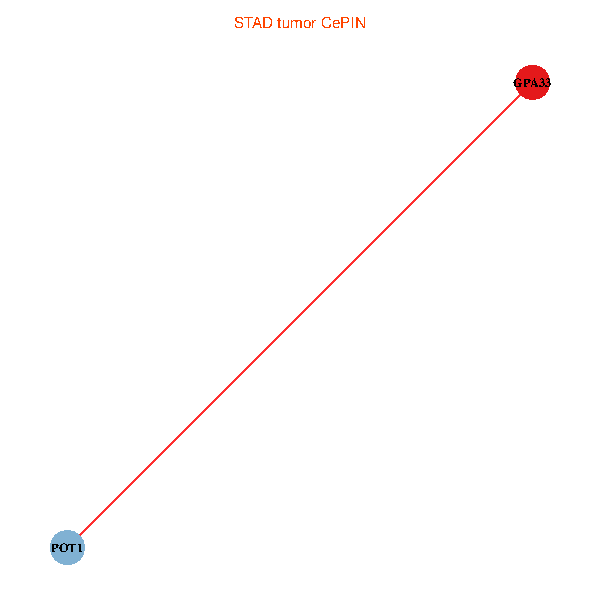
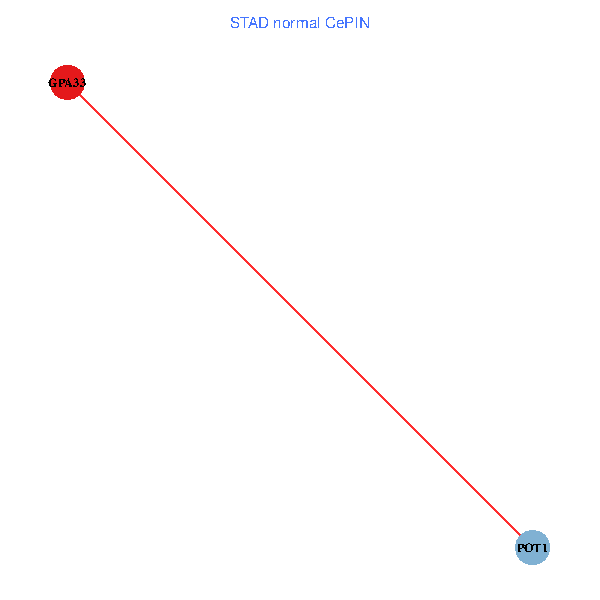
| Co-expressed gene networks based on protein-protein interaction data (CePIN) (TCGA IlluminaHiSeq_RNASeqV2, pan-cancer normalized log2(norm_counts+1) data, version 2016-08-16) (PINA2 ppi data) |
| BRCA (tumor) | BRCA (normal) |
| GPA33, POT1 (tumor) | GPA33, POT1 (normal) |
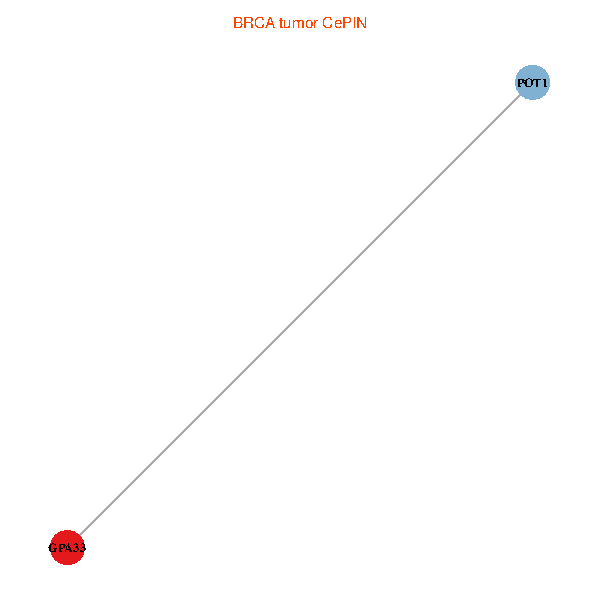 |  |
| COAD (tumor) | COAD (normal) |
| GPA33, POT1 (tumor) | GPA33, POT1 (normal) |
 |  |
| HNSC (tumor) | HNSC (normal) |
| GPA33, POT1 (tumor) | GPA33, POT1 (normal) |
 |  |
| KICH (tumor) | KICH (normal) |
| GPA33, POT1 (tumor) | GPA33, POT1 (normal) |
 |  |
| KIRC (tumor) | KIRC (normal) |
| GPA33, POT1 (tumor) | GPA33, POT1 (normal) |
 |  |
| KIRP (tumor) | KIRP (normal) |
| GPA33, POT1 (tumor) | GPA33, POT1 (normal) |
 |  |
| LIHC (tumor) | LIHC (normal) |
| GPA33, POT1 (tumor) | GPA33, POT1 (normal) |
 |  |
| LUAD (tumor) | LUAD (normal) |
| GPA33, POT1 (tumor) | GPA33, POT1 (normal) |
 |  |
| LUSC (tumor) | LUSC (normal) |
| GPA33, POT1 (tumor) | GPA33, POT1 (normal) |
 |  |
| PRAD (tumor) | PRAD (normal) |
| GPA33, POT1 (tumor) | GPA33, POT1 (normal) |
 |  |
| STAD (tumor) | STAD (normal) |
| GPA33, POT1 (tumor) | GPA33, POT1 (normal) |
 |  |
| THCA (tumor) | THCA (normal) |
| GPA33, POT1 (tumor) | GPA33, POT1 (normal) |
 |  |
| Top |
| TissGeneProg for GPA33 |
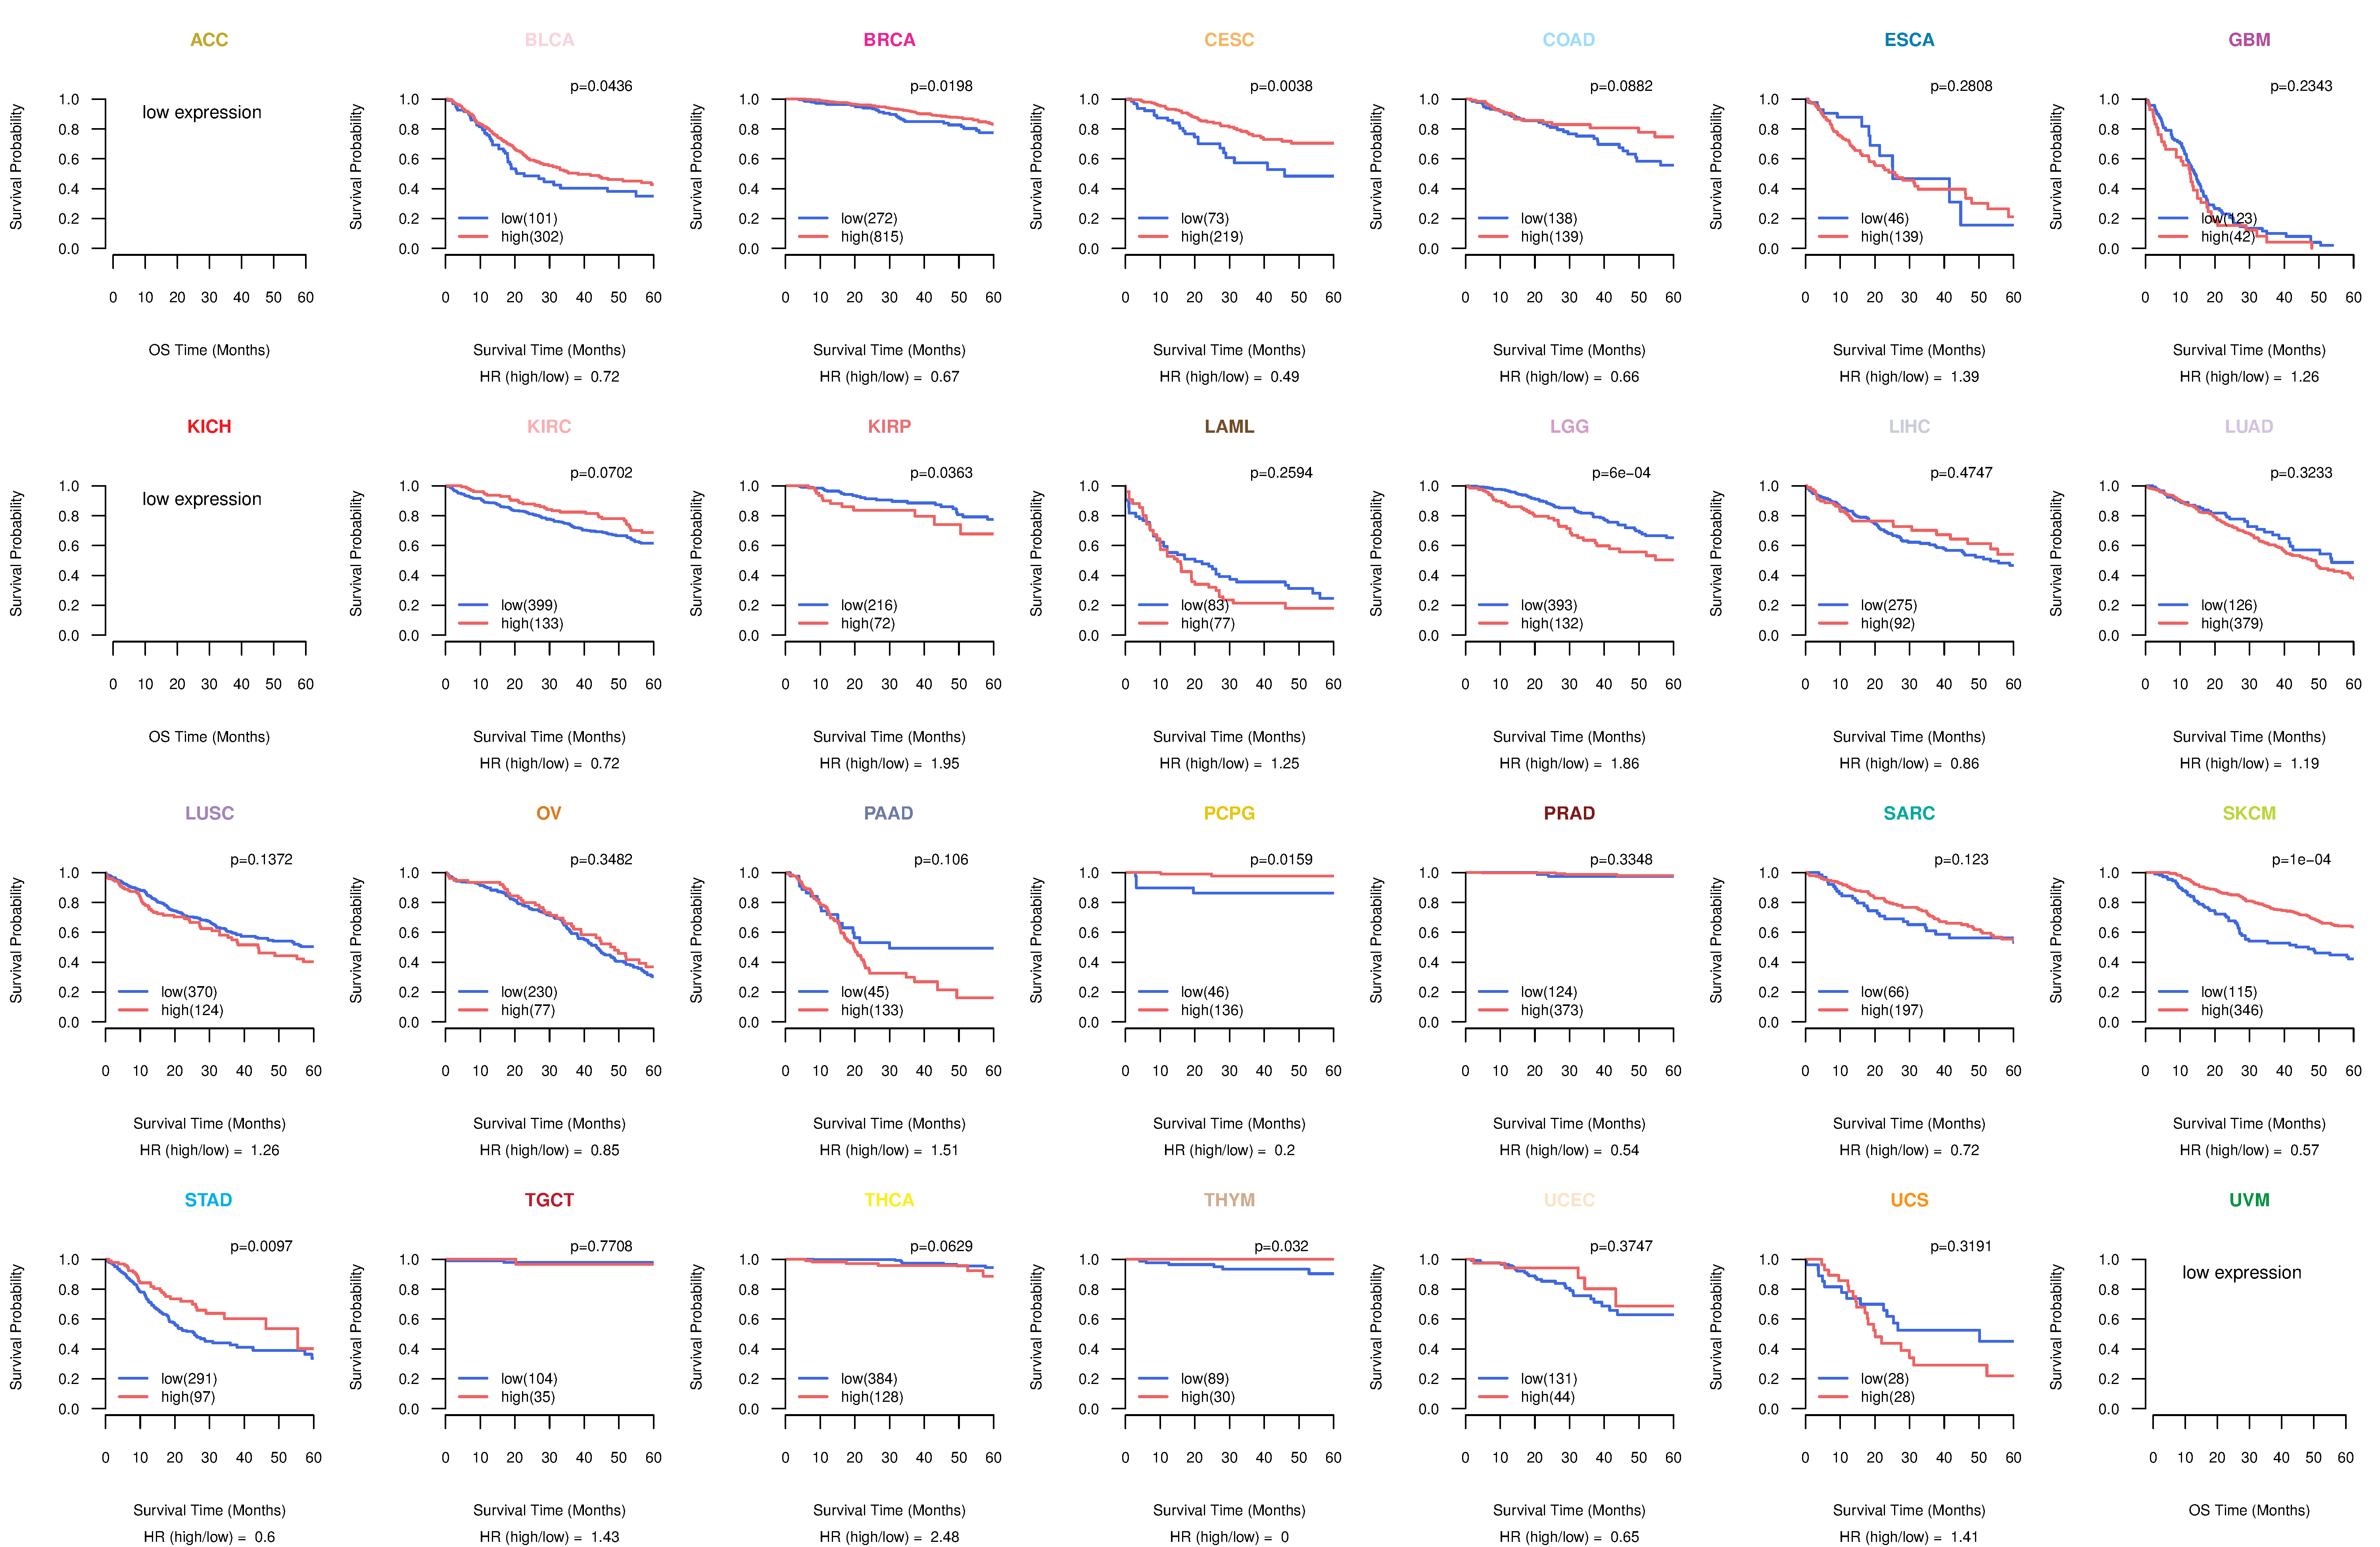
| Kaplan-Meier plots with logrank tests of overall survival (OS) using 28 cancer types (TCGA IlluminaHiSeq_RNASeqV2, pan-cancer normalized log2(norm_counts+1) data, version 2016-08-16) (TCGA clinicalMatrix, phenotype data, version 2016-04-27) * Click on the image to enlarge it in a new window. |
 |
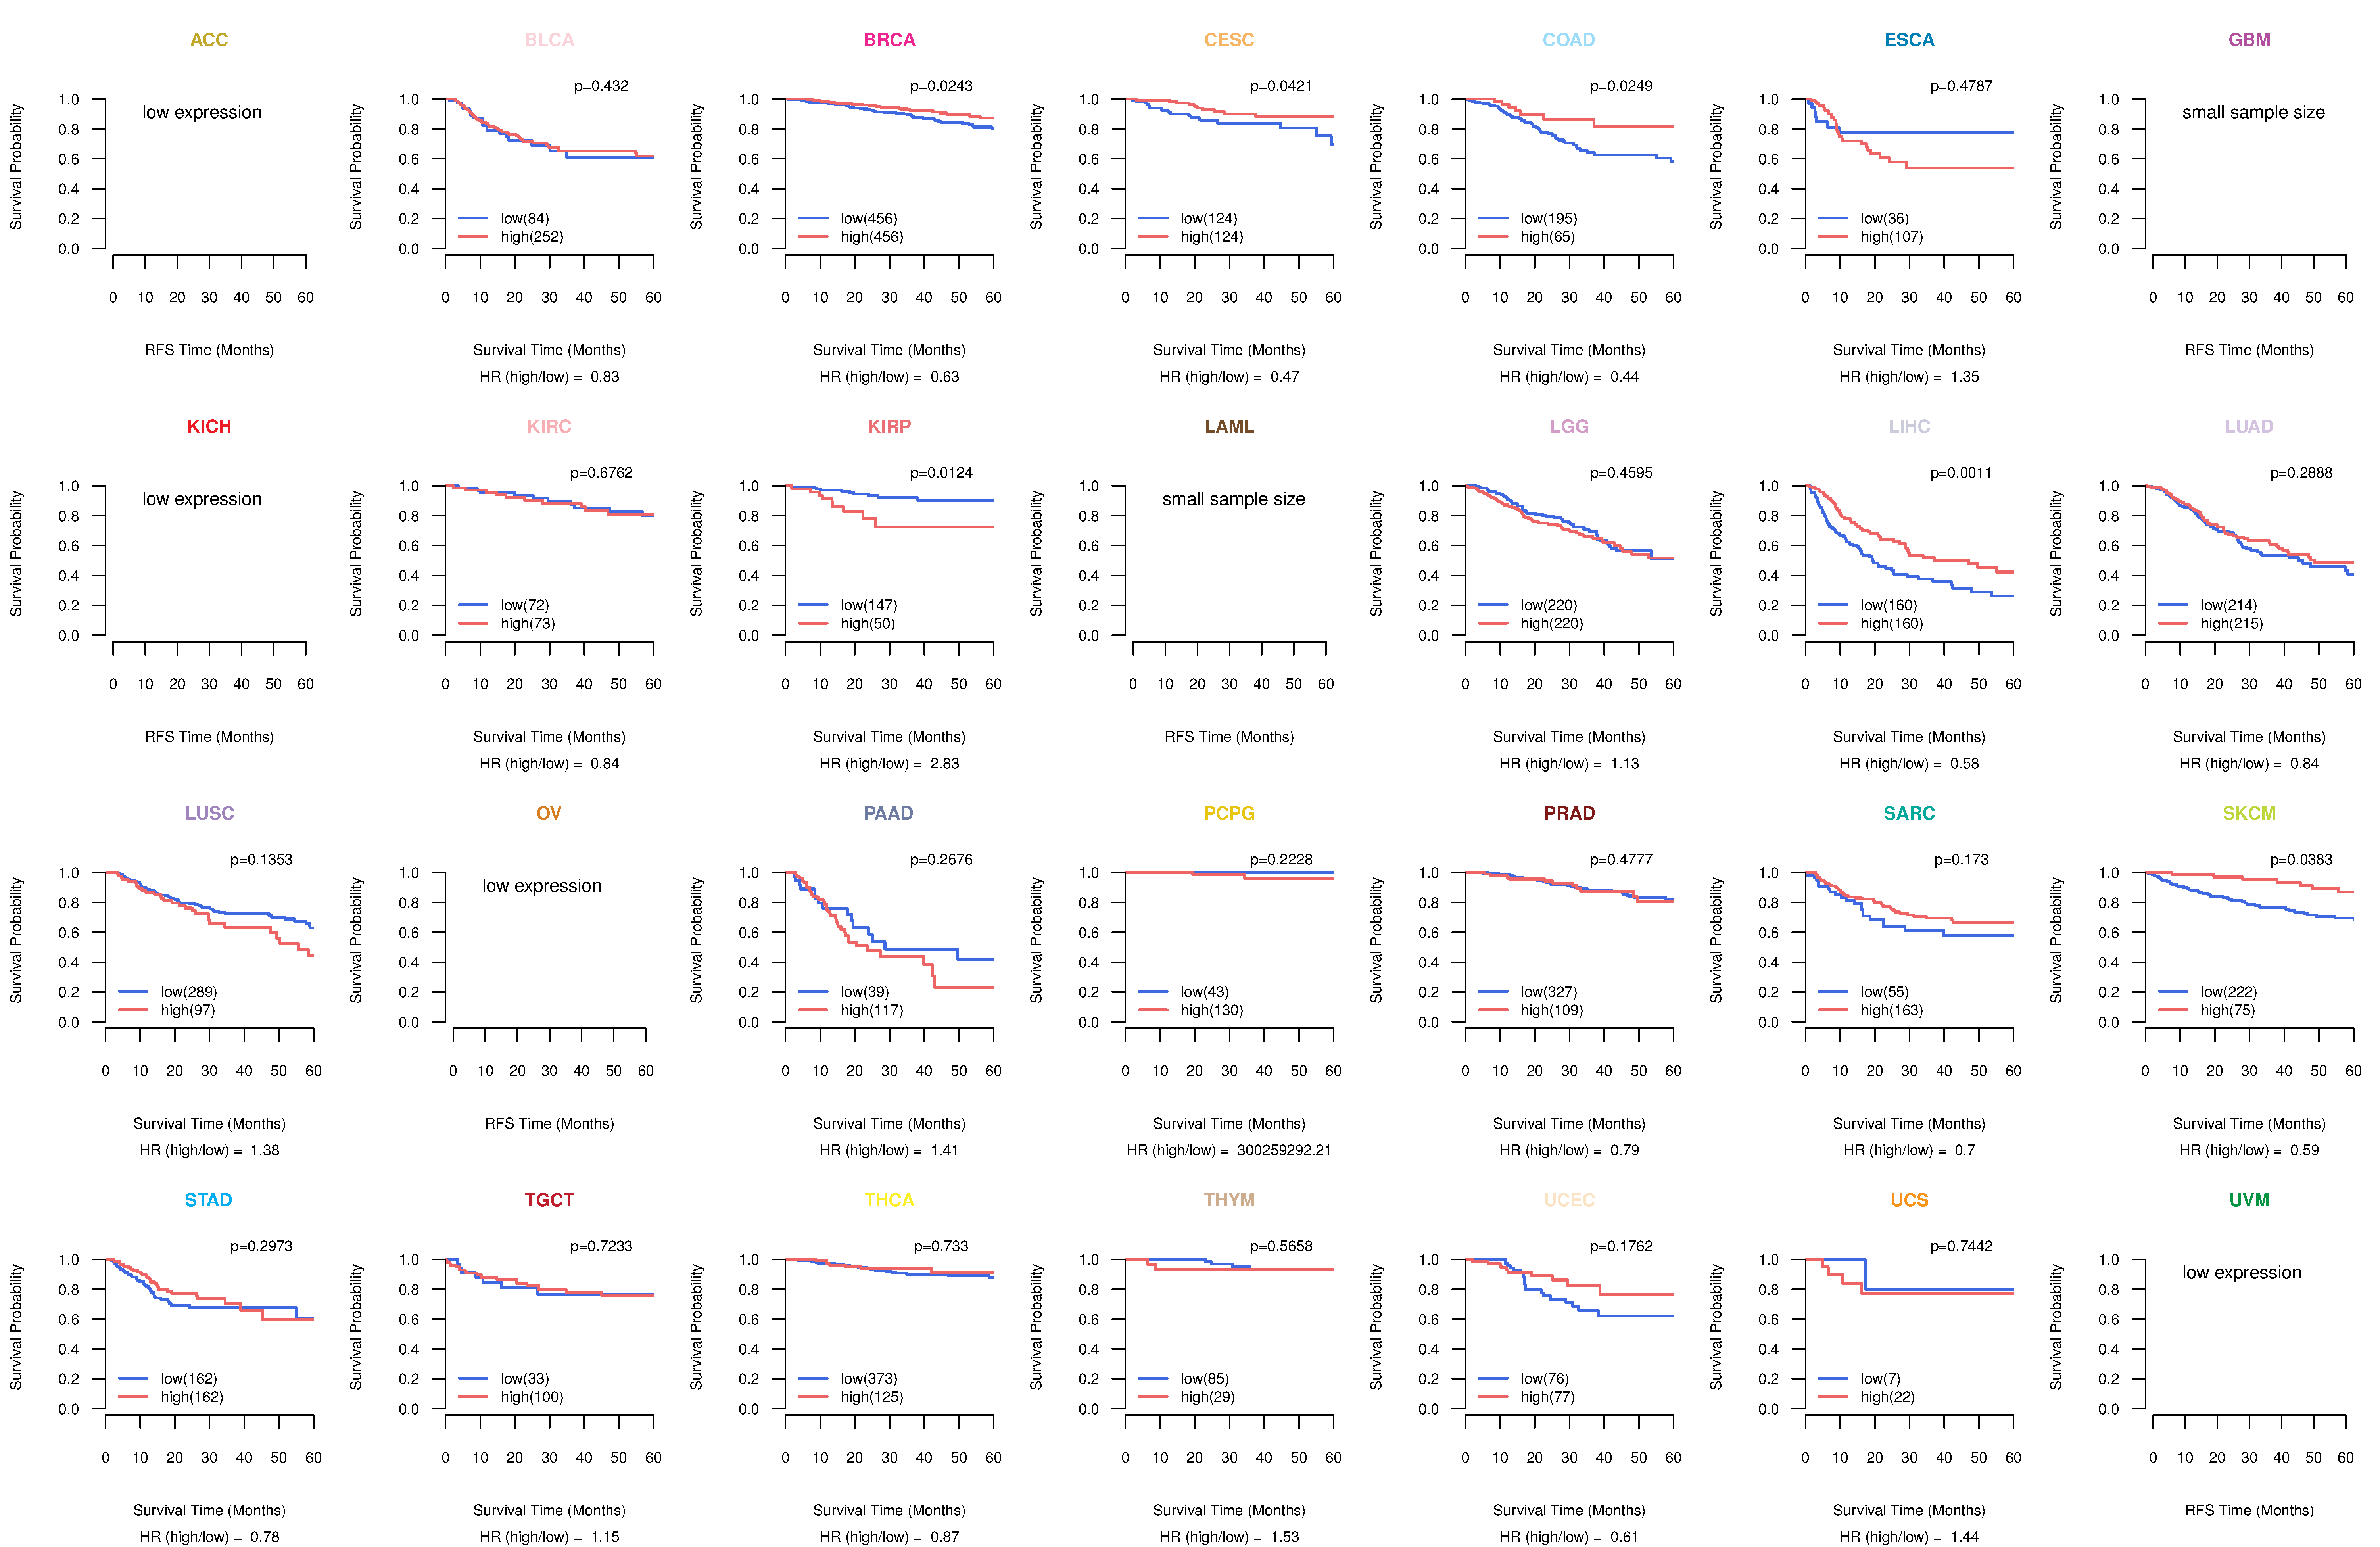
| Kaplan-Meier plots with logrank test of relapse free survival (RFS) using 28 cancer types (TCGA IlluminaHiSeq_RNASeqV2, pan-cancer normalized log2(norm_counts+1) data, version 2016-08-16) (TCGA clinicalMatrix, phenotype data, version 2016-04-27) * Click on the image enlarge it in a new window. |
 |
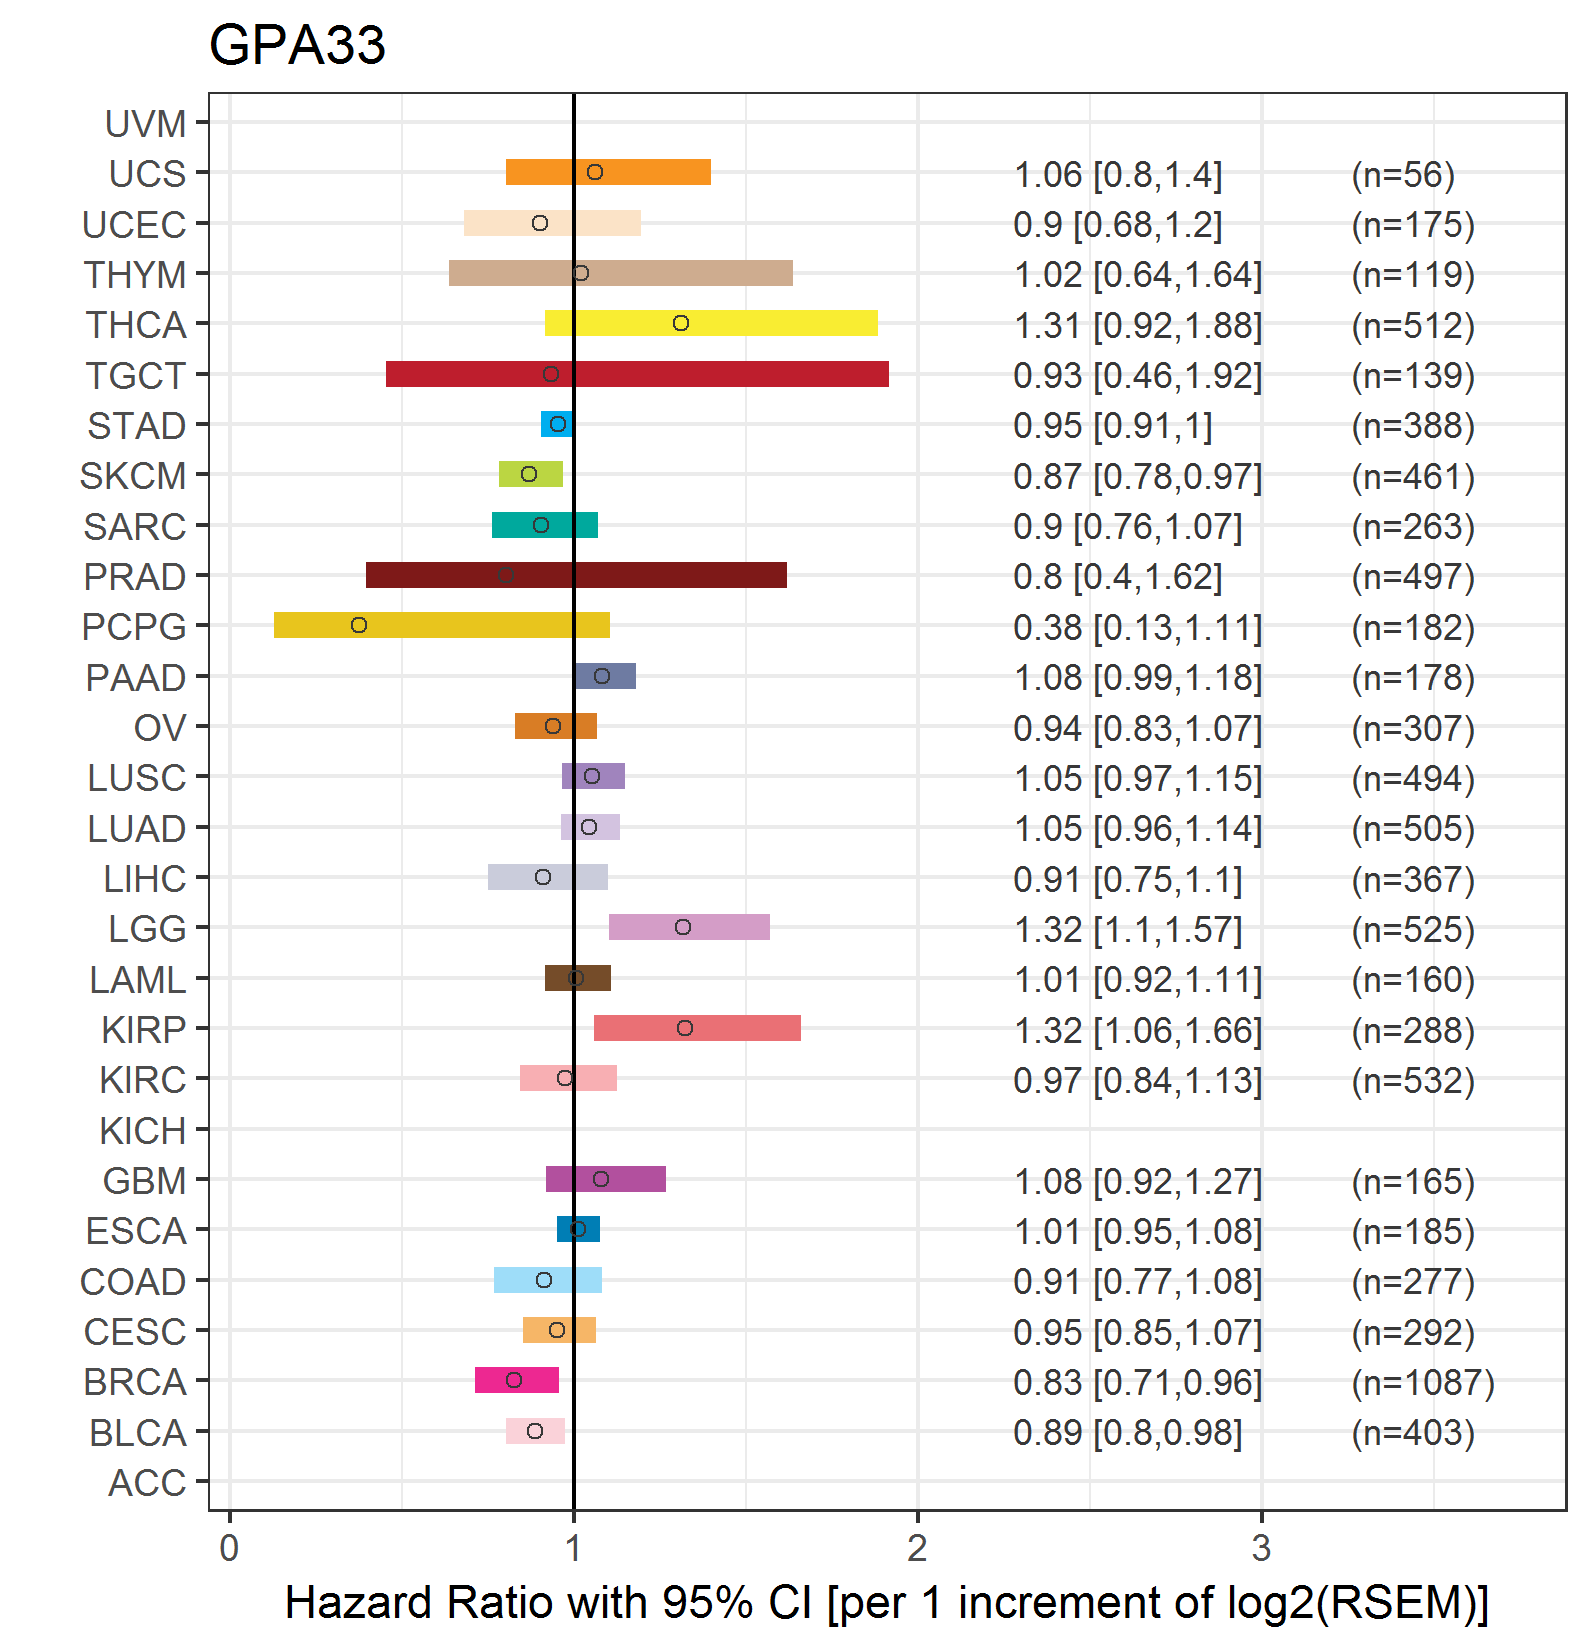
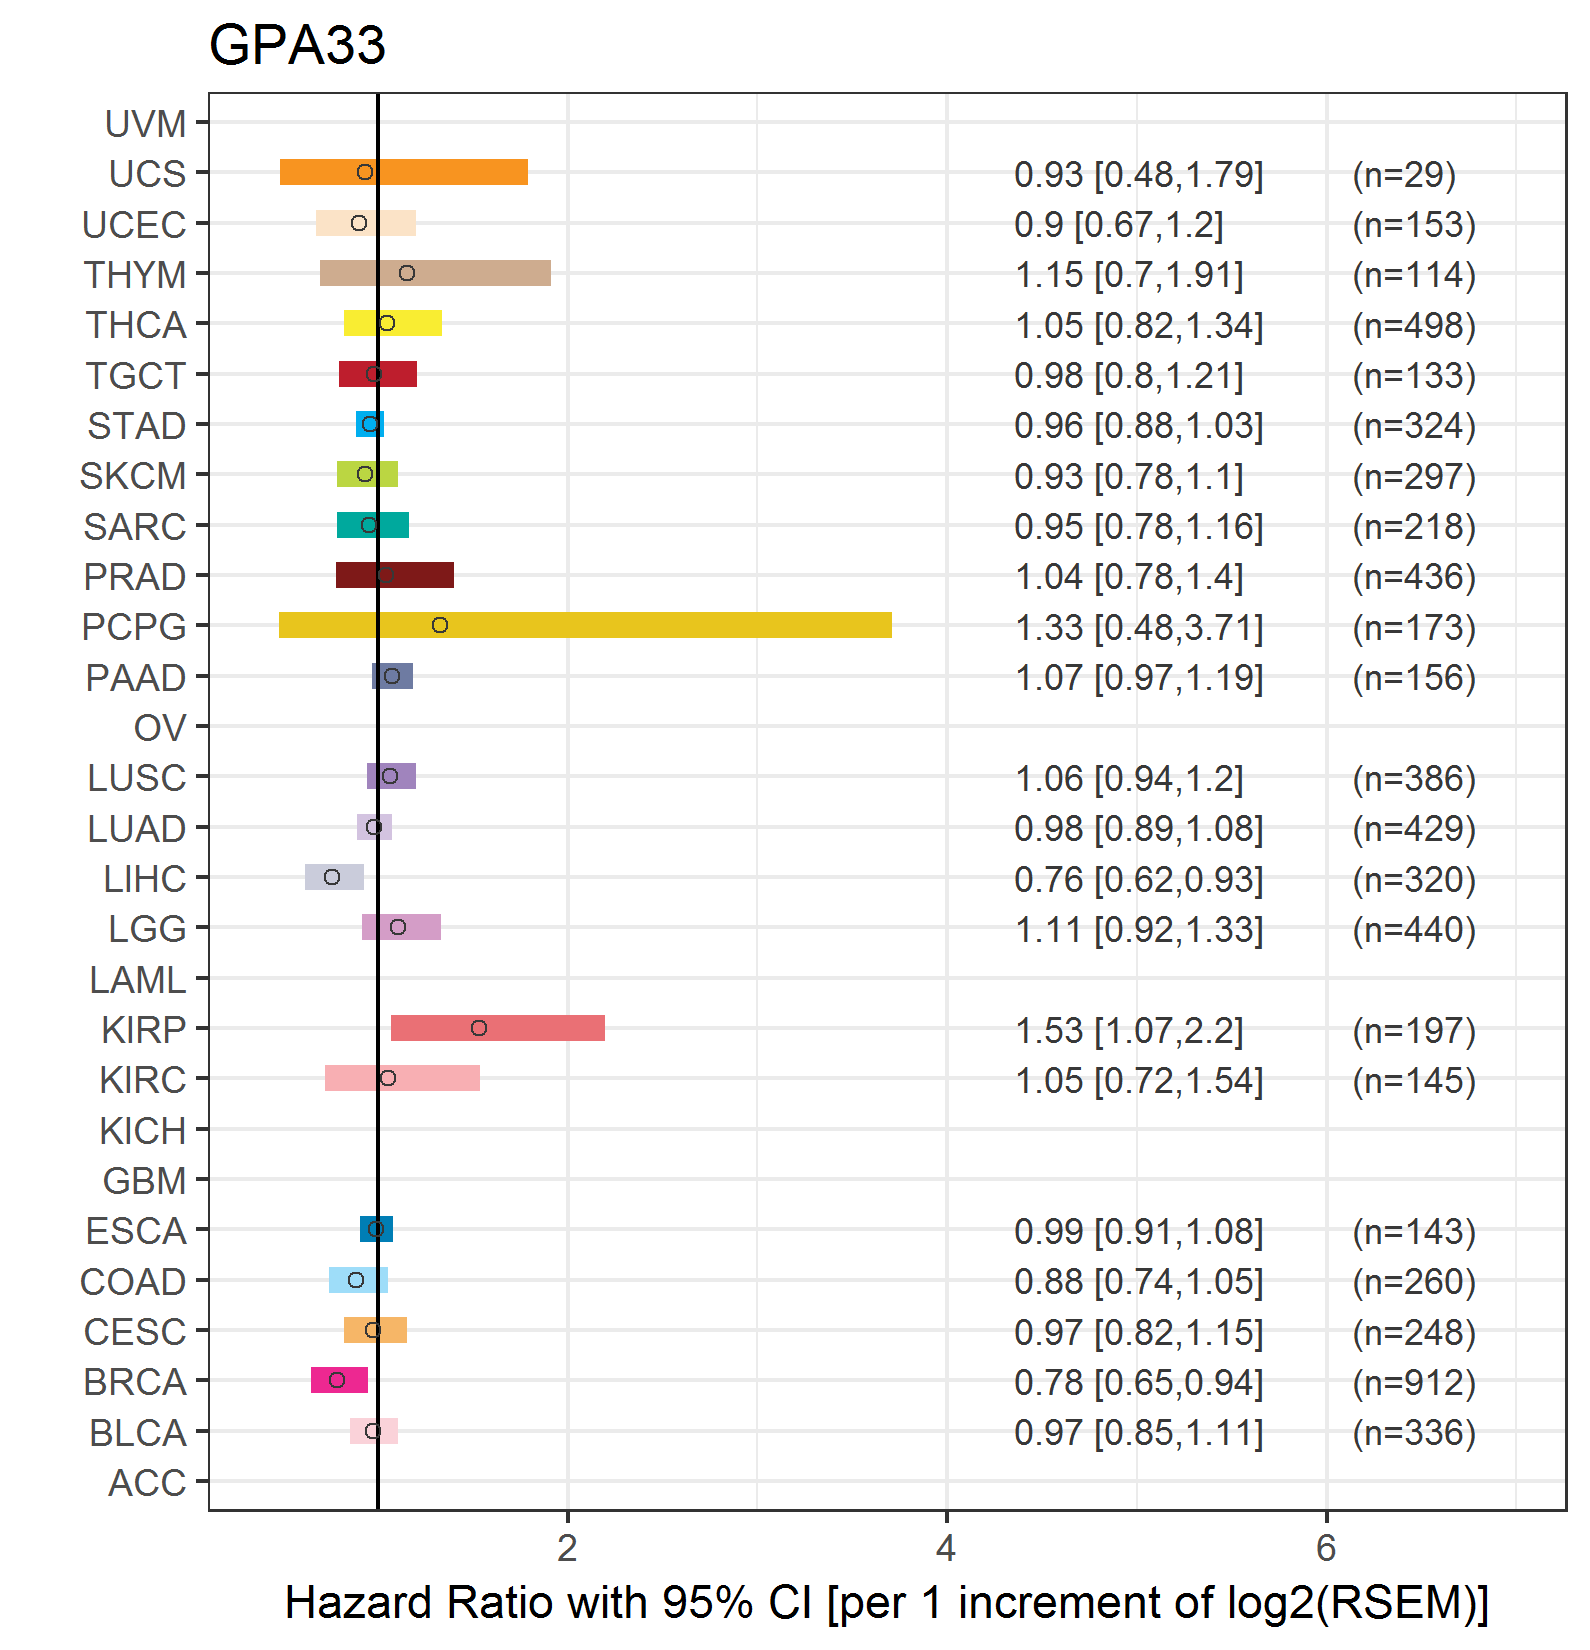
| Forest plot of Cox proportional hazard ratio (HR) and 95% CI of overall survival (OS) using 28 cancer types (TCGA IlluminaHiSeq_RNASeqV2, pan-cancer normalized log2(norm_counts+1) data, version 2016-08-16) (TCGA clinicalMatrix, phenotype data, version 2016-04-27) * Click on the image enlarge it in a new window. |
 |
| Forest plot of Cox proportional hazard ratio (HR) and 95% CI of relapse free survival (RFS) using 28 cancer types (TCGA IlluminaHiSeq_RNASeqV2, pan-cancer normalized log2(norm_counts+1) data, version 2016-08-16) (TCGA clinicalMatrix, phenotype data, version 2016-04-27) * Click on the image enlarge it in a new window. |
 |
| Top |
| TissGeneClin for GPA33 |
| TissGeneDrug for GPA33 |
| Drug information targeting TissGene (DrugBank Version 5.0.6, 2017-04-01) |
| DrugBank ID | Drug name | Drug activity | Drug type | Drug status |
| Top |
| TissGeneDisease for GPA33 |
| Disease information associated with TissGene (DisGeNet, 2016-06-01) |
| Disease ID | Disease name | # pubmeds | Source |
| umls:C0007102 | Malignant tumor of colon | 5 | BeFree |
| umls:C0699790 | Colon Carcinoma | 4 | BeFree |
| umls:C0026946 | Mycoses | 2 | BeFree |
| umls:C0020538 | Hypertensive disease | 1 | GAD |
| umls:C0029456 | Osteoporosis | 1 | GAD |
| umls:C0040336 | Tobacco Use Disorder | 1 | GAD |
|
Copyright 2016-Present - The University of Texas Health Science Center at Houston (UTHealth) Web File Viewing | How to Report, Fraud, Waste and Abuse | State of Texas | Statewide Search | Texas Homeland Security | Site Policies |