 |
| |
| |
| |
| |
| |
| |
|

| TissGeneSummary for SLC17A2 |
 Gene summary Gene summary |
| Basic gene information | Gene symbol | SLC17A2 |
| Gene name | solute carrier family 17, member 2 | |
| Synonyms | NPT3 | |
| Cytomap | UCSC genome browser: 6p21.3 | |
| Type of gene | protein-coding | |
| RefGenes | NM_001286123.1, NM_001286125.1,NM_005835.3, | |
| Description | Na(+)/PI cotransporter 3sodium phosphate transporter 3sodium-dependent phosphate transport protein 3sodium/phosphate cotransporter 3solute carrier family 17 (vesicular glutamate transporter), member 2 | |
| Modification date | 20141207 | |
| dbXrefs | MIM : 611049 | |
| HGNC : HGNC | ||
| Ensembl : ENSG00000112337 | ||
| HPRD : 10232 | ||
| Vega : OTTHUMG00000014413 | ||
| Protein | UniProt: go to UniProt's Cross Reference DB Table | |
| Expression | CleanEX: HS_SLC17A2 | |
| BioGPS: 10246 | ||
| Pathway | NCI Pathway Interaction Database: SLC17A2 | |
| KEGG: SLC17A2 | ||
| REACTOME: SLC17A2 | ||
| Pathway Commons: SLC17A2 | ||
| Context | iHOP: SLC17A2 | |
| ligand binding site mutation search in PubMed: SLC17A2 | ||
| UCL Cancer Institute: SLC17A2 | ||
| Assigned class in TissGDB* | C | |
| Included tissue-specific gene expression resources | HPA,GTEx | |
| Specific-tissues in normal samples (assigned by TissGDB using HPA, TiGER, and GTEx) | Liver | |
| Cancer types related to the specific-tissues in cancer samples (assigned by TissGDB using TCGA) | LIHC | |
| Reference showing the relevant tissue of SLC17A2 | ||
| Description by TissGene annotations | ||
| * Class A consists of genes with literature evidence and is part of the cTissGenes. Class B consists of only cTissGenes without additional evidence. The remaining genes belong to Class C. |
| Gene ontology having evidence of Inferred from Direct Assay (IDA) from Entrez |
| GO ID | GO term | PubMed ID |
| Top |
| TissGeneExp for SLC17A2 |
| Gene expressions across 28 cancer types (X-axis: cancer type and Y-axis: log2(norm_counts+1)) (TCGA IlluminaHiSeq_RNASeqV2, pan-cancer normalized log2(norm_counts+1) data, version 2016-08-16) |
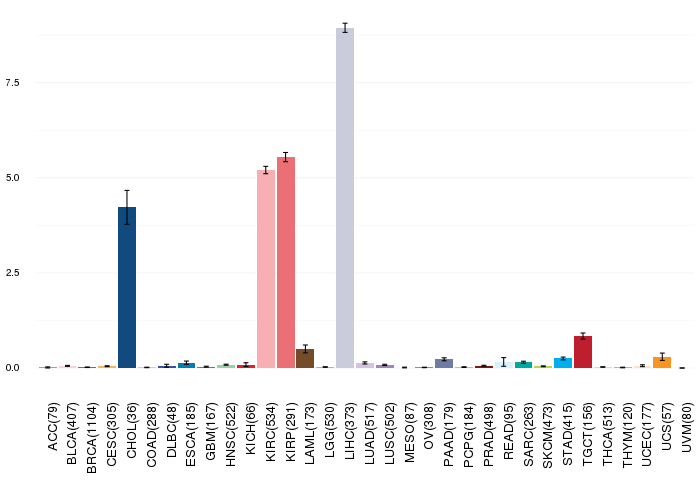 |
| Gene isoform expressions across 28 cancer types (X-axis: cancer type and Y-axis: log2(norm_counts+1)) (TCGA pan-cancer tcga_rsem_isoform_tpm, version 2016-09-01) |
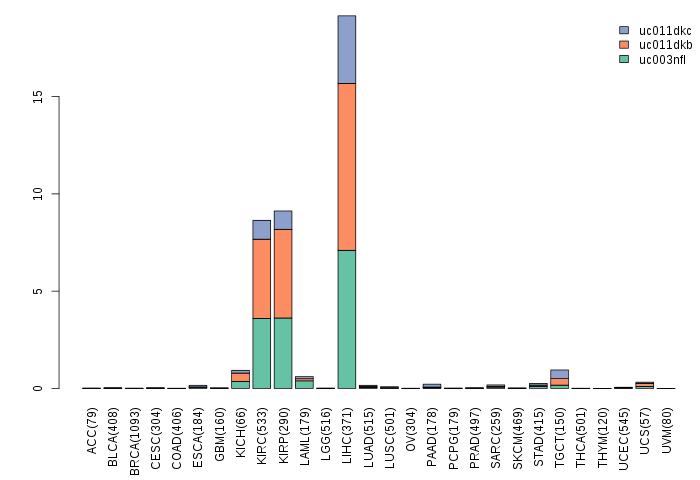 |
| Gene expressions across normal tissues of GTEx data (GTEx GTEx_Analysis_v6_RNA-seq_RNA-SeQCv1.1.8_gene_rpkm.gct) - Here, we shows the matched tissue types only among our 28 cancer types. |
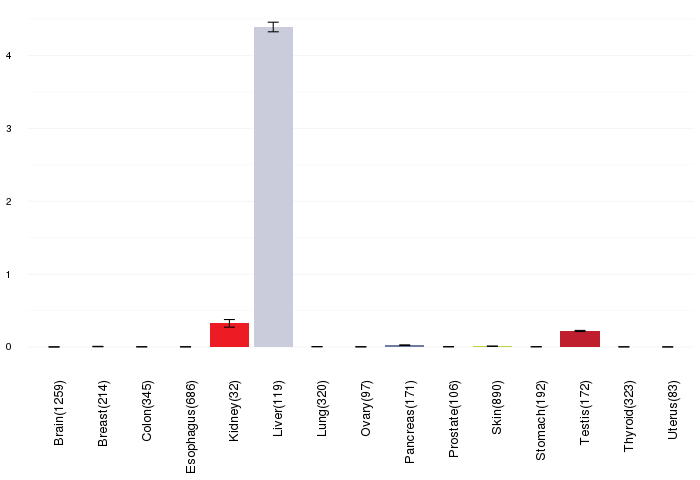 |
| Different expressions across 14 cancer types with more than 10 samples between matched tumors and normals (X-axis: cancer type and Y-axis: log2(norm_counts+1)) (TCGA IlluminaHiSeq_RNASeqV2, pan-cancer normalized log2(norm_counts+1) data, version 2016-08-16) |
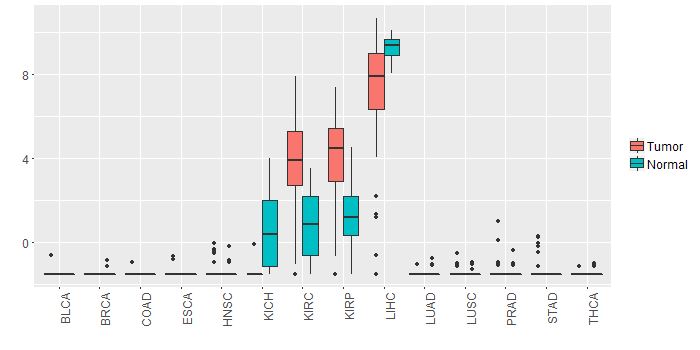 |
| - Significantly differentially expressed cancer types and information. (|Fold change|>1 and FDR<0.05) |
| Cancer type | Mean(exp) in tumor | Mean(exp) in matched normal | Log2FC | P-val. | FDR |
| LIHC | 7.1450757 | 9.2544077 | -2.109332 | 1.04E-06 | 5.55E-06 |
| KIRP | 3.855037825 | 1.122656575 | 2.73238125 | 7.07E-07 | 3.69E-06 |
| KIRC | 3.829761088 | 0.756279144 | 3.073481944 | 4.00E-18 | 2.64E-17 |
| KICH | -1.4736823 | 0.5671337 | -2.040816 | 7.03E-06 | 2.29E-05 |
| Top |
| TissGene-miRNA for SLC17A2 |
| Significantly anti-correlated miRNAs of TissGene across 28 cancer types (Gene-miRNA relations from TargetScanHuman Relsease 7.1, Conserved_Site_Context_Scores.txt.zip, 06.01.2016) (TCGA IlluminaHiSeq_miRNASeq, log2(RPM+1) data, version 2016-11-21) (TCGA IlluminaHiSeq_RNASeqV2, log2(normalized_count+1) data, version 2016-08-16) (Spearman’s Rank Correlation (p-value<0.05 and coefficient<-0.25)) |
| Cancer type | miRNA id | miRNA accession | P-val. | Coeff. | # samples |
| Top |
| TissGeneMut for SLC17A2 |
| TissGeneSNV for SLC17A2 |
| nsSNV counts per each loci. Different colors of circles represent different cancer types. Circle size denotes number of samples. (TCGA somatic mutation (SNPs and small INDELs) data, version 2016-04-25) * Click on the image to enlarge it in a new window. |
 |
 |
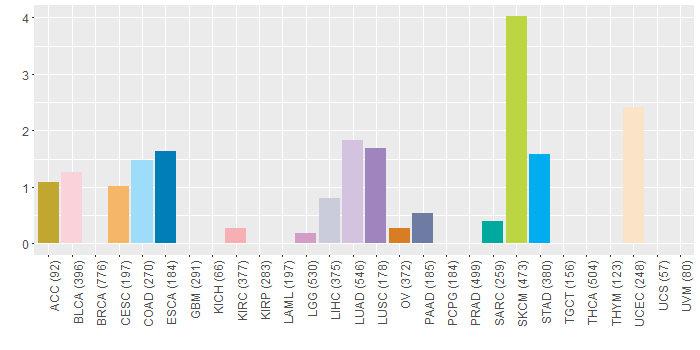
| Somatic nucleotide variants of TissGene across 28 cancer types (X-axis: cancer type and Y-axis: % of mutated samples) The numbers in parentheses are numbers of samples with mutation (nsSNVs). (TCGA somatic mutation (SNPs and small INDELs) data, version 2016-04-25) |
 |
| - nsSNVs sorted by frequency. |
| AAchange | Cancer type | # samples |
| p.E76K | SKCM | 3 |
| p.R151W | SKCM | 2 |
| p.Y405* | STAD | 1 |
| p.S447F | ESCA | 1 |
| p.Q371H | COAD | 1 |
| p.E245V | LUAD | 1 |
| p.S218C | SKCM | 1 |
| p.R348X | PAAD | 1 |
| p.G217S | BLCA | 1 |
| p.L54I | COAD | 1 |
| p.P62A | STAD | 1 |
| p.L131P | SKCM | 1 |
| p.R348* | UCEC | 1 |
| p.S352L | SKCM | 1 |
| p.L293R | OV | 1 |
| p.S363F | UCEC | 1 |
| p.C14G | COAD | 1 |
| p.P265S | SKCM | 1 |
| p.R477C | LGG | 1 |
| p.T290A | ESCA | 1 |
| p.G164C | STAD | 1 |
| p.P260L | BLCA | 1 |
| p.T302A | COAD | 1 |
| p.S259Y | READ | 1 |
| p.L202I | LUSC | 1 |
| p.R348* | PAAD | 1 |
| p.R348Q | SKCM | 1 |
| p.G281V | UCEC | 1 |
| p.D78N | BLCA | 1 |
| p.Y439C | BLCA | 1 |
| p.L342I | READ | 1 |
| p.G329E | SKCM | 1 |
| p.R151W | UCEC | 1 |
| p.H285Y | SKCM | 1 |
| p.G415R | SKCM | 1 |
| p.S251P | LIHC | 1 |
| p.A185P | LUAD | 1 |
| p.G330S | BLCA | 1 |
| p.D334N | ESCA | 1 |
| p.A44T | STAD | 1 |
| p.R423K | SKCM | 1 |
| p.S396F | SKCM | 1 |
| p.V199L | ACC | 1 |
| p.A323P | CESC | 1 |
| p.P359L | SKCM | 1 |
| p.F286L | READ | 1 |
| p.V264D | LIHC | 1 |
| p.H285N | LUAD | 1 |
| p.S242R | LUSC | 1 |
| p.R35C | UCEC | 1 |
| p.Y84C | LUAD | 1 |
| p.S27* | LUAD | 1 |
| p.G3E | SKCM | 1 |
| p.L426X | KIRC | 1 |
| p.W209* | BLCA | 1 |
| p.H248Q | LUAD | 1 |
| p.T428N | LUSC | 1 |
| p.Q85* | SKCM | 1 |
| p.L332M | LUAD | 1 |
| p.A268V | UCEC | 1 |
| p.W276C | LUAD | 1 |
| p.G3R | SKCM | 1 |
| p.A157T | STAD | 1 |
| p.D468Y | LUAD | 1 |
| p.L478F | PAAD | 1 |
| p.T219N | LUAD | 1 |
| p.I249T | CESC | 1 |
| p.Y299C | READ | 1 |
| p.R477H | SKCM | 1 |
| p.D234G | LIHC | 1 |
| p.L332M | SARC | 1 |
| p.M356K | STAD | 1 |
| p.P318S | STAD | 1 |
| Top |
| TissGeneCNV for SLC17A2 |
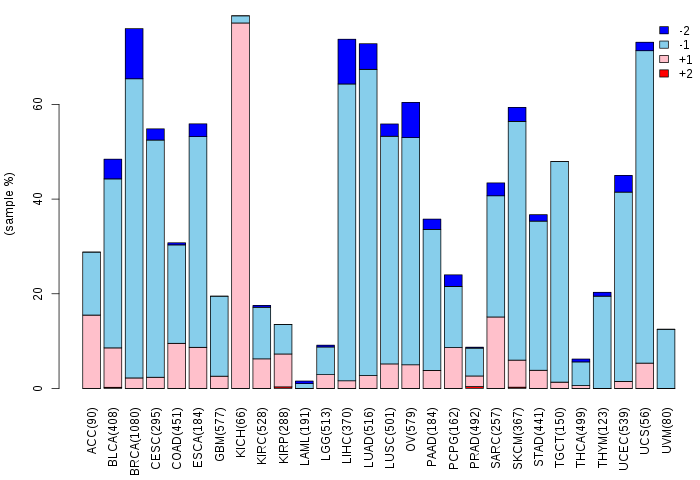
| Copy number variations of TissGene across 28 cancer types (X-axis: cancer type and Y-axis: % of CNV samples) (TCGA Gistic2_CopyNumber_Gistic2_all_data_by_genes, Gistic2 copy number data, version 2016-08-16) |
 |
| Top |
| TissGeneFusions for SLC17A2 |
| Fusion genes including TissGene (ChimerDB 3.0, 2016-12-01 and TCGA fusion Portal 2015-12-01) |
| Database | Src | Cancer type | Sample | Fusion gene | ORF | 5'-gene BP | 3'-gene BP |
| Top |
| TissGeneNet for SLC17A2 |
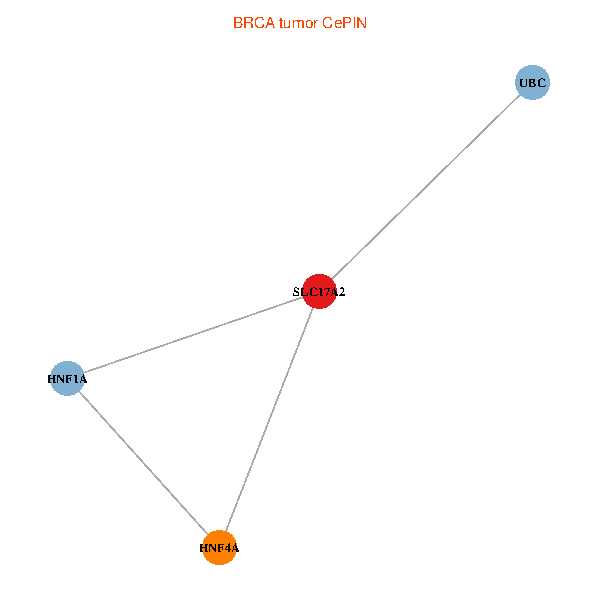
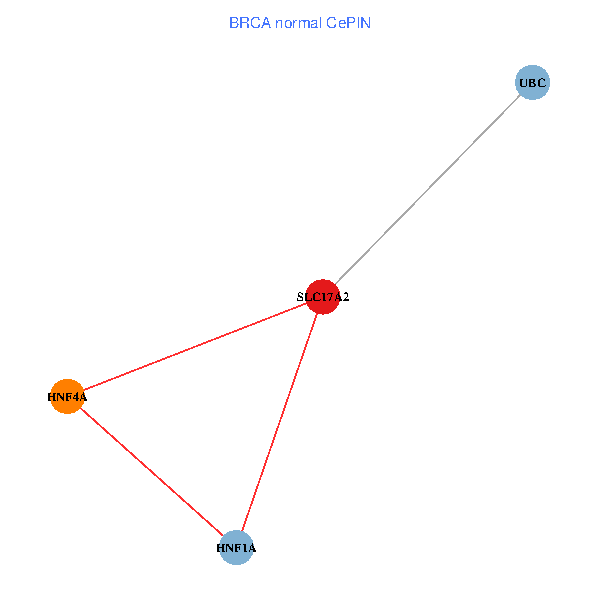
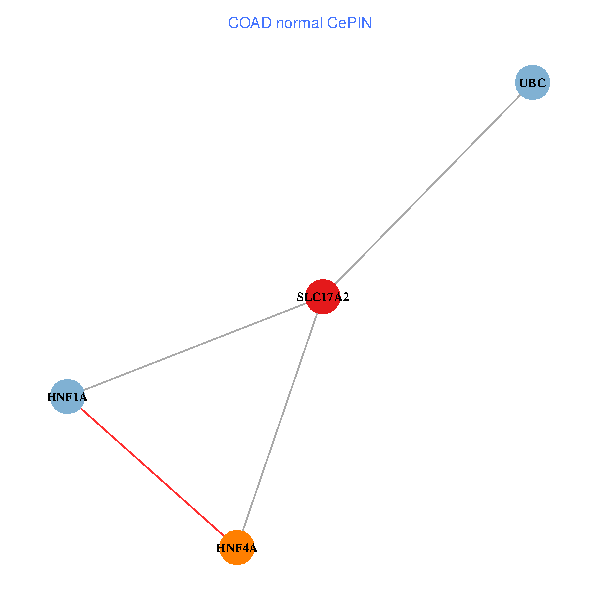
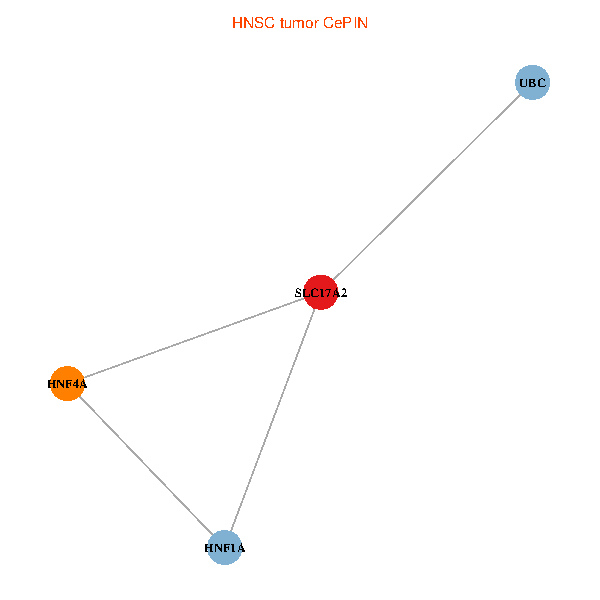
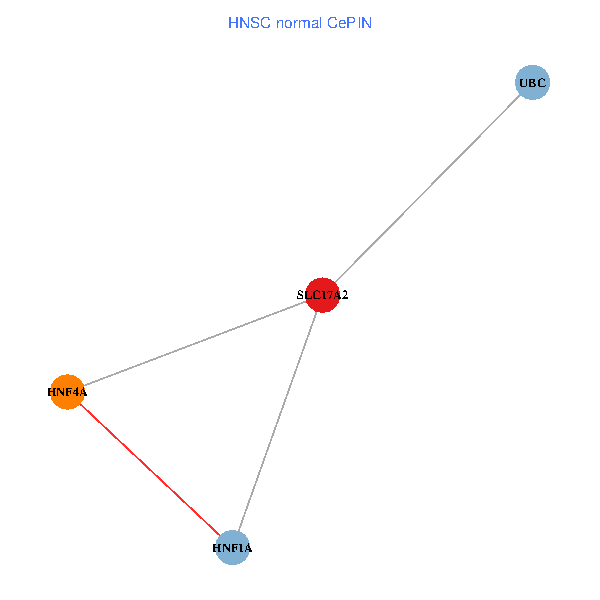
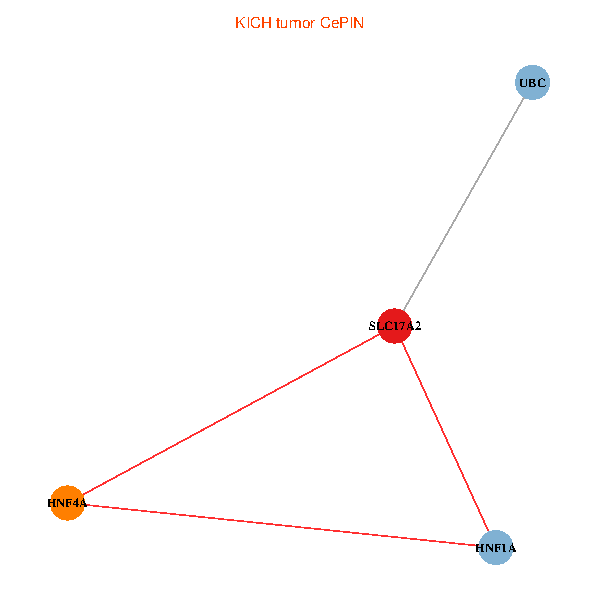
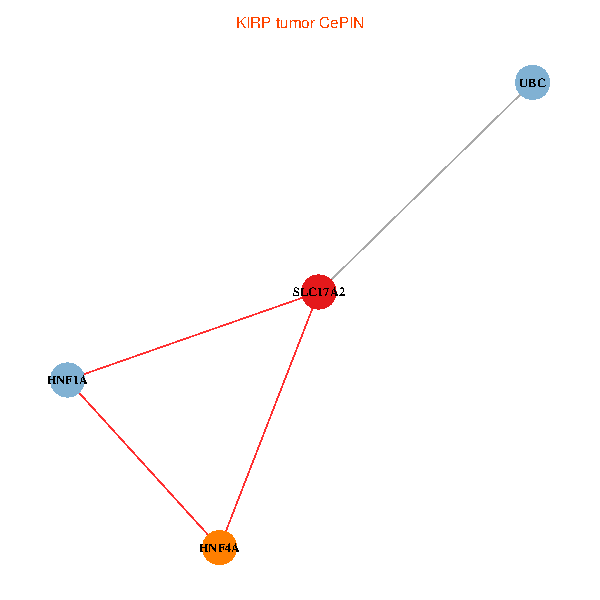
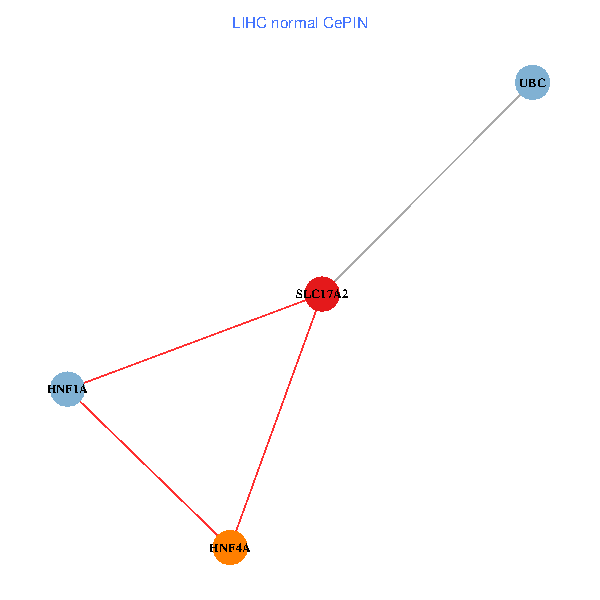
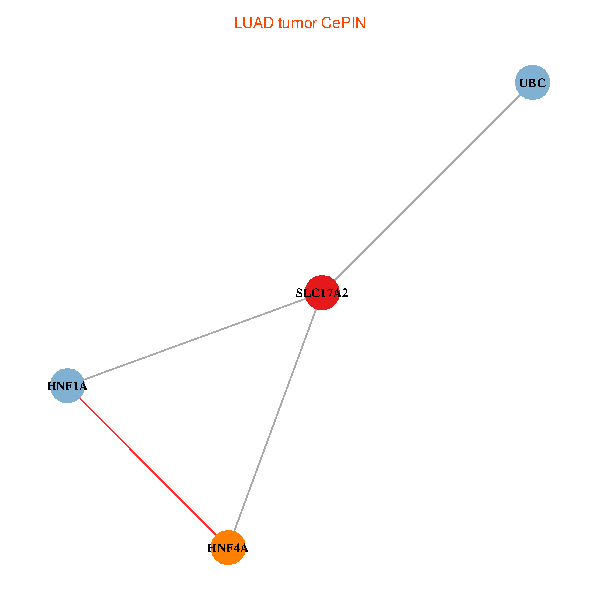
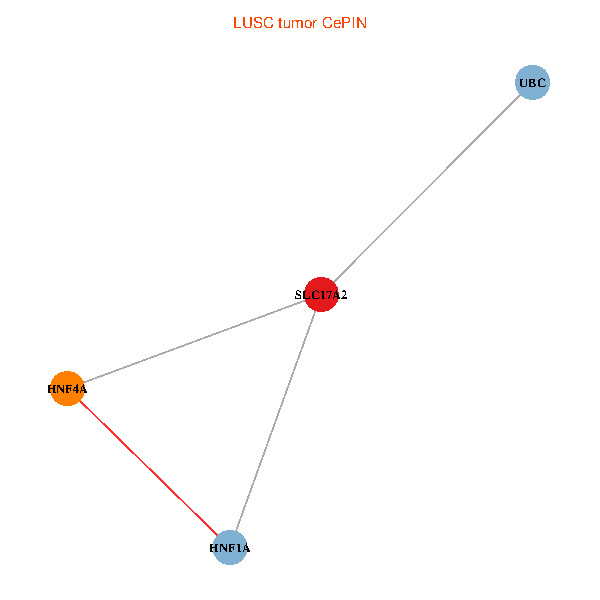
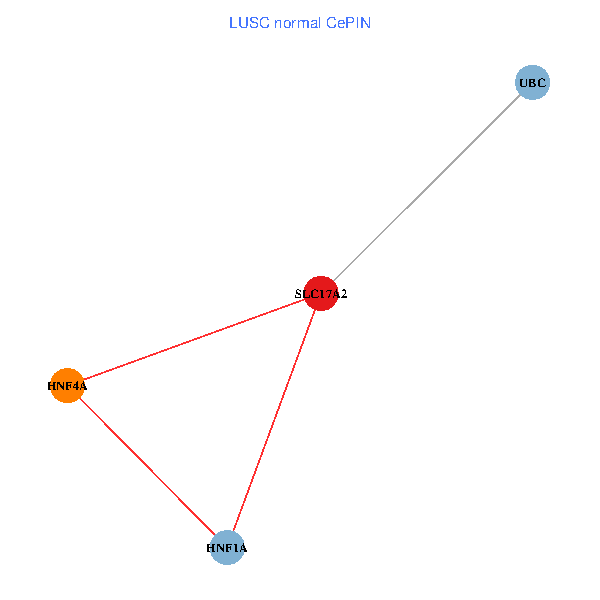
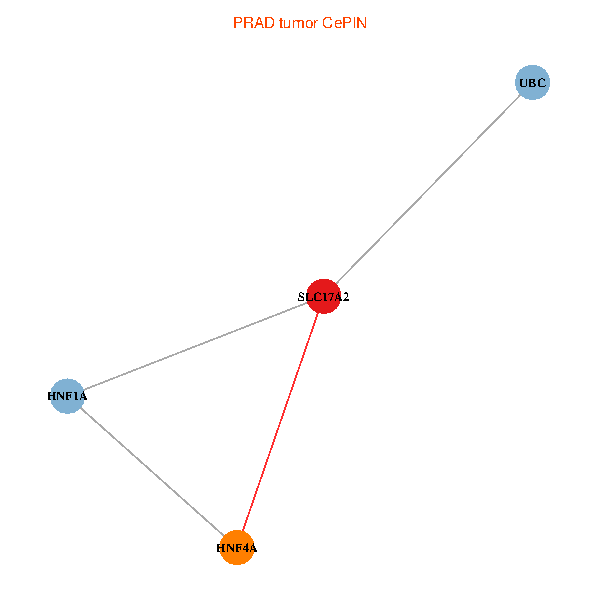
| Co-expressed gene networks based on protein-protein interaction data (CePIN) (TCGA IlluminaHiSeq_RNASeqV2, pan-cancer normalized log2(norm_counts+1) data, version 2016-08-16) (PINA2 ppi data) |
| BRCA (tumor) | BRCA (normal) |
| SLC17A2, HNF4A, UBC, HNF1A (tumor) | SLC17A2, HNF4A, UBC, HNF1A (normal) |
 |  |
| COAD (tumor) | COAD (normal) |
| SLC17A2, HNF4A, UBC, HNF1A (tumor) | SLC17A2, HNF4A, UBC, HNF1A (normal) |
 |  |
| HNSC (tumor) | HNSC (normal) |
| SLC17A2, HNF4A, UBC, HNF1A (tumor) | SLC17A2, HNF4A, UBC, HNF1A (normal) |
 |  |
| KICH (tumor) | KICH (normal) |
| SLC17A2, HNF4A, UBC, HNF1A (tumor) | SLC17A2, HNF4A, UBC, HNF1A (normal) |
 |  |
| KIRC (tumor) | KIRC (normal) |
| SLC17A2, HNF4A, UBC, HNF1A (tumor) | SLC17A2, HNF4A, UBC, HNF1A (normal) |
 |  |
| KIRP (tumor) | KIRP (normal) |
| SLC17A2, HNF4A, UBC, HNF1A (tumor) | SLC17A2, HNF4A, UBC, HNF1A (normal) |
 |  |
| LIHC (tumor) | LIHC (normal) |
| SLC17A2, HNF4A, UBC, HNF1A (tumor) | SLC17A2, HNF4A, UBC, HNF1A (normal) |
 |  |
| LUAD (tumor) | LUAD (normal) |
| SLC17A2, HNF4A, UBC, HNF1A (tumor) | SLC17A2, HNF4A, UBC, HNF1A (normal) |
 |  |
| LUSC (tumor) | LUSC (normal) |
| SLC17A2, HNF4A, UBC, HNF1A (tumor) | SLC17A2, HNF4A, UBC, HNF1A (normal) |
 |  |
| PRAD (tumor) | PRAD (normal) |
| SLC17A2, HNF4A, UBC, HNF1A (tumor) | SLC17A2, HNF4A, UBC, HNF1A (normal) |
 |  |
| STAD (tumor) | STAD (normal) |
| SLC17A2, HNF4A, UBC, HNF1A (tumor) | SLC17A2, HNF4A, UBC, HNF1A (normal) |
 |  |
| THCA (tumor) | THCA (normal) |
| SLC17A2, HNF4A, UBC, HNF1A (tumor) | SLC17A2, HNF4A, UBC, HNF1A (normal) |
 |  |
| Top |
| TissGeneProg for SLC17A2 |
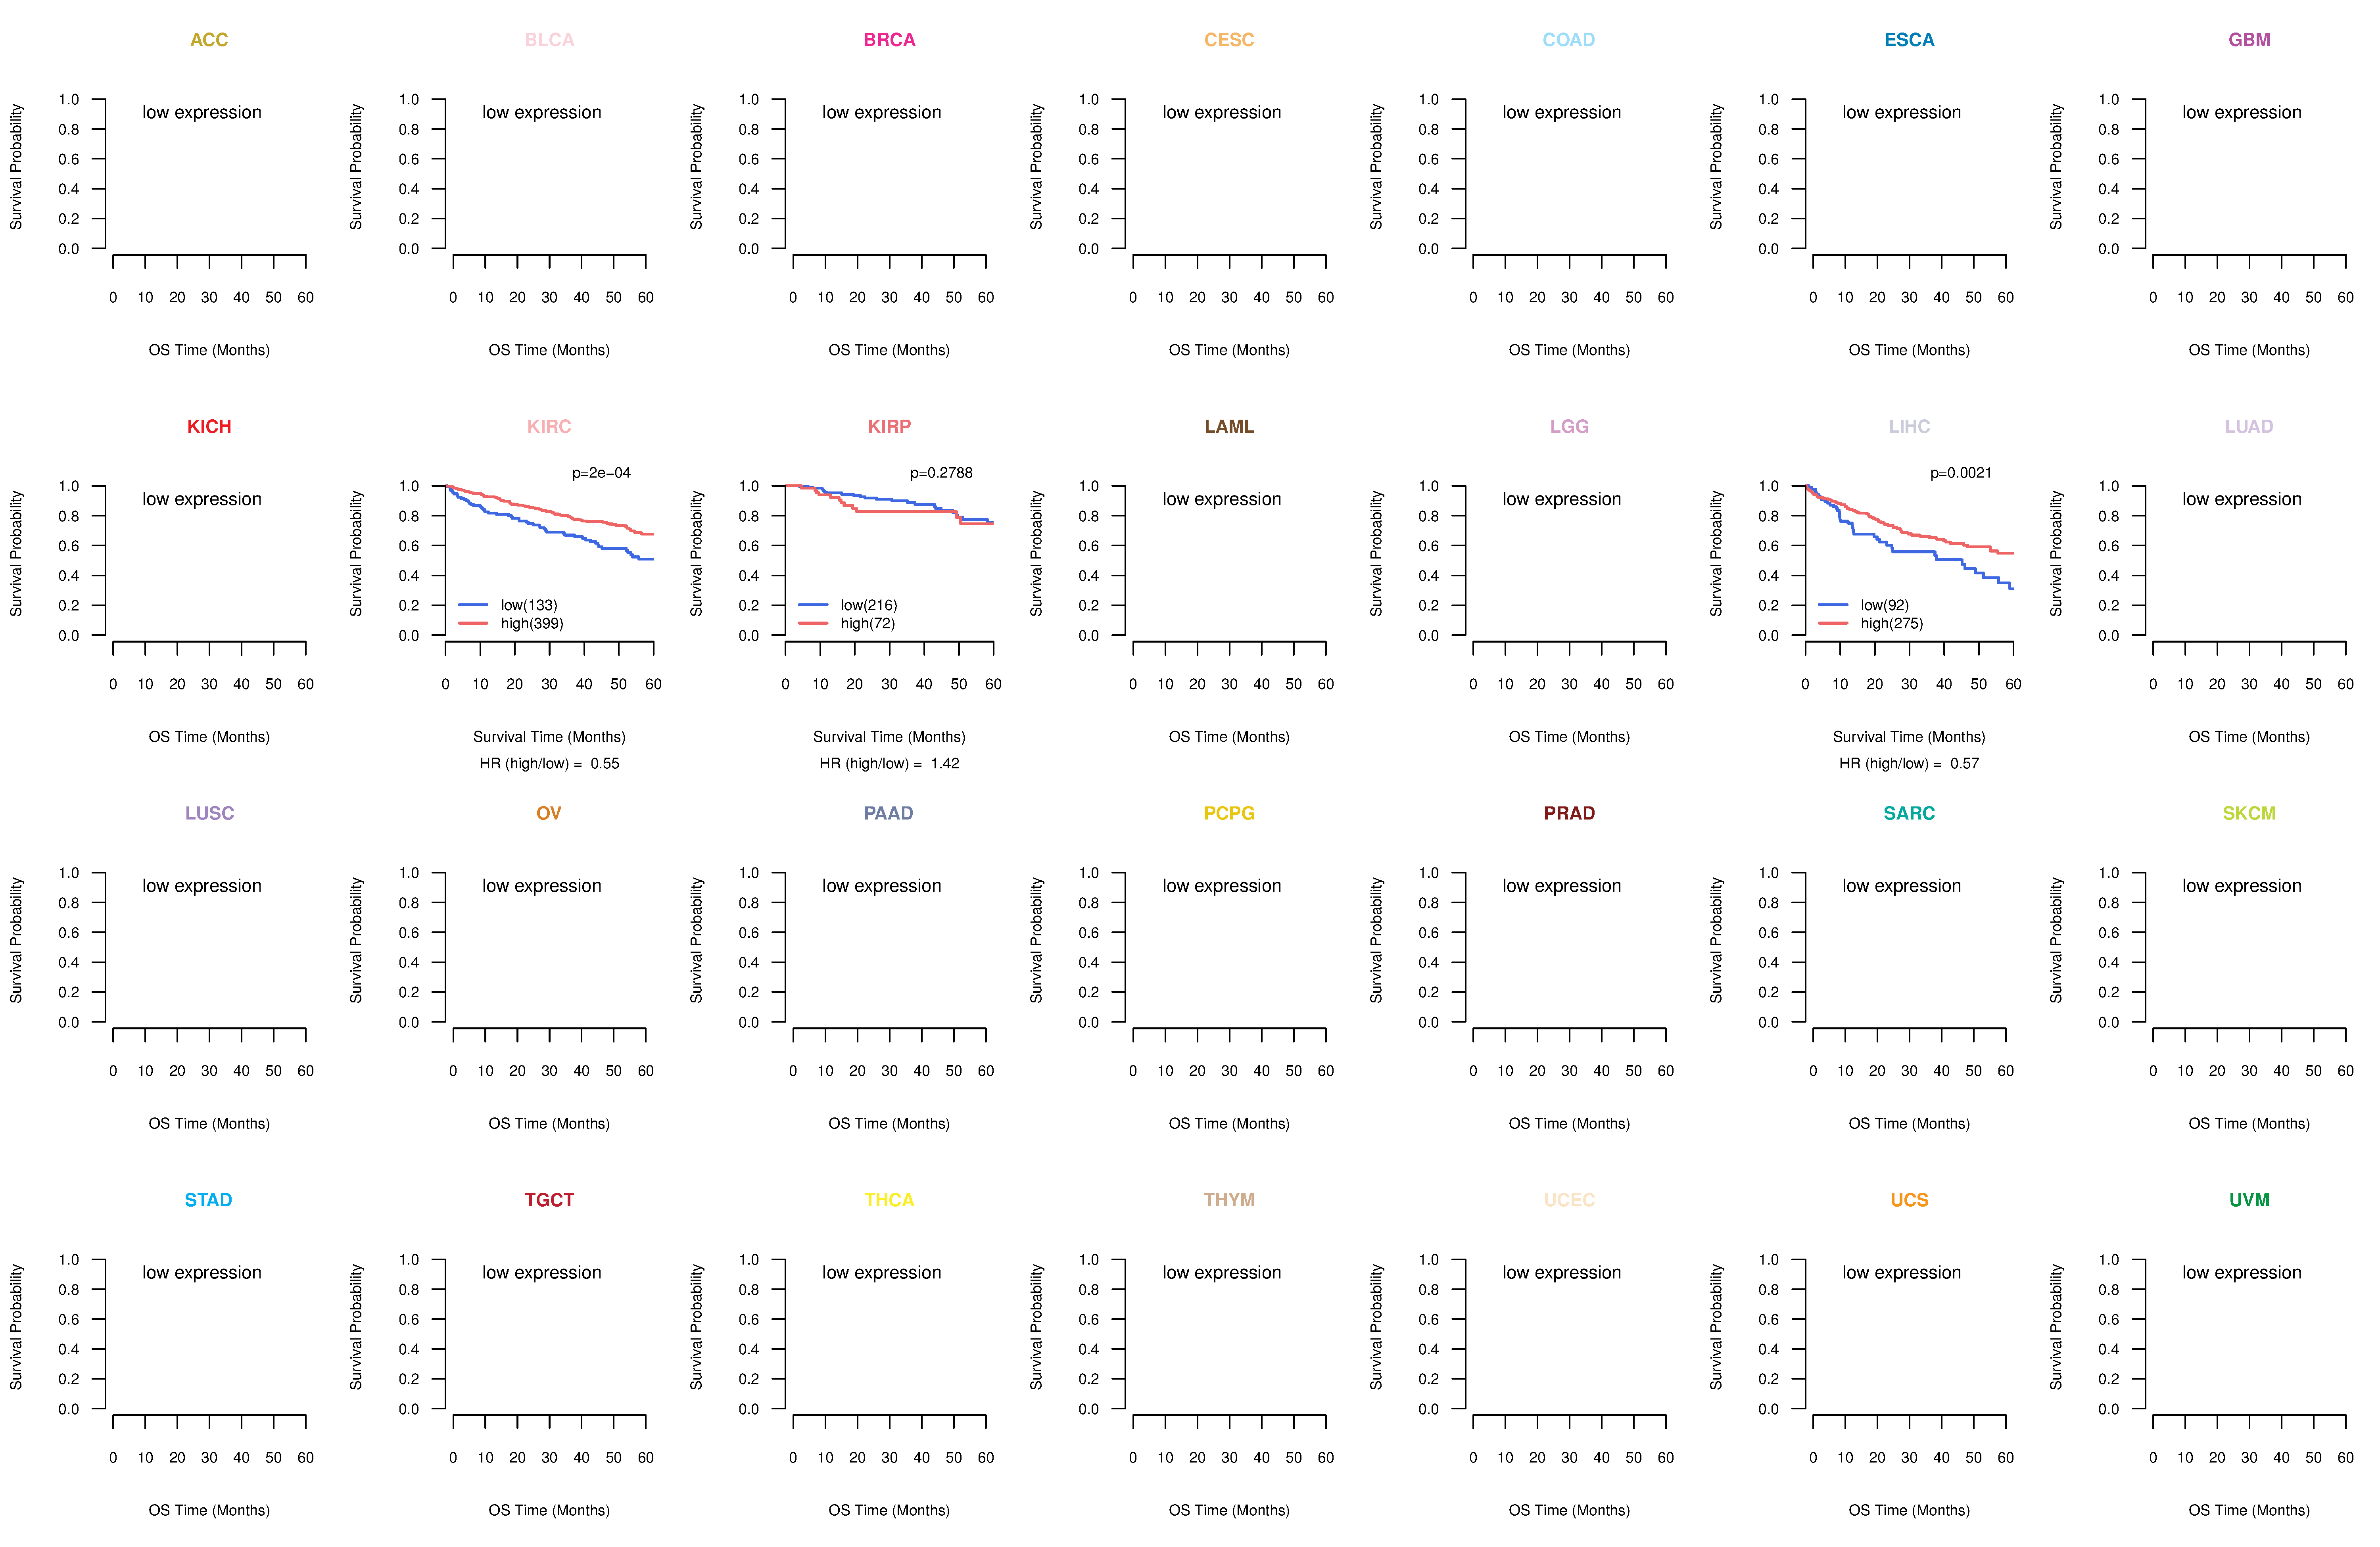
| Kaplan-Meier plots with logrank tests of overall survival (OS) using 28 cancer types (TCGA IlluminaHiSeq_RNASeqV2, pan-cancer normalized log2(norm_counts+1) data, version 2016-08-16) (TCGA clinicalMatrix, phenotype data, version 2016-04-27) * Click on the image to enlarge it in a new window. |
 |
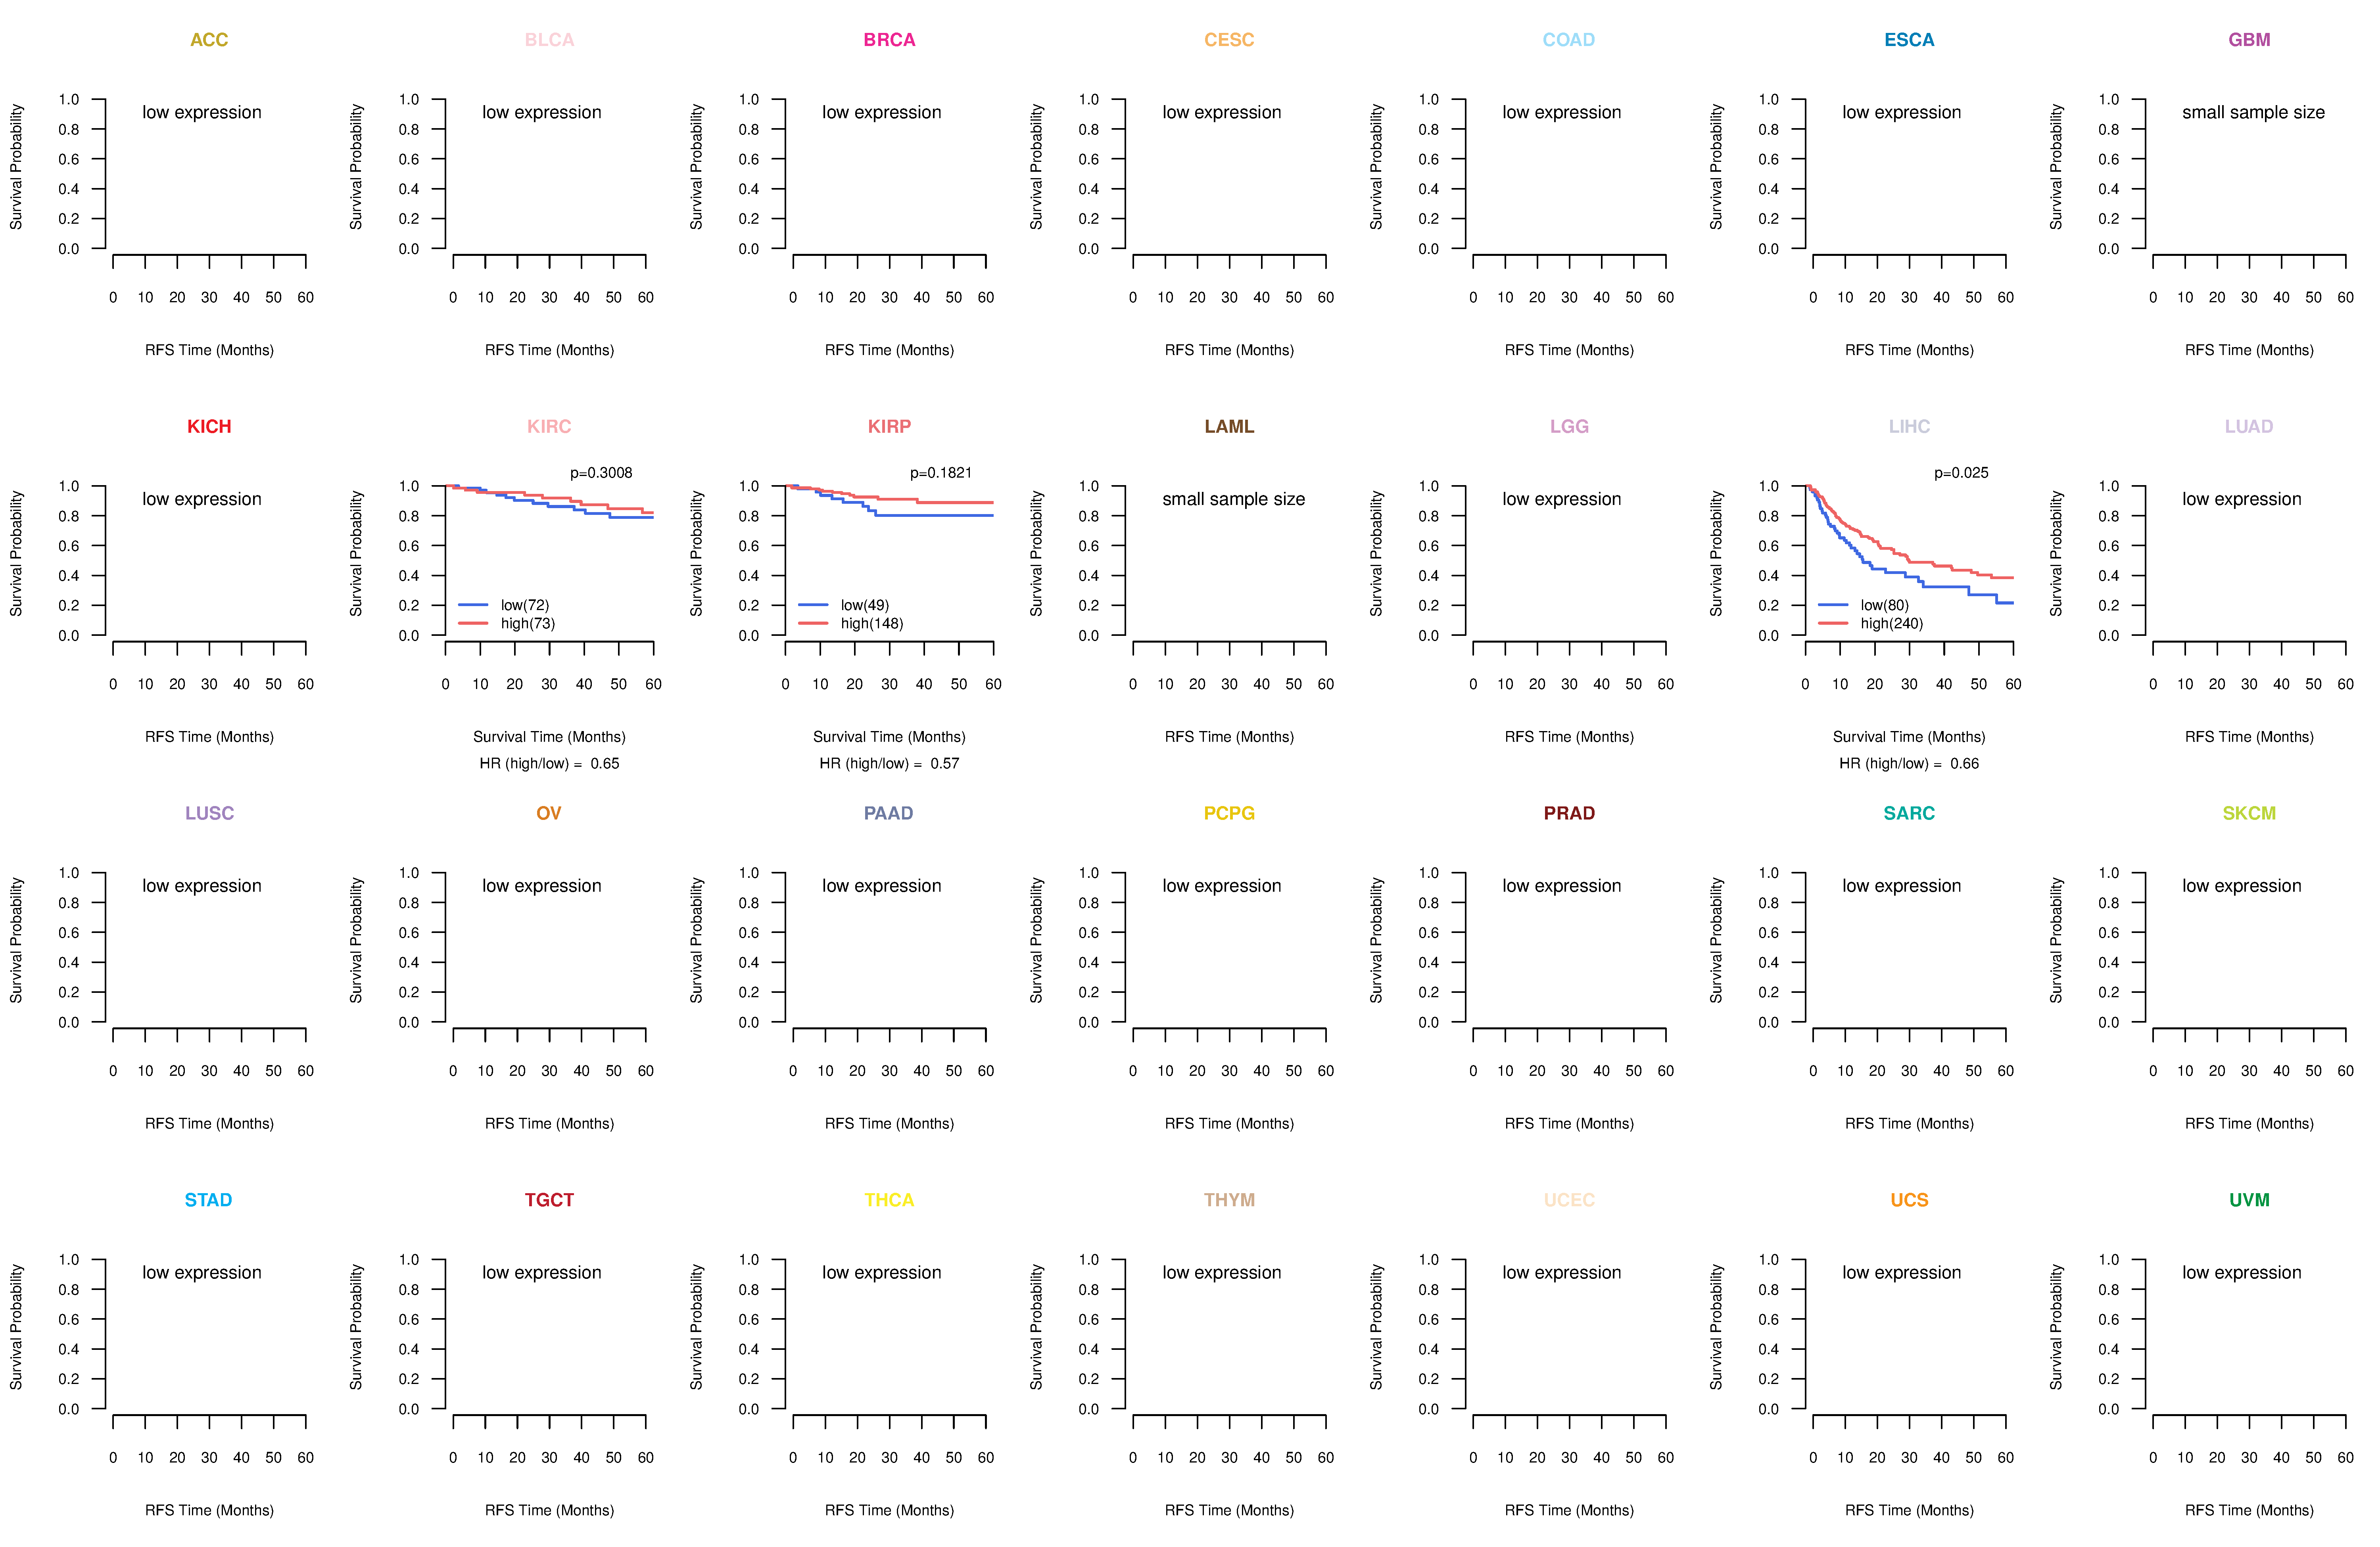
| Kaplan-Meier plots with logrank test of relapse free survival (RFS) using 28 cancer types (TCGA IlluminaHiSeq_RNASeqV2, pan-cancer normalized log2(norm_counts+1) data, version 2016-08-16) (TCGA clinicalMatrix, phenotype data, version 2016-04-27) * Click on the image enlarge it in a new window. |
 |
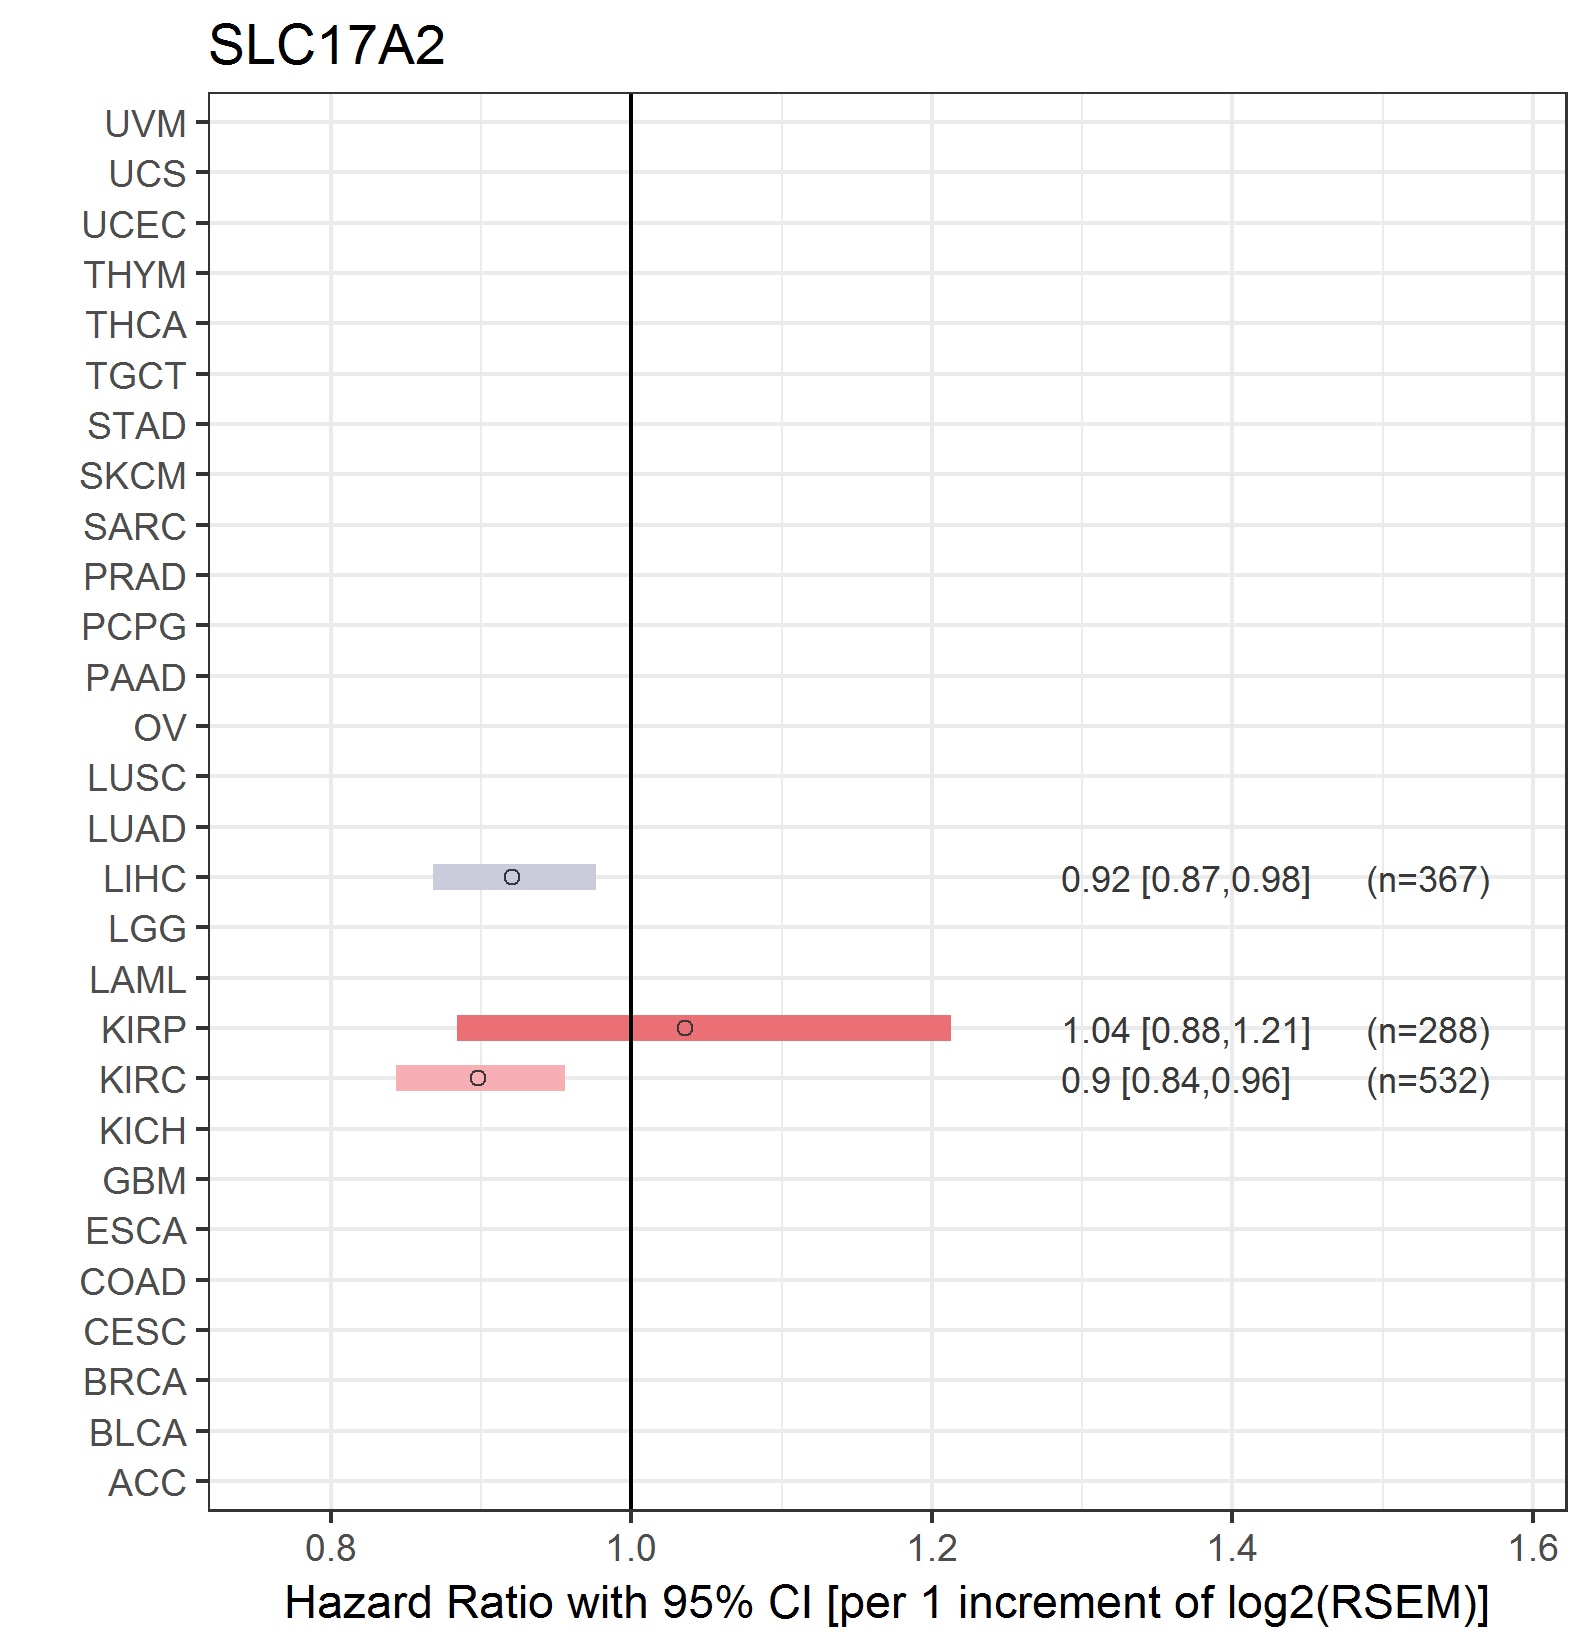
| Forest plot of Cox proportional hazard ratio (HR) and 95% CI of overall survival (OS) using 28 cancer types (TCGA IlluminaHiSeq_RNASeqV2, pan-cancer normalized log2(norm_counts+1) data, version 2016-08-16) (TCGA clinicalMatrix, phenotype data, version 2016-04-27) * Click on the image enlarge it in a new window. |
 |
| Forest plot of Cox proportional hazard ratio (HR) and 95% CI of relapse free survival (RFS) using 28 cancer types (TCGA IlluminaHiSeq_RNASeqV2, pan-cancer normalized log2(norm_counts+1) data, version 2016-08-16) (TCGA clinicalMatrix, phenotype data, version 2016-04-27) * Click on the image enlarge it in a new window. |
 |
| Top |
| TissGeneClin for SLC17A2 |
| TissGeneDrug for SLC17A2 |
| Drug information targeting TissGene (DrugBank Version 5.0.6, 2017-04-01) |
| DrugBank ID | Drug name | Drug activity | Drug type | Drug status |
| Top |
| TissGeneDisease for SLC17A2 |
| Disease information associated with TissGene (DisGeNet, 2016-06-01) |
| Disease ID | Disease name | # pubmeds | Source |
| umls:C0018099 | Gout | 1 | GAD |
|
Copyright 2016-Present - The University of Texas Health Science Center at Houston (UTHealth) Web File Viewing | How to Report, Fraud, Waste and Abuse | State of Texas | Statewide Search | Texas Homeland Security | Site Policies |