 |
| |
| |
| |
| |
| |
| |
|

| TissGeneSummary for OLFM1 |
 Gene summary Gene summary |
| Basic gene information | Gene symbol | OLFM1 |
| Gene name | olfactomedin 1 | |
| Synonyms | AMY|NOE1|NOELIN1|OlfA | |
| Cytomap | UCSC genome browser: 9q34.3 | |
| Type of gene | protein-coding | |
| RefGenes | NM_001282611.1, NM_001282612.1,NM_006334.3,NM_014279.4,NM_058199.2, | |
| Description | neuroblastoma proteinneuronal olfactomedin-related ER localized proteinnoelinolfactomedin related ER localized proteinolfactomedin-1pancortin 1 | |
| Modification date | 20141207 | |
| dbXrefs | MIM : 605366 | |
| HGNC : HGNC | ||
| Ensembl : ENSG00000130558 | ||
| HPRD : 09249 | ||
| Vega : OTTHUMG00000020897 | ||
| Protein | UniProt: go to UniProt's Cross Reference DB Table | |
| Expression | CleanEX: HS_OLFM1 | |
| BioGPS: 10439 | ||
| Pathway | NCI Pathway Interaction Database: OLFM1 | |
| KEGG: OLFM1 | ||
| REACTOME: OLFM1 | ||
| Pathway Commons: OLFM1 | ||
| Context | iHOP: OLFM1 | |
| ligand binding site mutation search in PubMed: OLFM1 | ||
| UCL Cancer Institute: OLFM1 | ||
| Assigned class in TissGDB* | C | |
| Included tissue-specific gene expression resources | HPA,TiGER | |
| Specific-tissues in normal samples (assigned by TissGDB using HPA, TiGER, and GTEx) | Brain | |
| Cancer types related to the specific-tissues in cancer samples (assigned by TissGDB using TCGA) | GBM,LGG | |
| Reference showing the relevant tissue of OLFM1 | ||
| Description by TissGene annotations | Protective TissGene in OS | |
| * Class A consists of genes with literature evidence and is part of the cTissGenes. Class B consists of only cTissGenes without additional evidence. The remaining genes belong to Class C. |
| Gene ontology having evidence of Inferred from Direct Assay (IDA) from Entrez |
| GO ID | GO term | PubMed ID |
| Top |
| TissGeneExp for OLFM1 |
| Gene expressions across 28 cancer types (X-axis: cancer type and Y-axis: log2(norm_counts+1)) (TCGA IlluminaHiSeq_RNASeqV2, pan-cancer normalized log2(norm_counts+1) data, version 2016-08-16) |
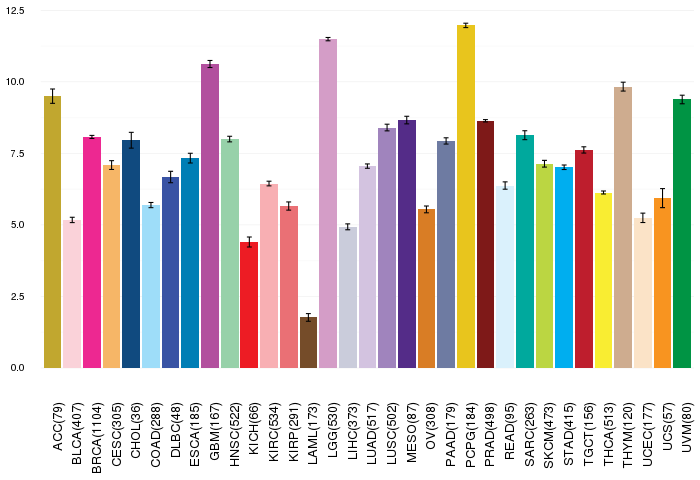 |
| Gene isoform expressions across 28 cancer types (X-axis: cancer type and Y-axis: log2(norm_counts+1)) (TCGA pan-cancer tcga_rsem_isoform_tpm, version 2016-09-01) |
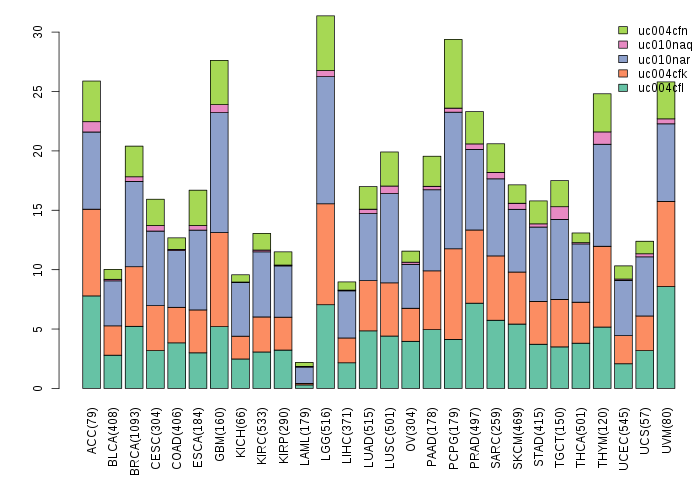 |
| Gene expressions across normal tissues of GTEx data (GTEx GTEx_Analysis_v6_RNA-seq_RNA-SeQCv1.1.8_gene_rpkm.gct) - Here, we shows the matched tissue types only among our 28 cancer types. |
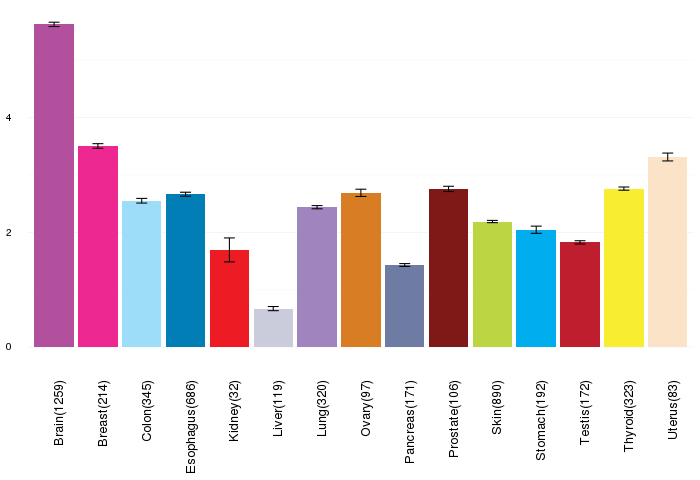 |
| Different expressions across 14 cancer types with more than 10 samples between matched tumors and normals (X-axis: cancer type and Y-axis: log2(norm_counts+1)) (TCGA IlluminaHiSeq_RNASeqV2, pan-cancer normalized log2(norm_counts+1) data, version 2016-08-16) |
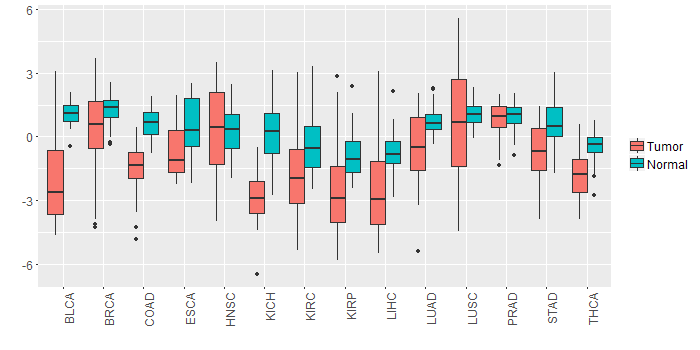 |
| - Significantly differentially expressed cancer types and information. (|Fold change|>1 and FDR<0.05) |
| Cancer type | Mean(exp) in tumor | Mean(exp) in matched normal | Log2FC | P-val. | FDR |
| KIRC | -1.837348246 | -0.340235746 | -1.4971125 | 3.28E-07 | 8.71E-07 |
| THCA | -1.792720162 | -0.438618467 | -1.354101695 | 8.62E-13 | 7.73E-12 |
| LUAD | -0.466364961 | 0.736586763 | -1.202951724 | 2.06E-07 | 7.69E-07 |
| KICH | -3.006021857 | 0.296206143 | -3.302228 | 6.75E-12 | 6.67E-11 |
| COAD | -1.554956473 | 0.655978143 | -2.210934615 | 4.58E-09 | 4.46E-08 |
| LIHC | -2.472573857 | -0.759847857 | -1.712726 | 2.50E-06 | 1.23E-05 |
| KIRP | -2.420606232 | -0.869609357 | -1.550996875 | 0.00093 | 0.002586496 |
| STAD | -0.644603107 | 0.683218768 | -1.327821875 | 2.75E-05 | 0.000264306 |
| BLCA | -1.971037647 | 1.077493932 | -3.048531579 | 9.94E-06 | 0.000192231 |
| Top |
| TissGene-miRNA for OLFM1 |
| Significantly anti-correlated miRNAs of TissGene across 28 cancer types (Gene-miRNA relations from TargetScanHuman Relsease 7.1, Conserved_Site_Context_Scores.txt.zip, 06.01.2016) (TCGA IlluminaHiSeq_miRNASeq, log2(RPM+1) data, version 2016-11-21) (TCGA IlluminaHiSeq_RNASeqV2, log2(normalized_count+1) data, version 2016-08-16) (Spearman’s Rank Correlation (p-value<0.05 and coefficient<-0.25)) |
| Cancer type | miRNA id | miRNA accession | P-val. | Coeff. | # samples |
| Top |
| TissGeneMut for OLFM1 |
| TissGeneSNV for OLFM1 |
| nsSNV counts per each loci. Different colors of circles represent different cancer types. Circle size denotes number of samples. (TCGA somatic mutation (SNPs and small INDELs) data, version 2016-04-25) * Click on the image to enlarge it in a new window. |
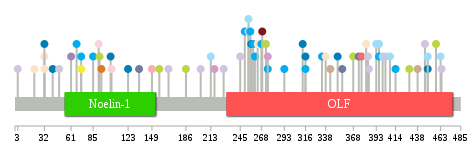 |
 |
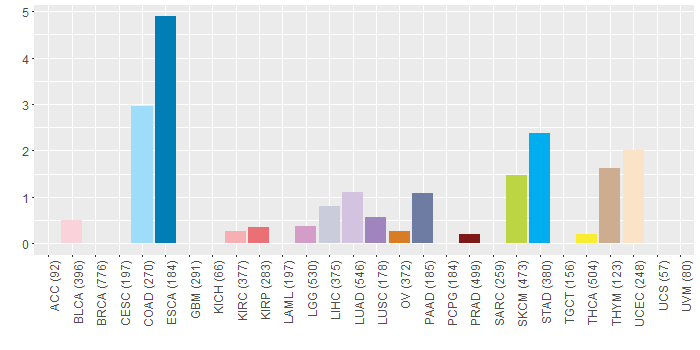
| Somatic nucleotide variants of TissGene across 28 cancer types (X-axis: cancer type and Y-axis: % of mutated samples) The numbers in parentheses are numbers of samples with mutation (nsSNVs). (TCGA somatic mutation (SNPs and small INDELs) data, version 2016-04-25) |
 |
| - nsSNVs sorted by frequency. |
| AAchange | Cancer type | # samples |
| p.P236H | HNSC | 1 |
| p.A351T | ESCA | 1 |
| p.Y250X | STAD | 1 |
| p.W464* | LUAD | 1 |
| p.Y268* | STAD | 1 |
| p.V104M | ESCA | 1 |
| p.V149L | KIRC | 1 |
| p.D259N | STAD | 1 |
| p.D100H | HNSC | 1 |
| p.R227W | LUAD | 1 |
| p.V396I | STAD | 1 |
| p.G403V | LUAD | 1 |
| p.V92F | SKCM | 1 |
| p.A157V | SKCM | 1 |
| p.A356T | PAAD | 1 |
| p.Q61H | LUSC | 1 |
| p.T213M | COAD | 1 |
| p.V414I | STAD | 1 |
| p.Q32R | UCEC | 1 |
| p.G449S | COAD | 1 |
| p.A374T | PAAD | 1 |
| p.R275H | STAD | 1 |
| p.D269N | PRAD | 1 |
| p.R275C | LGG | 1 |
| p.A202G | LUAD | 1 |
| p.V256I | STAD | 1 |
| p.R257H | ESCA | 1 |
| p.S429F | SKCM | 1 |
| p.E91* | BLCA | 1 |
| p.V167F | LUAD | 1 |
| p.L21I | UCEC | 1 |
| p.G449S | ESCA | 1 |
| p.D338N | UCEC | 1 |
| p.R72H | THCA | 1 |
| p.V396I | COAD | 1 |
| p.R192T | HNSC | 1 |
| p.G385V | LUAD | 1 |
| p.R245W | LUAD | 1 |
| p.C67Y | STAD | 1 |
| p.S41I | ESCA | 1 |
| p.G3C | LUAD | 1 |
| p.Q32_splice | UCEC | 1 |
| p.A135V | PAAD | 1 |
| p.L458F | SKCM | 1 |
| p.W446* | LUAD | 1 |
| p.R463C | COAD | 1 |
| p.E343K | THYM | 1 |
| p.D264N | UCEC | 1 |
| p.Y408C | COAD | 1 |
| p.N426S | HNSC | 1 |
| p.R254H | COAD | 1 |
| p.T393M | COAD | 1 |
| p.V349M | DLBC | 1 |
| p.E105D | BLCA | 1 |
| p.L313H | ESCA | 1 |
| p.Y186F | SKCM | 1 |
| p.R261Q | STAD | 1 |
| p.R254C | LIHC | 1 |
| p.T377M | KIRP | 1 |
| p.G123C | ESCA | 1 |
| p.S368F | SKCM | 1 |
| p.R293H | STAD | 1 |
| p.Y400S | COAD | 1 |
| p.R72C | STAD | 1 |
| p.Q32H | ESCA | 1 |
| p.A384T | LIHC | 1 |
| p.D94E | OV | 1 |
| p.G249S | READ | 1 |
| p.S273F | SKCM | 1 |
| p.P218H | HNSC | 1 |
| p.E48* | LIHC | 1 |
| p.C85Y | STAD | 1 |
| p.D217N | LGG | 1 |
| p.S383T | READ | 1 |
| p.N444S | HNSC | 1 |
| p.R382C | UCEC | 1 |
| p.R316C | STAD | 1 |
| p.R316H | ESCA | 1 |
| p.R334C | STAD | 1 |
| p.P438H | THYM | 1 |
| p.R210T | HNSC | 1 |
| Top |
| TissGeneCNV for OLFM1 |
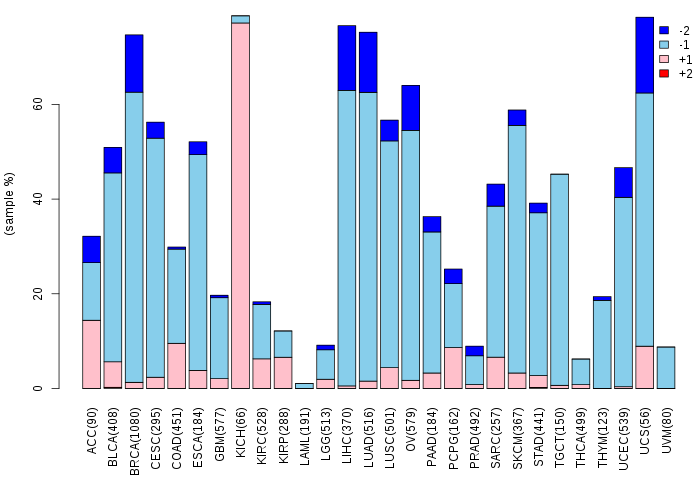
| Copy number variations of TissGene across 28 cancer types (X-axis: cancer type and Y-axis: % of CNV samples) (TCGA Gistic2_CopyNumber_Gistic2_all_data_by_genes, Gistic2 copy number data, version 2016-08-16) |
 |
| Top |
| TissGeneFusions for OLFM1 |
| Fusion genes including TissGene (ChimerDB 3.0, 2016-12-01 and TCGA fusion Portal 2015-12-01) |
| Database | Src | Cancer type | Sample | Fusion gene | ORF | 5'-gene BP | 3'-gene BP |
| Chimerdb3.0 | ChiTaRs | NA | BU079004 | OLFM1-OLFM1 | chr9:138012312 | chr9:138012309 | |
| Chimerdb3.0 | ChiTaRs | NA | DA779963 | ARIH1-OLFM1 | chr15:72847654 | chr9:137987765 | |
| Chimerdb3.0 | FusionScan | BRCA | TCGA-A8-A08X-01A | FAM129B-OLFM1 | In-Frame | chr9:130331098 | chr9:137982040 |
| Chimerdb3.0 | TopHat-Fusion | BRCA | TCGA-A8-A08X-01A | FAM129B-OLFM1 | In-Frame | chr9:130331098 | chr9:137982040 |
| TCGAfusionPortal | PRADA | BRCA | TCGA-A8-A08X-01A | FAM129B-OLFM1 | Out-of-frame | Chr9:130331099 | Chr9:137982041 |
| Top |
| TissGeneNet for OLFM1 |
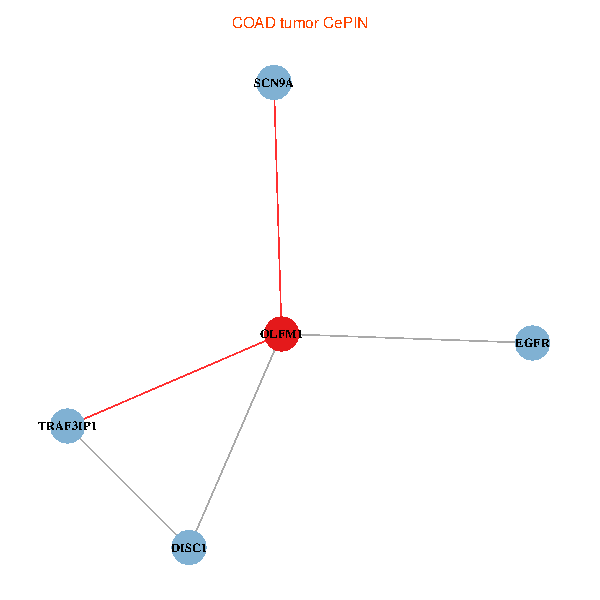
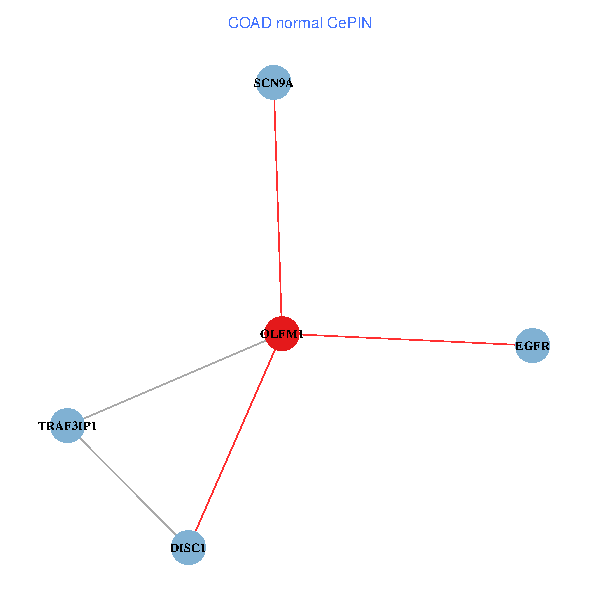
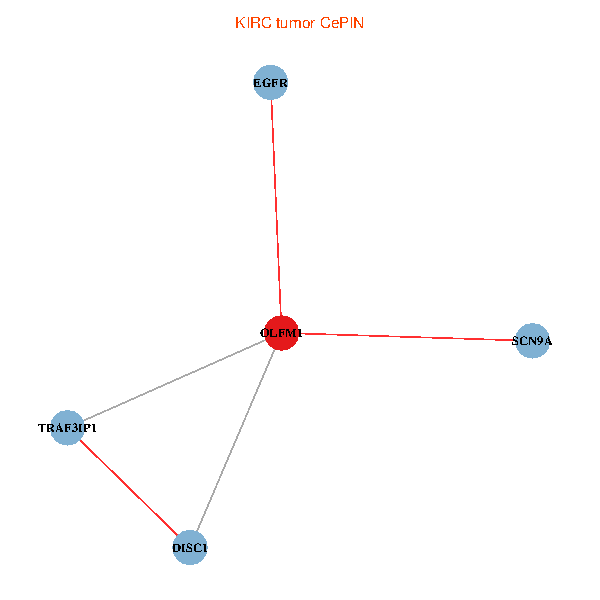
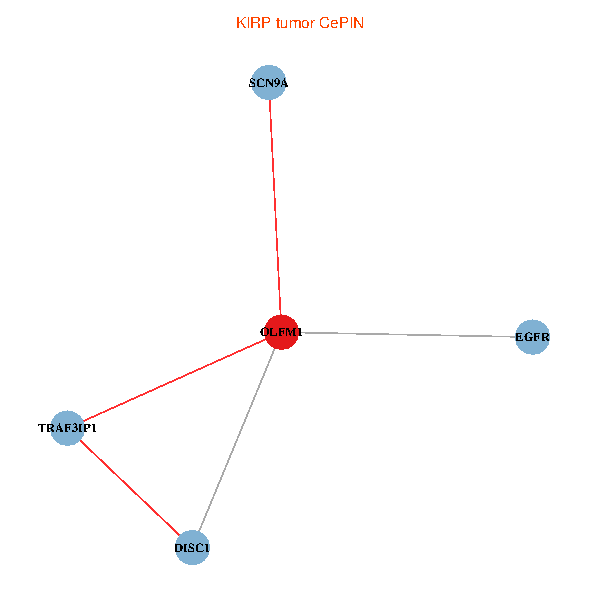
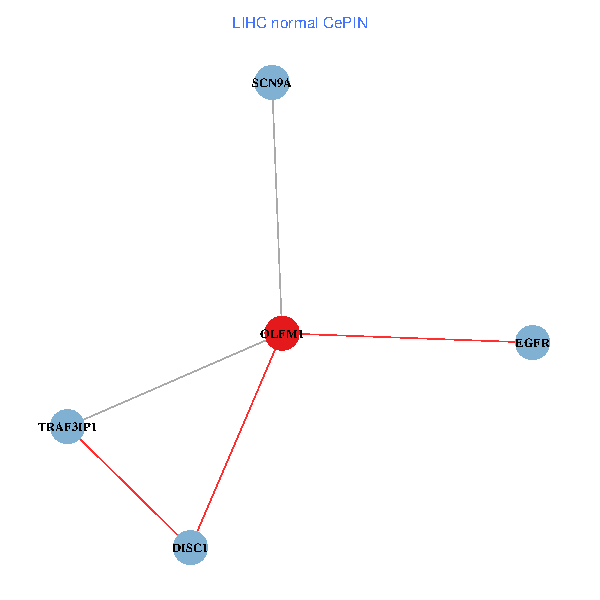
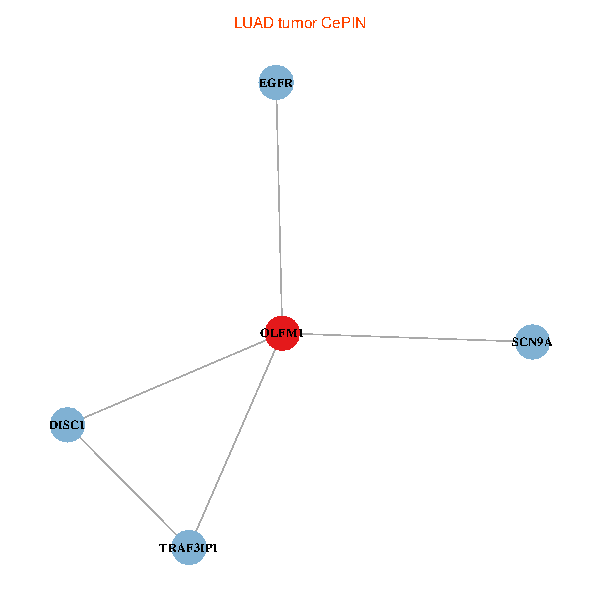
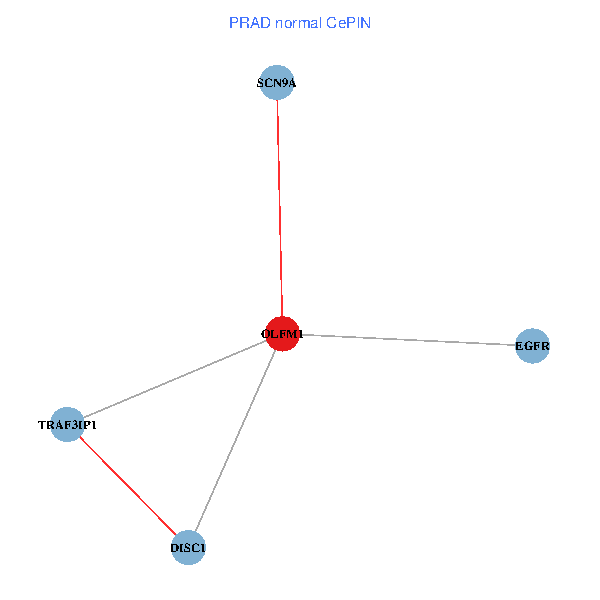
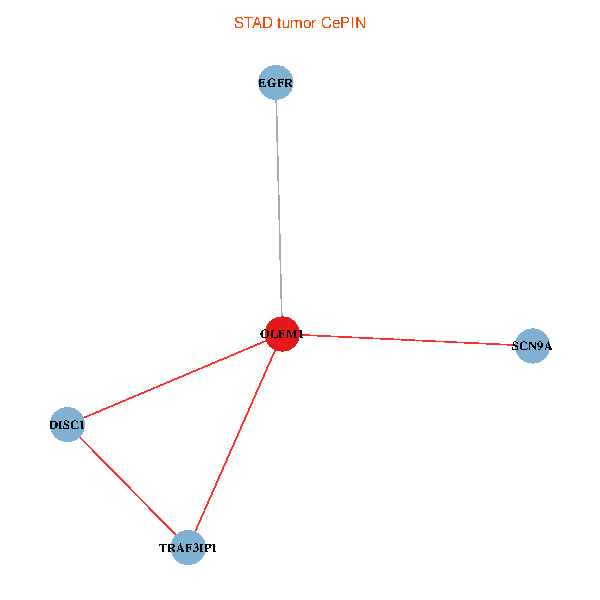
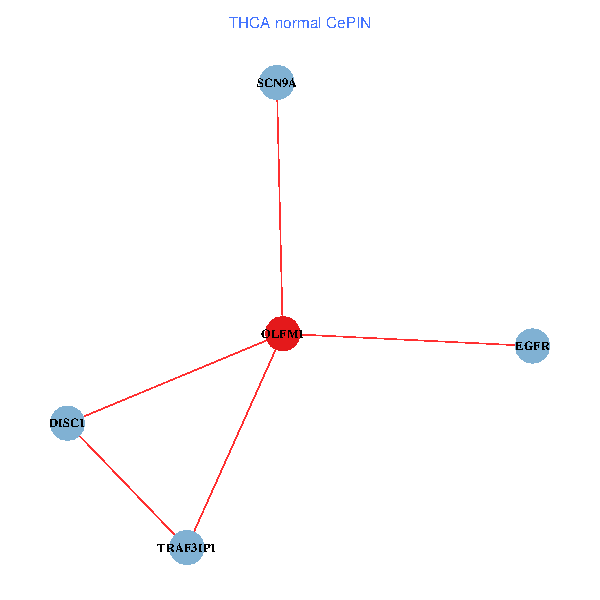
| Co-expressed gene networks based on protein-protein interaction data (CePIN) (TCGA IlluminaHiSeq_RNASeqV2, pan-cancer normalized log2(norm_counts+1) data, version 2016-08-16) (PINA2 ppi data) |
| BRCA (tumor) | BRCA (normal) |
| OLFM1, SCN9A, DISC1, EGFR, TRAF3IP1 (tumor) | OLFM1, SCN9A, DISC1, EGFR, TRAF3IP1 (normal) |
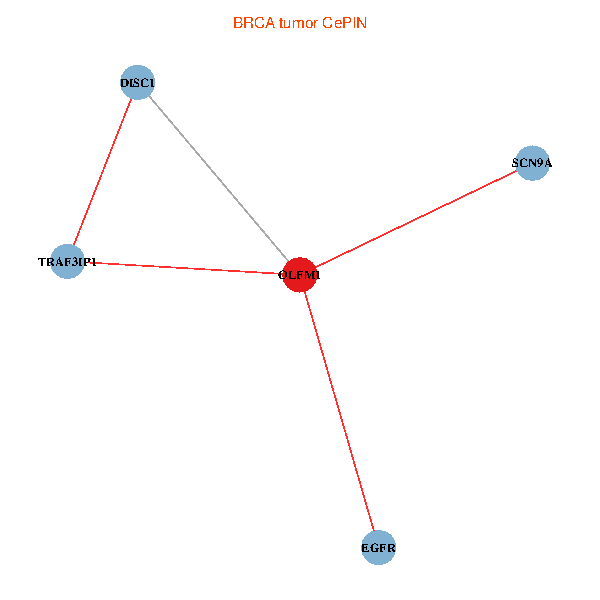 |  |
| COAD (tumor) | COAD (normal) |
| OLFM1, SCN9A, DISC1, EGFR, TRAF3IP1 (tumor) | OLFM1, SCN9A, DISC1, EGFR, TRAF3IP1 (normal) |
 |  |
| HNSC (tumor) | HNSC (normal) |
| OLFM1, SCN9A, DISC1, EGFR, TRAF3IP1 (tumor) | OLFM1, SCN9A, DISC1, EGFR, TRAF3IP1 (normal) |
 |  |
| KICH (tumor) | KICH (normal) |
| OLFM1, SCN9A, DISC1, EGFR, TRAF3IP1 (tumor) | OLFM1, SCN9A, DISC1, EGFR, TRAF3IP1 (normal) |
 |  |
| KIRC (tumor) | KIRC (normal) |
| OLFM1, SCN9A, DISC1, EGFR, TRAF3IP1 (tumor) | OLFM1, SCN9A, DISC1, EGFR, TRAF3IP1 (normal) |
 |  |
| KIRP (tumor) | KIRP (normal) |
| OLFM1, SCN9A, DISC1, EGFR, TRAF3IP1 (tumor) | OLFM1, SCN9A, DISC1, EGFR, TRAF3IP1 (normal) |
 |  |
| LIHC (tumor) | LIHC (normal) |
| OLFM1, SCN9A, DISC1, EGFR, TRAF3IP1 (tumor) | OLFM1, SCN9A, DISC1, EGFR, TRAF3IP1 (normal) |
 |  |
| LUAD (tumor) | LUAD (normal) |
| OLFM1, SCN9A, DISC1, EGFR, TRAF3IP1 (tumor) | OLFM1, SCN9A, DISC1, EGFR, TRAF3IP1 (normal) |
 |  |
| LUSC (tumor) | LUSC (normal) |
| OLFM1, SCN9A, DISC1, EGFR, TRAF3IP1 (tumor) | OLFM1, SCN9A, DISC1, EGFR, TRAF3IP1 (normal) |
 |  |
| PRAD (tumor) | PRAD (normal) |
| OLFM1, SCN9A, DISC1, EGFR, TRAF3IP1 (tumor) | OLFM1, SCN9A, DISC1, EGFR, TRAF3IP1 (normal) |
 |  |
| STAD (tumor) | STAD (normal) |
| OLFM1, SCN9A, DISC1, EGFR, TRAF3IP1 (tumor) | OLFM1, SCN9A, DISC1, EGFR, TRAF3IP1 (normal) |
 |  |
| THCA (tumor) | THCA (normal) |
| OLFM1, SCN9A, DISC1, EGFR, TRAF3IP1 (tumor) | OLFM1, SCN9A, DISC1, EGFR, TRAF3IP1 (normal) |
 |  |
| Top |
| TissGeneProg for OLFM1 |
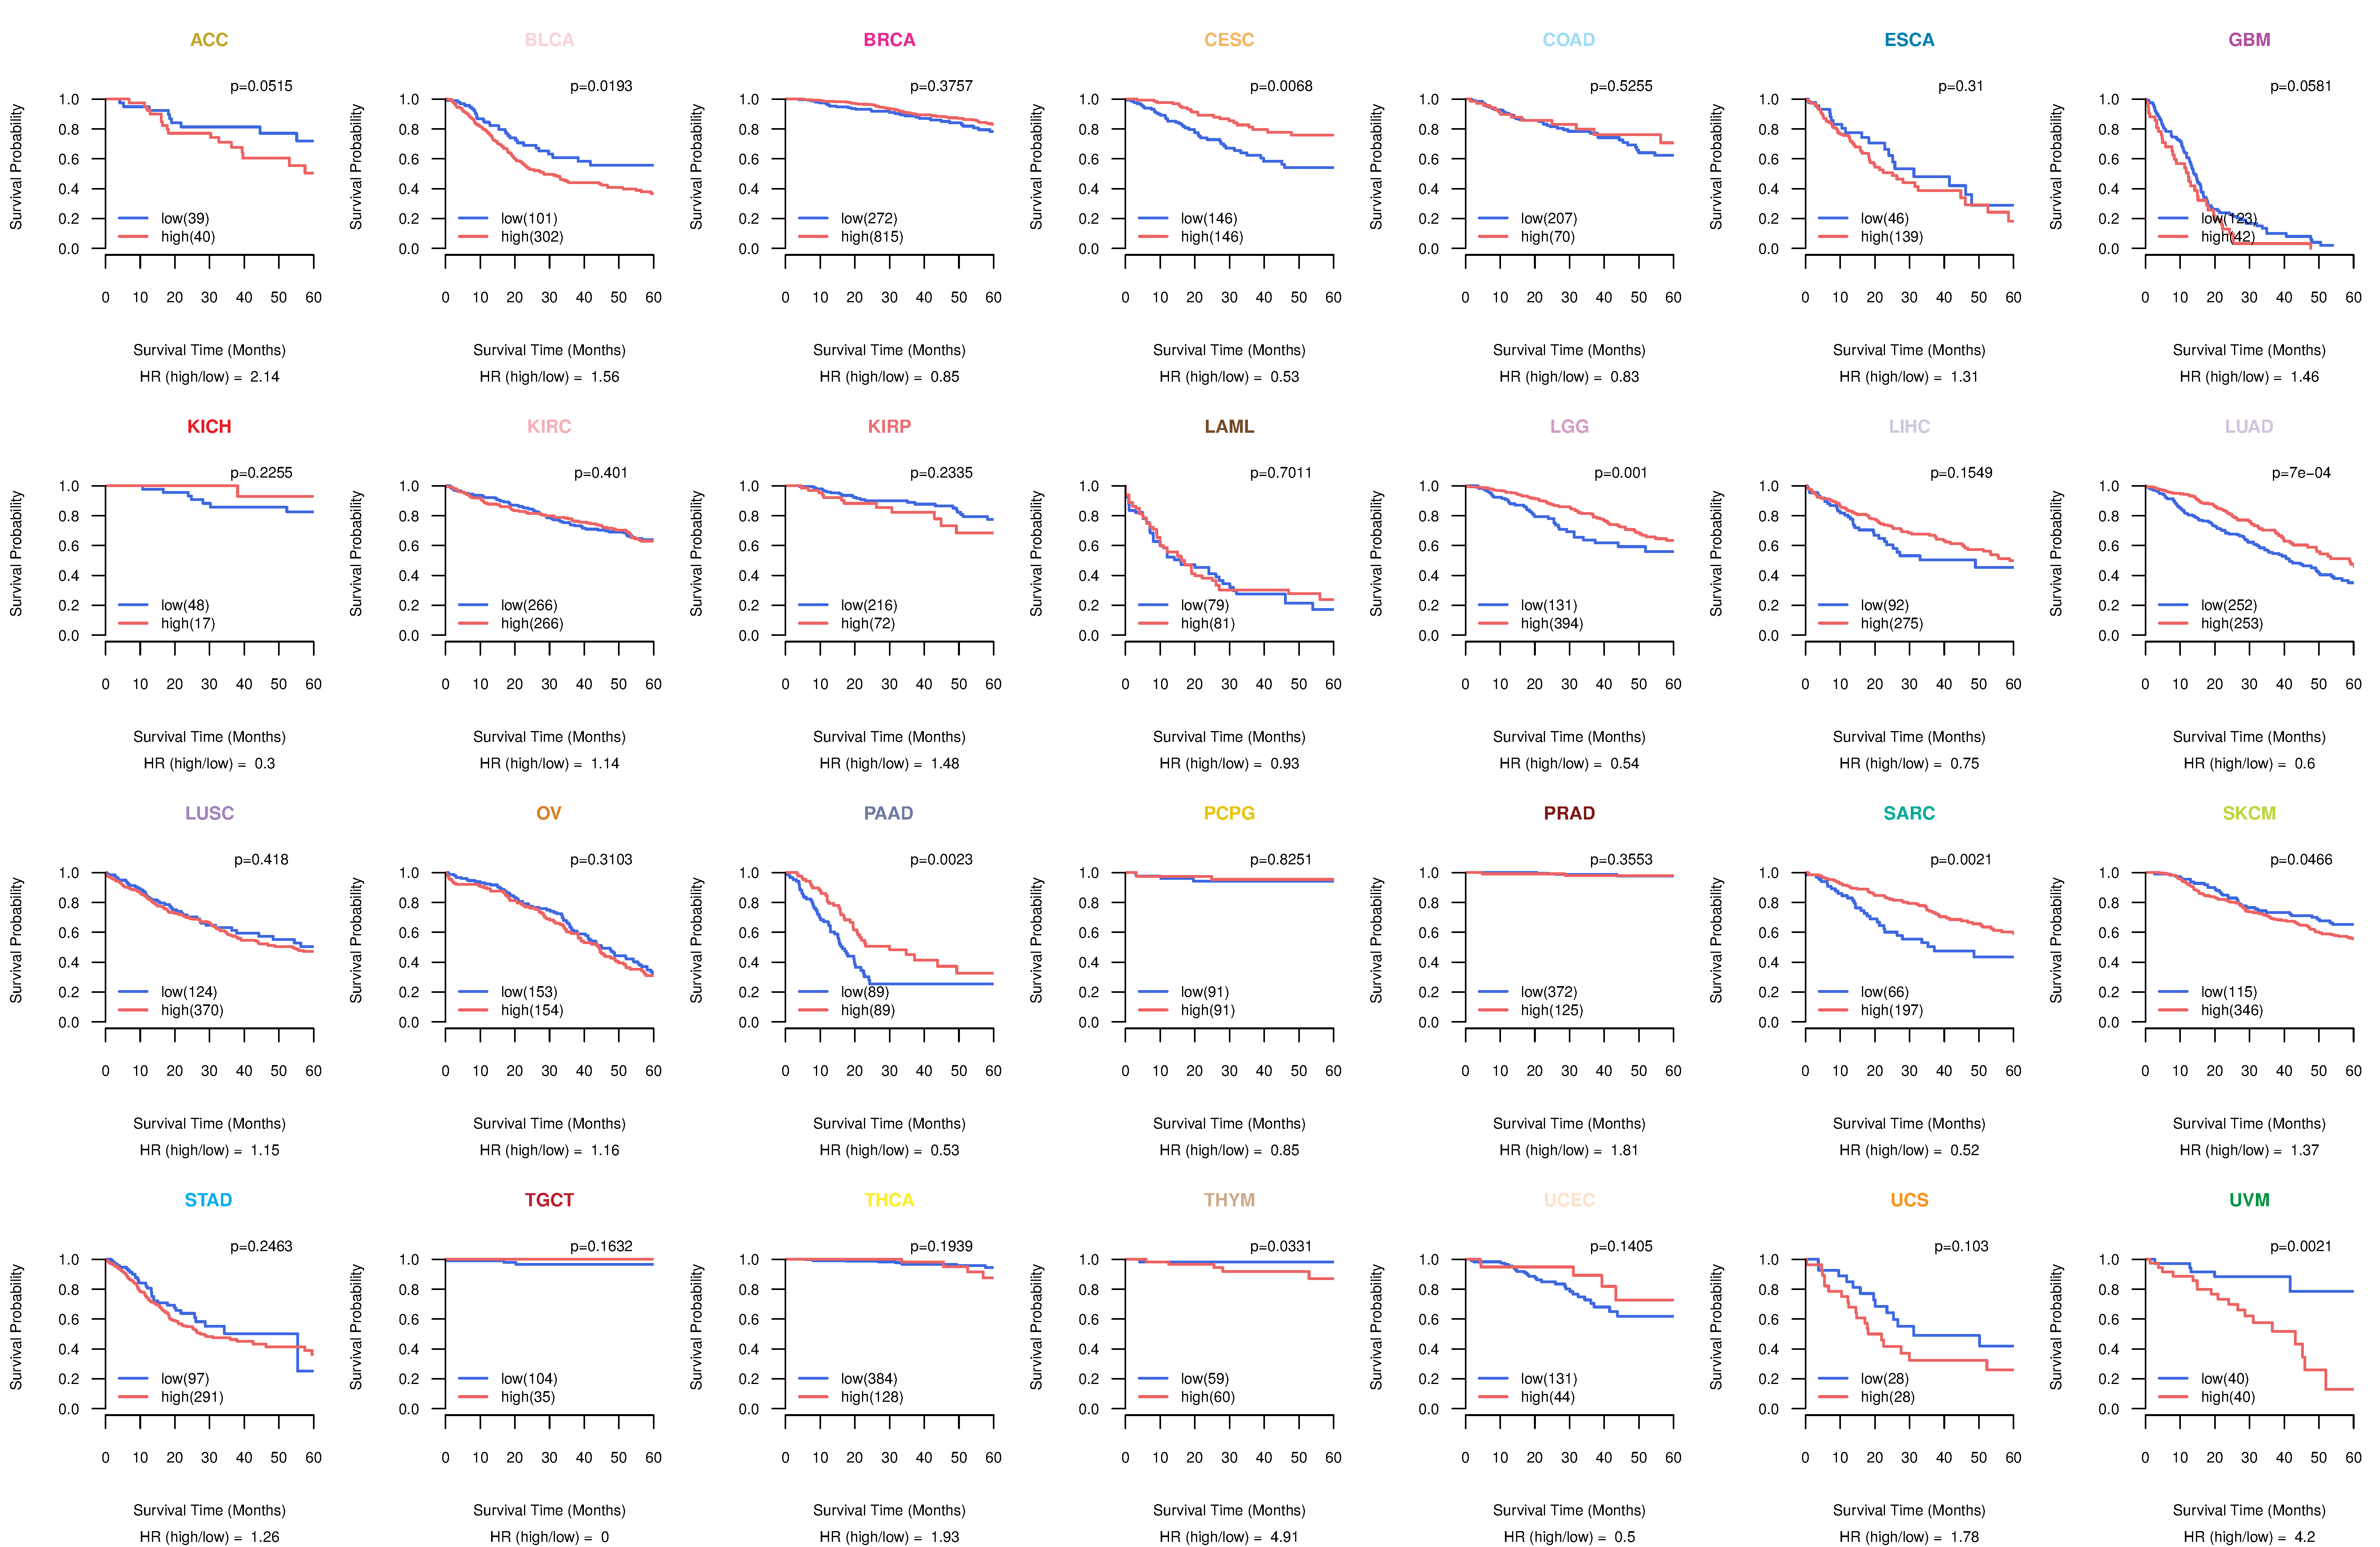
| Kaplan-Meier plots with logrank tests of overall survival (OS) using 28 cancer types (TCGA IlluminaHiSeq_RNASeqV2, pan-cancer normalized log2(norm_counts+1) data, version 2016-08-16) (TCGA clinicalMatrix, phenotype data, version 2016-04-27) * Click on the image to enlarge it in a new window. |
 |
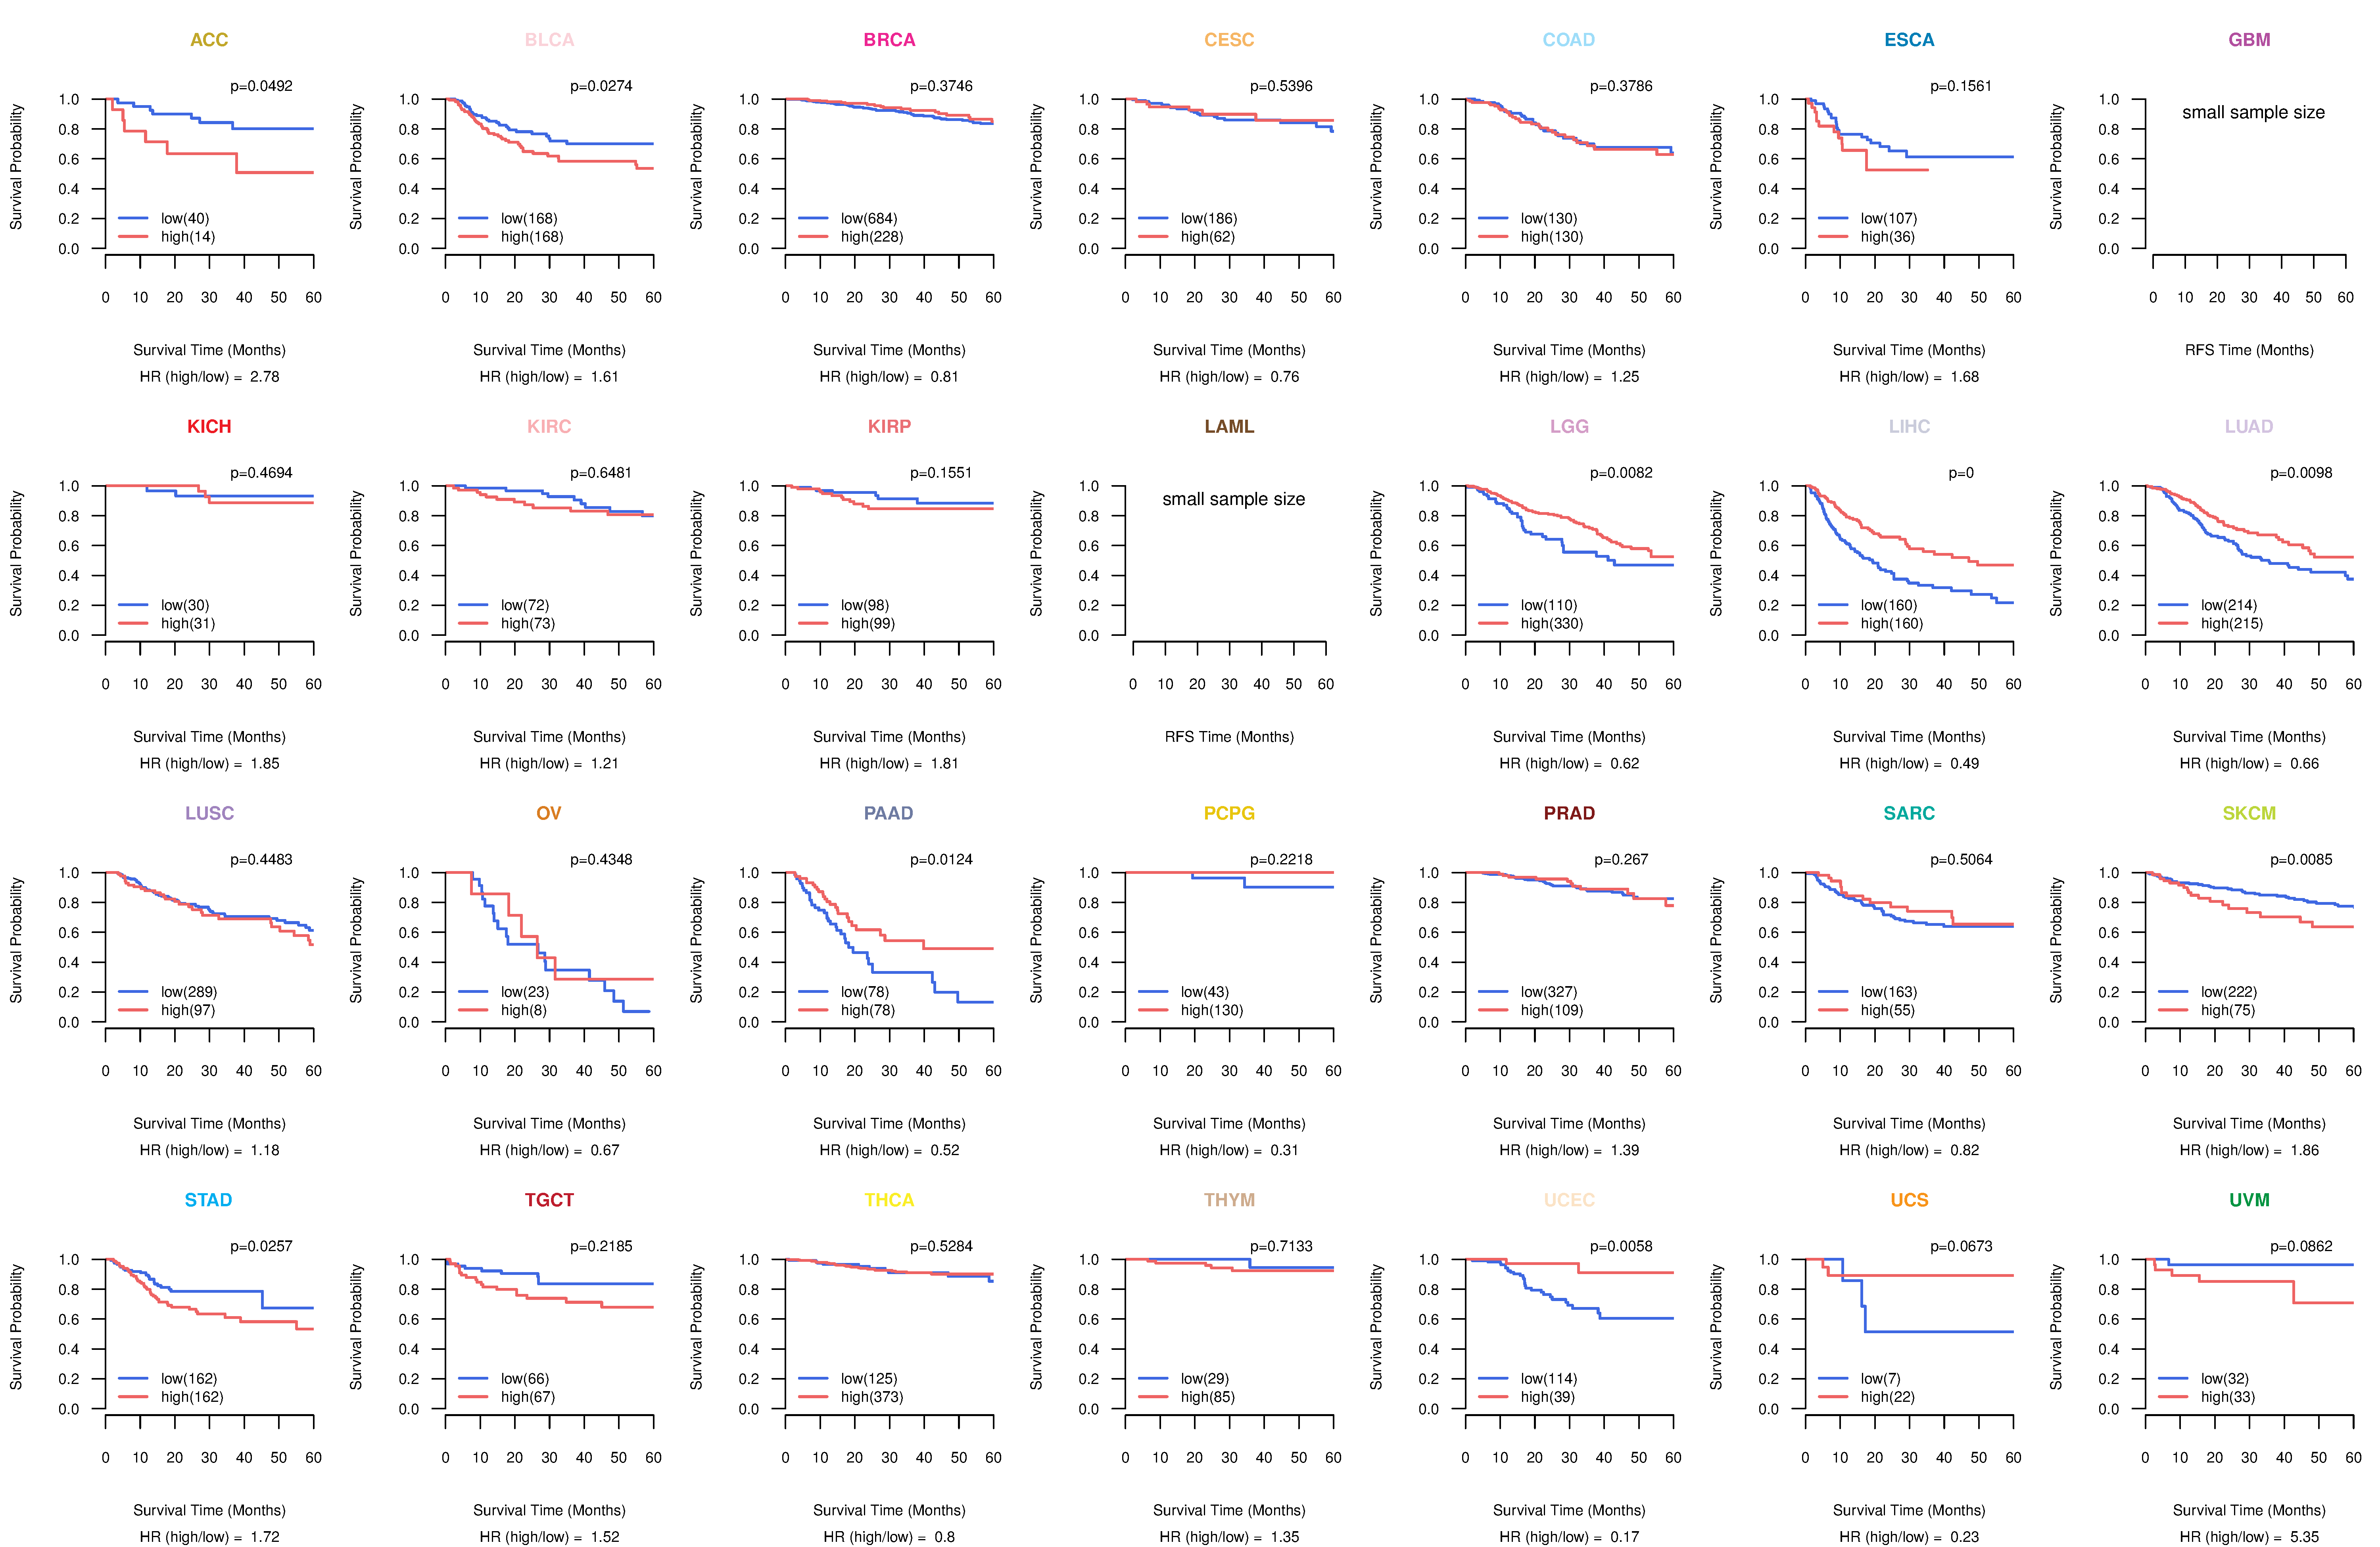
| Kaplan-Meier plots with logrank test of relapse free survival (RFS) using 28 cancer types (TCGA IlluminaHiSeq_RNASeqV2, pan-cancer normalized log2(norm_counts+1) data, version 2016-08-16) (TCGA clinicalMatrix, phenotype data, version 2016-04-27) * Click on the image enlarge it in a new window. |
 |
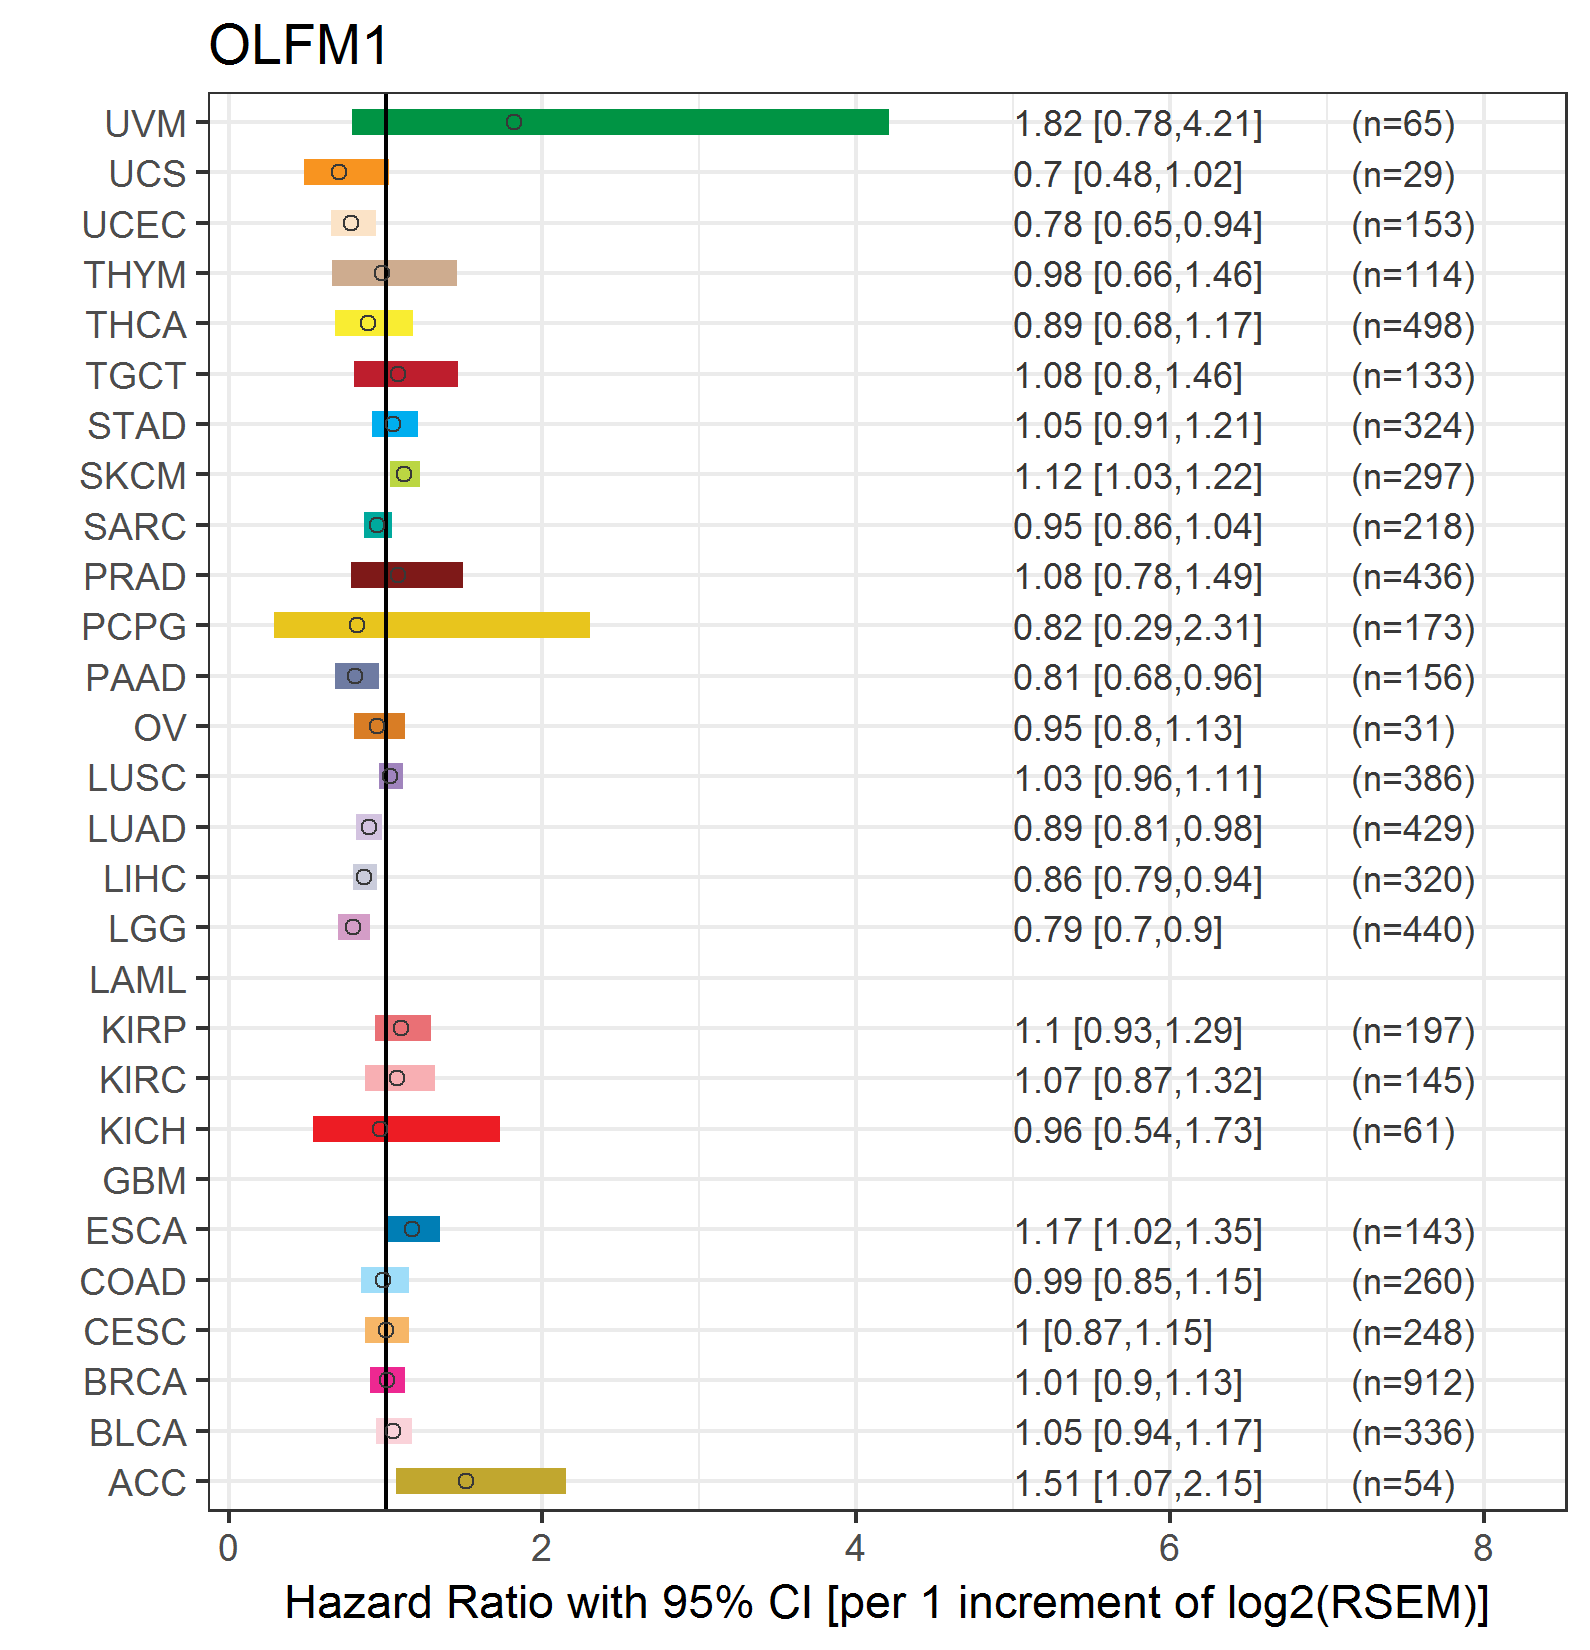
| Forest plot of Cox proportional hazard ratio (HR) and 95% CI of overall survival (OS) using 28 cancer types (TCGA IlluminaHiSeq_RNASeqV2, pan-cancer normalized log2(norm_counts+1) data, version 2016-08-16) (TCGA clinicalMatrix, phenotype data, version 2016-04-27) * Click on the image enlarge it in a new window. |
 |
| Forest plot of Cox proportional hazard ratio (HR) and 95% CI of relapse free survival (RFS) using 28 cancer types (TCGA IlluminaHiSeq_RNASeqV2, pan-cancer normalized log2(norm_counts+1) data, version 2016-08-16) (TCGA clinicalMatrix, phenotype data, version 2016-04-27) * Click on the image enlarge it in a new window. |
 |
| Top |
| TissGeneClin for OLFM1 |
| TissGeneDrug for OLFM1 |
| Drug information targeting TissGene (DrugBank Version 5.0.6, 2017-04-01) |
| DrugBank ID | Drug name | Drug activity | Drug type | Drug status |
| Top |
| TissGeneDisease for OLFM1 |
| Disease information associated with TissGene (DisGeNet, 2016-06-01) |
| Disease ID | Disease name | # pubmeds | Source |
| umls:C0002395 | Alzheimer's Disease | 2 | BeFree |
| umls:C0013080 | Down Syndrome | 1 | BeFree |
| umls:C0023903 | Liver neoplasms | 1 | BeFree |
| umls:C0027720 | Nephrosis | 1 | BeFree |
| umls:C0033578 | Prostatic Neoplasms | 1 | CTD_human |
| umls:C0035412 | Rhabdomyosarcoma | 1 | BeFree |
| umls:C0039101 | synovial sarcoma | 1 | BeFree |
| umls:C0040336 | Tobacco Use Disorder | 1 | GAD |
| umls:C0040517 | Gilles de la Tourette syndrome | 1 | BeFree |
| umls:C0333463 | Senile Plaques | 1 | BeFree |
| umls:C0524910 | Hepatitis C, Chronic | 1 | GAD |
| umls:C0553580 | Ewings sarcoma | 1 | BeFree |
| umls:C1263846 | Attention deficit hyperactivity disorder | 1 | BeFree |
| umls:C2239176 | Liver carcinoma | 1 | BeFree |
| umls:C2936349 | Plaque, Amyloid | 1 | BeFree |
|
Copyright 2016-Present - The University of Texas Health Science Center at Houston (UTHealth) Web File Viewing | How to Report, Fraud, Waste and Abuse | State of Texas | Statewide Search | Texas Homeland Security | Site Policies |