 |
| |
| |
| |
| |
| |
| |
|

| TissGeneSummary for COLEC10 |
 Gene summary Gene summary |
| Basic gene information | Gene symbol | COLEC10 |
| Gene name | collectin sub-family member 10 (C-type lectin) | |
| Synonyms | CLL1 | |
| Cytomap | UCSC genome browser: 8q23-q24.1 | |
| Type of gene | protein-coding | |
| RefGenes | NM_006438.3, | |
| Description | CL-34collectin 34collectin liver 1collectin liver protein 1collectin-10collectin-34 | |
| Modification date | 20141219 | |
| dbXrefs | MIM : 607620 | |
| HGNC : HGNC | ||
| HPRD : 07403 | ||
| Protein | UniProt: go to UniProt's Cross Reference DB Table | |
| Expression | CleanEX: HS_COLEC10 | |
| BioGPS: 10584 | ||
| Pathway | NCI Pathway Interaction Database: COLEC10 | |
| KEGG: COLEC10 | ||
| REACTOME: COLEC10 | ||
| Pathway Commons: COLEC10 | ||
| Context | iHOP: COLEC10 | |
| ligand binding site mutation search in PubMed: COLEC10 | ||
| UCL Cancer Institute: COLEC10 | ||
| Assigned class in TissGDB* | C | |
| Included tissue-specific gene expression resources | ||
| Specific-tissues in normal samples (assigned by TissGDB using HPA, TiGER, and GTEx) | Liver | |
| Cancer types related to the specific-tissues in cancer samples (assigned by TissGDB using TCGA) | LIHC | |
| Reference showing the relevant tissue of COLEC10 | ||
| Description by TissGene annotations | Fused withTSGene | |
| * Class A consists of genes with literature evidence and is part of the cTissGenes. Class B consists of only cTissGenes without additional evidence. The remaining genes belong to Class C. |
| Gene ontology having evidence of Inferred from Direct Assay (IDA) from Entrez |
| GO ID | GO term | PubMed ID |
| Top |
| TissGeneExp for COLEC10 |
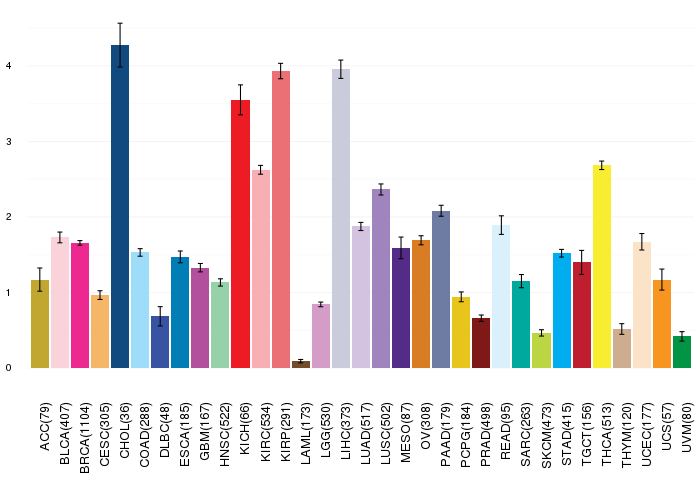
| Gene expressions across 28 cancer types (X-axis: cancer type and Y-axis: log2(norm_counts+1)) (TCGA IlluminaHiSeq_RNASeqV2, pan-cancer normalized log2(norm_counts+1) data, version 2016-08-16) |
 |
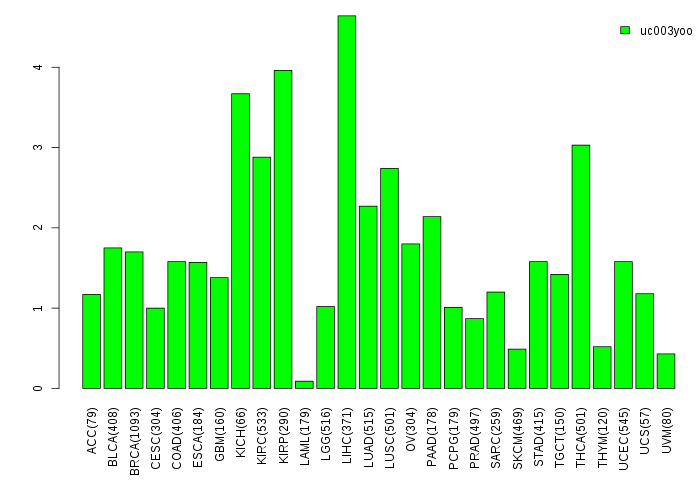
| Gene isoform expressions across 28 cancer types (X-axis: cancer type and Y-axis: log2(norm_counts+1)) (TCGA pan-cancer tcga_rsem_isoform_tpm, version 2016-09-01) |
 |
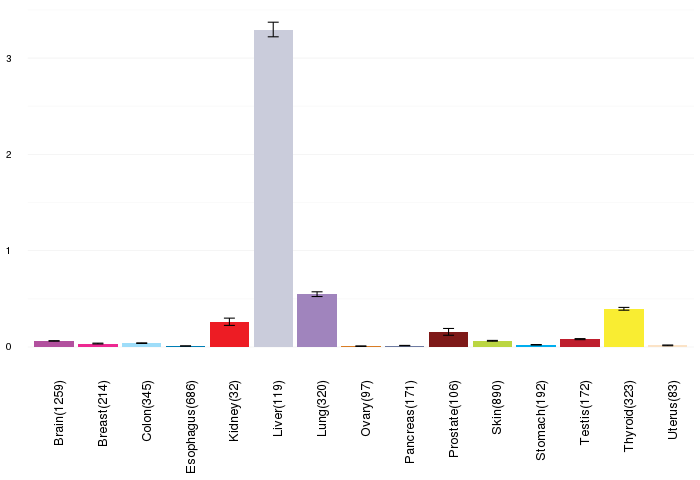
| Gene expressions across normal tissues of GTEx data (GTEx GTEx_Analysis_v6_RNA-seq_RNA-SeQCv1.1.8_gene_rpkm.gct) - Here, we shows the matched tissue types only among our 28 cancer types. |
 |
| Different expressions across 14 cancer types with more than 10 samples between matched tumors and normals (X-axis: cancer type and Y-axis: log2(norm_counts+1)) (TCGA IlluminaHiSeq_RNASeqV2, pan-cancer normalized log2(norm_counts+1) data, version 2016-08-16) |
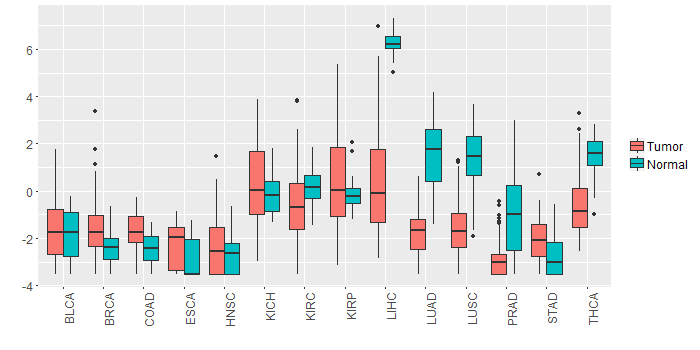 |
| - Significantly differentially expressed cancer types and information. (|Fold change|>1 and FDR<0.05) |
| Cancer type | Mean(exp) in tumor | Mean(exp) in matched normal | Log2FC | P-val. | FDR |
| LIHC | 0.382610175 | 6.256802175 | -5.874192 | 6.12E-24 | 9.06E-22 |
| LUAD | -1.727378929 | 1.462176244 | -3.189555172 | 1.07E-24 | 4.29E-23 |
| PRAD | -2.765353133 | -1.010955056 | -1.754398077 | 3.83E-08 | 4.09E-07 |
| THCA | -0.59534091 | 1.44605231 | -2.04139322 | 2.22E-16 | 3.81E-15 |
| LUSC | -1.543129943 | 1.463122998 | -3.006252941 | 1.60E-21 | 2.32E-20 |
| Top |
| TissGene-miRNA for COLEC10 |
| Significantly anti-correlated miRNAs of TissGene across 28 cancer types (Gene-miRNA relations from TargetScanHuman Relsease 7.1, Conserved_Site_Context_Scores.txt.zip, 06.01.2016) (TCGA IlluminaHiSeq_miRNASeq, log2(RPM+1) data, version 2016-11-21) (TCGA IlluminaHiSeq_RNASeqV2, log2(normalized_count+1) data, version 2016-08-16) (Spearman’s Rank Correlation (p-value<0.05 and coefficient<-0.25)) |
| Cancer type | miRNA id | miRNA accession | P-val. | Coeff. | # samples |
| ACC | hsa-miR-18a-5p | MIMAT0000072 | 0.023 | -0.26 | 78 |
| ACC | hsa-miR-18a-5p | MIMAT0000072 | 0.023 | -0.26 | 78 |
| ACC | hsa-miR-23b-3p | MIMAT0000418 | 0.019 | -0.29 | 78 |
| ACC | hsa-miR-23b-3p | MIMAT0000418 | 0.019 | -0.29 | 78 |
| Top |
| TissGeneMut for COLEC10 |
| TissGeneSNV for COLEC10 |
| nsSNV counts per each loci. Different colors of circles represent different cancer types. Circle size denotes number of samples. (TCGA somatic mutation (SNPs and small INDELs) data, version 2016-04-25) * Click on the image to enlarge it in a new window. |
 |
 |
| Somatic nucleotide variants of TissGene across 28 cancer types (X-axis: cancer type and Y-axis: % of mutated samples) The numbers in parentheses are numbers of samples with mutation (nsSNVs). (TCGA somatic mutation (SNPs and small INDELs) data, version 2016-04-25) |
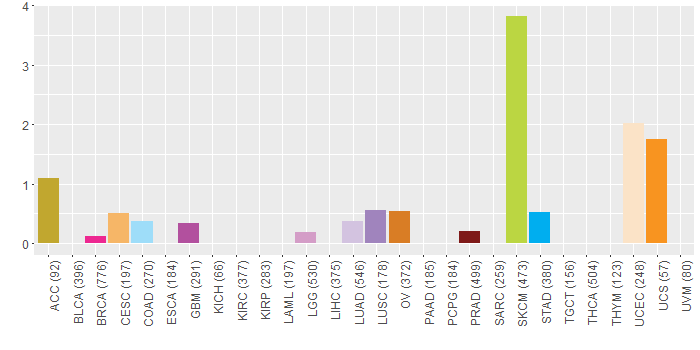 |
| - nsSNVs sorted by frequency. |
| AAchange | Cancer type | # samples |
| p.R179W | READ | 2 |
| p.E165K | SKCM | 2 |
| p.E238K | SKCM | 1 |
| p.K167* | CESC | 1 |
| p.P109S | UCEC | 1 |
| p.G110V | PRAD | 1 |
| p.E217Q | OV | 1 |
| p.E156K | HNSC | 1 |
| p.A136V | READ | 1 |
| p.L20I | UCEC | 1 |
| p.G244D | UCEC | 1 |
| p.R125Q | SKCM | 1 |
| p.E78K | SKCM | 1 |
| p.R69C | ACC | 1 |
| p.F159L | UCEC | 1 |
| p.K97N | BRCA | 1 |
| p.E54K | SKCM | 1 |
| p.E102G | STAD | 1 |
| p.G237E | SKCM | 1 |
| p.G74E | SKCM | 1 |
| p.R10I | READ | 1 |
| p.V163M | OV | 1 |
| p.P72L | GBM | 1 |
| p.W234* | SKCM | 1 |
| p.F144L | SKCM | 1 |
| p.A5S | LGG | 1 |
| p.E154K | SKCM | 1 |
| p.M142I | SKCM | 1 |
| p.D99N | SKCM | 1 |
| p.G101V | SKCM | 1 |
| p.M182I | SKCM | 1 |
| p.R179Q | COAD | 1 |
| p.L20I | UCS | 1 |
| p.R206W | HNSC | 1 |
| p.E102K | SKCM | 1 |
| p.C39Y | UCEC | 1 |
| p.G95W | SKCM | 1 |
| p.N212Y | STAD | 1 |
| p.G27V | LUAD | 1 |
| p.G107V | LUAD | 1 |
| p.G62E | SKCM | 1 |
| p.G116_splice | LUSC | 1 |
| p.D120N | SKCM | 1 |
| p.G104S | SKCM | 1 |
| Top |
| TissGeneCNV for COLEC10 |
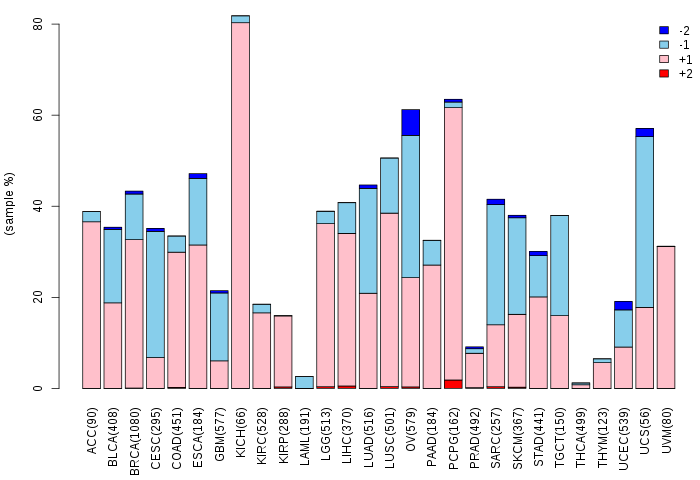
| Copy number variations of TissGene across 28 cancer types (X-axis: cancer type and Y-axis: % of CNV samples) (TCGA Gistic2_CopyNumber_Gistic2_all_data_by_genes, Gistic2 copy number data, version 2016-08-16) |
 |
| Top |
| TissGeneFusions for COLEC10 |
| Fusion genes including TissGene (ChimerDB 3.0, 2016-12-01 and TCGA fusion Portal 2015-12-01) |
| Database | Src | Cancer type | Sample | Fusion gene | ORF | 5'-gene BP | 3'-gene BP |
| Chimerdb3.0 | ChiTaRs | NA | BE083950 | COLEC10-PKNOX1 | chr8:120107060 | chr21:44450290 |
| Top |
| TissGeneNet for COLEC10 |
| Co-expressed gene networks based on protein-protein interaction data (CePIN) (TCGA IlluminaHiSeq_RNASeqV2, pan-cancer normalized log2(norm_counts+1) data, version 2016-08-16) (PINA2 ppi data) |
| Top |
| TissGeneProg for COLEC10 |
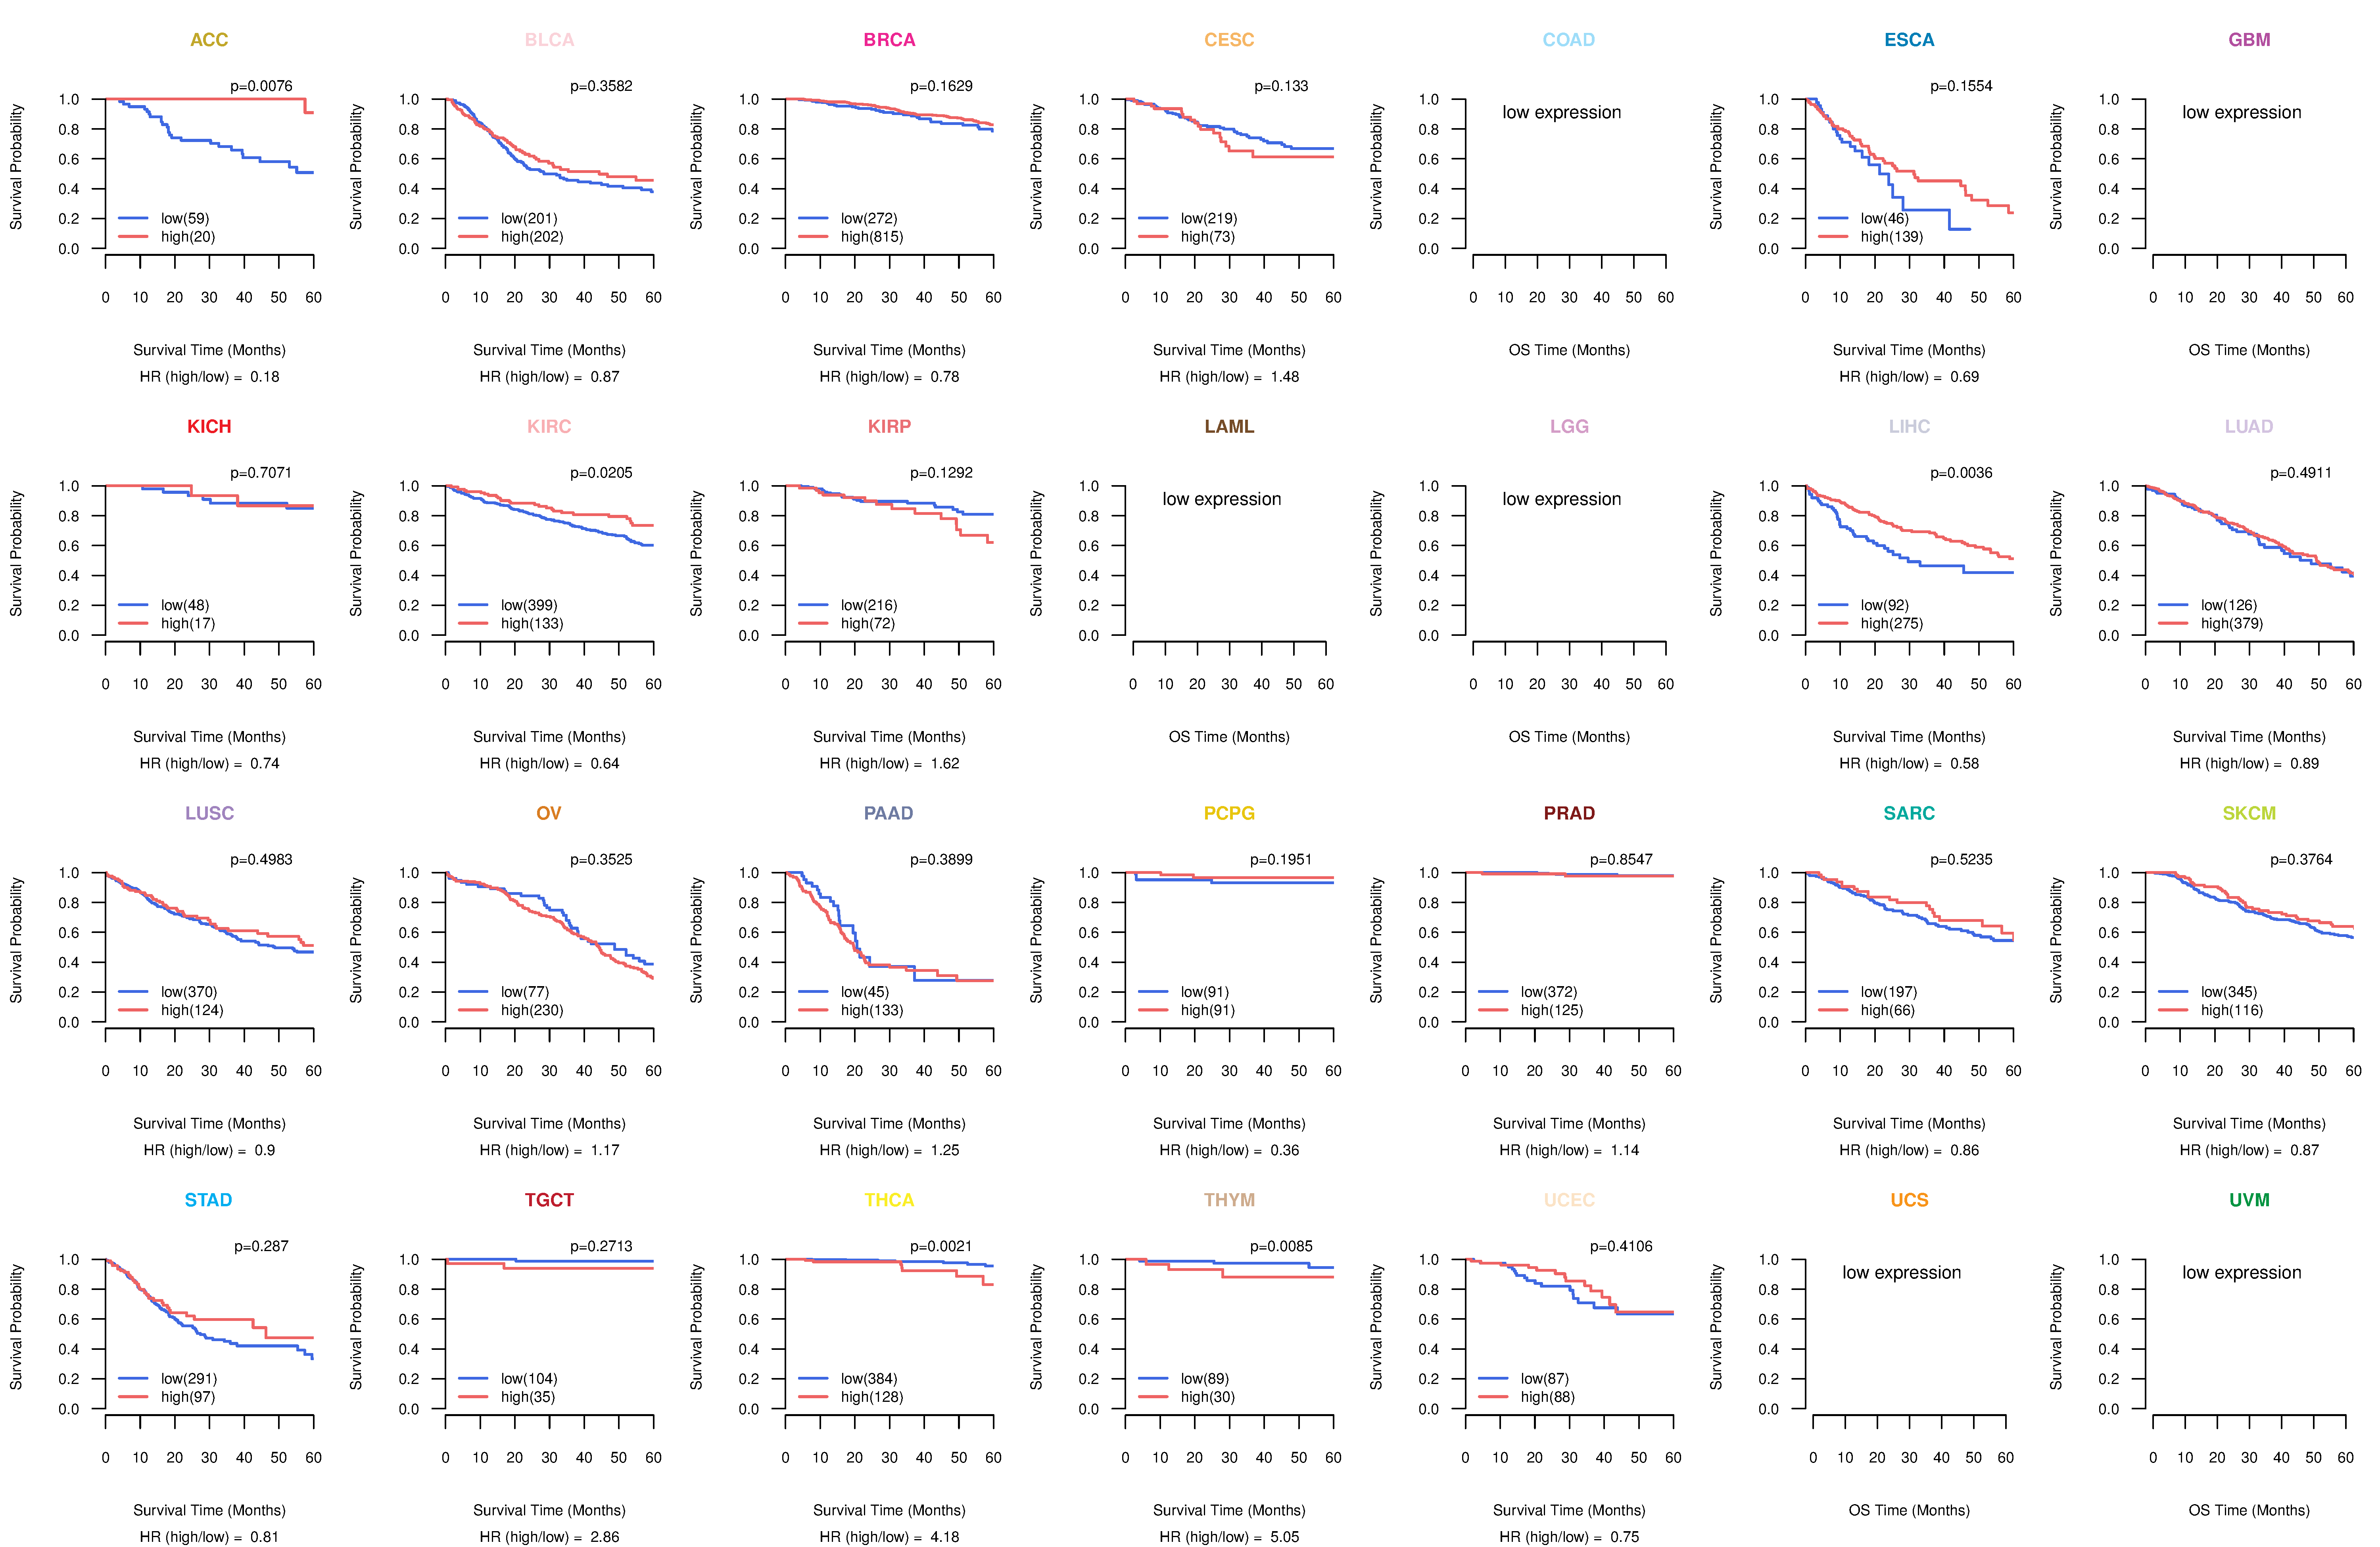
| Kaplan-Meier plots with logrank tests of overall survival (OS) using 28 cancer types (TCGA IlluminaHiSeq_RNASeqV2, pan-cancer normalized log2(norm_counts+1) data, version 2016-08-16) (TCGA clinicalMatrix, phenotype data, version 2016-04-27) * Click on the image to enlarge it in a new window. |
 |
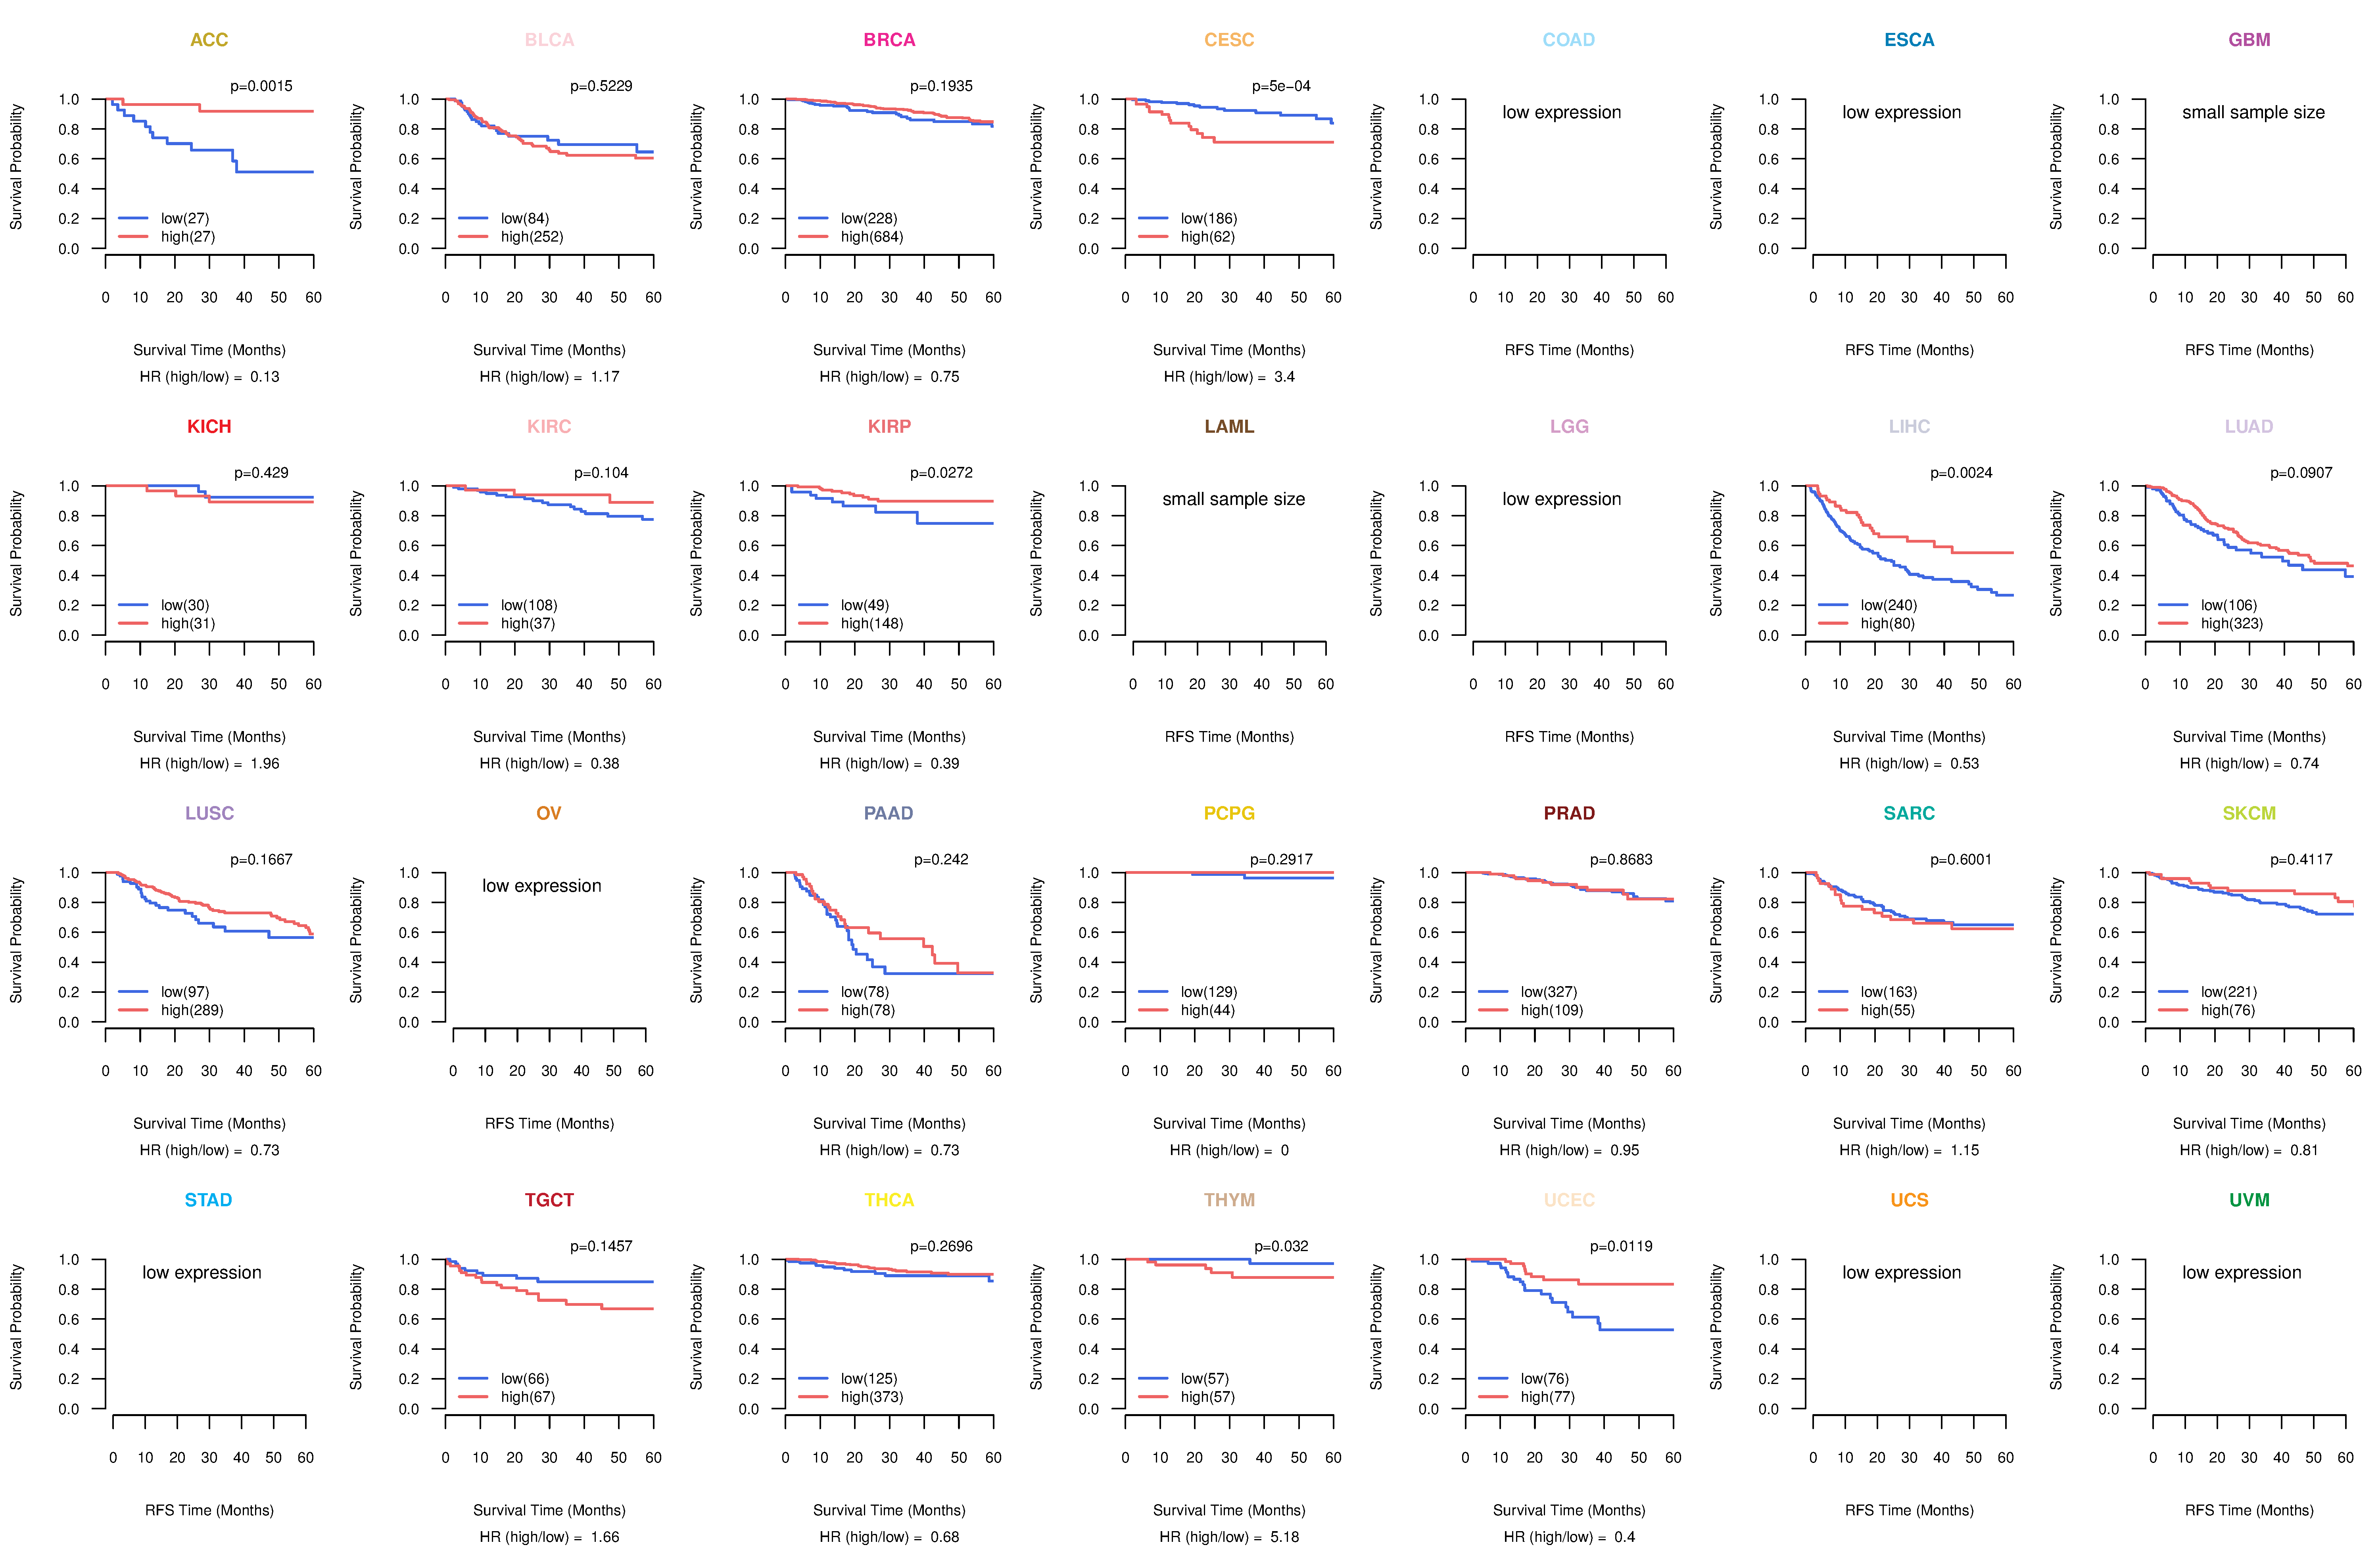
| Kaplan-Meier plots with logrank test of relapse free survival (RFS) using 28 cancer types (TCGA IlluminaHiSeq_RNASeqV2, pan-cancer normalized log2(norm_counts+1) data, version 2016-08-16) (TCGA clinicalMatrix, phenotype data, version 2016-04-27) * Click on the image enlarge it in a new window. |
 |
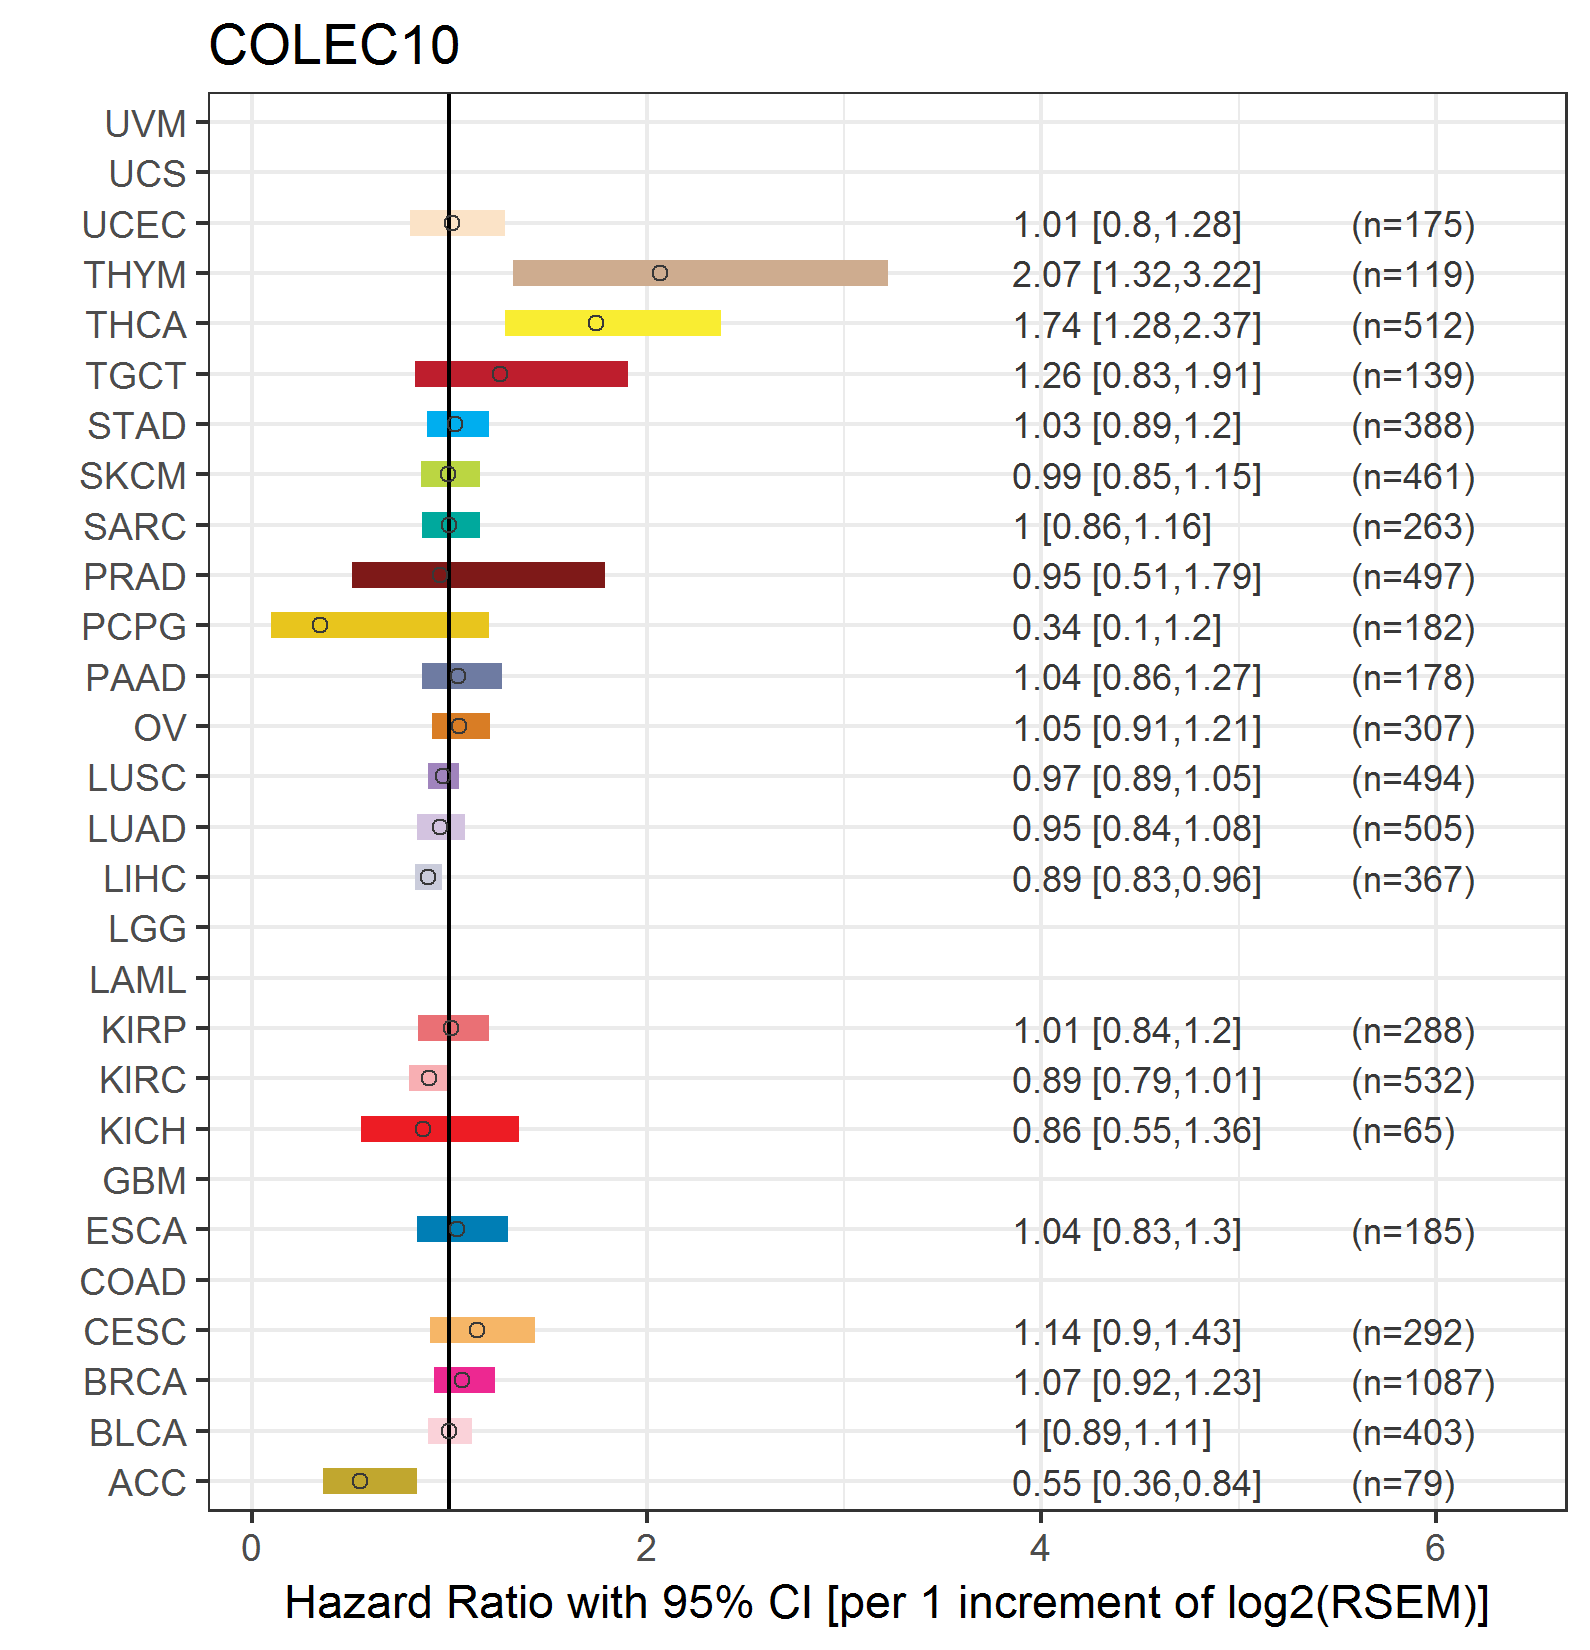
| Forest plot of Cox proportional hazard ratio (HR) and 95% CI of overall survival (OS) using 28 cancer types (TCGA IlluminaHiSeq_RNASeqV2, pan-cancer normalized log2(norm_counts+1) data, version 2016-08-16) (TCGA clinicalMatrix, phenotype data, version 2016-04-27) * Click on the image enlarge it in a new window. |
 |
| Forest plot of Cox proportional hazard ratio (HR) and 95% CI of relapse free survival (RFS) using 28 cancer types (TCGA IlluminaHiSeq_RNASeqV2, pan-cancer normalized log2(norm_counts+1) data, version 2016-08-16) (TCGA clinicalMatrix, phenotype data, version 2016-04-27) * Click on the image enlarge it in a new window. |
 |
| Top |
| TissGeneClin for COLEC10 |
| TissGeneDrug for COLEC10 |
| Drug information targeting TissGene (DrugBank Version 5.0.6, 2017-04-01) |
| DrugBank ID | Drug name | Drug activity | Drug type | Drug status |
| Top |
| TissGeneDisease for COLEC10 |
| Disease information associated with TissGene (DisGeNet, 2016-06-01) |
| Disease ID | Disease name | # pubmeds | Source |
| umls:C0023434 | Chronic Lymphocytic Leukemia | 2 | BeFree |
| umls:C0011849 | Diabetes Mellitus | 1 | GAD |
| umls:C0011854 | Diabetes Mellitus, Insulin-Dependent | 1 | GWASCAT |
| umls:C0024299 | Lymphoma | 1 | BeFree |
| umls:C0024419 | Waldenstrom Macroglobulinemia | 1 | BeFree |
| umls:C0026470 | Monoclonal Gammopathy of Undetermined Significance | 1 | BeFree |
| umls:C0029456 | Osteoporosis | 1 | GWASCAT |
| umls:C0349632 | Splenic Marginal Zone B-Cell Lymphoma | 1 | BeFree |
|
Copyright 2016-Present - The University of Texas Health Science Center at Houston (UTHealth) Web File Viewing | How to Report, Fraud, Waste and Abuse | State of Texas | Statewide Search | Texas Homeland Security | Site Policies |