 |
| |
| |
| |
| |
| |
| |
|

| TissGeneSummary for RAD51AP1 |
 Gene summary Gene summary |
| Basic gene information | Gene symbol | RAD51AP1 |
| Gene name | RAD51 associated protein 1 | |
| Synonyms | PIR51 | |
| Cytomap | UCSC genome browser: 12p13.2-p13.1 | |
| Type of gene | protein-coding | |
| RefGenes | NM_001130862.1, NM_006479.4, | |
| Description | RAD51-associated protein 1RAD51-interacting protein | |
| Modification date | 20141207 | |
| dbXrefs | MIM : 603070 | |
| HGNC : HGNC | ||
| Ensembl : ENSG00000111247 | ||
| Vega : OTTHUMG00000168125 | ||
| Protein | UniProt: go to UniProt's Cross Reference DB Table | |
| Expression | CleanEX: HS_RAD51AP1 | |
| BioGPS: 10635 | ||
| Pathway | NCI Pathway Interaction Database: RAD51AP1 | |
| KEGG: RAD51AP1 | ||
| REACTOME: RAD51AP1 | ||
| Pathway Commons: RAD51AP1 | ||
| Context | iHOP: RAD51AP1 | |
| ligand binding site mutation search in PubMed: RAD51AP1 | ||
| UCL Cancer Institute: RAD51AP1 | ||
| Assigned class in TissGDB* | C | |
| Included tissue-specific gene expression resources | TiGER,GTEx | |
| Specific-tissues in normal samples (assigned by TissGDB using HPA, TiGER, and GTEx) | BladderBone marrowTestis | |
| Cancer types related to the specific-tissues in cancer samples (assigned by TissGDB using TCGA) | BLCALAMLTGCT | |
| Reference showing the relevant tissue of RAD51AP1 | ||
| Description by TissGene annotations | Cancer gene | |
| * Class A consists of genes with literature evidence and is part of the cTissGenes. Class B consists of only cTissGenes without additional evidence. The remaining genes belong to Class C. |
| Gene ontology having evidence of Inferred from Direct Assay (IDA) from Entrez |
| GO ID | GO term | PubMed ID | GO:0010569 | regulation of double-strand break repair via homologous recombination | 23754376 | GO:0071479 | cellular response to ionizing radiation | 23754376 | GO:0010569 | regulation of double-strand break repair via homologous recombination | 23754376 | GO:0071479 | cellular response to ionizing radiation | 23754376 |
| Top |
| TissGeneExp for RAD51AP1 |
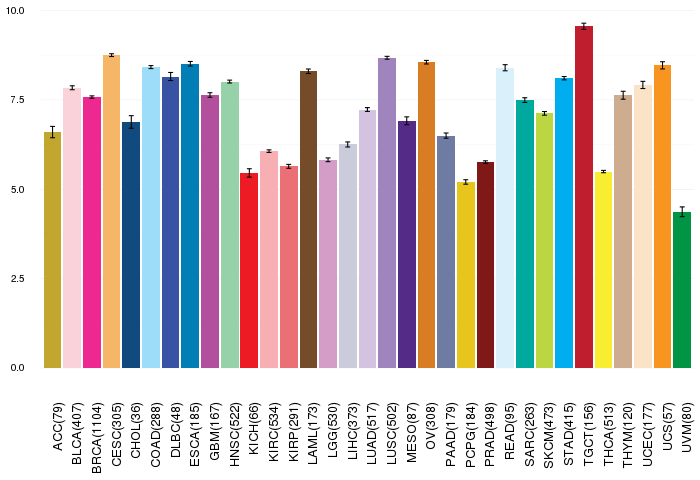
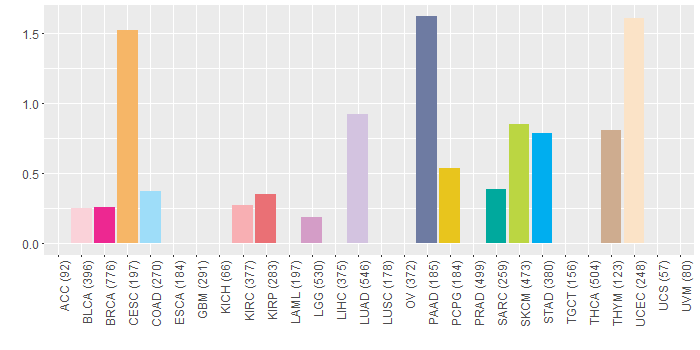
| Gene expressions across 28 cancer types (X-axis: cancer type and Y-axis: log2(norm_counts+1)) (TCGA IlluminaHiSeq_RNASeqV2, pan-cancer normalized log2(norm_counts+1) data, version 2016-08-16) |
 |
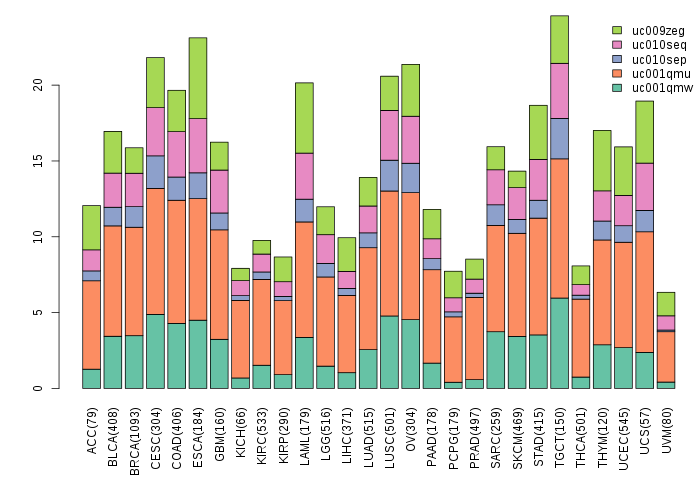
| Gene isoform expressions across 28 cancer types (X-axis: cancer type and Y-axis: log2(norm_counts+1)) (TCGA pan-cancer tcga_rsem_isoform_tpm, version 2016-09-01) |
 |
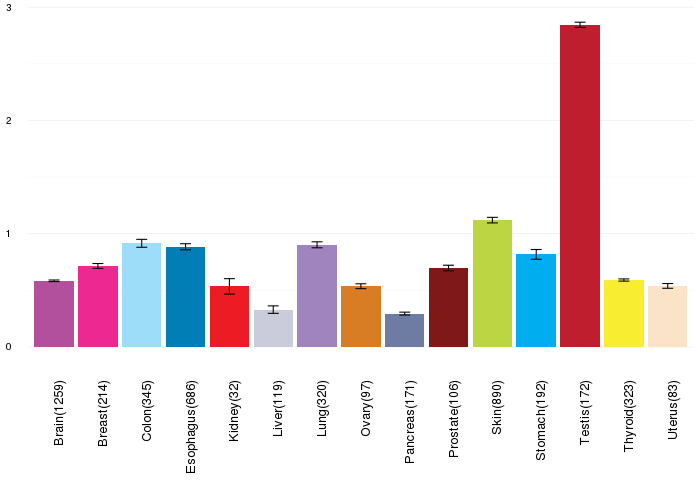
| Gene expressions across normal tissues of GTEx data (GTEx GTEx_Analysis_v6_RNA-seq_RNA-SeQCv1.1.8_gene_rpkm.gct) - Here, we shows the matched tissue types only among our 28 cancer types. |
 |
| Different expressions across 14 cancer types with more than 10 samples between matched tumors and normals (X-axis: cancer type and Y-axis: log2(norm_counts+1)) (TCGA IlluminaHiSeq_RNASeqV2, pan-cancer normalized log2(norm_counts+1) data, version 2016-08-16) |
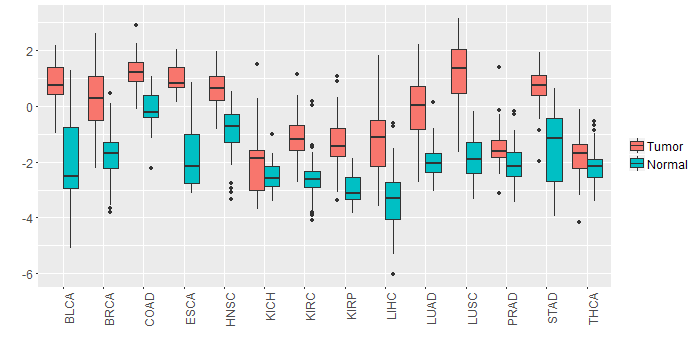 |
| - Significantly differentially expressed cancer types and information. (|Fold change|>1 and FDR<0.05) |
| Cancer type | Mean(exp) in tumor | Mean(exp) in matched normal | Log2FC | P-val. | FDR |
| LUSC | 1.289481536 | -1.888677287 | 3.178158824 | 1.06E-30 | 4.97E-29 |
| HNSC | 0.605855772 | -0.947841902 | 1.553697674 | 9.78E-14 | 4.68E-12 |
| LUAD | -0.109177828 | -1.959141621 | 1.849963793 | 3.42E-17 | 4.31E-16 |
| BRCA | 0.292885148 | -1.770724501 | 2.063609649 | 1.50E-38 | 3.98E-37 |
| KIRC | -1.119123039 | -2.55113415 | 1.432011111 | 3.07E-24 | 3.42E-23 |
| LIHC | -1.186725483 | -3.355509483 | 2.168784 | 7.63E-15 | 2.23E-13 |
| BLCA | 0.842327253 | -1.930214852 | 2.772542105 | 4.97E-07 | 1.94E-05 |
| COAD | 1.208736363 | -0.14839056 | 1.357126923 | 1.66E-09 | 1.73E-08 |
| STAD | 0.646895017 | -1.444339358 | 2.091234375 | 1.27E-10 | 1.59E-08 |
| KIRP | -1.310498733 | -3.001042483 | 1.69054375 | 1.13E-10 | 1.26E-09 |
| ESCA | 0.990159789 | -1.731976574 | 2.722136364 | 2.63E-05 | 0.001388764 |
| Top |
| TissGene-miRNA for RAD51AP1 |
| Significantly anti-correlated miRNAs of TissGene across 28 cancer types (Gene-miRNA relations from TargetScanHuman Relsease 7.1, Conserved_Site_Context_Scores.txt.zip, 06.01.2016) (TCGA IlluminaHiSeq_miRNASeq, log2(RPM+1) data, version 2016-11-21) (TCGA IlluminaHiSeq_RNASeqV2, log2(normalized_count+1) data, version 2016-08-16) (Spearman’s Rank Correlation (p-value<0.05 and coefficient<-0.25)) |
| Cancer type | miRNA id | miRNA accession | P-val. | Coeff. | # samples |
| Top |
| TissGeneMut for RAD51AP1 |
| TissGeneSNV for RAD51AP1 |
| nsSNV counts per each loci. Different colors of circles represent different cancer types. Circle size denotes number of samples. (TCGA somatic mutation (SNPs and small INDELs) data, version 2016-04-25) * Click on the image to enlarge it in a new window. |
 |
 |
| Somatic nucleotide variants of TissGene across 28 cancer types (X-axis: cancer type and Y-axis: % of mutated samples) The numbers in parentheses are numbers of samples with mutation (nsSNVs). (TCGA somatic mutation (SNPs and small INDELs) data, version 2016-04-25) |
 |
| - nsSNVs sorted by frequency. |
| AAchange | Cancer type | # samples |
| p.E214K | BLCA | 1 |
| p.R287G | STAD | 1 |
| p.D219V | SKCM | 1 |
| p.S260L | UCEC | 1 |
| p.M136T | CESC | 1 |
| p.L52V | UCEC | 1 |
| p.S149I | UCEC | 1 |
| p.D284N | SKCM | 1 |
| p.S310F | LGG | 1 |
| p.K283N | PAAD | 1 |
| p.D284H | PCPG | 1 |
| p.S318I | LUAD | 1 |
| p.K300N | PAAD | 1 |
| p.A172V | HNSC | 1 |
| p.S174C | HNSC | 1 |
| p.S293F | LGG | 1 |
| p.D219N | LUAD | 1 |
| p.K69E | PAAD | 1 |
| p.R333C | HNSC | 1 |
| p.N348D | DLBC | 1 |
| p.Q45* | UCEC | 1 |
| p.L55V | BRCA | 1 |
| p.S318I | SARC | 1 |
| p.E73K | HNSC | 1 |
| p.E42* | PAAD | 1 |
| p.E42X | PAAD | 1 |
| p.L184F | SKCM | 1 |
| p.S313N | CESC | 1 |
| p.W184R | HNSC | 1 |
| p.E59K | LUAD | 1 |
| p.L336M | KIRC | 1 |
| p.A178S | THYM | 1 |
| p.P306S | SKCM | 1 |
| p.V229F | BRCA | 1 |
| p.S143C | CESC | 1 |
| p.E197Q | LUAD | 1 |
| p.K93R | STAD | 1 |
| p.N144K | LUAD | 1 |
| p.S263Y | COAD | 1 |
| p.D202V | SKCM | 1 |
| p.G187C | LUAD | 1 |
| p.E207G | STAD | 1 |
| p.L152F | KIRP | 1 |
| Top |
| TissGeneCNV for RAD51AP1 |
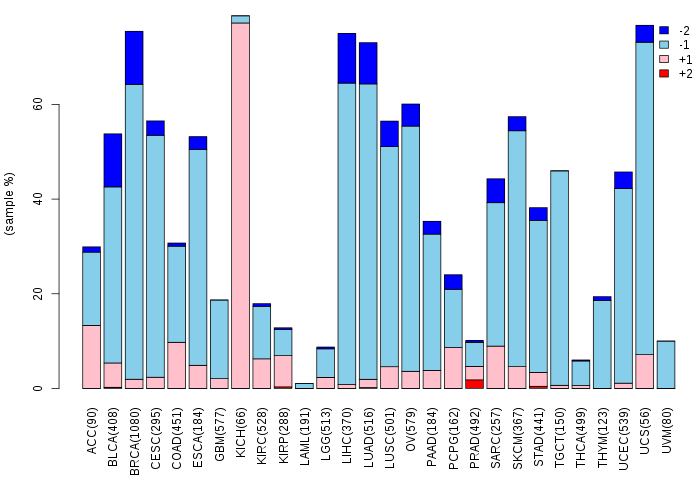
| Copy number variations of TissGene across 28 cancer types (X-axis: cancer type and Y-axis: % of CNV samples) (TCGA Gistic2_CopyNumber_Gistic2_all_data_by_genes, Gistic2 copy number data, version 2016-08-16) |
 |
| Top |
| TissGeneFusions for RAD51AP1 |
| Fusion genes including TissGene (ChimerDB 3.0, 2016-12-01 and TCGA fusion Portal 2015-12-01) |
| Database | Src | Cancer type | Sample | Fusion gene | ORF | 5'-gene BP | 3'-gene BP |
| Chimerdb3.0 | ChiTaRs | NA | BE927719 | LINC00476-RAD51AP1 | chr9:98603652 | chr12:4653004 | |
| Chimerdb3.0 | ChiTaRs | NA | AA263143 | PHF20L1-RAD51AP1 | chr8:133845419 | chr12:4648072 | |
| Chimerdb3.0 | FusionScan | LGG | TCGA-CS-4943-01A | RAD51AP1-ST8SIA1 | In-Frame | chr12:4648122 | chr12:22402032 |
| Chimerdb3.0 | TopHat-Fusion | LUSC | TCGA-37-3792-01A | RAD51AP1-SLCO1C1 | Out-of-Frame | chr12:4653069 | chr12:20885842 |
| Chimerdb3.0 | TopHat-Fusion | LUSC | TCGA-37-3792-01A | RAD51AP1-SLCO1C1 | In-Frame | chr12:4653069 | chr12:20890040 |
| Chimerdb3.0 | TopHat-Fusion | LUSC | TCGA-37-3792-01A | RAD51AP1-SLCO1C1 | In-Frame | chr12:4653076 | chr12:20885842 |
| TCGAfusionPortal | PRADA | LGG | TCGA-CS-4943-01A | RAD51AP1-ST8SIA1 | In-frame | Chr12:4648122 | Chr12:22402032 |
| TCGAfusionPortal | PRADA | LUSC | TCGA-37-3792-01A | RAD51AP1-SLCO1C1 | In-frame | Chr12:4653070 | Chr12:20890041 |
| Top |
| TissGeneNet for RAD51AP1 |
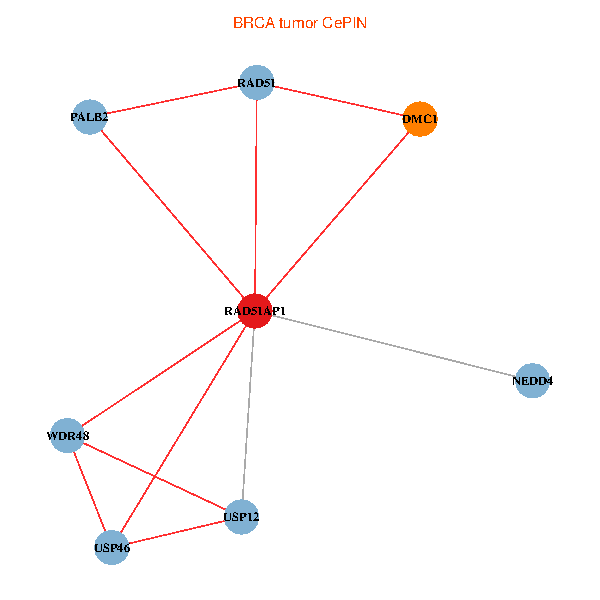
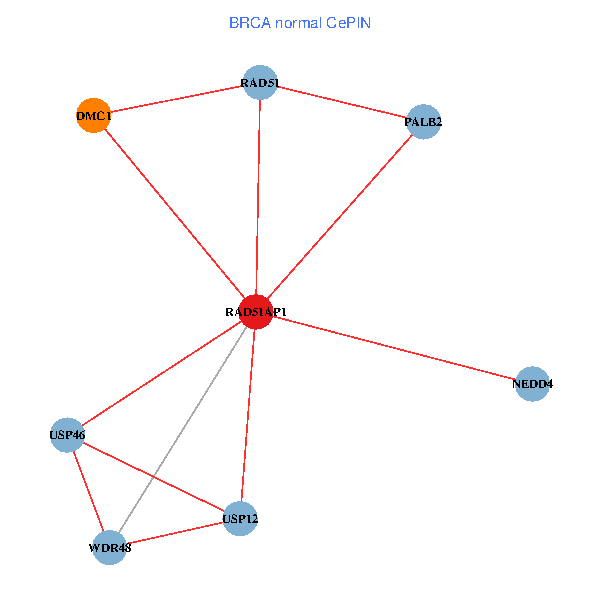
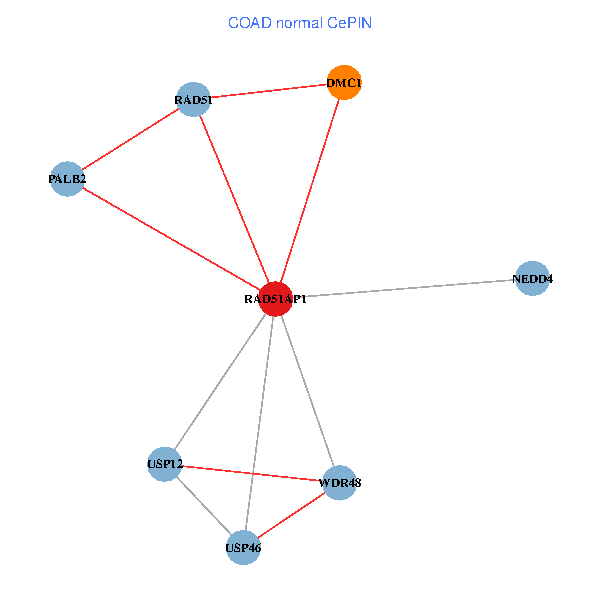
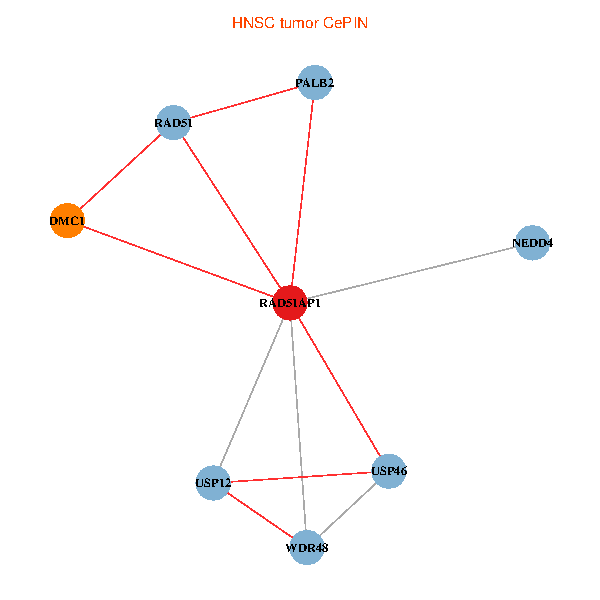
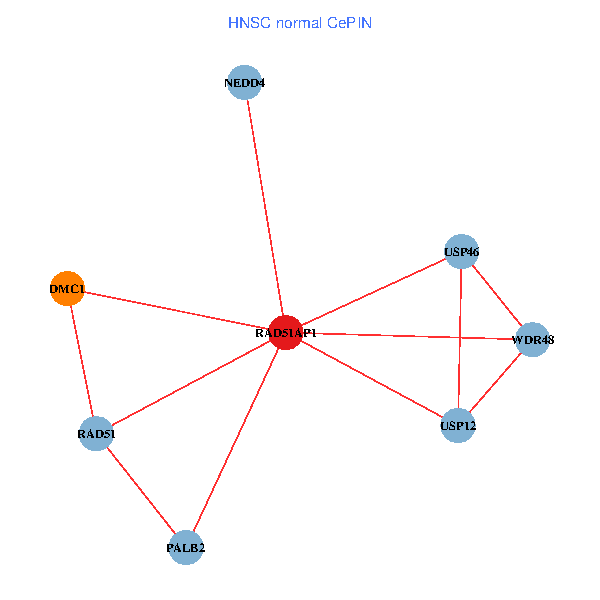
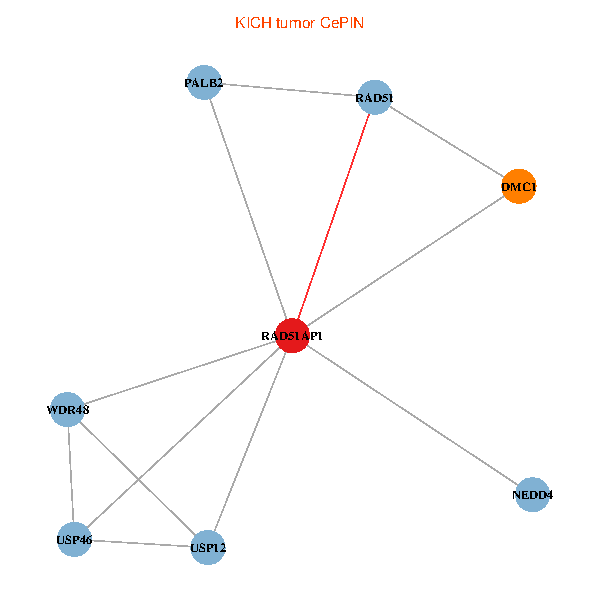
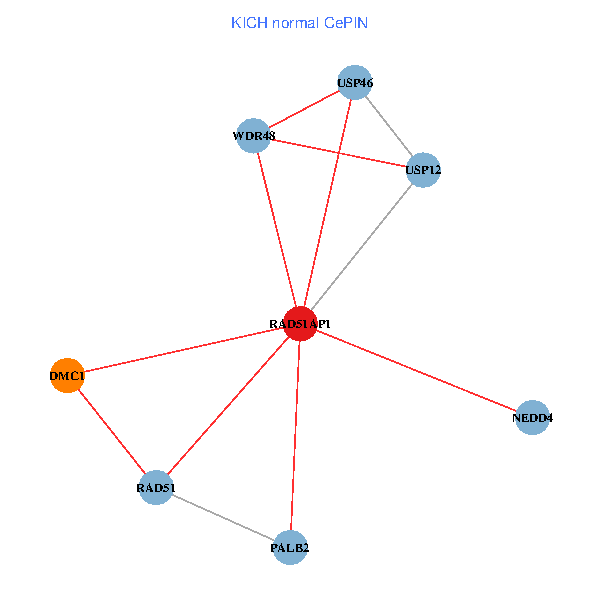
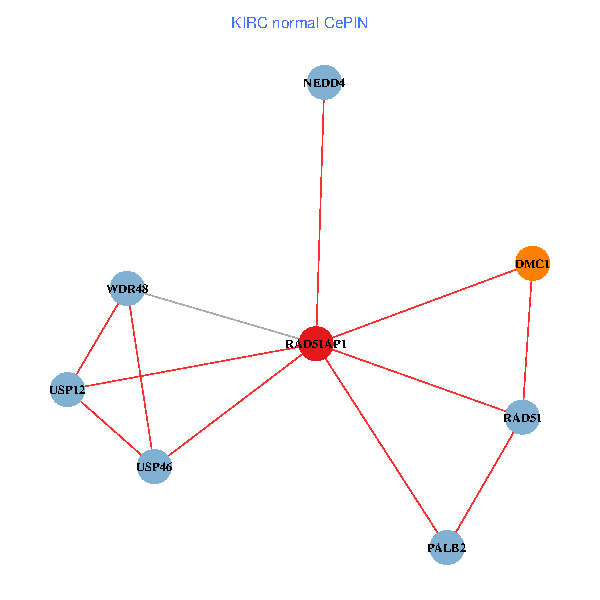
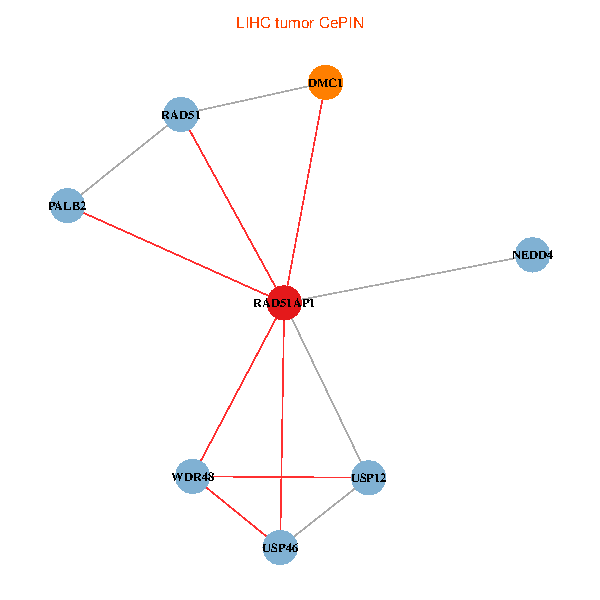
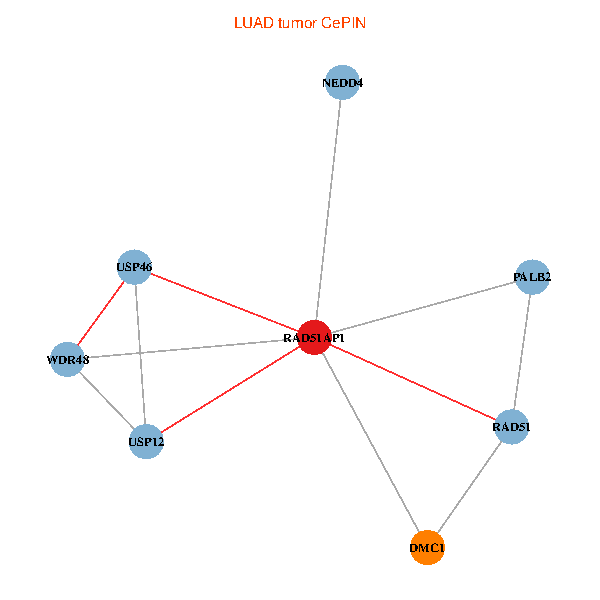
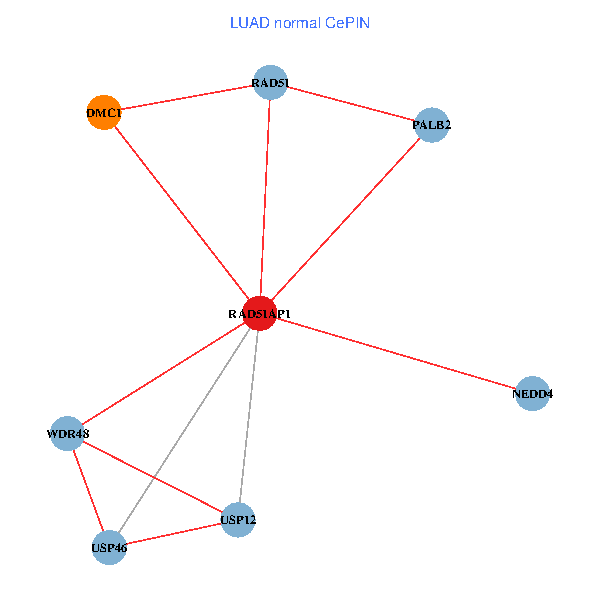
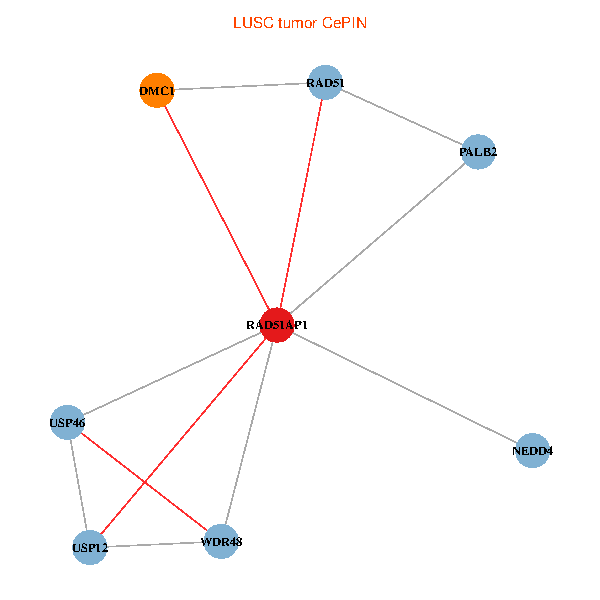
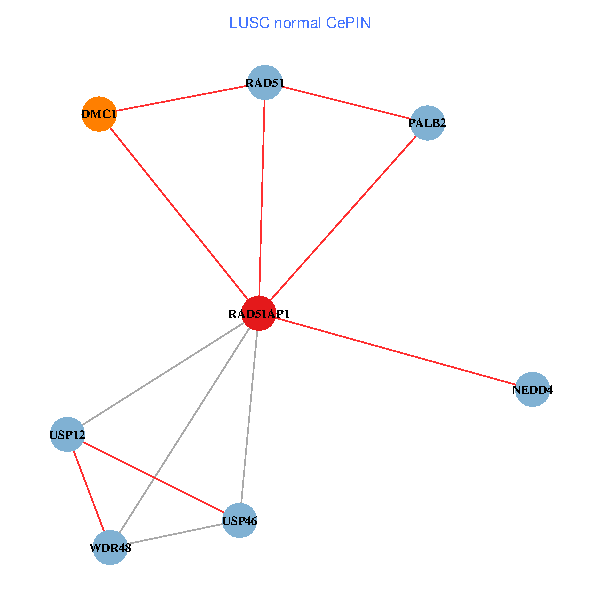
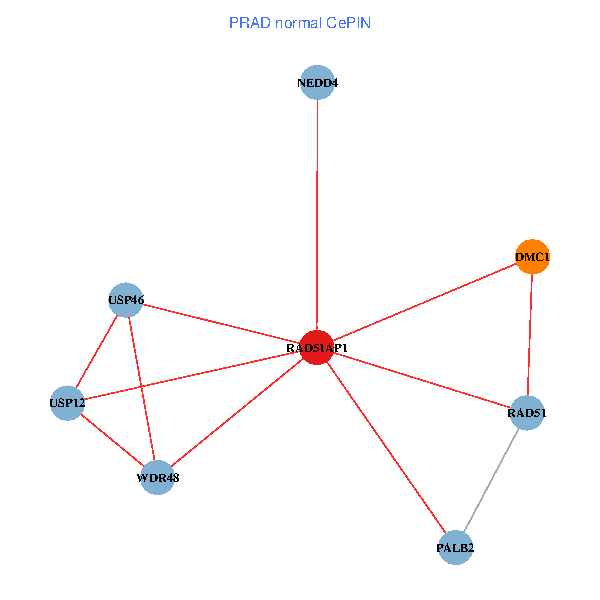
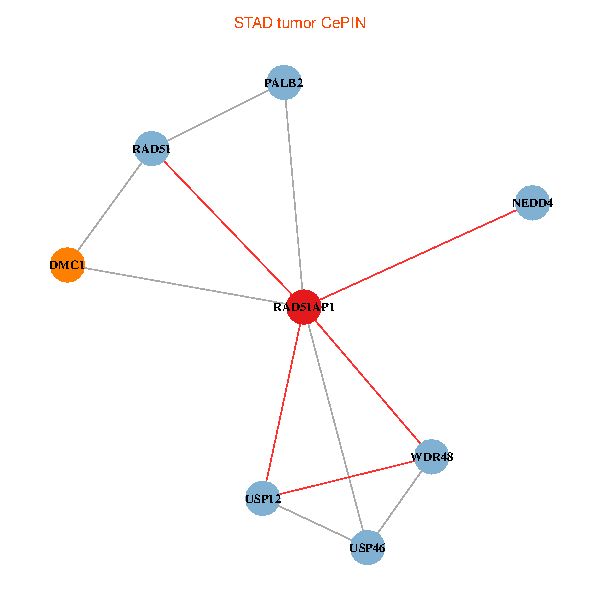
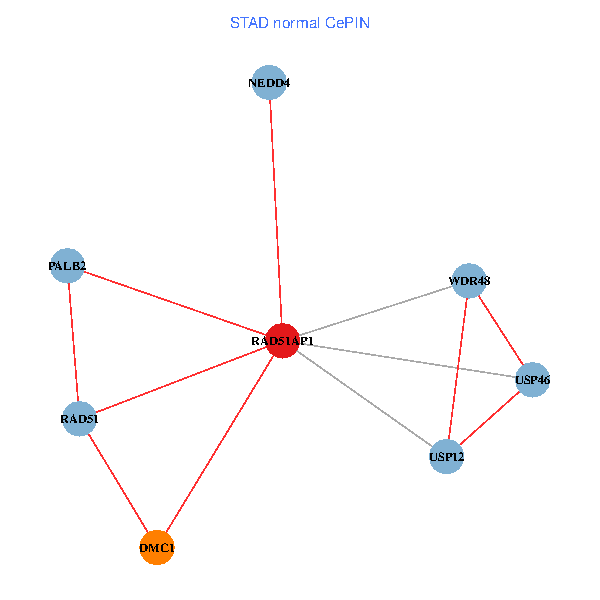
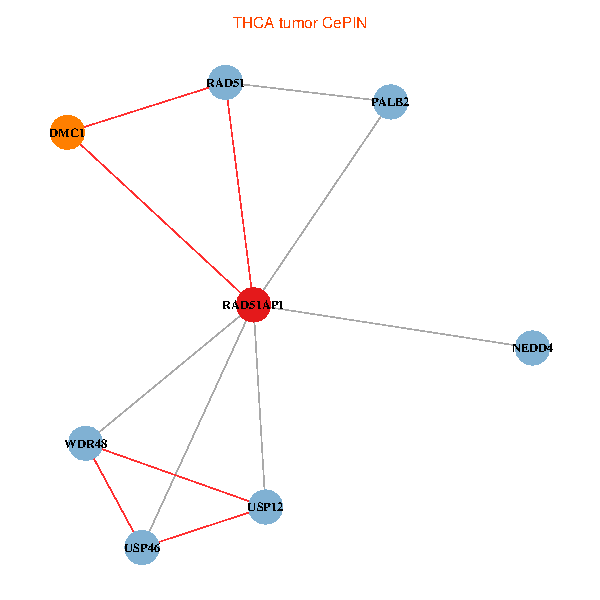
| Co-expressed gene networks based on protein-protein interaction data (CePIN) (TCGA IlluminaHiSeq_RNASeqV2, pan-cancer normalized log2(norm_counts+1) data, version 2016-08-16) (PINA2 ppi data) |
| BRCA (tumor) | BRCA (normal) |
| RAD51AP1, NEDD4, RAD51, WDR48, PALB2, DMC1, USP46, USP12 (tumor) | RAD51AP1, NEDD4, RAD51, WDR48, PALB2, DMC1, USP46, USP12 (normal) |
 |  |
| COAD (tumor) | COAD (normal) |
| RAD51AP1, NEDD4, RAD51, WDR48, PALB2, DMC1, USP46, USP12 (tumor) | RAD51AP1, NEDD4, RAD51, WDR48, PALB2, DMC1, USP46, USP12 (normal) |
 |  |
| HNSC (tumor) | HNSC (normal) |
| RAD51AP1, NEDD4, RAD51, WDR48, PALB2, DMC1, USP46, USP12 (tumor) | RAD51AP1, NEDD4, RAD51, WDR48, PALB2, DMC1, USP46, USP12 (normal) |
 |  |
| KICH (tumor) | KICH (normal) |
| RAD51AP1, NEDD4, RAD51, WDR48, PALB2, DMC1, USP46, USP12 (tumor) | RAD51AP1, NEDD4, RAD51, WDR48, PALB2, DMC1, USP46, USP12 (normal) |
 |  |
| KIRC (tumor) | KIRC (normal) |
| RAD51AP1, NEDD4, RAD51, WDR48, PALB2, DMC1, USP46, USP12 (tumor) | RAD51AP1, NEDD4, RAD51, WDR48, PALB2, DMC1, USP46, USP12 (normal) |
 |  |
| KIRP (tumor) | KIRP (normal) |
| RAD51AP1, NEDD4, RAD51, WDR48, PALB2, DMC1, USP46, USP12 (tumor) | RAD51AP1, NEDD4, RAD51, WDR48, PALB2, DMC1, USP46, USP12 (normal) |
 |  |
| LIHC (tumor) | LIHC (normal) |
| RAD51AP1, NEDD4, RAD51, WDR48, PALB2, DMC1, USP46, USP12 (tumor) | RAD51AP1, NEDD4, RAD51, WDR48, PALB2, DMC1, USP46, USP12 (normal) |
 |  |
| LUAD (tumor) | LUAD (normal) |
| RAD51AP1, NEDD4, RAD51, WDR48, PALB2, DMC1, USP46, USP12 (tumor) | RAD51AP1, NEDD4, RAD51, WDR48, PALB2, DMC1, USP46, USP12 (normal) |
 |  |
| LUSC (tumor) | LUSC (normal) |
| RAD51AP1, NEDD4, RAD51, WDR48, PALB2, DMC1, USP46, USP12 (tumor) | RAD51AP1, NEDD4, RAD51, WDR48, PALB2, DMC1, USP46, USP12 (normal) |
 |  |
| PRAD (tumor) | PRAD (normal) |
| RAD51AP1, NEDD4, RAD51, WDR48, PALB2, DMC1, USP46, USP12 (tumor) | RAD51AP1, NEDD4, RAD51, WDR48, PALB2, DMC1, USP46, USP12 (normal) |
 |  |
| STAD (tumor) | STAD (normal) |
| RAD51AP1, NEDD4, RAD51, WDR48, PALB2, DMC1, USP46, USP12 (tumor) | RAD51AP1, NEDD4, RAD51, WDR48, PALB2, DMC1, USP46, USP12 (normal) |
 |  |
| THCA (tumor) | THCA (normal) |
| RAD51AP1, NEDD4, RAD51, WDR48, PALB2, DMC1, USP46, USP12 (tumor) | RAD51AP1, NEDD4, RAD51, WDR48, PALB2, DMC1, USP46, USP12 (normal) |
 |  |
| Top |
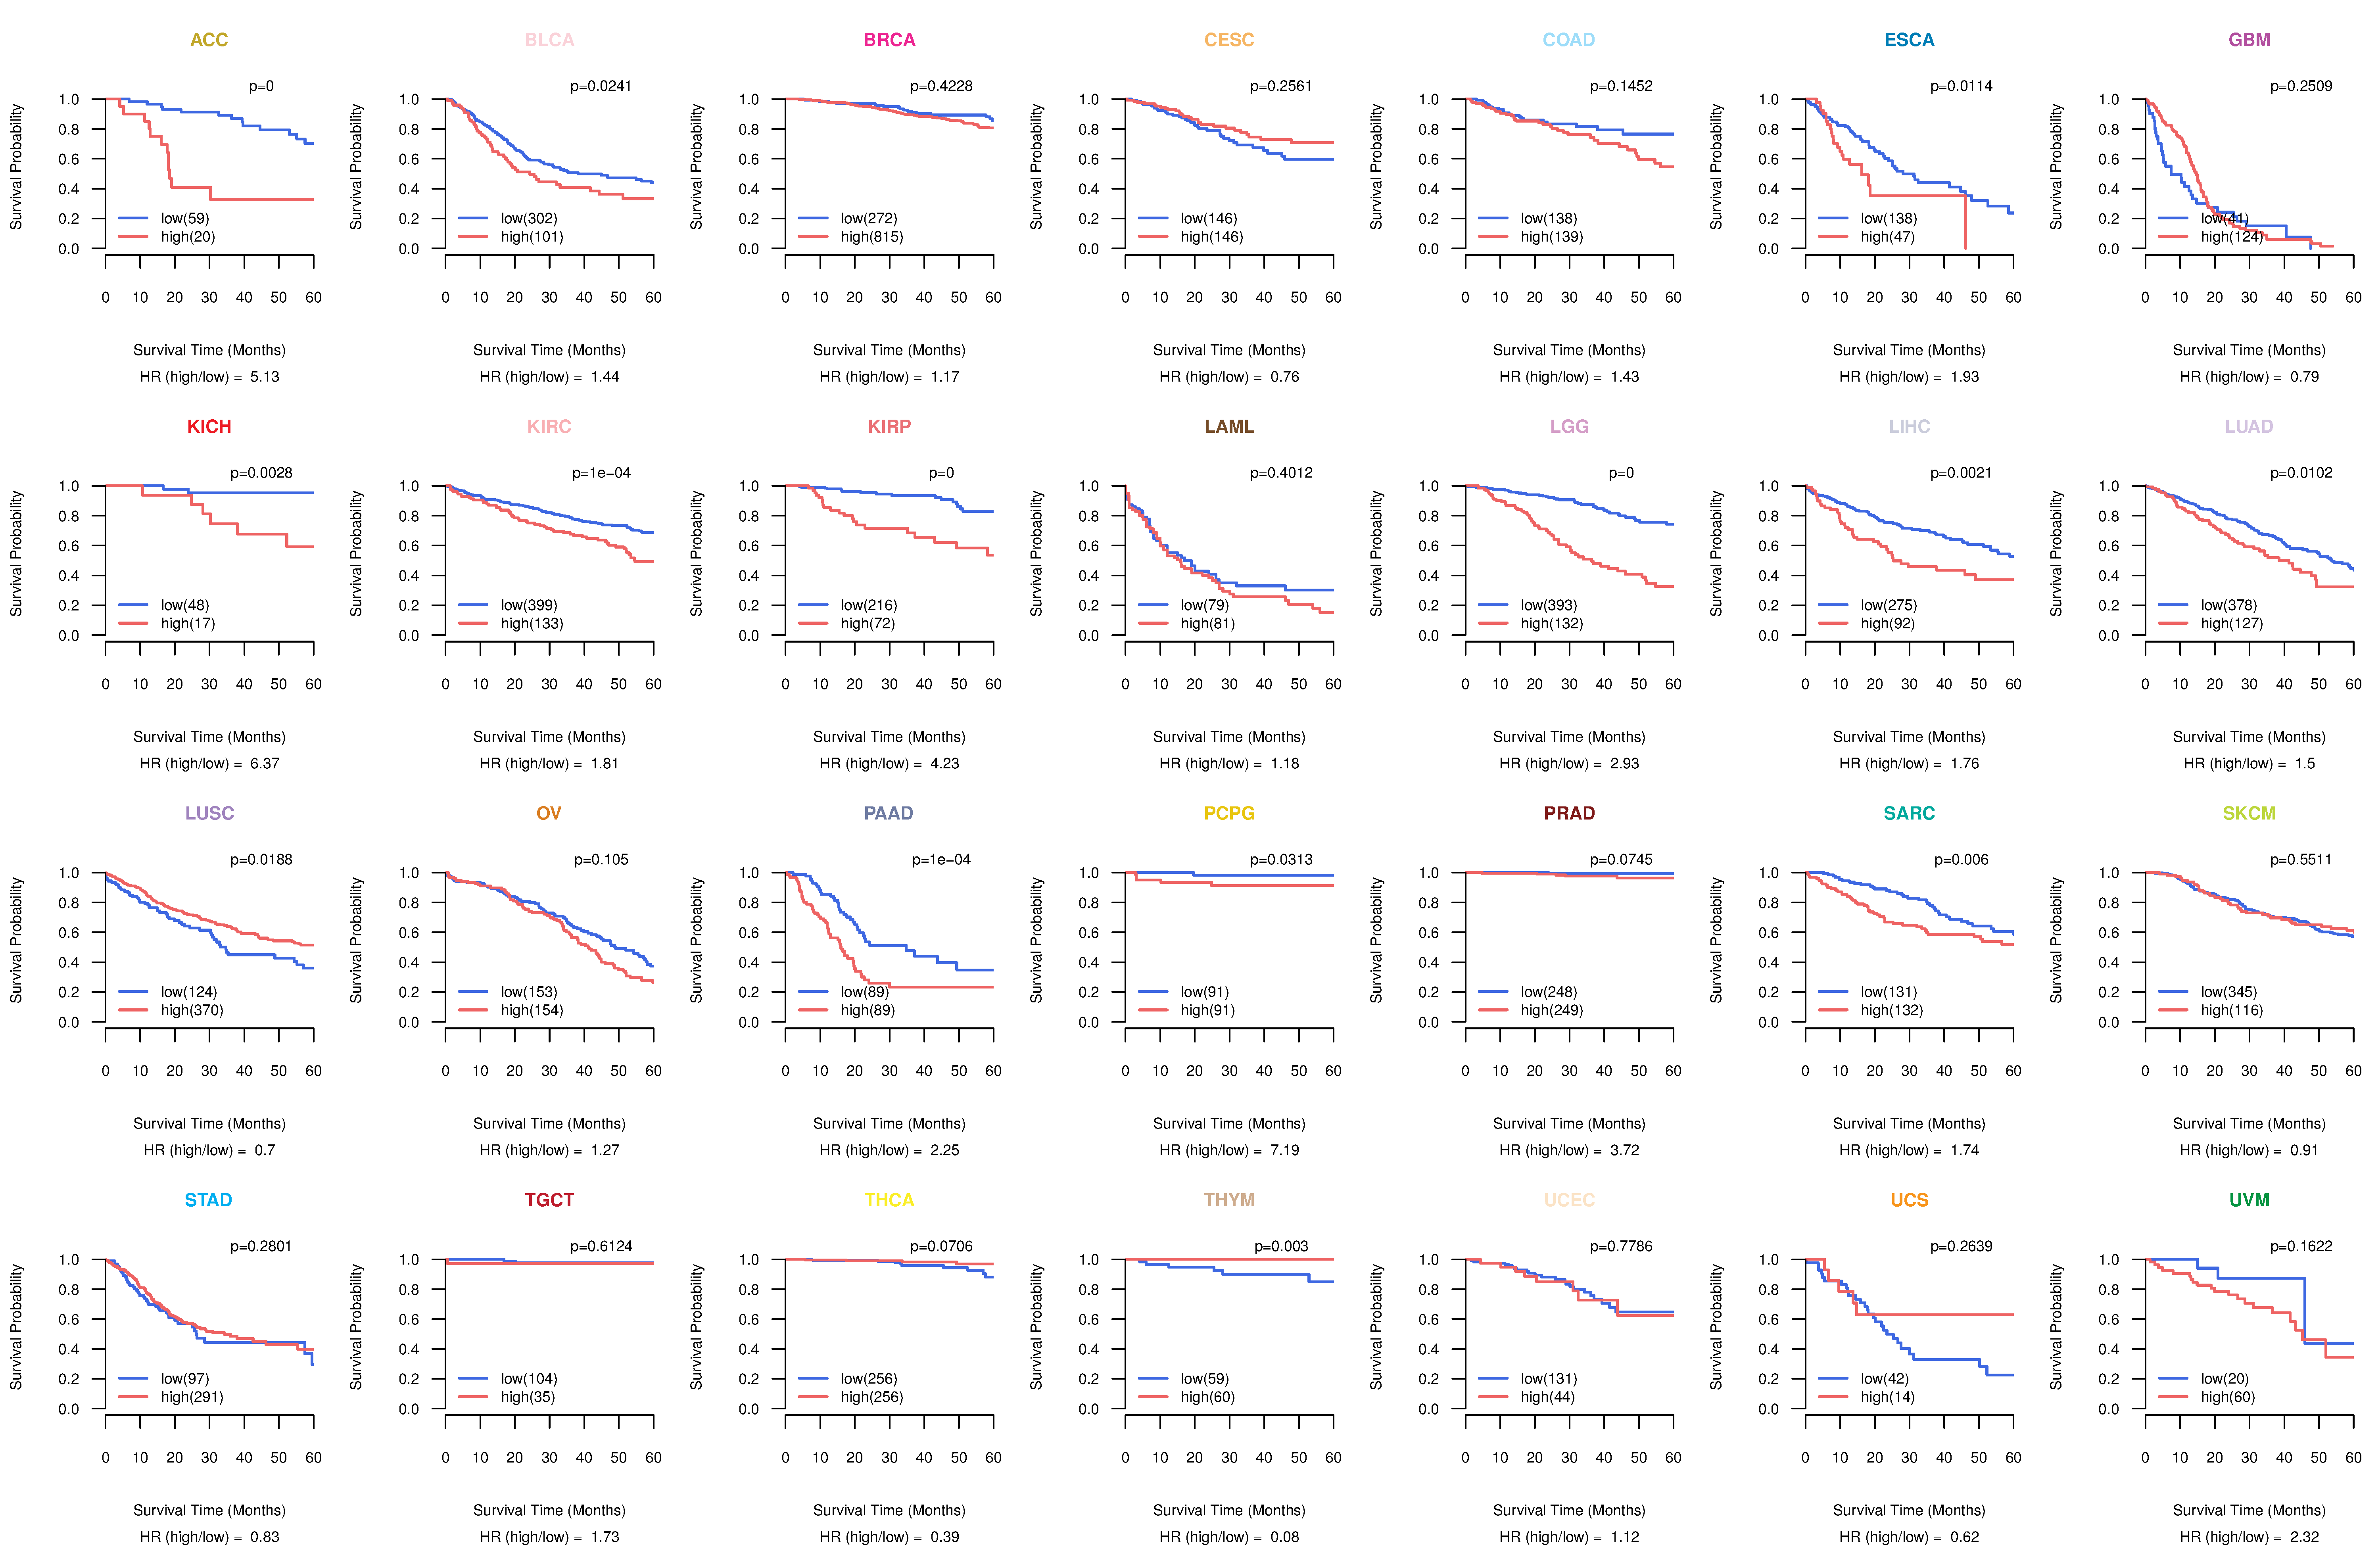
| TissGeneProg for RAD51AP1 |
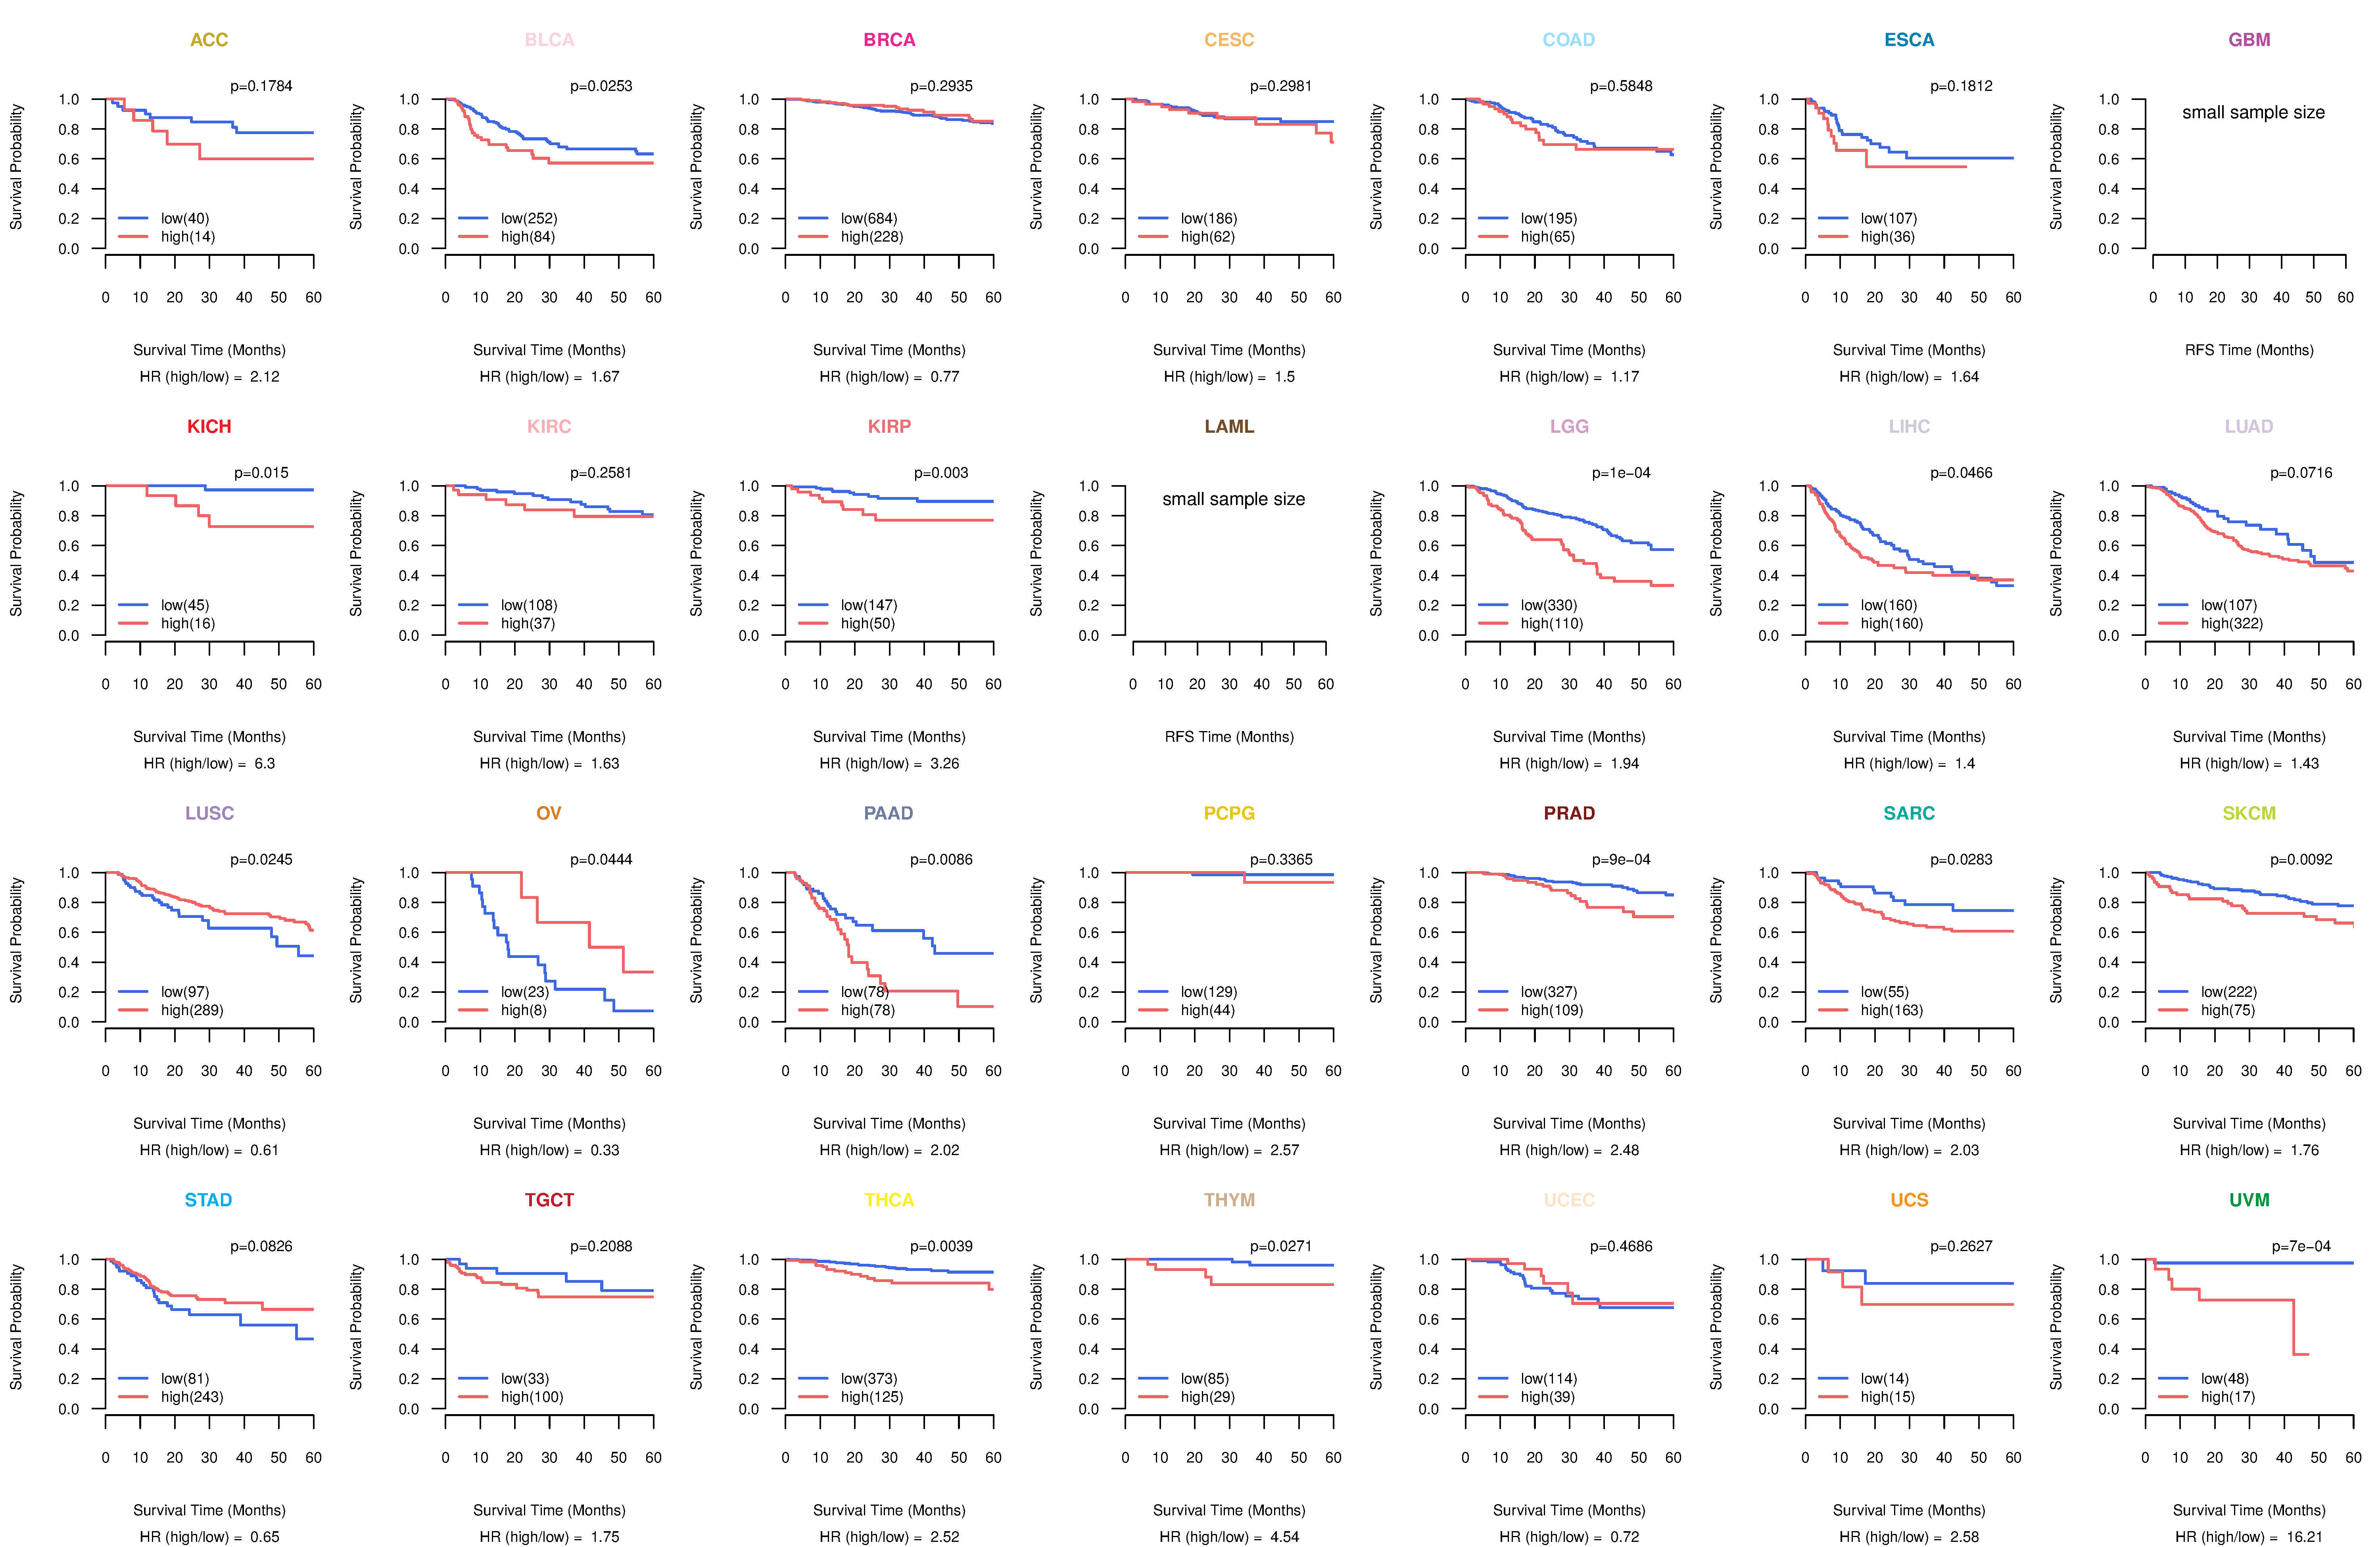
| Kaplan-Meier plots with logrank tests of overall survival (OS) using 28 cancer types (TCGA IlluminaHiSeq_RNASeqV2, pan-cancer normalized log2(norm_counts+1) data, version 2016-08-16) (TCGA clinicalMatrix, phenotype data, version 2016-04-27) * Click on the image to enlarge it in a new window. |
 |
| Kaplan-Meier plots with logrank test of relapse free survival (RFS) using 28 cancer types (TCGA IlluminaHiSeq_RNASeqV2, pan-cancer normalized log2(norm_counts+1) data, version 2016-08-16) (TCGA clinicalMatrix, phenotype data, version 2016-04-27) * Click on the image enlarge it in a new window. |
 |
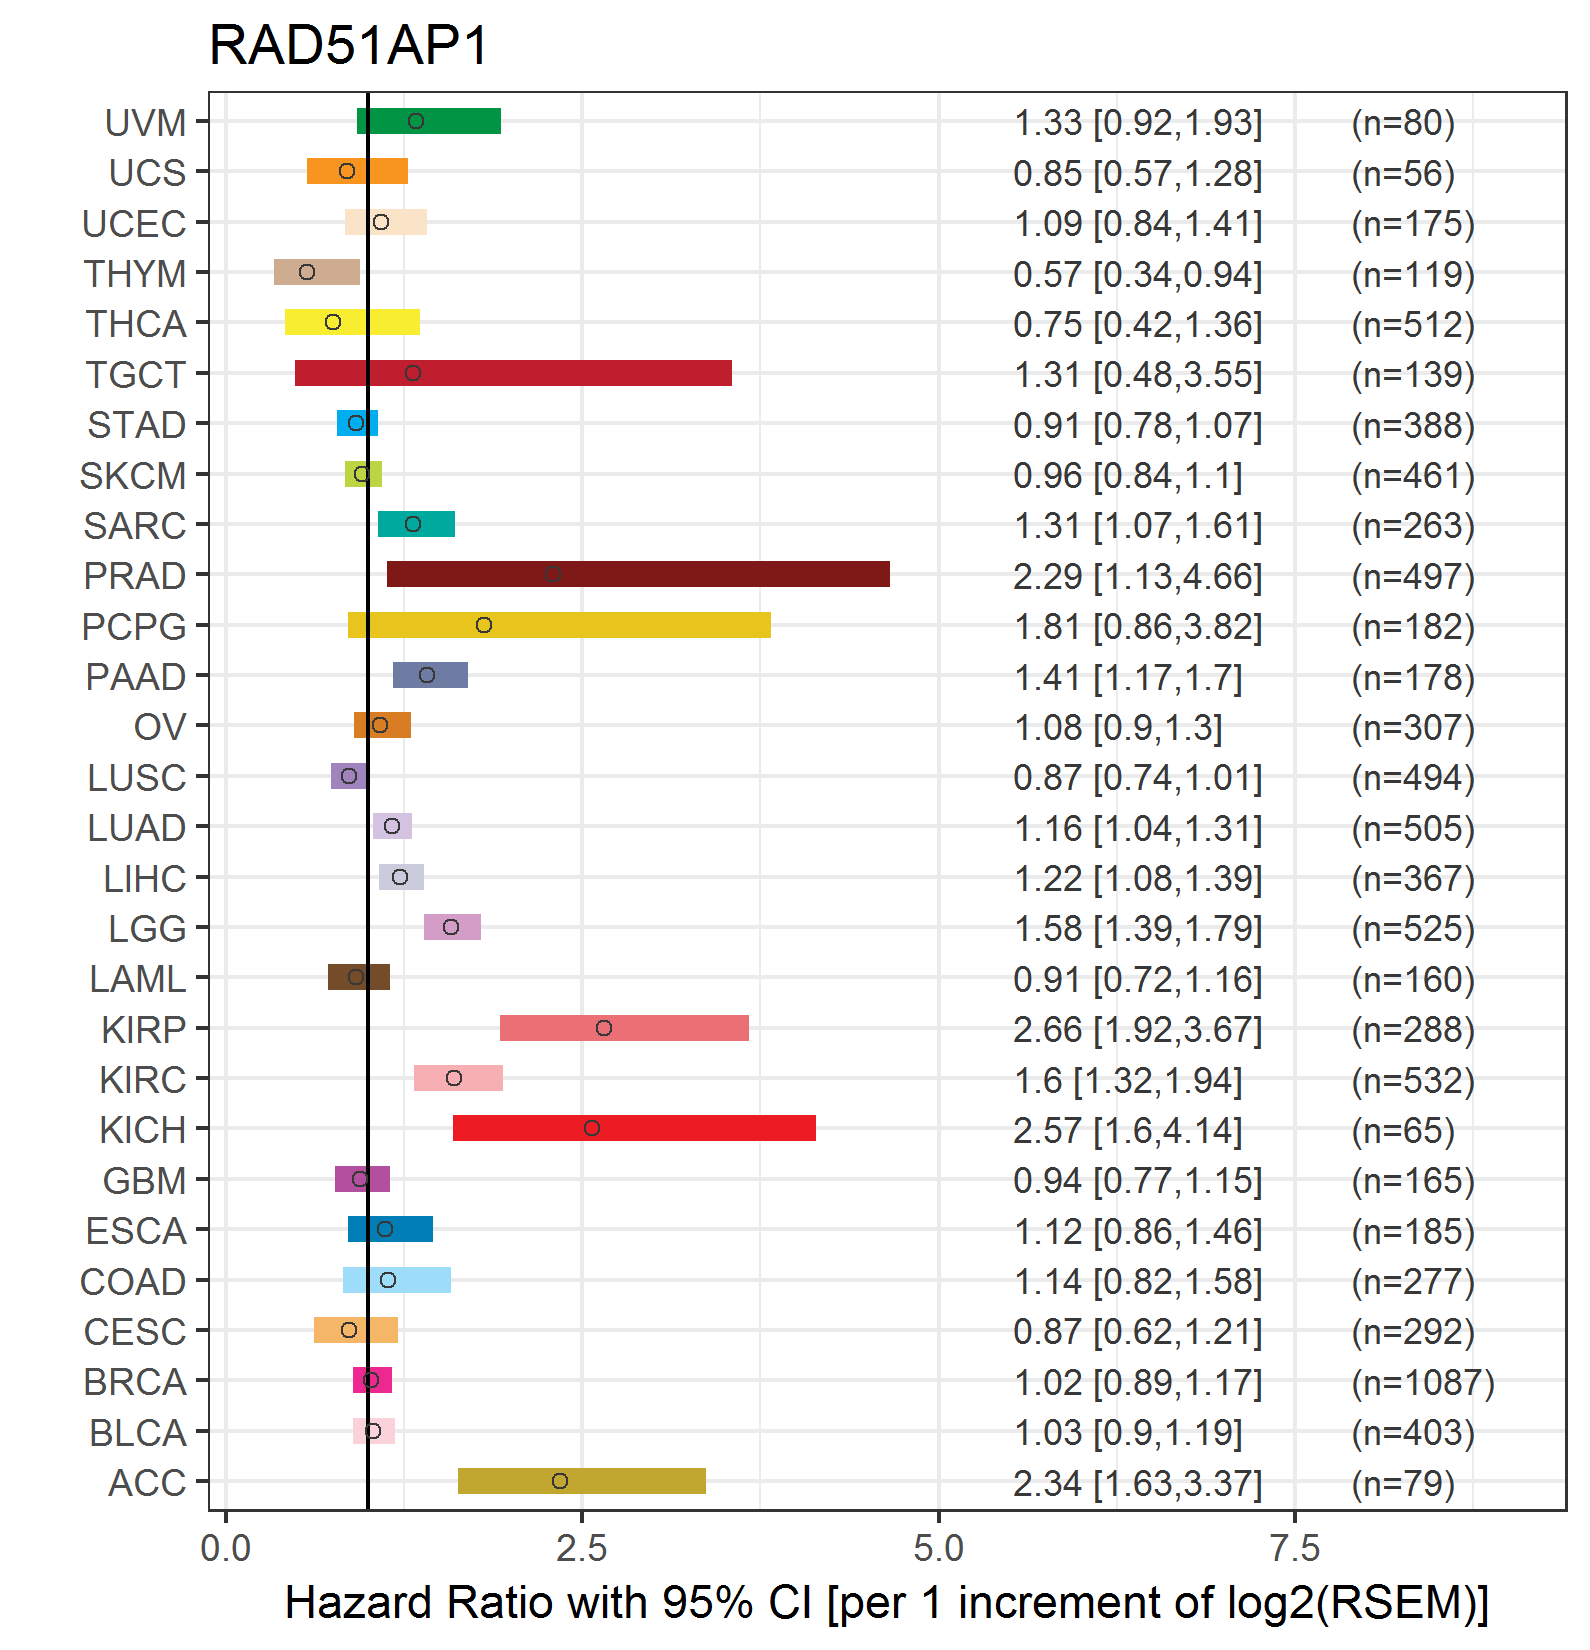
| Forest plot of Cox proportional hazard ratio (HR) and 95% CI of overall survival (OS) using 28 cancer types (TCGA IlluminaHiSeq_RNASeqV2, pan-cancer normalized log2(norm_counts+1) data, version 2016-08-16) (TCGA clinicalMatrix, phenotype data, version 2016-04-27) * Click on the image enlarge it in a new window. |
 |
| Forest plot of Cox proportional hazard ratio (HR) and 95% CI of relapse free survival (RFS) using 28 cancer types (TCGA IlluminaHiSeq_RNASeqV2, pan-cancer normalized log2(norm_counts+1) data, version 2016-08-16) (TCGA clinicalMatrix, phenotype data, version 2016-04-27) * Click on the image enlarge it in a new window. |
 |
| Top |
| TissGeneClin for RAD51AP1 |
| TissGeneDrug for RAD51AP1 |
| Drug information targeting TissGene (DrugBank Version 5.0.6, 2017-04-01) |
| DrugBank ID | Drug name | Drug activity | Drug type | Drug status |
| Top |
| TissGeneDisease for RAD51AP1 |
| Disease information associated with TissGene (DisGeNet, 2016-06-01) |
| Disease ID | Disease name | # pubmeds | Source |
| umls:C0001973 | Alcoholic Intoxication, Chronic | 1 | GAD |
| umls:C0023418 | leukemia | 1 | BeFree |
| umls:C0206698 | Cholangiocarcinoma | 1 | LHGDN |
| umls:C0334634 | Malignant lymphoma, lymphocytic, intermediate differentiation, diffuse | 1 | BeFree |
| umls:C0345905 | Intrahepatic Cholangiocarcinoma | 1 | BeFree |
| umls:C0855095 | Small Lymphocytic Lymphoma | 1 | BeFree |
| umls:C1332225 | Aggressive Non-Hodgkin Lymphoma | 1 | BeFree |
|
Copyright 2016-Present - The University of Texas Health Science Center at Houston (UTHealth) Web File Viewing | How to Report, Fraud, Waste and Abuse | State of Texas | Statewide Search | Texas Homeland Security | Site Policies |