 |
| |
| |
| |
| |
| |
| |
|

| TissGeneSummary for LEFTY1 |
 Gene summary Gene summary |
| Basic gene information | Gene symbol | LEFTY1 |
| Gene name | left-right determination factor 1 | |
| Synonyms | LEFTB|LEFTYB | |
| Cytomap | UCSC genome browser: 1q42.1 | |
| Type of gene | protein-coding | |
| RefGenes | NM_020997.3, | |
| Description | left-right determination factor Bleft-right determination, factor Bprotein lefty-1protein lefty-B | |
| Modification date | 20141207 | |
| dbXrefs | MIM : 603037 | |
| HGNC : HGNC | ||
| Ensembl : ENSG00000243709 | ||
| HPRD : 09116 | ||
| Vega : OTTHUMG00000037443 | ||
| Protein | UniProt: go to UniProt's Cross Reference DB Table | |
| Expression | CleanEX: HS_LEFTY1 | |
| BioGPS: 10637 | ||
| Pathway | NCI Pathway Interaction Database: LEFTY1 | |
| KEGG: LEFTY1 | ||
| REACTOME: LEFTY1 | ||
| Pathway Commons: LEFTY1 | ||
| Context | iHOP: LEFTY1 | |
| ligand binding site mutation search in PubMed: LEFTY1 | ||
| UCL Cancer Institute: LEFTY1 | ||
| Assigned class in TissGDB* | C | |
| Included tissue-specific gene expression resources | TiGER,GTEx | |
| Specific-tissues in normal samples (assigned by TissGDB using HPA, TiGER, and GTEx) | ColonPancreas | |
| Cancer types related to the specific-tissues in cancer samples (assigned by TissGDB using TCGA) | COADPAAD | |
| Reference showing the relevant tissue of LEFTY1 | ||
| Description by TissGene annotations | ||
| * Class A consists of genes with literature evidence and is part of the cTissGenes. Class B consists of only cTissGenes without additional evidence. The remaining genes belong to Class C. |
| Gene ontology having evidence of Inferred from Direct Assay (IDA) from Entrez |
| GO ID | GO term | PubMed ID |
| Top |
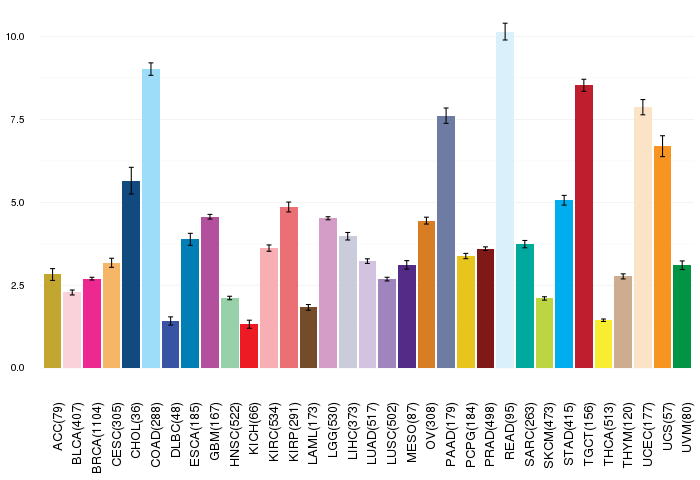
| TissGeneExp for LEFTY1 |
| Gene expressions across 28 cancer types (X-axis: cancer type and Y-axis: log2(norm_counts+1)) (TCGA IlluminaHiSeq_RNASeqV2, pan-cancer normalized log2(norm_counts+1) data, version 2016-08-16) |
 |
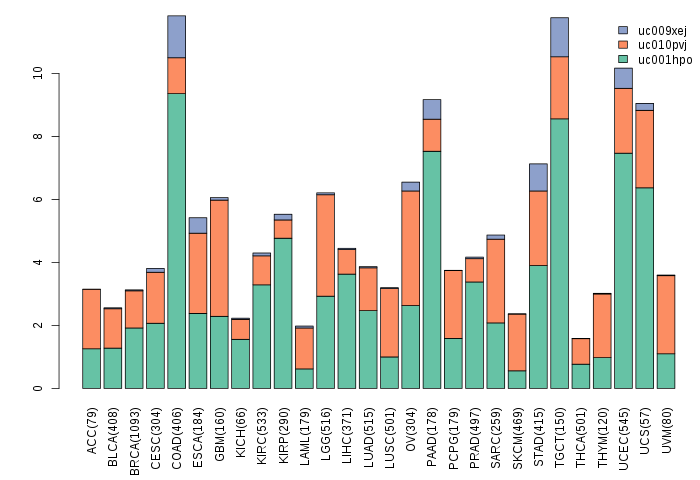
| Gene isoform expressions across 28 cancer types (X-axis: cancer type and Y-axis: log2(norm_counts+1)) (TCGA pan-cancer tcga_rsem_isoform_tpm, version 2016-09-01) |
 |
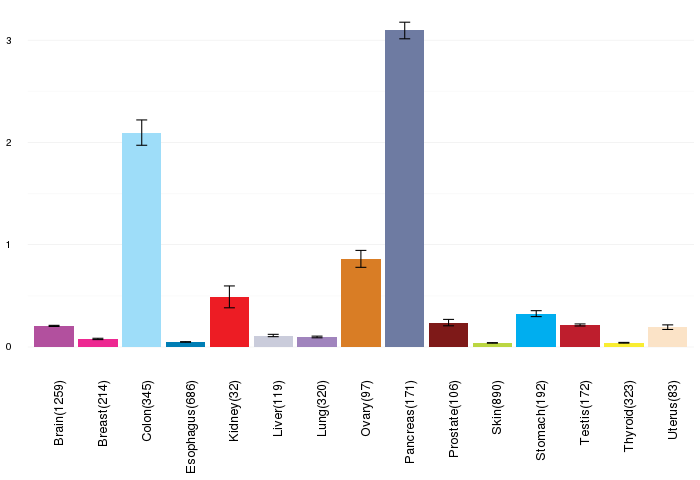
| Gene expressions across normal tissues of GTEx data (GTEx GTEx_Analysis_v6_RNA-seq_RNA-SeQCv1.1.8_gene_rpkm.gct) - Here, we shows the matched tissue types only among our 28 cancer types. |
 |
| Different expressions across 14 cancer types with more than 10 samples between matched tumors and normals (X-axis: cancer type and Y-axis: log2(norm_counts+1)) (TCGA IlluminaHiSeq_RNASeqV2, pan-cancer normalized log2(norm_counts+1) data, version 2016-08-16) |
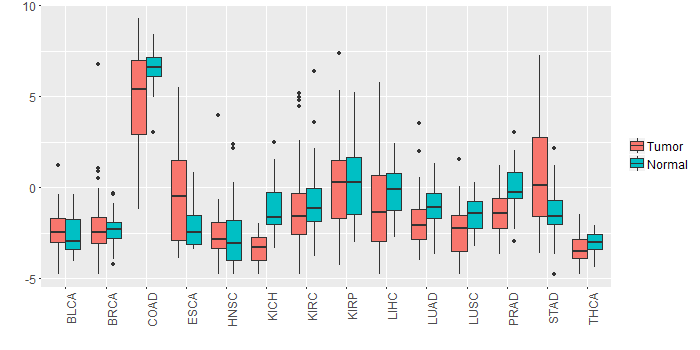 |
| - Significantly differentially expressed cancer types and information. (|Fold change|>1 and FDR<0.05) |
| Cancer type | Mean(exp) in tumor | Mean(exp) in matched normal | Log2FC | P-val. | FDR |
| KICH | -3.390874987 | -1.052286987 | -2.338588 | 1.24E-07 | 5.60E-07 |
| PRAD | -1.335228679 | -0.079267141 | -1.255961538 | 3.47E-07 | 2.77E-06 |
| COAD | 4.796721321 | 6.538309782 | -1.741588462 | 0.00876 | 0.019665123 |
| STAD | 0.747100888 | -1.492327237 | 2.239428125 | 2.00E-04 | 0.001388272 |
| Top |
| TissGene-miRNA for LEFTY1 |
| Significantly anti-correlated miRNAs of TissGene across 28 cancer types (Gene-miRNA relations from TargetScanHuman Relsease 7.1, Conserved_Site_Context_Scores.txt.zip, 06.01.2016) (TCGA IlluminaHiSeq_miRNASeq, log2(RPM+1) data, version 2016-11-21) (TCGA IlluminaHiSeq_RNASeqV2, log2(normalized_count+1) data, version 2016-08-16) (Spearman’s Rank Correlation (p-value<0.05 and coefficient<-0.25)) |
| Cancer type | miRNA id | miRNA accession | P-val. | Coeff. | # samples |
| Top |
| TissGeneMut for LEFTY1 |
| TissGeneSNV for LEFTY1 |
| nsSNV counts per each loci. Different colors of circles represent different cancer types. Circle size denotes number of samples. (TCGA somatic mutation (SNPs and small INDELs) data, version 2016-04-25) * Click on the image to enlarge it in a new window. |
 |
 |
| Somatic nucleotide variants of TissGene across 28 cancer types (X-axis: cancer type and Y-axis: % of mutated samples) The numbers in parentheses are numbers of samples with mutation (nsSNVs). (TCGA somatic mutation (SNPs and small INDELs) data, version 2016-04-25) |
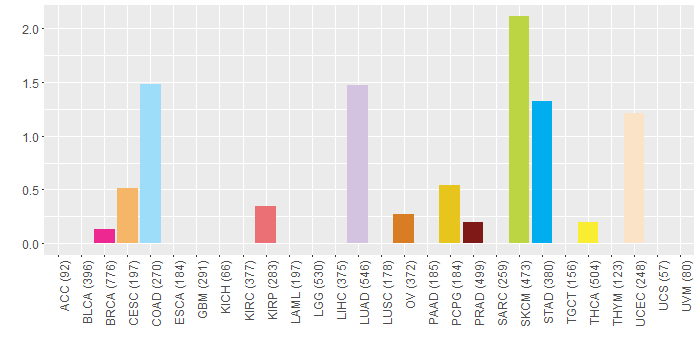 |
| - nsSNVs sorted by frequency. |
| AAchange | Cancer type | # samples |
| p.D322A | COAD | 2 |
| p.P54T | LUAD | 1 |
| p.Q60K | OV | 1 |
| p.R220C | SKCM | 1 |
| p.W281S | COAD | 1 |
| p.T42P | SKCM | 1 |
| p.V328I | UCEC | 1 |
| p.G75R | SKCM | 1 |
| p.P193S | SKCM | 1 |
| p.E236V | SKCM | 1 |
| p.R33Q | BRCA | 1 |
| p.P286S | SKCM | 1 |
| p.P309L | LUAD | 1 |
| p.E172* | THCA | 1 |
| p.D179N | STAD | 1 |
| p.R126C | STAD | 1 |
| p.R83* | SKCM | 1 |
| p.A318T | UCEC | 1 |
| p.S73C | HNSC | 1 |
| p.V52F | LUAD | 1 |
| p.A177D | KIRP | 1 |
| p.R194W | HNSC | 1 |
| p.E50K | LUAD | 1 |
| p.L218V | LUAD | 1 |
| p.A113V | LUAD | 1 |
| p.P256L | SKCM | 1 |
| p.P286L | STAD | 1 |
| p.V180M | STAD | 1 |
| p.R33Q | PCPG | 1 |
| p.S223L | SKCM | 1 |
| p.A278T | SKCM | 1 |
| p.H62N | LUAD | 1 |
| p.Q134H | STAD | 1 |
| p.V57M | DLBC | 1 |
| p.G229R | UCEC | 1 |
| p.H97Y | PRAD | 1 |
| p.E172K | LUAD | 1 |
| p.R74H | COAD | 1 |
| p.R298Q | DLBC | 1 |
| p.E172D | CESC | 1 |
| Top |
| TissGeneCNV for LEFTY1 |
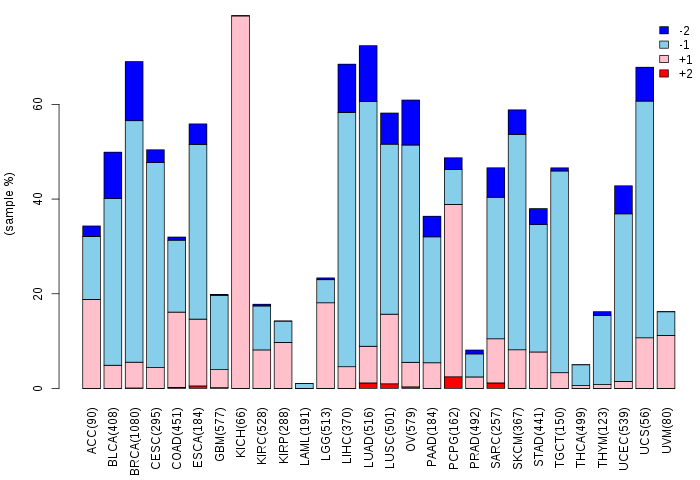
| Copy number variations of TissGene across 28 cancer types (X-axis: cancer type and Y-axis: % of CNV samples) (TCGA Gistic2_CopyNumber_Gistic2_all_data_by_genes, Gistic2 copy number data, version 2016-08-16) |
 |
| Top |
| TissGeneFusions for LEFTY1 |
| Fusion genes including TissGene (ChimerDB 3.0, 2016-12-01 and TCGA fusion Portal 2015-12-01) |
| Database | Src | Cancer type | Sample | Fusion gene | ORF | 5'-gene BP | 3'-gene BP |
| Chimerdb3.0 | ChiTaRs | NA | AF087859 | LEFTY1-INS-IGF2 | chr1:226111959 | chr11:2153805 | |
| Chimerdb3.0 | ChiTaRs | NA | AJ572531 | LEFTY1-TNNI1 | chr1:226107972 | chr1:201378010 |
| Top |
| TissGeneNet for LEFTY1 |
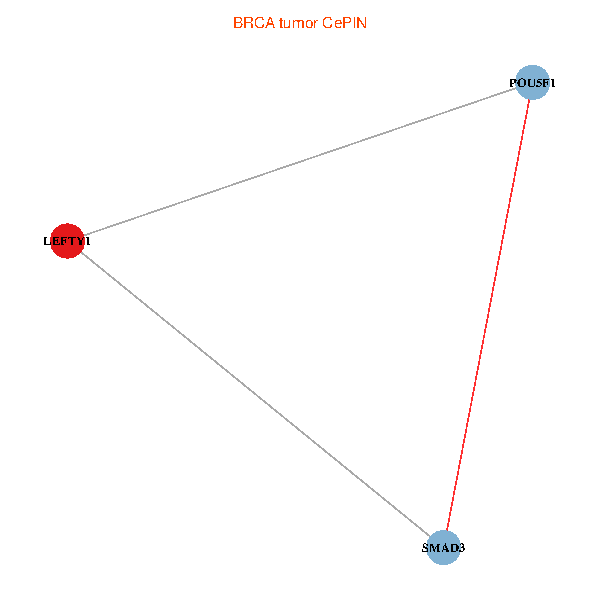
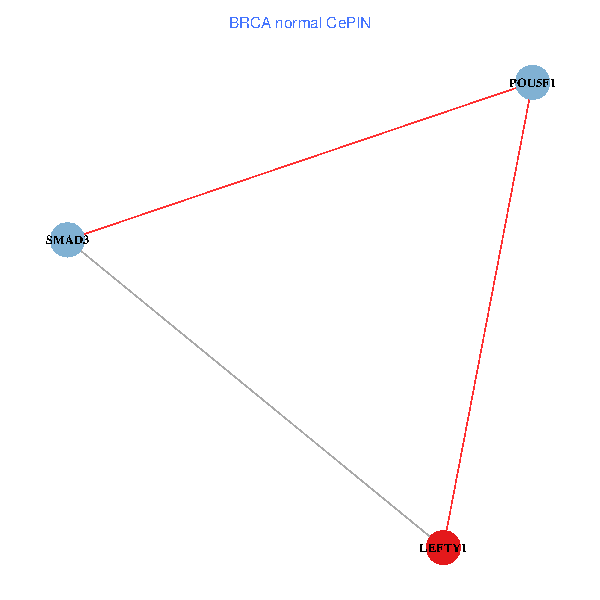
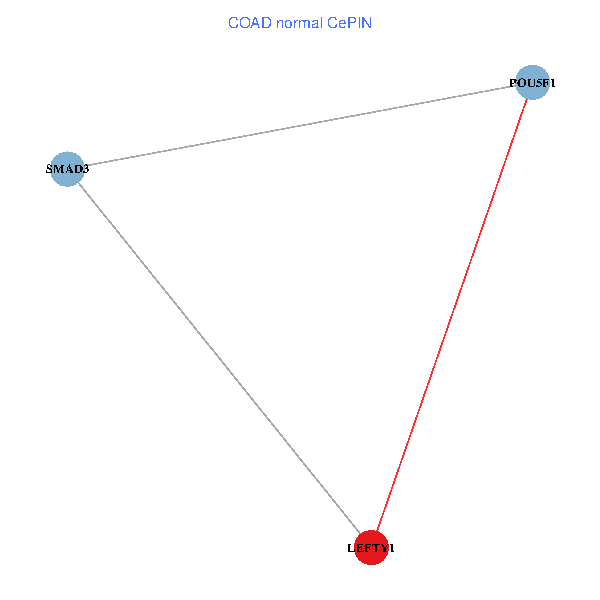
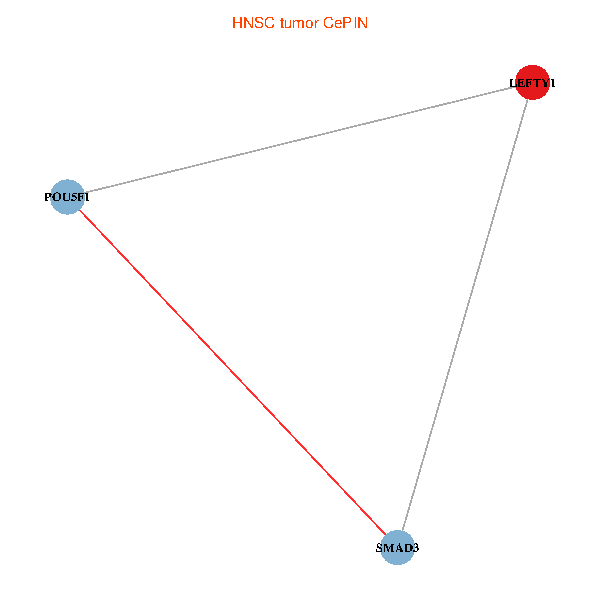
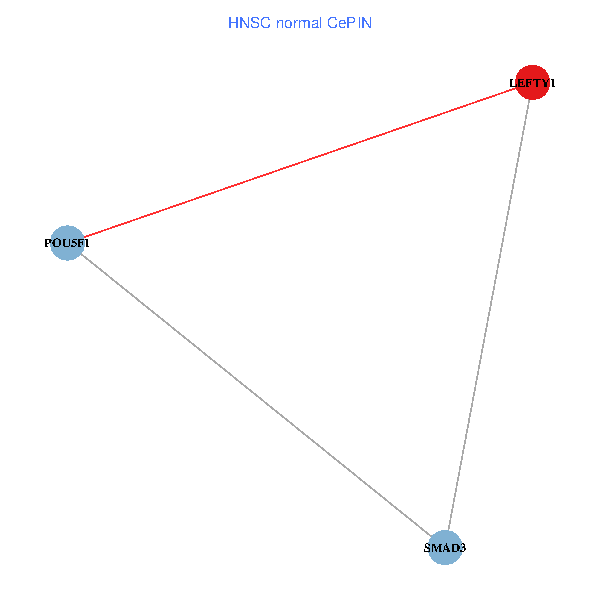
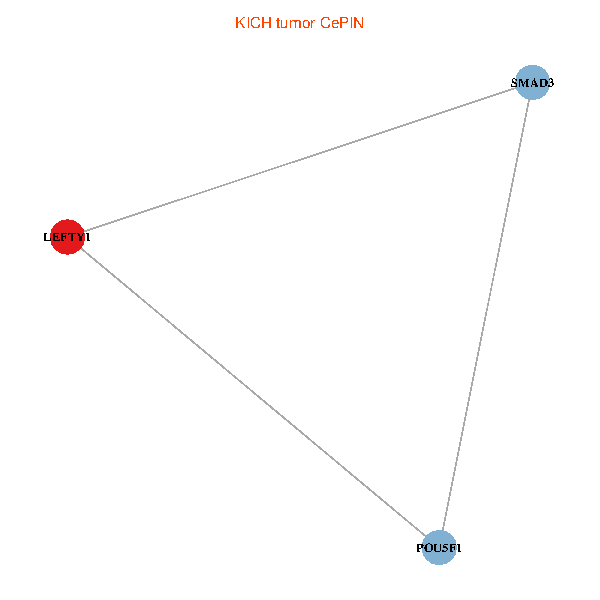
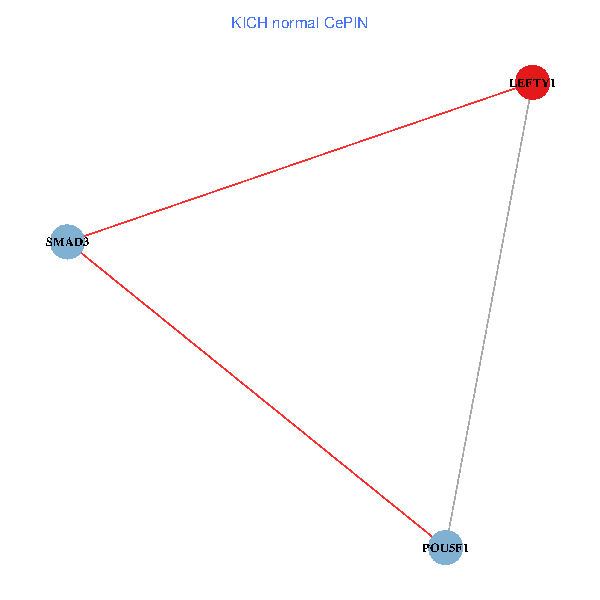
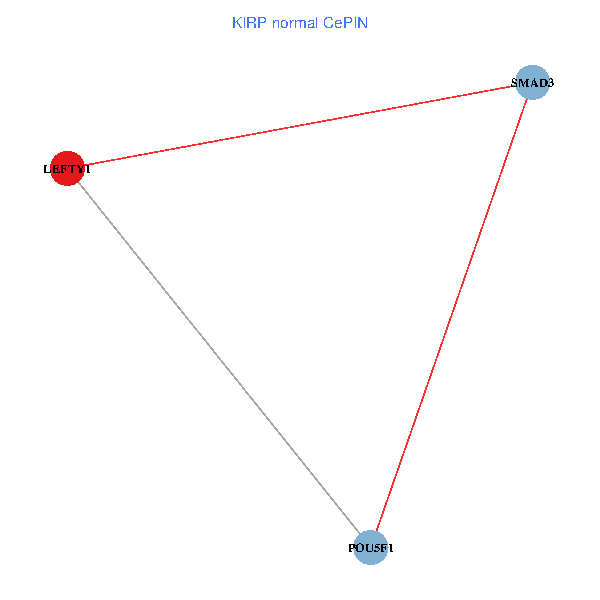
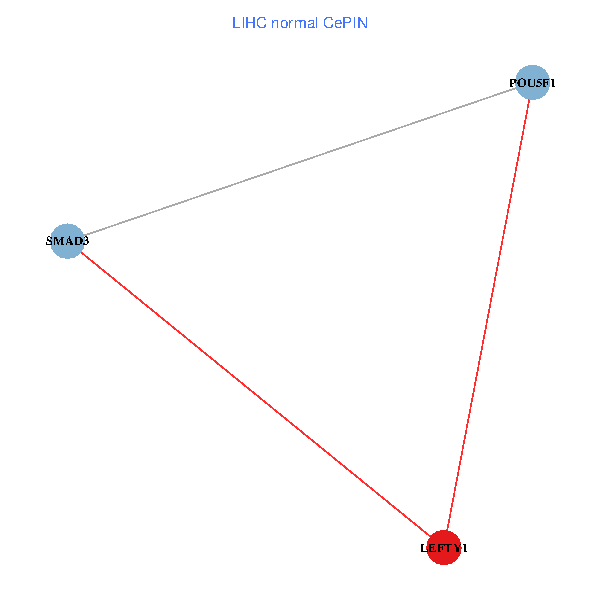
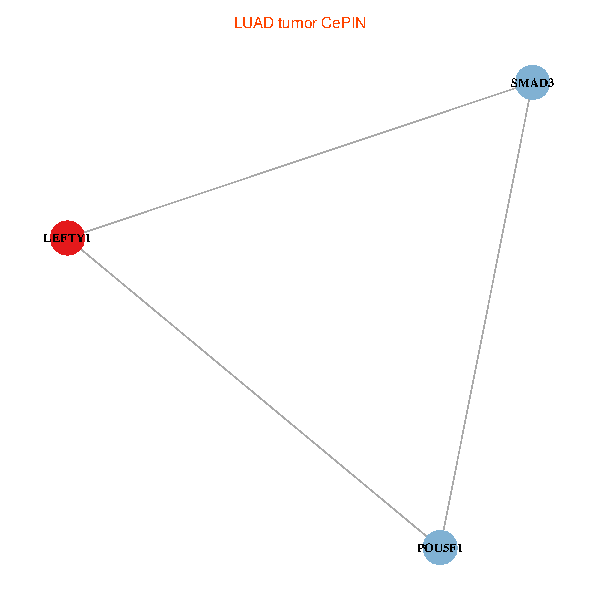
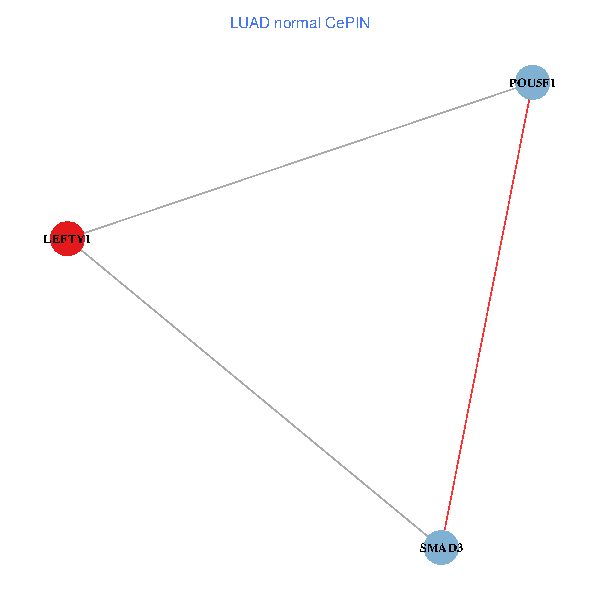
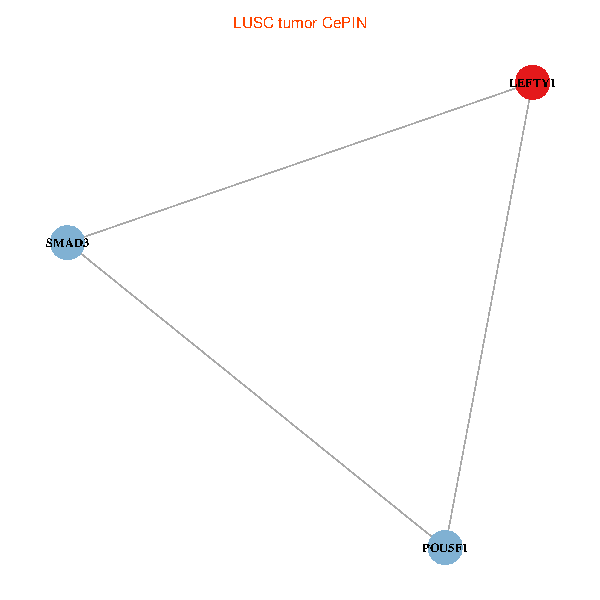
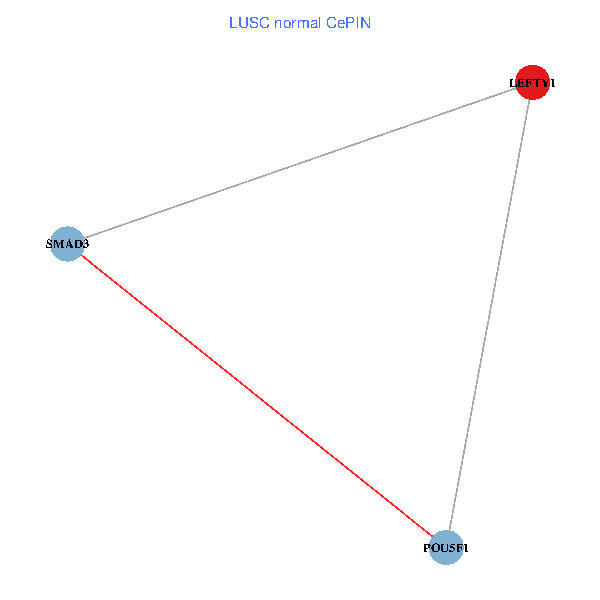
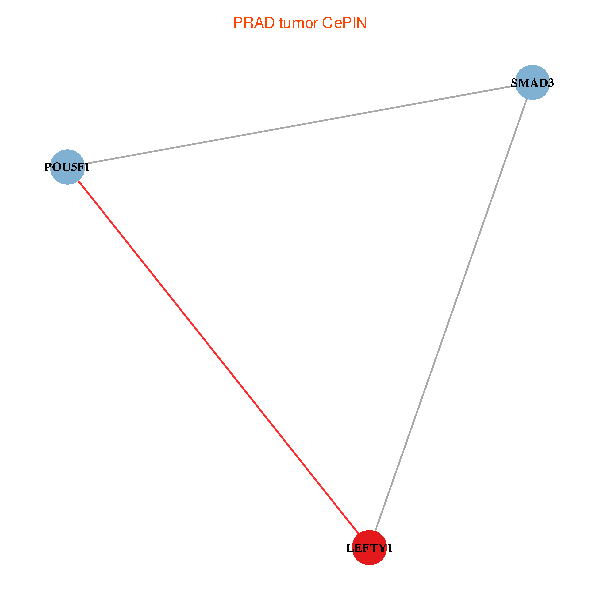
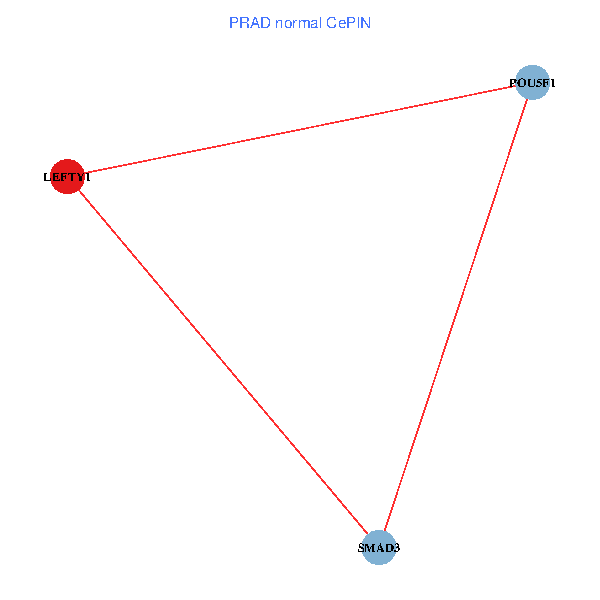
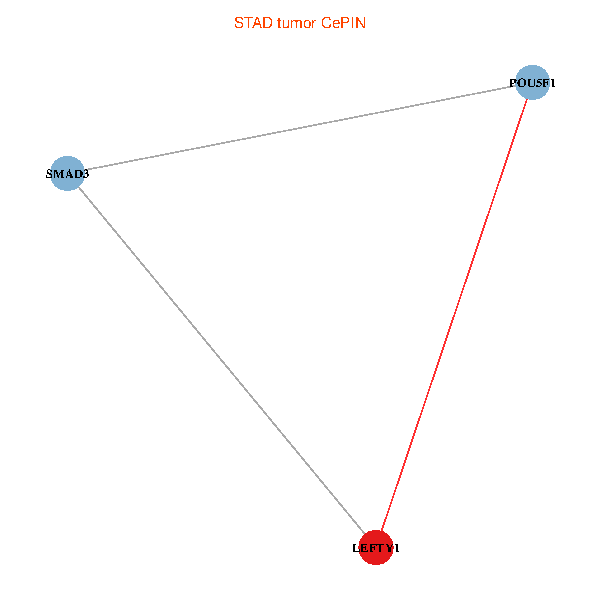
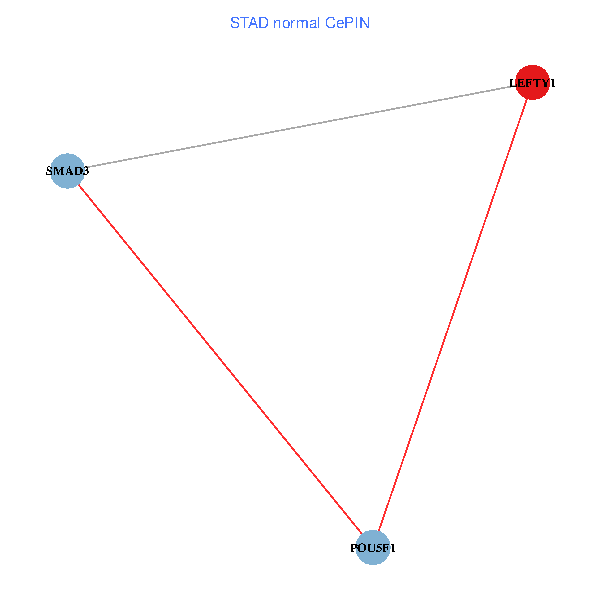
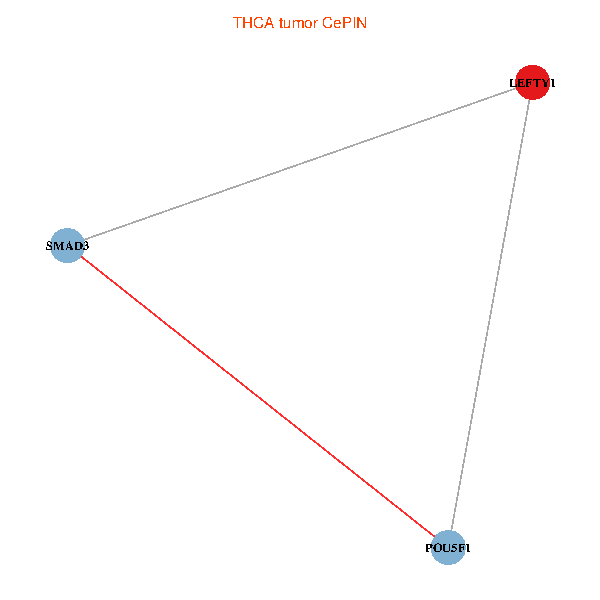
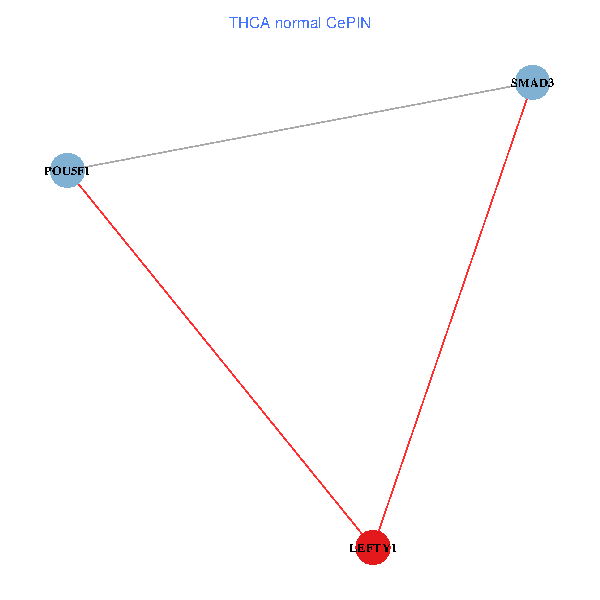
| Co-expressed gene networks based on protein-protein interaction data (CePIN) (TCGA IlluminaHiSeq_RNASeqV2, pan-cancer normalized log2(norm_counts+1) data, version 2016-08-16) (PINA2 ppi data) |
| BRCA (tumor) | BRCA (normal) |
| LEFTY1, SMAD3, POU5F1 (tumor) | LEFTY1, SMAD3, POU5F1 (normal) |
 |  |
| COAD (tumor) | COAD (normal) |
| LEFTY1, SMAD3, POU5F1 (tumor) | LEFTY1, SMAD3, POU5F1 (normal) |
 |  |
| HNSC (tumor) | HNSC (normal) |
| LEFTY1, SMAD3, POU5F1 (tumor) | LEFTY1, SMAD3, POU5F1 (normal) |
 |  |
| KICH (tumor) | KICH (normal) |
| LEFTY1, SMAD3, POU5F1 (tumor) | LEFTY1, SMAD3, POU5F1 (normal) |
 |  |
| KIRC (tumor) | KIRC (normal) |
| LEFTY1, SMAD3, POU5F1 (tumor) | LEFTY1, SMAD3, POU5F1 (normal) |
 |  |
| KIRP (tumor) | KIRP (normal) |
| LEFTY1, SMAD3, POU5F1 (tumor) | LEFTY1, SMAD3, POU5F1 (normal) |
 |  |
| LIHC (tumor) | LIHC (normal) |
| LEFTY1, SMAD3, POU5F1 (tumor) | LEFTY1, SMAD3, POU5F1 (normal) |
 |  |
| LUAD (tumor) | LUAD (normal) |
| LEFTY1, SMAD3, POU5F1 (tumor) | LEFTY1, SMAD3, POU5F1 (normal) |
 |  |
| LUSC (tumor) | LUSC (normal) |
| LEFTY1, SMAD3, POU5F1 (tumor) | LEFTY1, SMAD3, POU5F1 (normal) |
 |  |
| PRAD (tumor) | PRAD (normal) |
| LEFTY1, SMAD3, POU5F1 (tumor) | LEFTY1, SMAD3, POU5F1 (normal) |
 |  |
| STAD (tumor) | STAD (normal) |
| LEFTY1, SMAD3, POU5F1 (tumor) | LEFTY1, SMAD3, POU5F1 (normal) |
 |  |
| THCA (tumor) | THCA (normal) |
| LEFTY1, SMAD3, POU5F1 (tumor) | LEFTY1, SMAD3, POU5F1 (normal) |
 |  |
| Top |
| TissGeneProg for LEFTY1 |
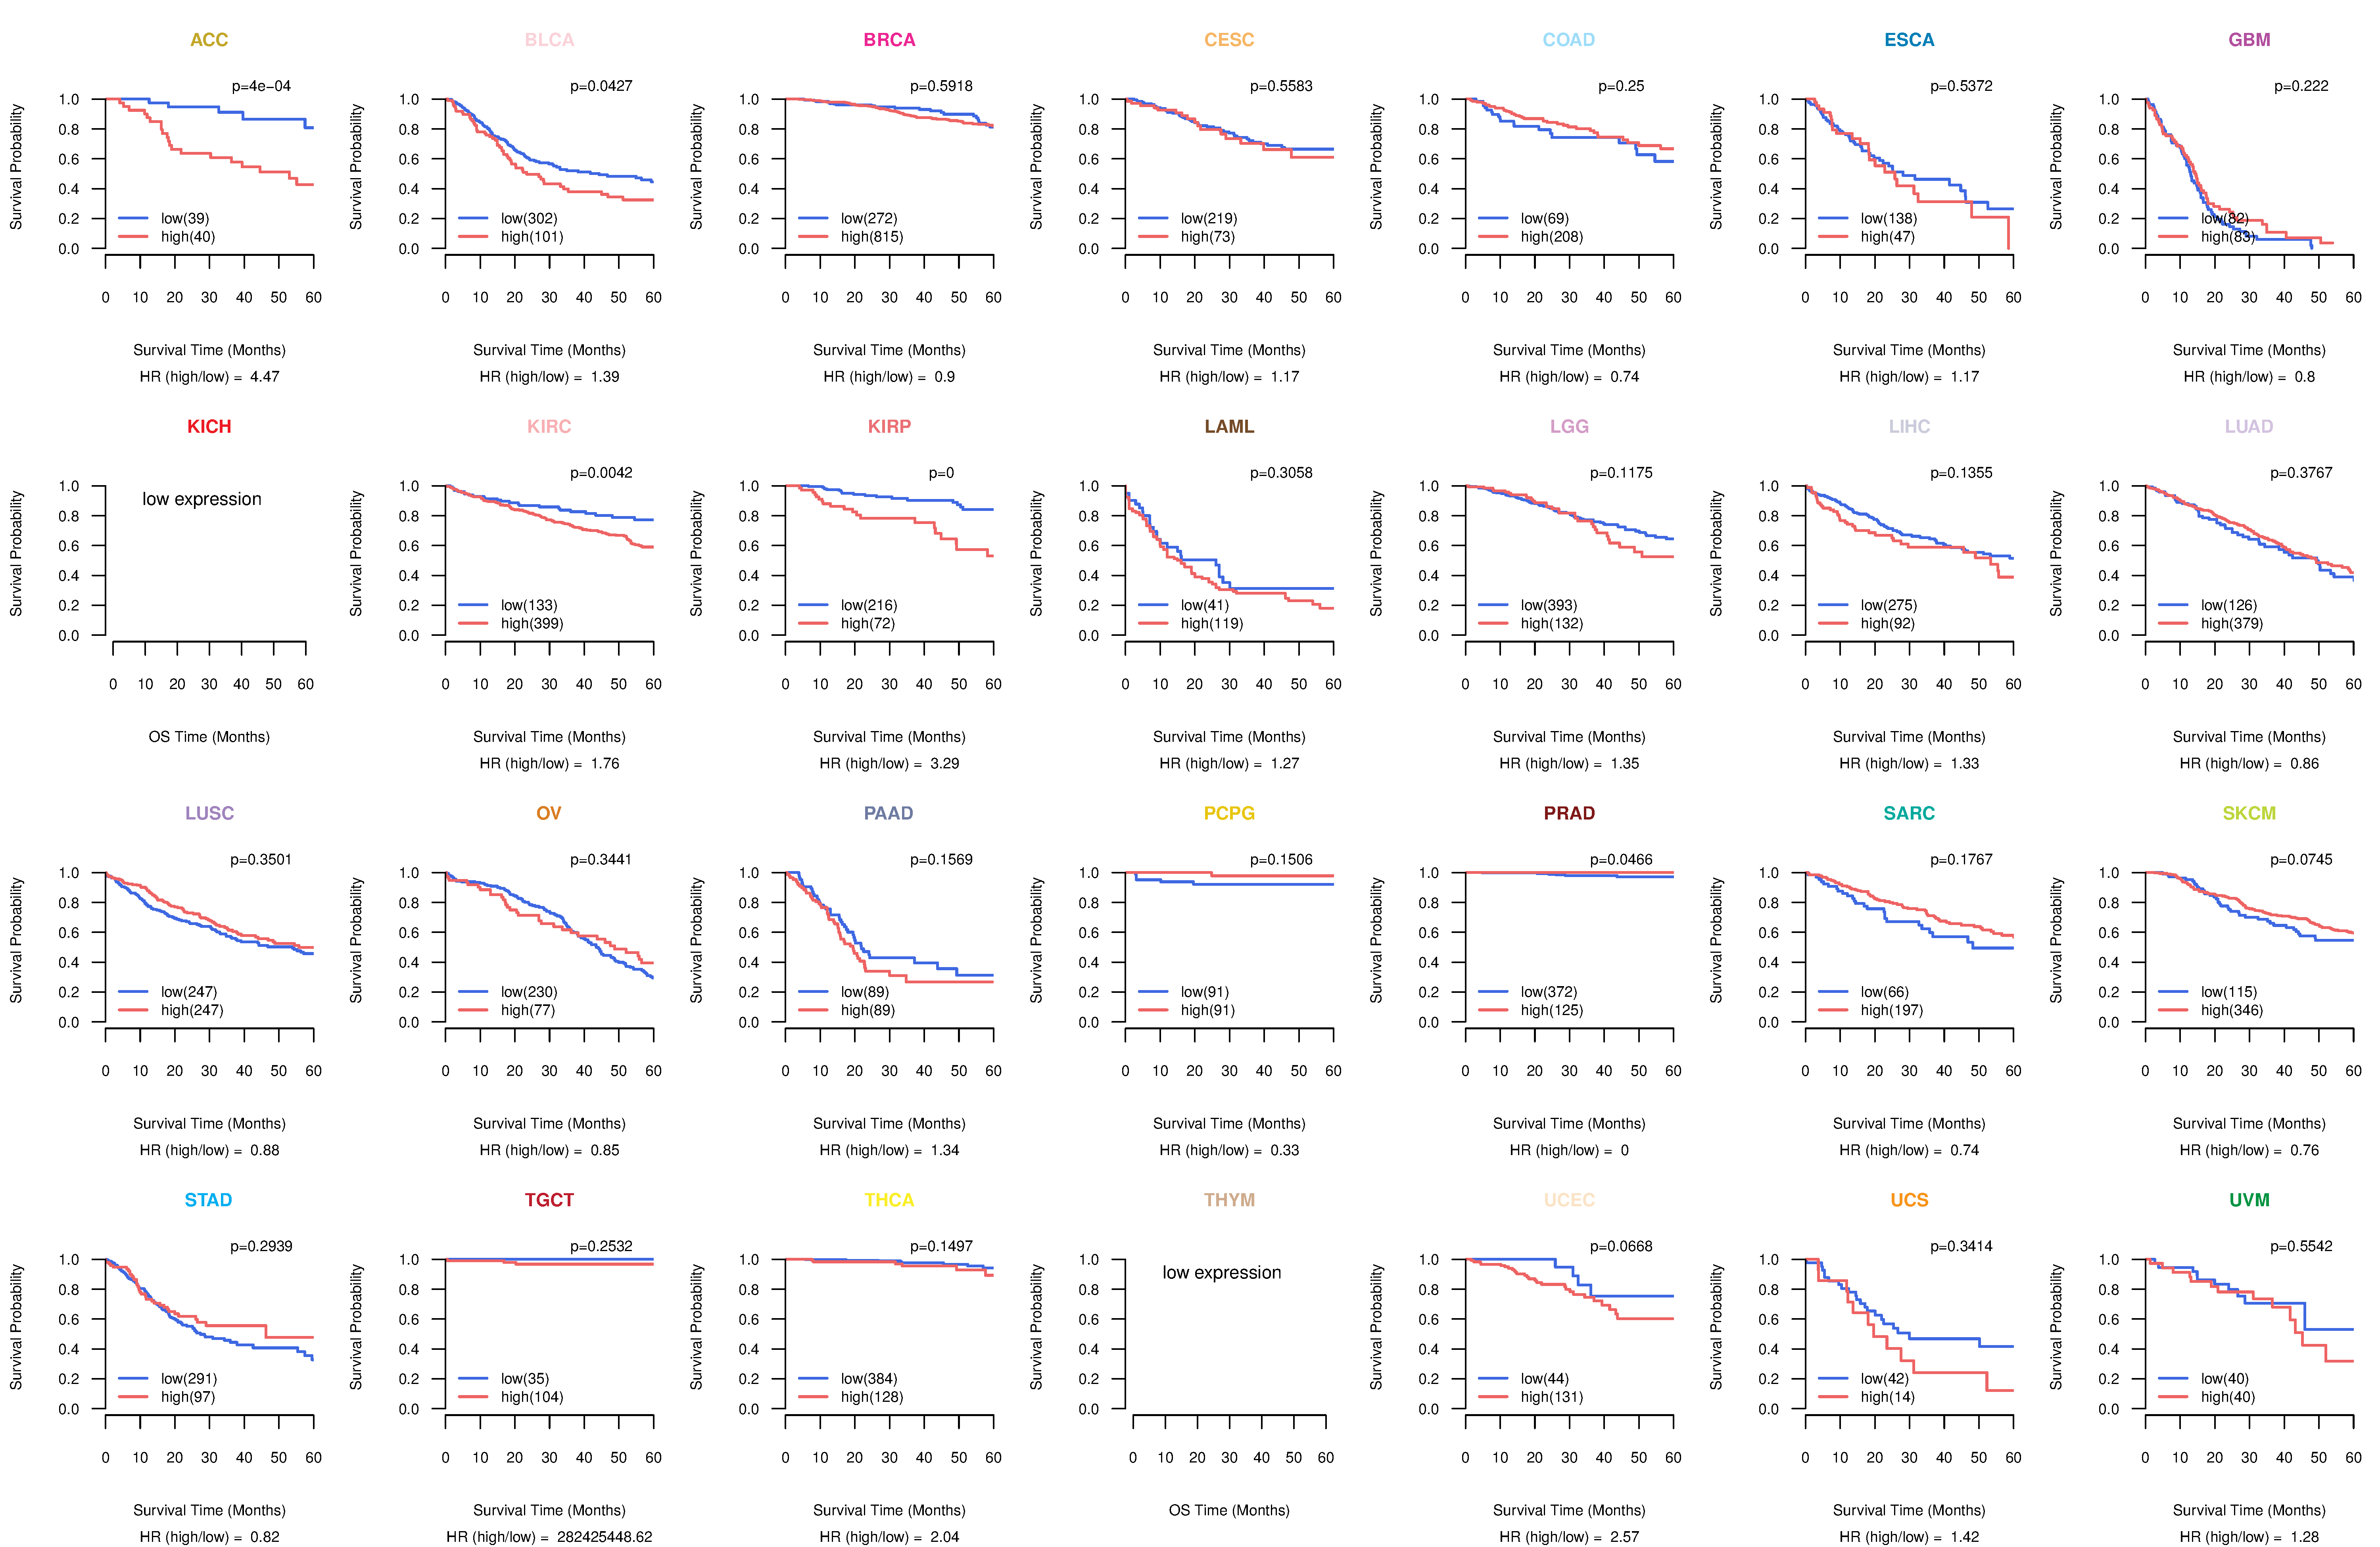
| Kaplan-Meier plots with logrank tests of overall survival (OS) using 28 cancer types (TCGA IlluminaHiSeq_RNASeqV2, pan-cancer normalized log2(norm_counts+1) data, version 2016-08-16) (TCGA clinicalMatrix, phenotype data, version 2016-04-27) * Click on the image to enlarge it in a new window. |
 |
| Kaplan-Meier plots with logrank test of relapse free survival (RFS) using 28 cancer types (TCGA IlluminaHiSeq_RNASeqV2, pan-cancer normalized log2(norm_counts+1) data, version 2016-08-16) (TCGA clinicalMatrix, phenotype data, version 2016-04-27) * Click on the image enlarge it in a new window. |
 |
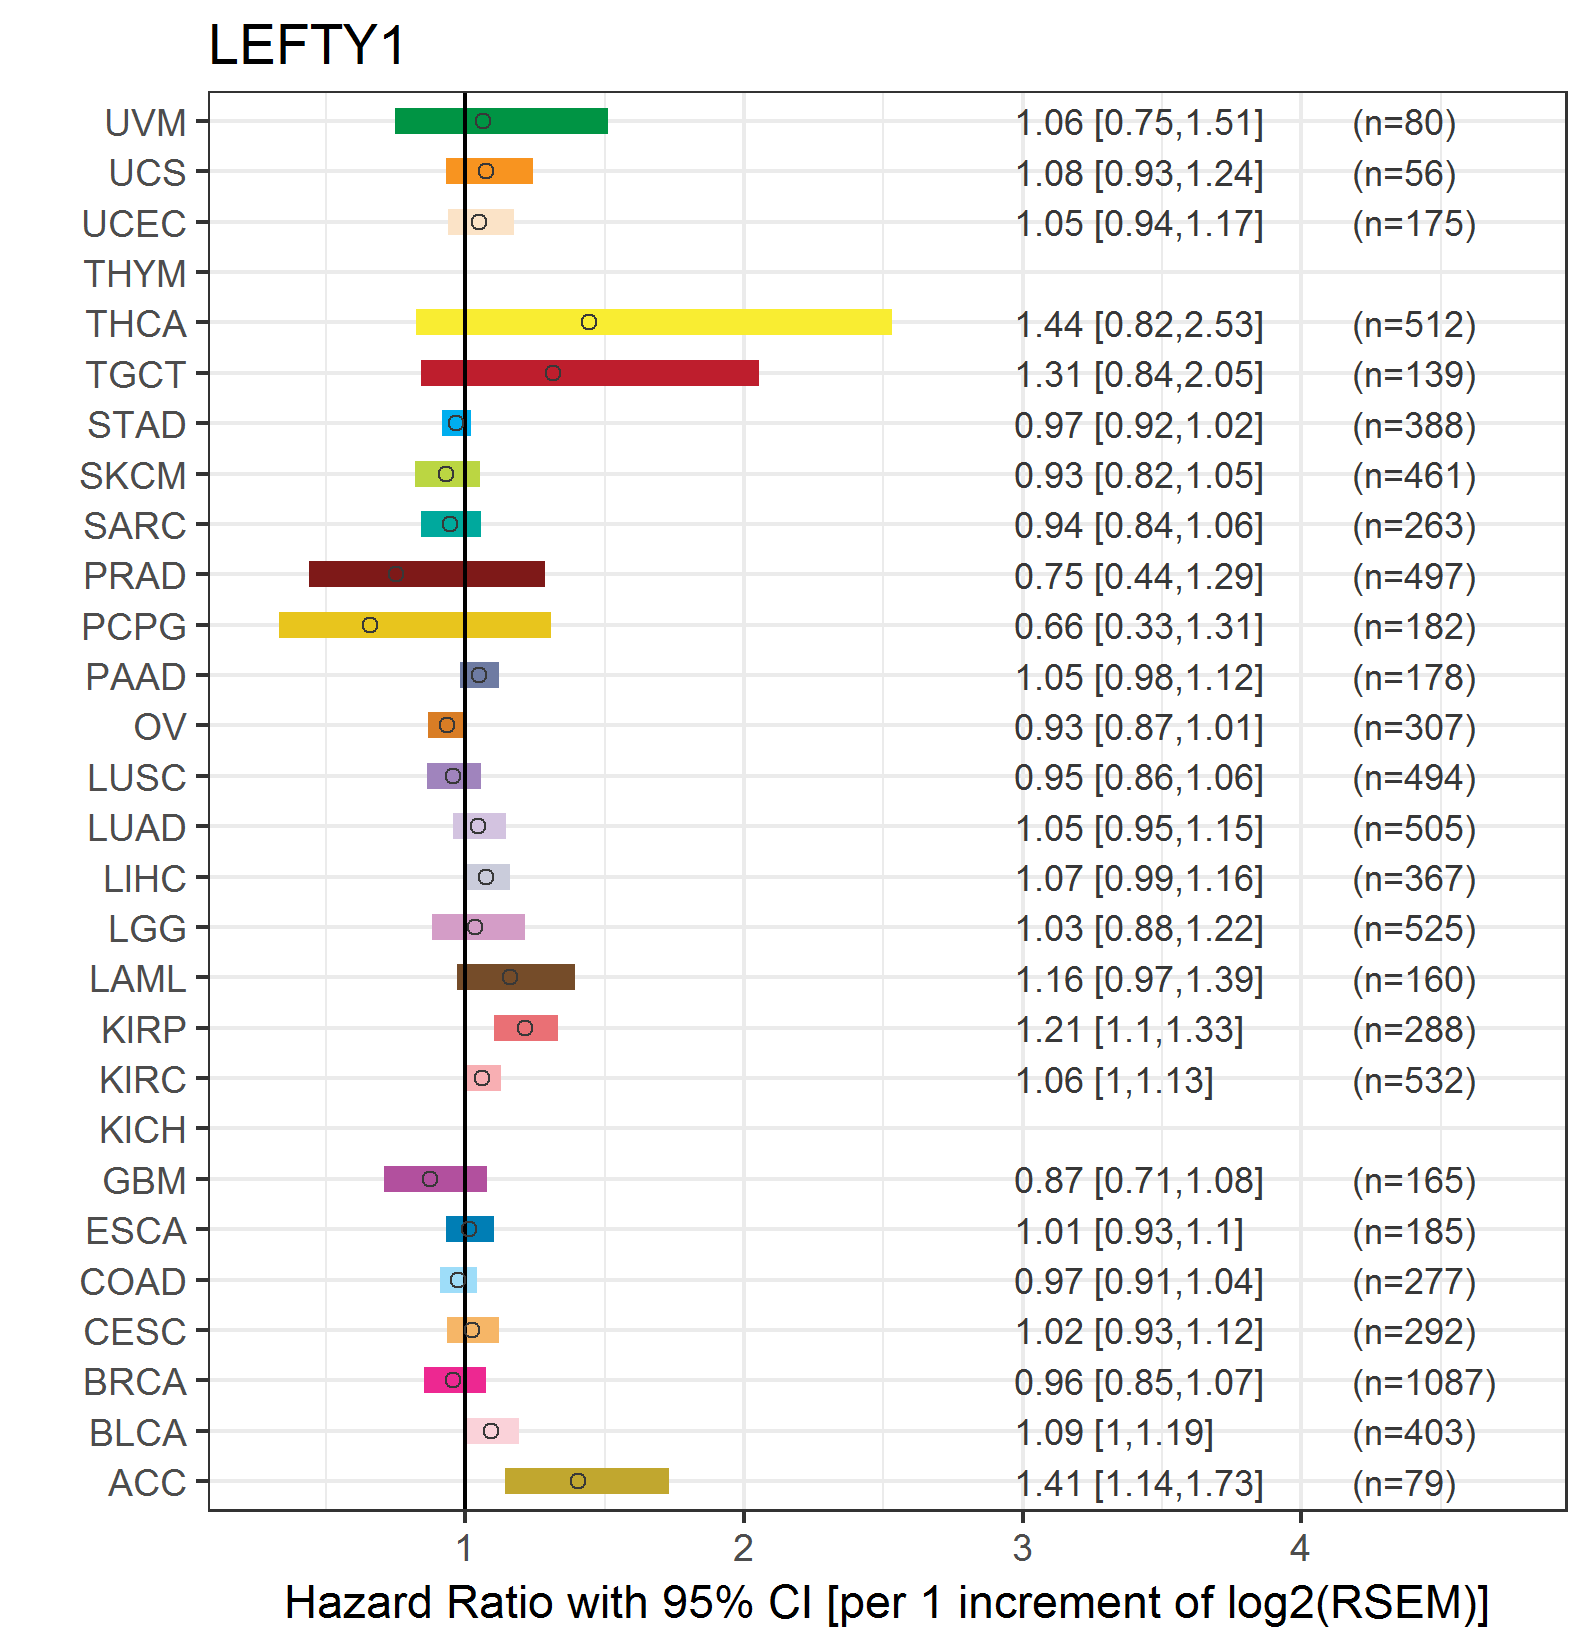
| Forest plot of Cox proportional hazard ratio (HR) and 95% CI of overall survival (OS) using 28 cancer types (TCGA IlluminaHiSeq_RNASeqV2, pan-cancer normalized log2(norm_counts+1) data, version 2016-08-16) (TCGA clinicalMatrix, phenotype data, version 2016-04-27) * Click on the image enlarge it in a new window. |
 |
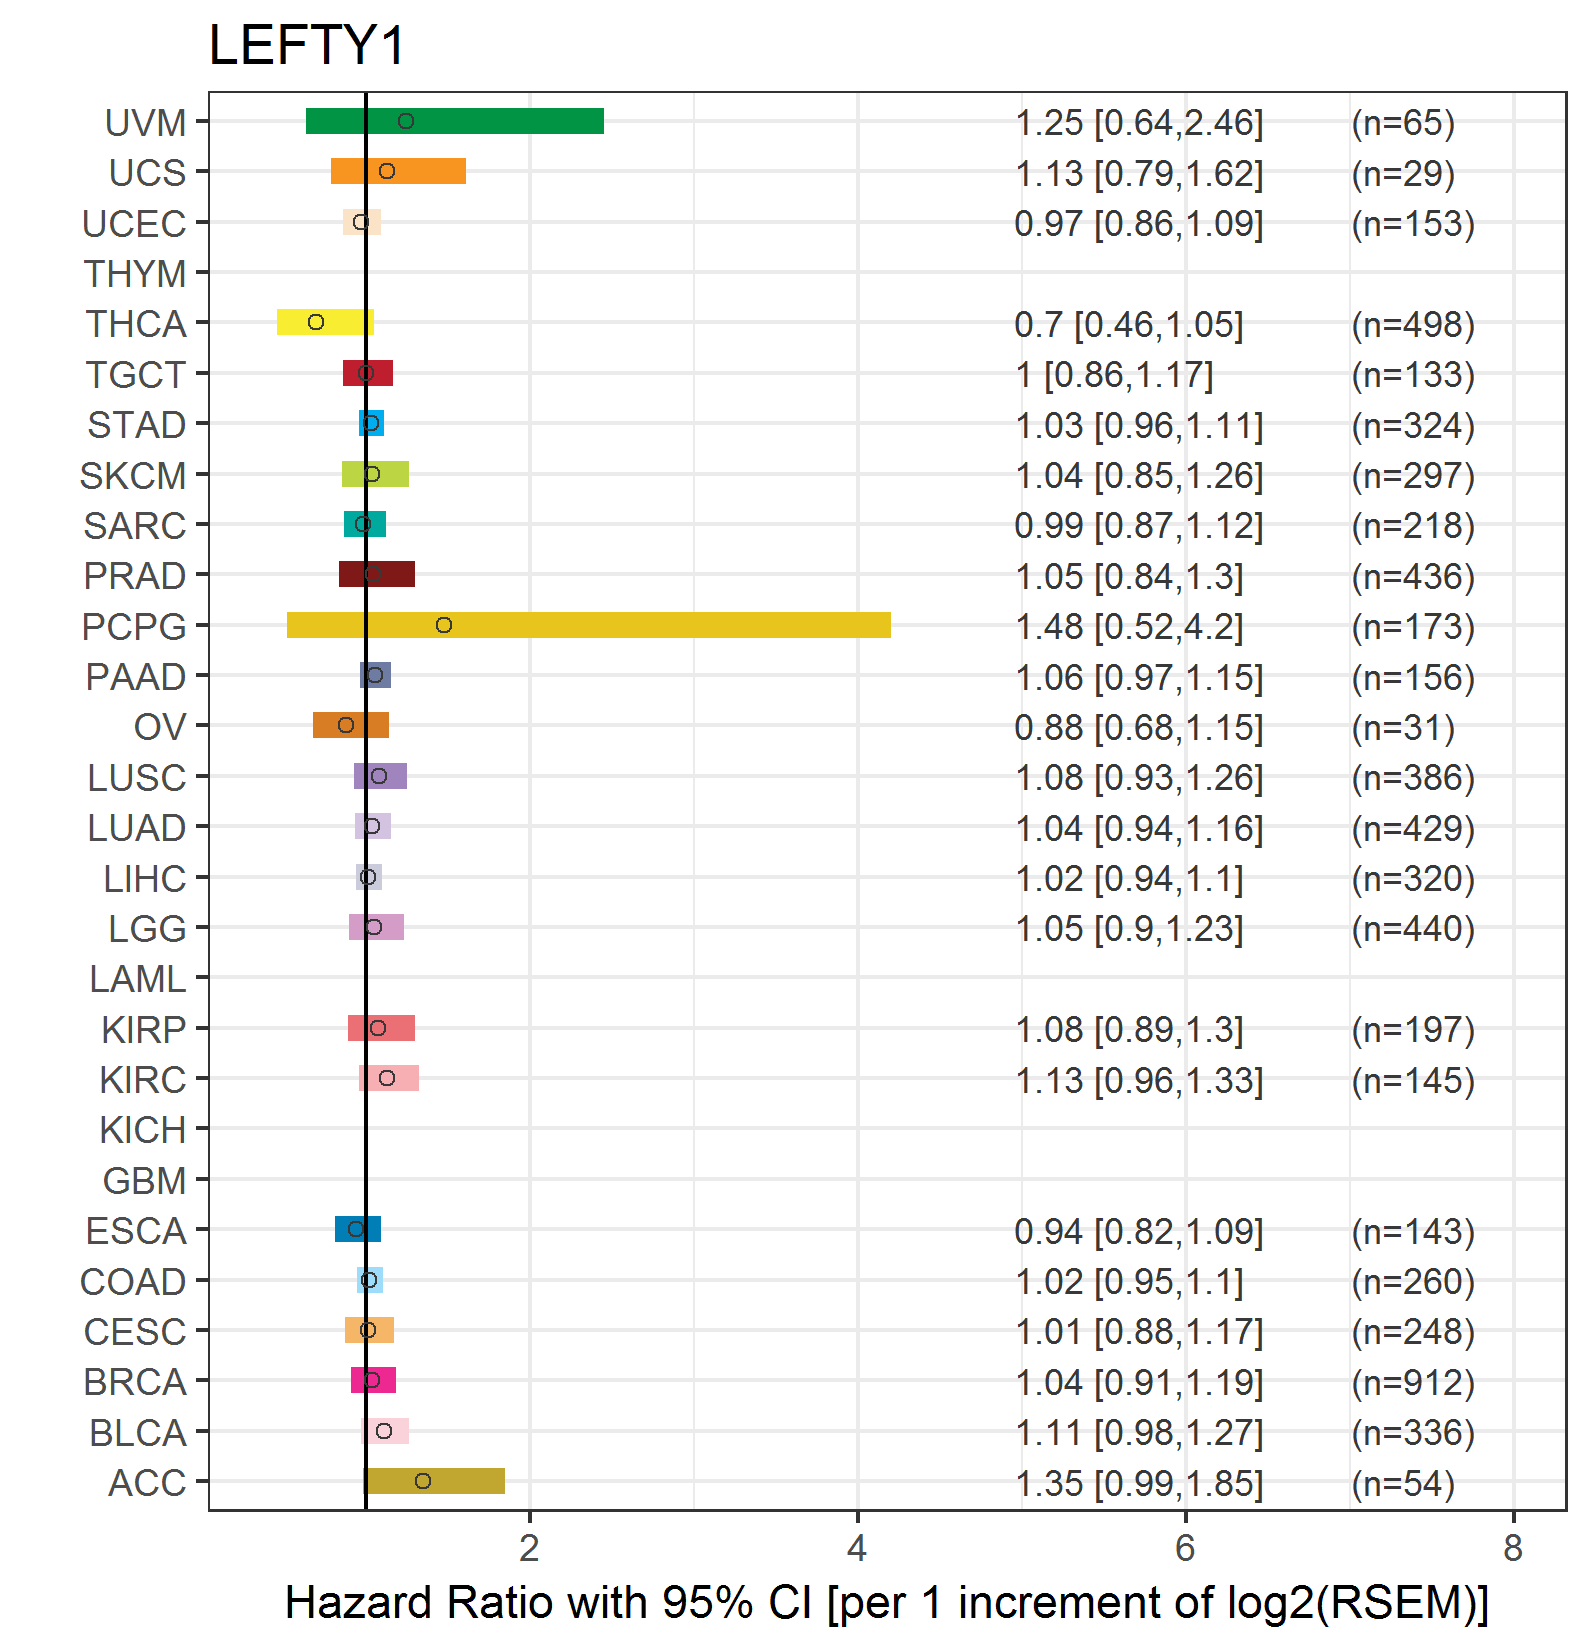
| Forest plot of Cox proportional hazard ratio (HR) and 95% CI of relapse free survival (RFS) using 28 cancer types (TCGA IlluminaHiSeq_RNASeqV2, pan-cancer normalized log2(norm_counts+1) data, version 2016-08-16) (TCGA clinicalMatrix, phenotype data, version 2016-04-27) * Click on the image enlarge it in a new window. |
 |
| Top |
| TissGeneClin for LEFTY1 |
| TissGeneDrug for LEFTY1 |
| Drug information targeting TissGene (DrugBank Version 5.0.6, 2017-04-01) |
| DrugBank ID | Drug name | Drug activity | Drug type | Drug status |
| Top |
| TissGeneDisease for LEFTY1 |
| Disease information associated with TissGene (DisGeNet, 2016-06-01) |
| Disease ID | Disease name | # pubmeds | Source |
| umls:C0010068 | Coronary heart disease | 1 | BeFree |
| umls:C1260899 | Anemia, Diamond-Blackfan | 1 | BeFree |
| umls:C1458155 | Mammary Neoplasms | 1 | BeFree |
|
Copyright 2016-Present - The University of Texas Health Science Center at Houston (UTHealth) Web File Viewing | How to Report, Fraud, Waste and Abuse | State of Texas | Statewide Search | Texas Homeland Security | Site Policies |