 |
| |
| |
| |
| |
| |
| |
|

| TissGeneSummary for DMRT2 |
 Gene summary Gene summary |
| Basic gene information | Gene symbol | DMRT2 |
| Gene name | doublesex and mab-3 related transcription factor 2 | |
| Synonyms | - | |
| Cytomap | UCSC genome browser: 9p24.3 | |
| Type of gene | protein-coding | |
| RefGenes | NM_001130865.2, NM_006557.6,NM_181872.4, | |
| Description | DSXL-2doublesex- and mab-3-related transcription factor 2doublesex-like 2 proteinterra-like protein | |
| Modification date | 20141207 | |
| dbXrefs | MIM : 604935 | |
| HGNC : HGNC | ||
| Ensembl : ENSG00000173253 | ||
| HPRD : 16079 | ||
| Vega : OTTHUMG00000019437 | ||
| Protein | UniProt: go to UniProt's Cross Reference DB Table | |
| Expression | CleanEX: HS_DMRT2 | |
| BioGPS: 10655 | ||
| Pathway | NCI Pathway Interaction Database: DMRT2 | |
| KEGG: DMRT2 | ||
| REACTOME: DMRT2 | ||
| Pathway Commons: DMRT2 | ||
| Context | iHOP: DMRT2 | |
| ligand binding site mutation search in PubMed: DMRT2 | ||
| UCL Cancer Institute: DMRT2 | ||
| Assigned class in TissGDB* | C | |
| Included tissue-specific gene expression resources | TiGER,GTEx | |
| Specific-tissues in normal samples (assigned by TissGDB using HPA, TiGER, and GTEx) | Kidney | |
| Cancer types related to the specific-tissues in cancer samples (assigned by TissGDB using TCGA) | KIRC,KIRP,KICH | |
| Reference showing the relevant tissue of DMRT2 | ||
| Description by TissGene annotations | Cancer gene Have significant anti-correlated miRNA | |
| * Class A consists of genes with literature evidence and is part of the cTissGenes. Class B consists of only cTissGenes without additional evidence. The remaining genes belong to Class C. |
| Gene ontology having evidence of Inferred from Direct Assay (IDA) from Entrez |
| GO ID | GO term | PubMed ID |
| Top |
| TissGeneExp for DMRT2 |
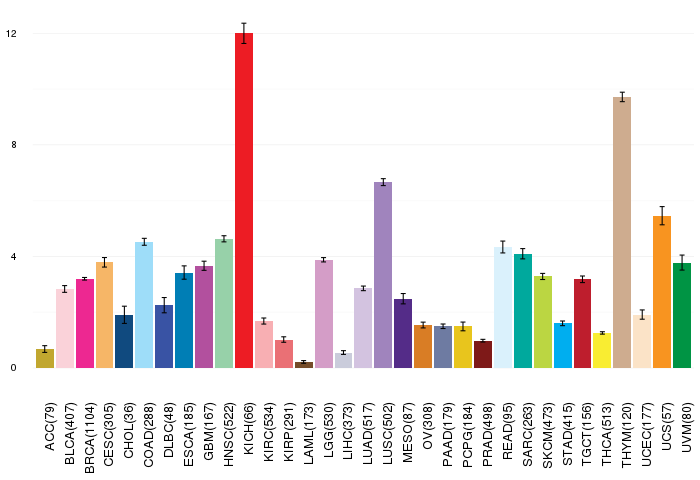
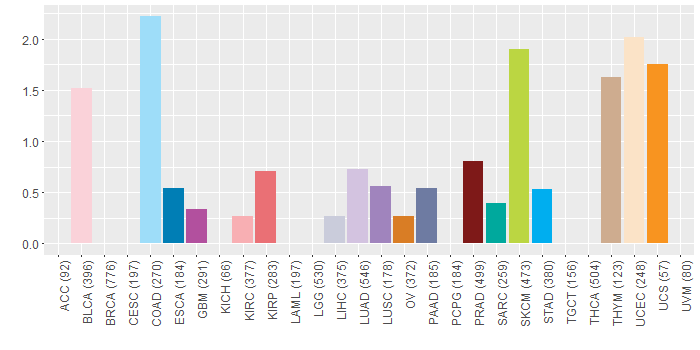
| Gene expressions across 28 cancer types (X-axis: cancer type and Y-axis: log2(norm_counts+1)) (TCGA IlluminaHiSeq_RNASeqV2, pan-cancer normalized log2(norm_counts+1) data, version 2016-08-16) |
 |
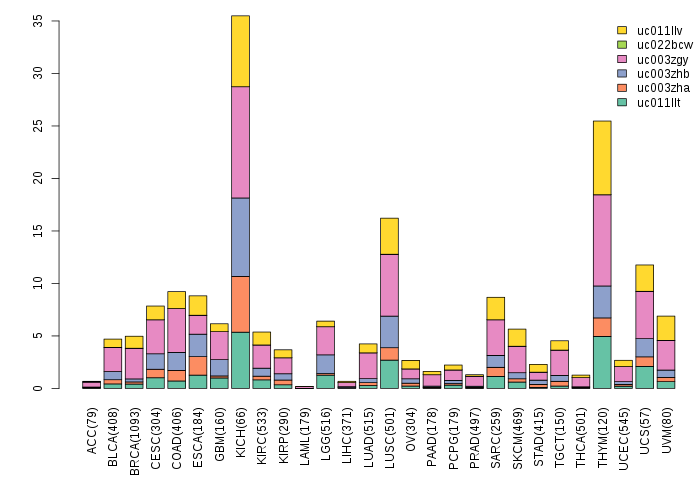
| Gene isoform expressions across 28 cancer types (X-axis: cancer type and Y-axis: log2(norm_counts+1)) (TCGA pan-cancer tcga_rsem_isoform_tpm, version 2016-09-01) |
 |
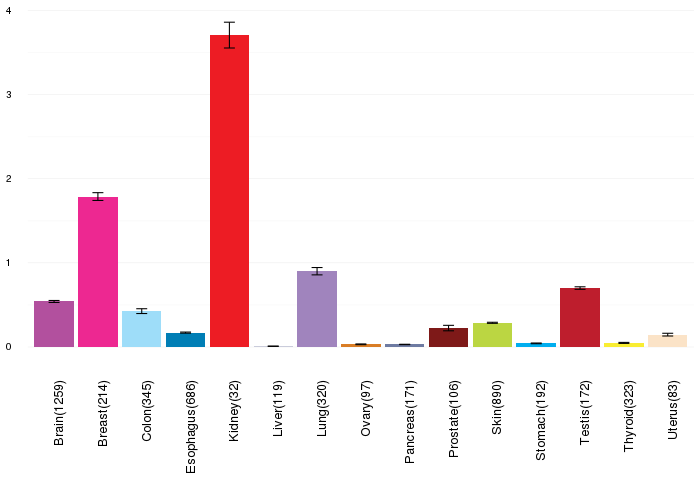
| Gene expressions across normal tissues of GTEx data (GTEx GTEx_Analysis_v6_RNA-seq_RNA-SeQCv1.1.8_gene_rpkm.gct) - Here, we shows the matched tissue types only among our 28 cancer types. |
 |
| Different expressions across 14 cancer types with more than 10 samples between matched tumors and normals (X-axis: cancer type and Y-axis: log2(norm_counts+1)) (TCGA IlluminaHiSeq_RNASeqV2, pan-cancer normalized log2(norm_counts+1) data, version 2016-08-16) |
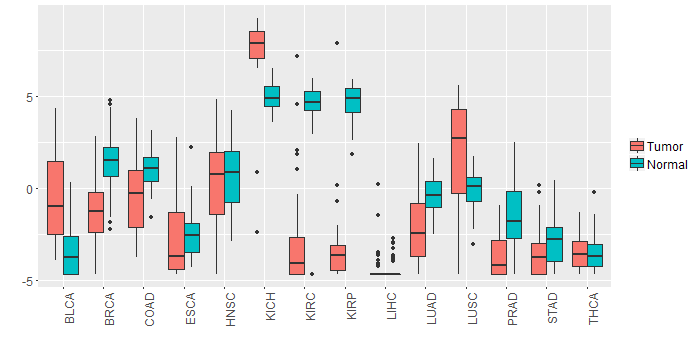 |
| - Significantly differentially expressed cancer types and information. (|Fold change|>1 and FDR<0.05) |
| Cancer type | Mean(exp) in tumor | Mean(exp) in matched normal | Log2FC | P-val. | FDR |
| PRAD | -3.729925614 | -1.669423691 | -2.060501923 | 3.13E-10 | 5.89E-09 |
| BRCA | -1.281522645 | 1.375523847 | -2.657046491 | 3.81E-30 | 5.14E-29 |
| LUSC | 1.789675291 | -0.102034513 | 1.891709804 | 2.24E-05 | 4.95E-05 |
| KIRP | -3.214753017 | 4.664521983 | -7.879275 | 6.58E-21 | 4.47E-19 |
| LUAD | -2.106764871 | -0.367507974 | -1.739256897 | 5.08E-09 | 2.36E-08 |
| KIRC | -3.21695649 | 4.606640733 | -7.823597222 | 1.41E-49 | 1.13E-47 |
| COAD | -0.280775614 | 1.001124386 | -1.2819 | 0.011 | 0.023721457 |
| BLCA | -0.493840189 | -3.38089282 | 2.887052632 | 0.000205 | 0.001990917 |
| KICH | 7.282168233 | 4.978092233 | 2.304076 | 0.000209 | 0.000514103 |
| Top |
| TissGene-miRNA for DMRT2 |
| Significantly anti-correlated miRNAs of TissGene across 28 cancer types (Gene-miRNA relations from TargetScanHuman Relsease 7.1, Conserved_Site_Context_Scores.txt.zip, 06.01.2016) (TCGA IlluminaHiSeq_miRNASeq, log2(RPM+1) data, version 2016-11-21) (TCGA IlluminaHiSeq_RNASeqV2, log2(normalized_count+1) data, version 2016-08-16) (Spearman’s Rank Correlation (p-value<0.05 and coefficient<-0.25)) |
| Cancer type | miRNA id | miRNA accession | P-val. | Coeff. | # samples |
| UCS | hsa-miR-137 | MIMAT0000429 | 0.045 | -0.31 | 56 |
| Top |
| TissGeneMut for DMRT2 |
| TissGeneSNV for DMRT2 |
| nsSNV counts per each loci. Different colors of circles represent different cancer types. Circle size denotes number of samples. (TCGA somatic mutation (SNPs and small INDELs) data, version 2016-04-25) * Click on the image to enlarge it in a new window. |
 |
 |
| Somatic nucleotide variants of TissGene across 28 cancer types (X-axis: cancer type and Y-axis: % of mutated samples) The numbers in parentheses are numbers of samples with mutation (nsSNVs). (TCGA somatic mutation (SNPs and small INDELs) data, version 2016-04-25) |
 |
| - nsSNVs sorted by frequency. |
| AAchange | Cancer type | # samples |
| p.T106S | KIRP | 2 |
| p.R189C | PRAD | 1 |
| p.R273H | GBM | 1 |
| p.Q368E | KIRC | 1 |
| p.Q561* | BLCA | 1 |
| p.D524N | SKCM | 1 |
| p.R340I | LIHC | 1 |
| p.N301I | UCEC | 1 |
| p.S536P | SKCM | 1 |
| p.P295A | OV | 1 |
| p.T106S | SKCM | 1 |
| p.E458Q | COAD | 1 |
| p.R257M | PRAD | 1 |
| p.V326I | LUAD | 1 |
| p.P215S | SKCM | 1 |
| p.P40S | PRAD | 1 |
| p.K297N | UCEC | 1 |
| p.E458* | UCEC | 1 |
| p.P291T | LUAD | 1 |
| p.R252I | COAD | 1 |
| p.R551M | UCEC | 1 |
| p.V328M | DLBC | 1 |
| p.A216V | STAD | 1 |
| p.R382G | ESCA | 1 |
| p.P215L | SKCM | 1 |
| p.D352G | BLCA | 1 |
| p.E458X | COAD | 1 |
| p.A329S | COAD | 1 |
| p.P276H | LUSC | 1 |
| p.Q421* | BLCA | 1 |
| p.S296I | READ | 1 |
| p.P463H | COAD | 1 |
| p.H420Y | SKCM | 1 |
| p.K243T | UCS | 1 |
| p.P271R | BLCA | 1 |
| p.S544F | SKCM | 1 |
| p.L226V | BLCA | 1 |
| p.L180F | SKCM | 1 |
| p.A329S | THYM | 1 |
| p.S444F | SKCM | 1 |
| p.E546Q | BLCA | 1 |
| p.A381E | COAD | 1 |
| p.P336L | SARC | 1 |
| p.A381T | UCEC | 1 |
| p.D308G | PAAD | 1 |
| p.A329T | LUAD | 1 |
| p.E23K | SKCM | 1 |
| p.Y219F | STAD | 1 |
| p.N185K | LUAD | 1 |
| p.M234V | THYM | 1 |
| p.F526S | PRAD | 1 |
| Top |
| TissGeneCNV for DMRT2 |
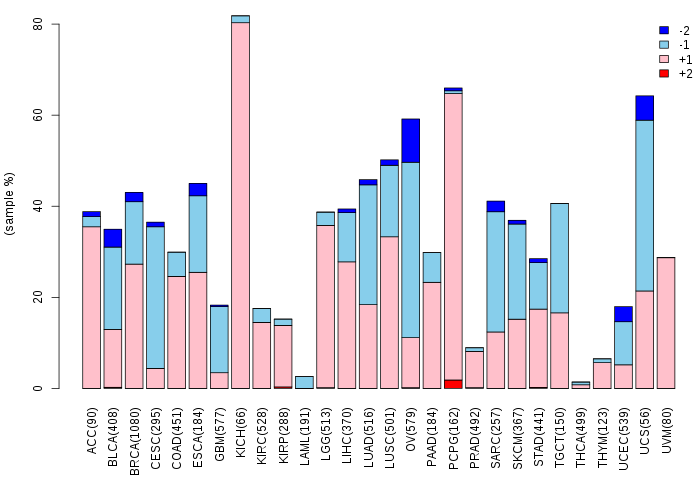
| Copy number variations of TissGene across 28 cancer types (X-axis: cancer type and Y-axis: % of CNV samples) (TCGA Gistic2_CopyNumber_Gistic2_all_data_by_genes, Gistic2 copy number data, version 2016-08-16) |
 |
| Top |
| TissGeneFusions for DMRT2 |
| Fusion genes including TissGene (ChimerDB 3.0, 2016-12-01 and TCGA fusion Portal 2015-12-01) |
| Database | Src | Cancer type | Sample | Fusion gene | ORF | 5'-gene BP | 3'-gene BP |
| TCGAfusionPortal | PRADA | LUSC | TCGA-66-2744-01A | ZMYM2-DMRT2 | CDS-5UTR | Chr13:20611049 | Chr9:1051570 |
| Top |
| TissGeneNet for DMRT2 |
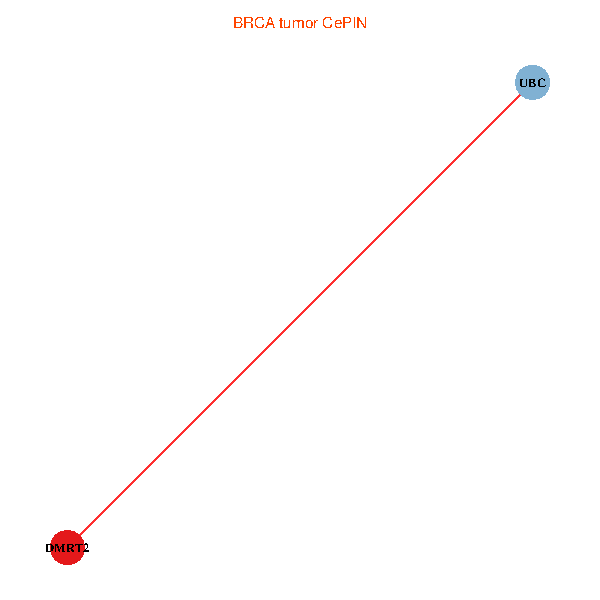
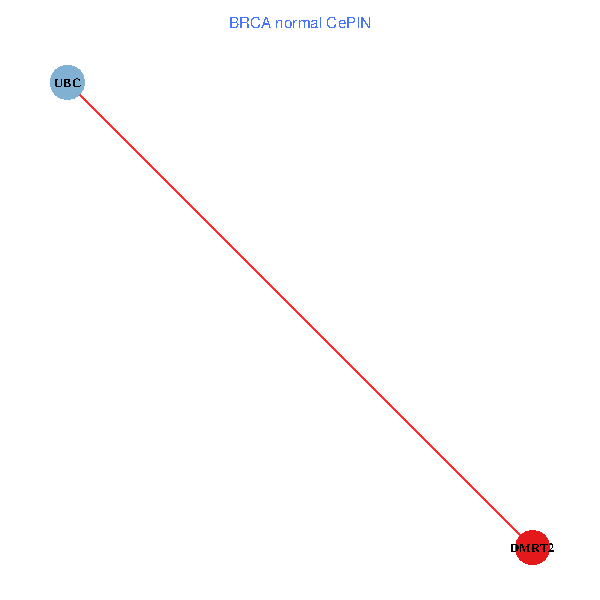
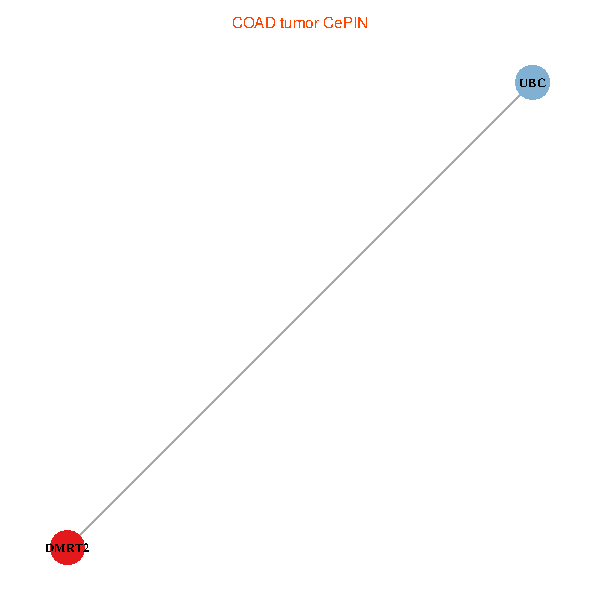
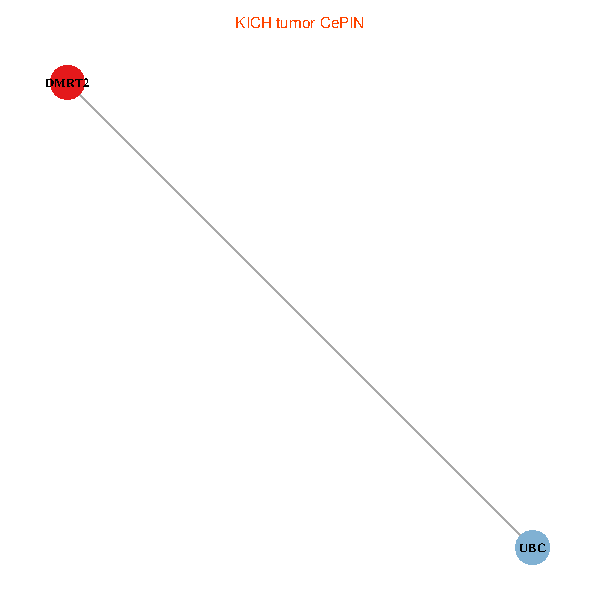
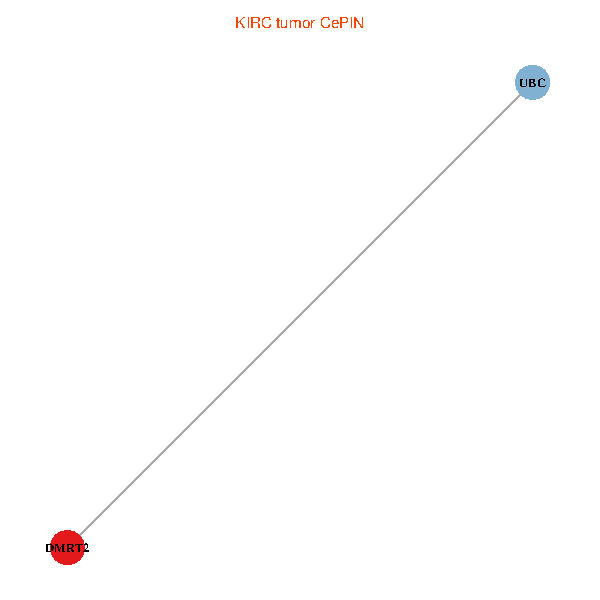
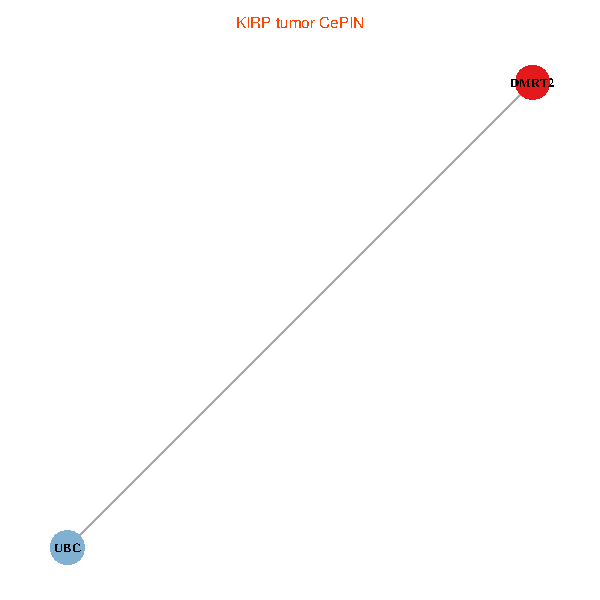
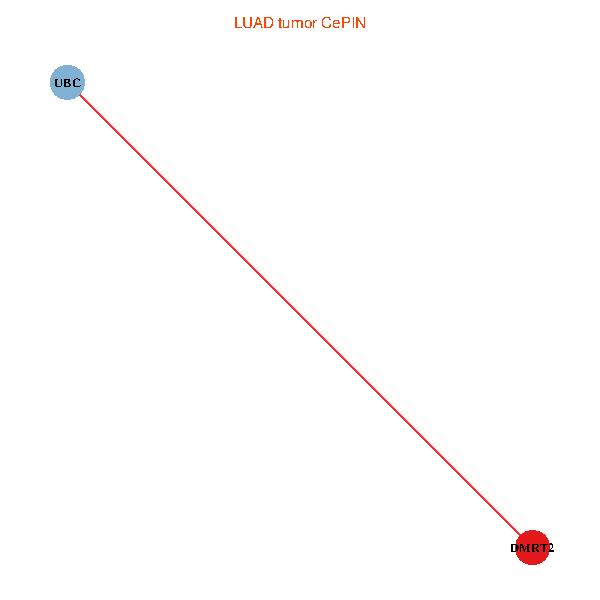
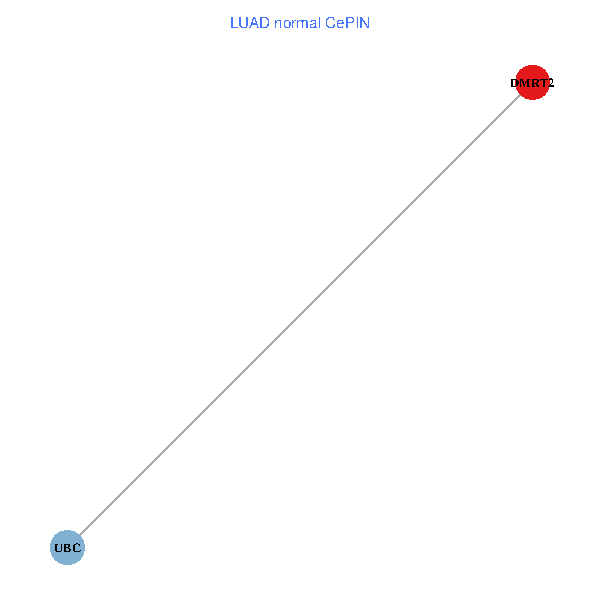
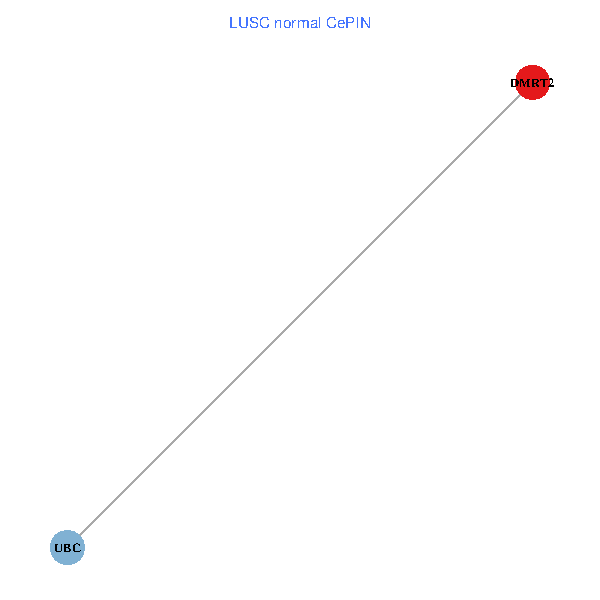
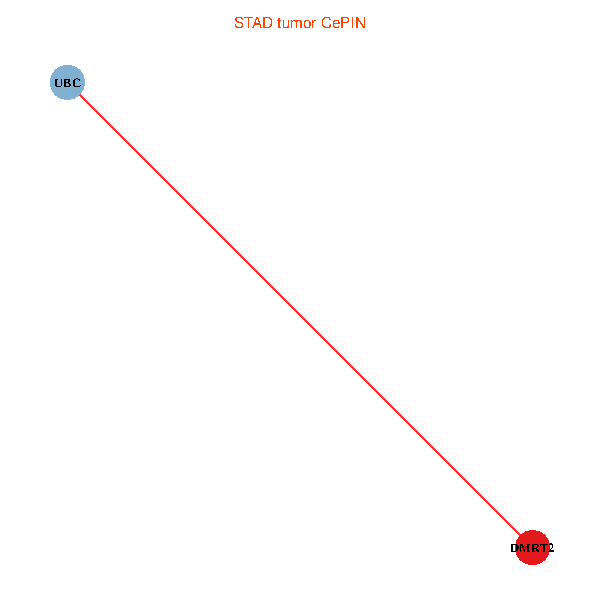
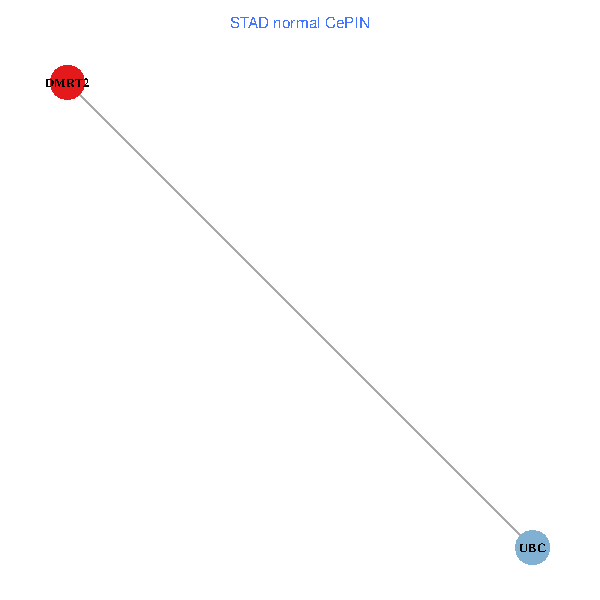
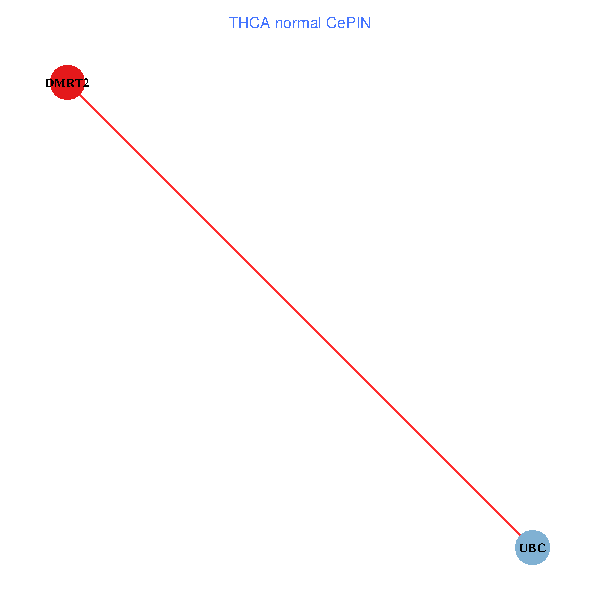
| Co-expressed gene networks based on protein-protein interaction data (CePIN) (TCGA IlluminaHiSeq_RNASeqV2, pan-cancer normalized log2(norm_counts+1) data, version 2016-08-16) (PINA2 ppi data) |
| BRCA (tumor) | BRCA (normal) |
| DMRT2, UBC (tumor) | DMRT2, UBC (normal) |
 |  |
| COAD (tumor) | COAD (normal) |
| DMRT2, UBC (tumor) | DMRT2, UBC (normal) |
 |  |
| HNSC (tumor) | HNSC (normal) |
| DMRT2, UBC (tumor) | DMRT2, UBC (normal) |
 |  |
| KICH (tumor) | KICH (normal) |
| DMRT2, UBC (tumor) | DMRT2, UBC (normal) |
 |  |
| KIRC (tumor) | KIRC (normal) |
| DMRT2, UBC (tumor) | DMRT2, UBC (normal) |
 |  |
| KIRP (tumor) | KIRP (normal) |
| DMRT2, UBC (tumor) | DMRT2, UBC (normal) |
 |  |
| LIHC (tumor) | LIHC (normal) |
| DMRT2, UBC (tumor) | DMRT2, UBC (normal) |
 |  |
| LUAD (tumor) | LUAD (normal) |
| DMRT2, UBC (tumor) | DMRT2, UBC (normal) |
 |  |
| LUSC (tumor) | LUSC (normal) |
| DMRT2, UBC (tumor) | DMRT2, UBC (normal) |
 |  |
| PRAD (tumor) | PRAD (normal) |
| DMRT2, UBC (tumor) | DMRT2, UBC (normal) |
 |  |
| STAD (tumor) | STAD (normal) |
| DMRT2, UBC (tumor) | DMRT2, UBC (normal) |
 |  |
| THCA (tumor) | THCA (normal) |
| DMRT2, UBC (tumor) | DMRT2, UBC (normal) |
 |  |
| Top |
| TissGeneProg for DMRT2 |
| Kaplan-Meier plots with logrank tests of overall survival (OS) using 28 cancer types (TCGA IlluminaHiSeq_RNASeqV2, pan-cancer normalized log2(norm_counts+1) data, version 2016-08-16) (TCGA clinicalMatrix, phenotype data, version 2016-04-27) * Click on the image to enlarge it in a new window. |
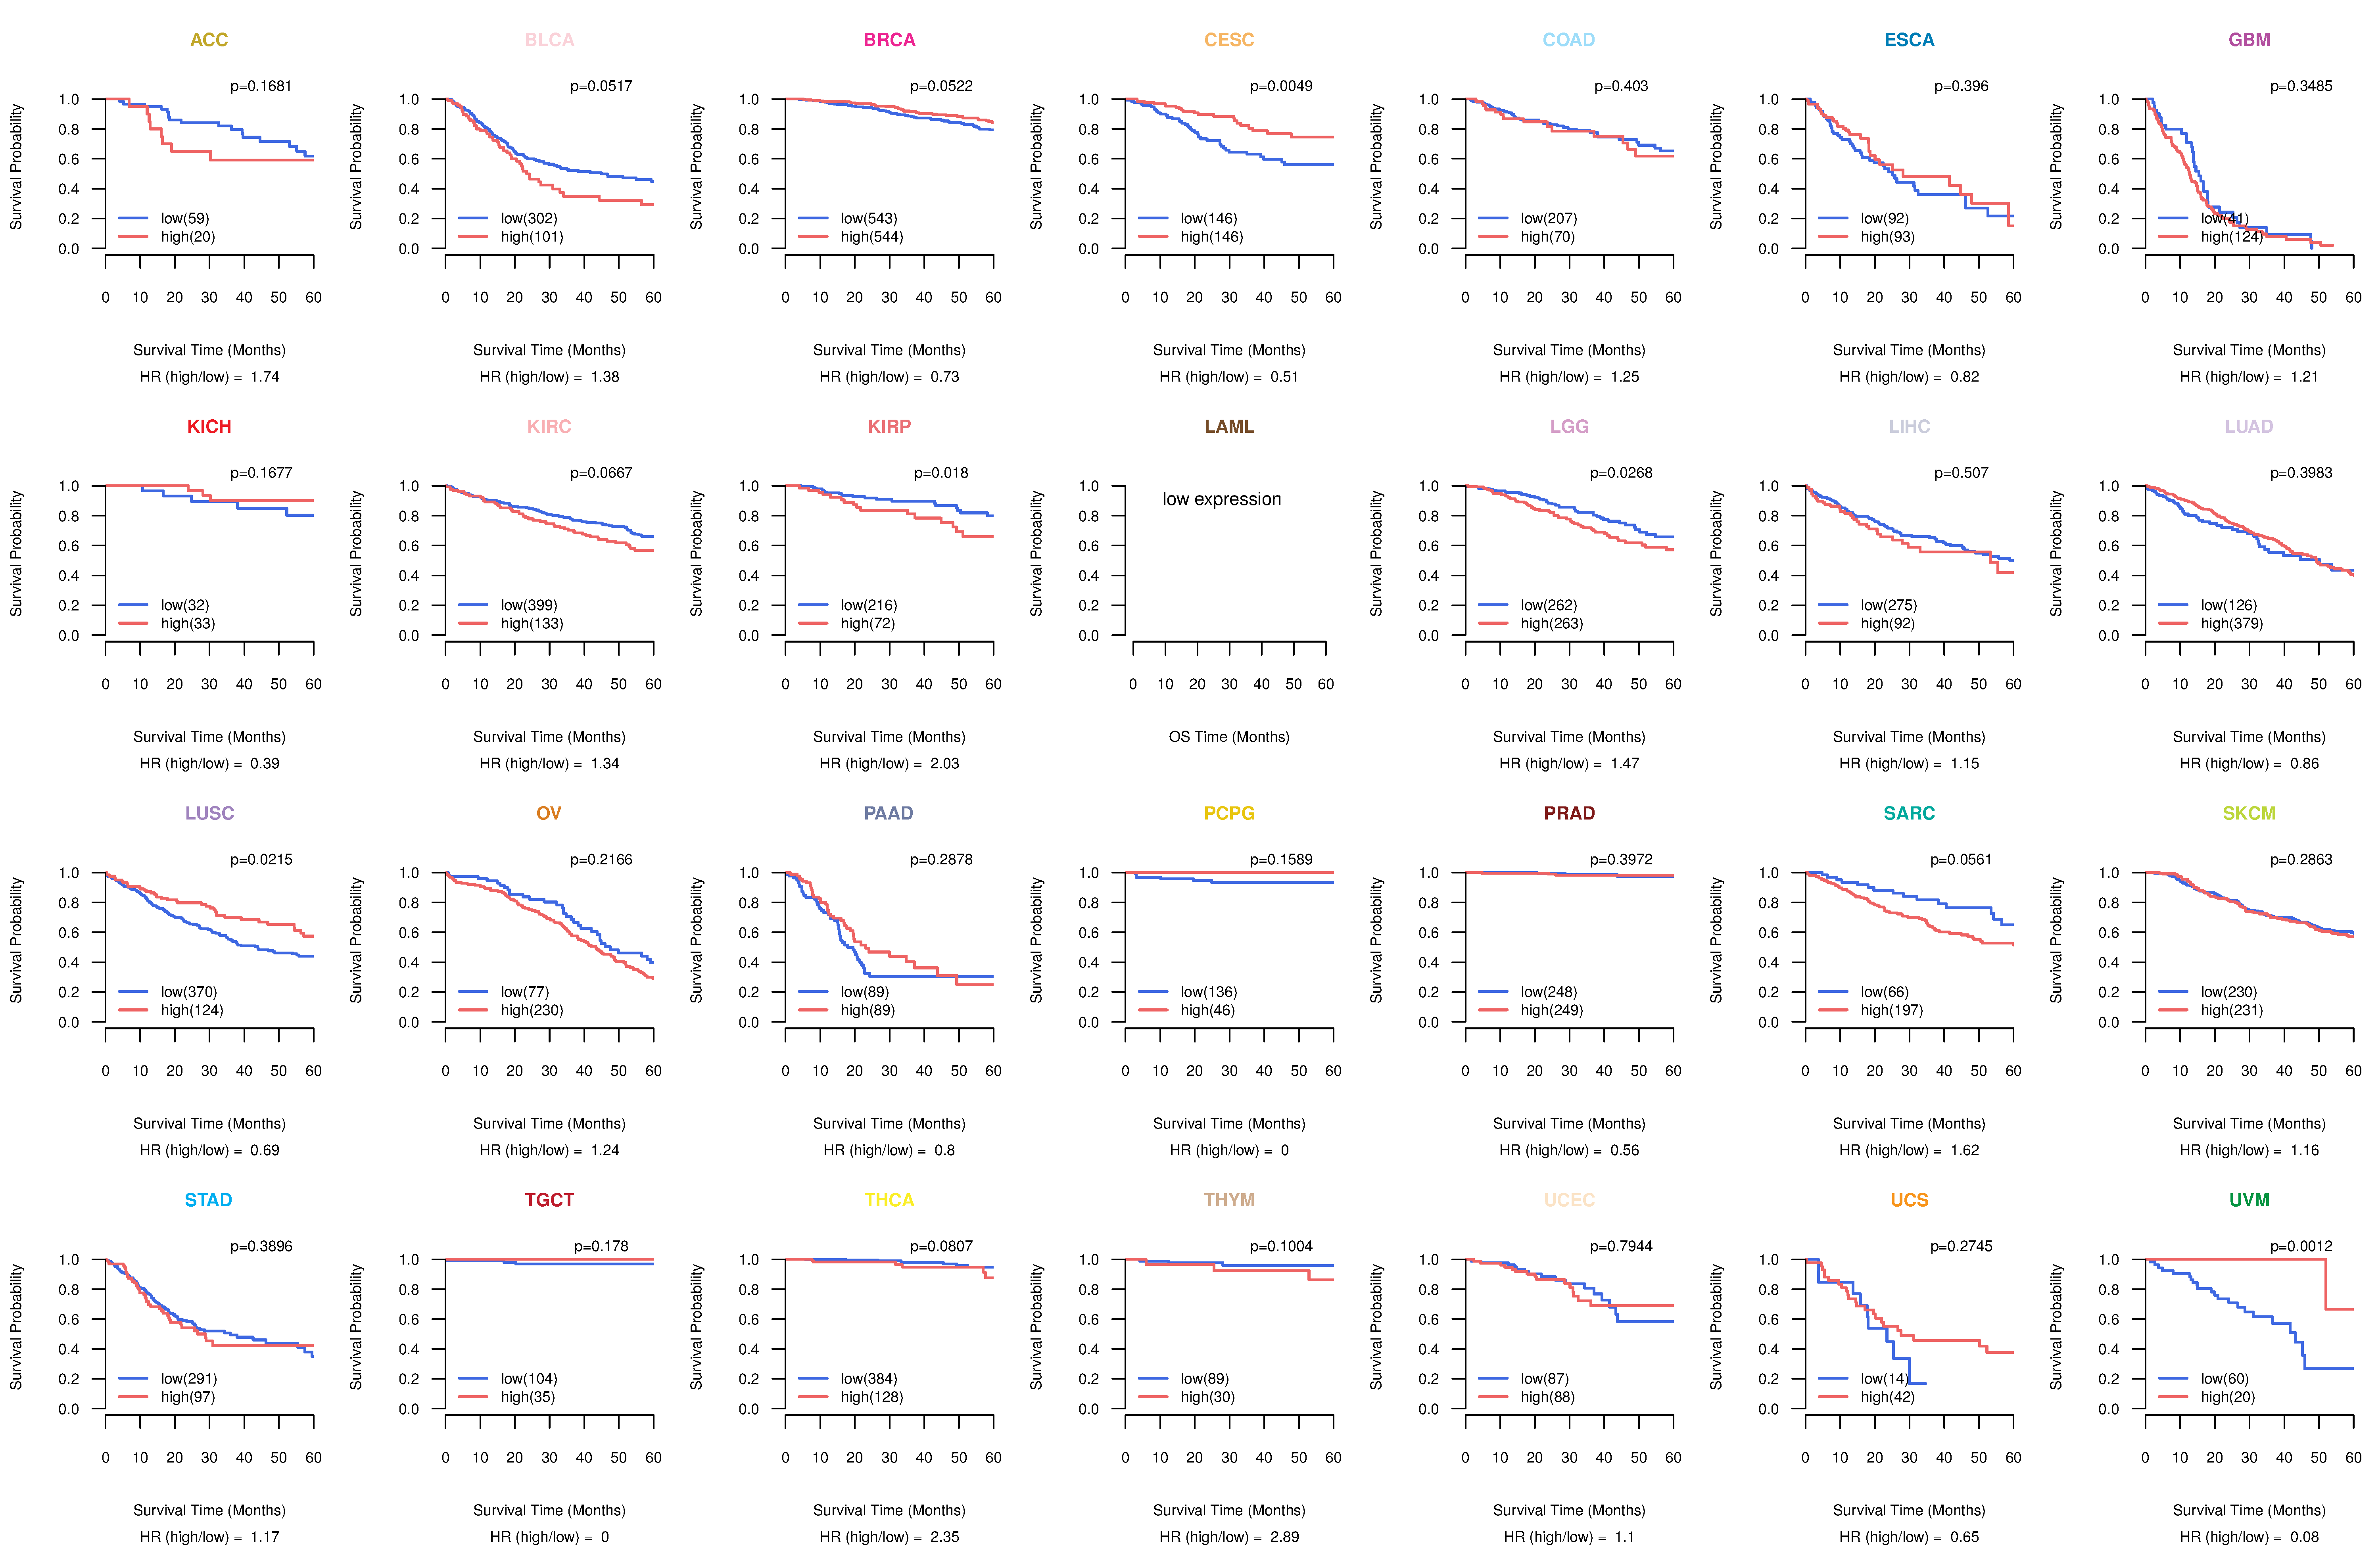 |
| Kaplan-Meier plots with logrank test of relapse free survival (RFS) using 28 cancer types (TCGA IlluminaHiSeq_RNASeqV2, pan-cancer normalized log2(norm_counts+1) data, version 2016-08-16) (TCGA clinicalMatrix, phenotype data, version 2016-04-27) * Click on the image enlarge it in a new window. |
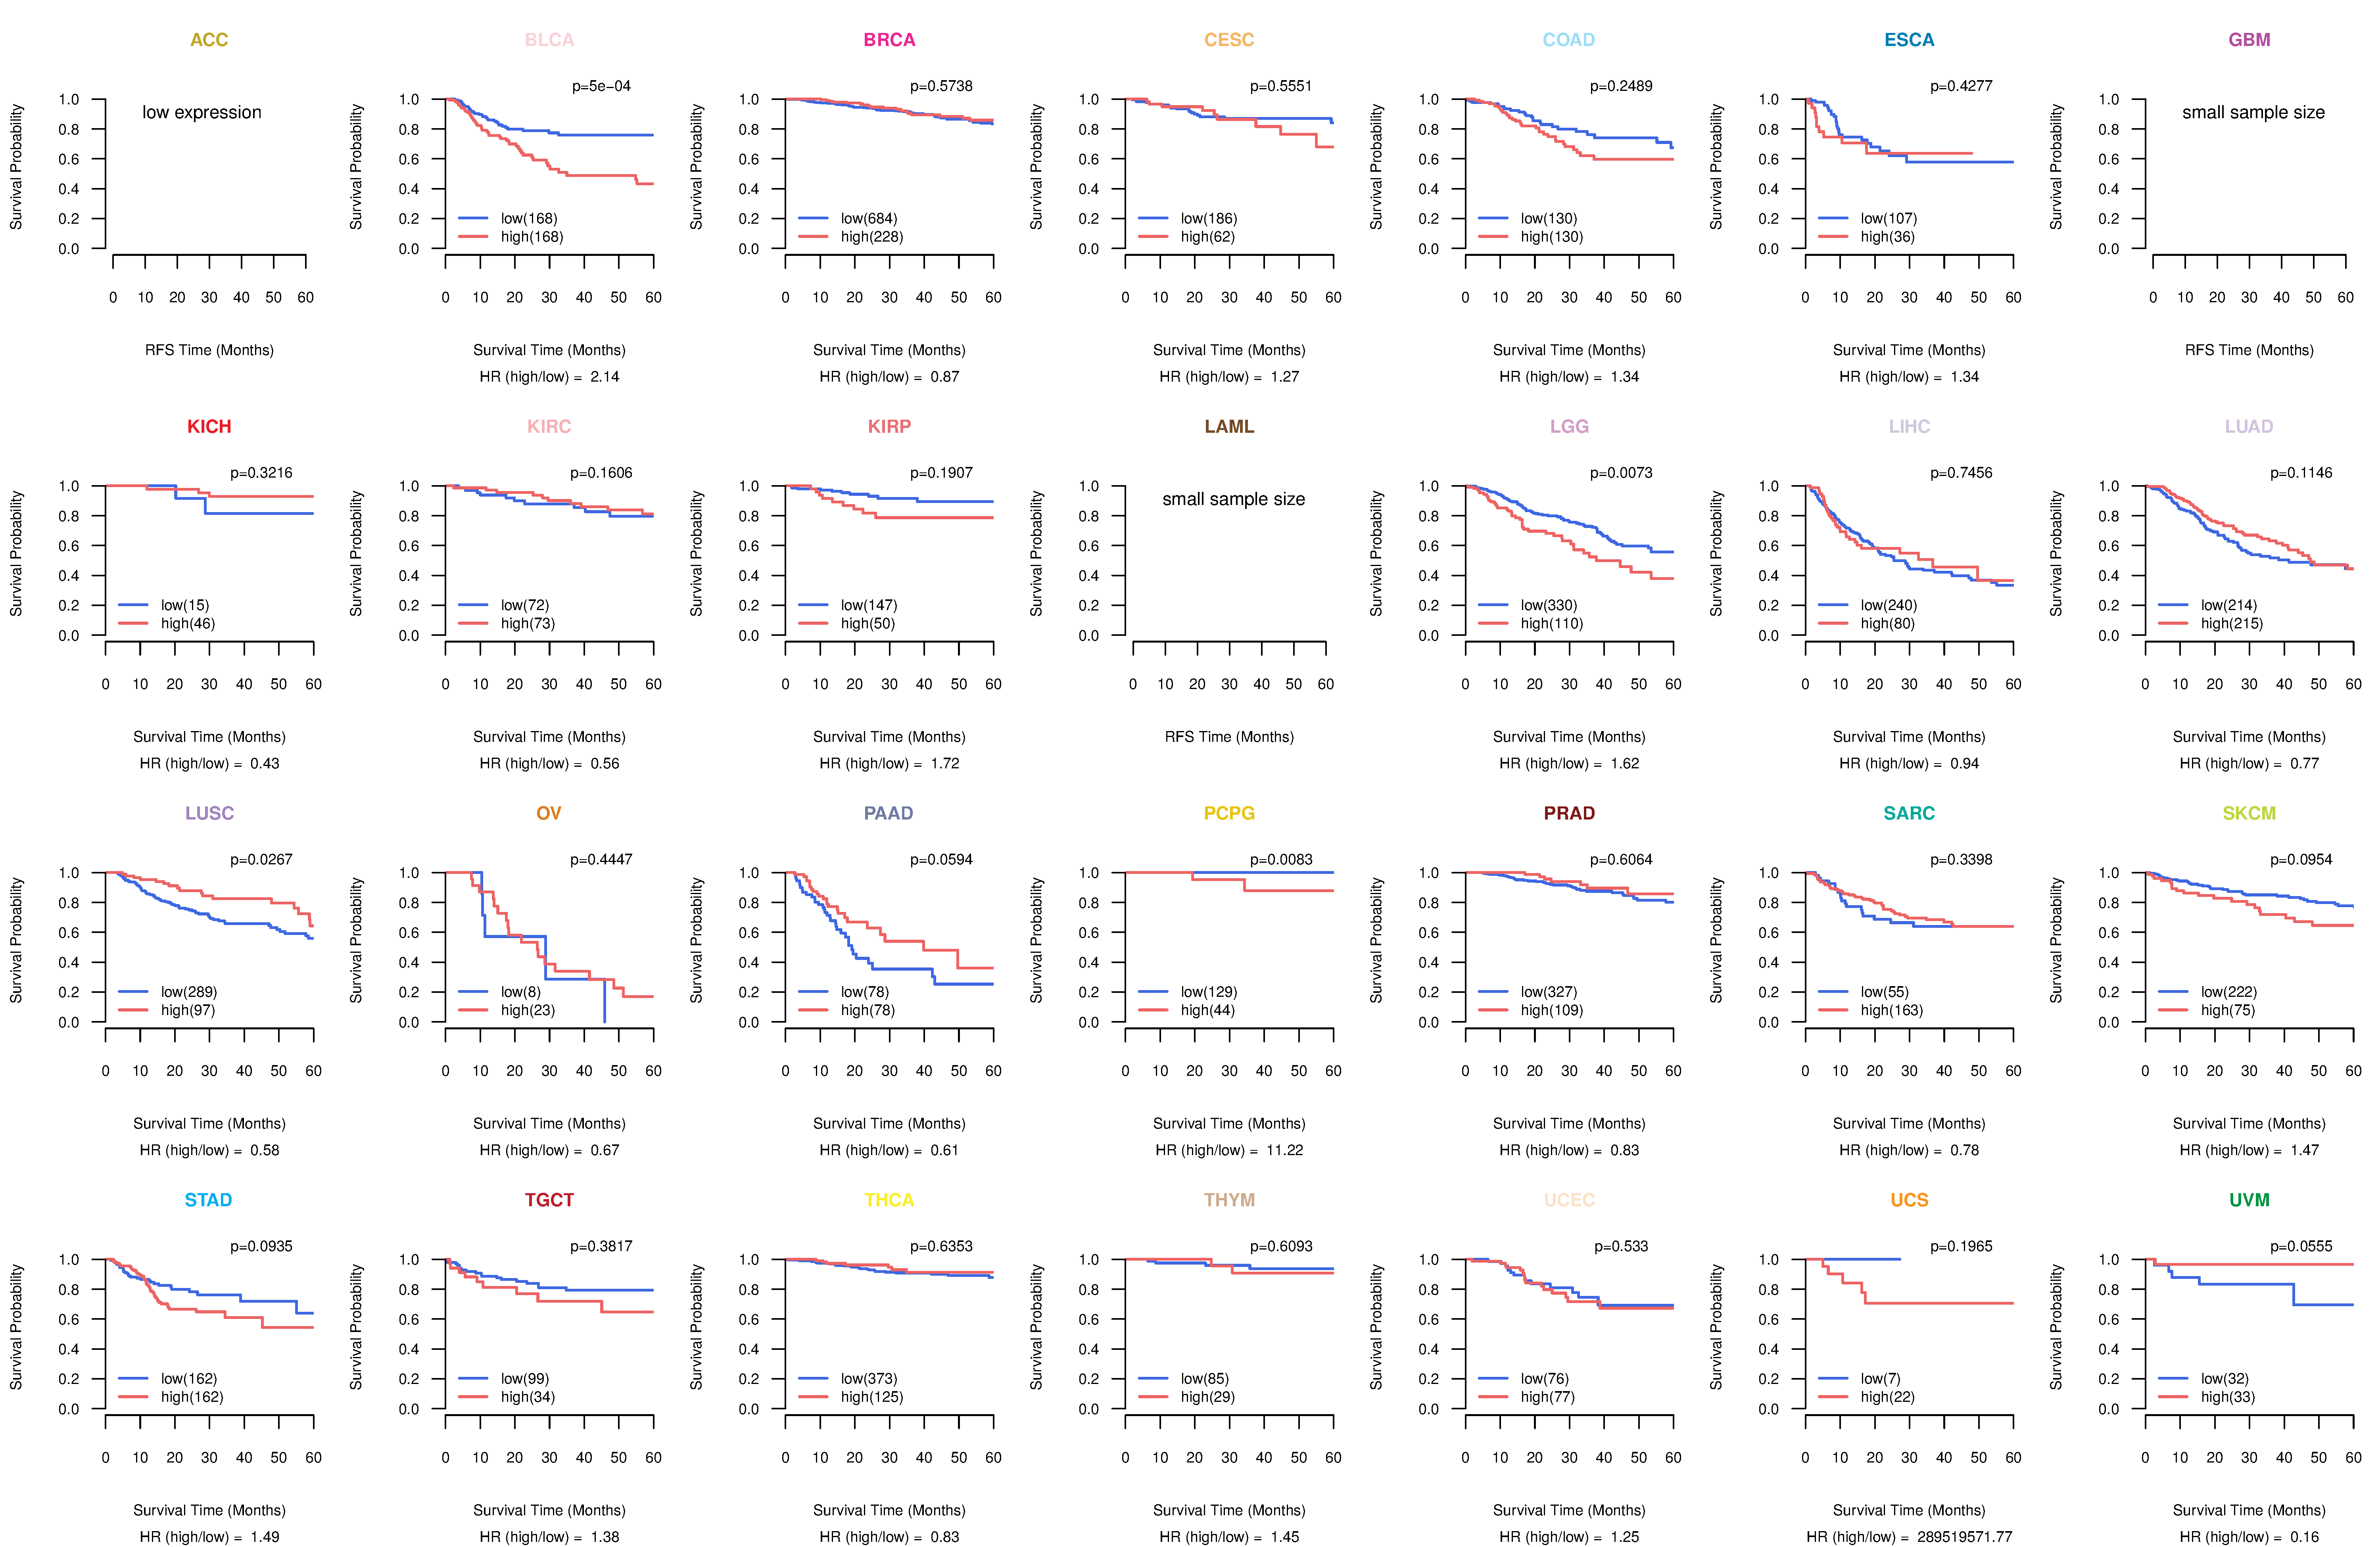 |
| Forest plot of Cox proportional hazard ratio (HR) and 95% CI of overall survival (OS) using 28 cancer types (TCGA IlluminaHiSeq_RNASeqV2, pan-cancer normalized log2(norm_counts+1) data, version 2016-08-16) (TCGA clinicalMatrix, phenotype data, version 2016-04-27) * Click on the image enlarge it in a new window. |
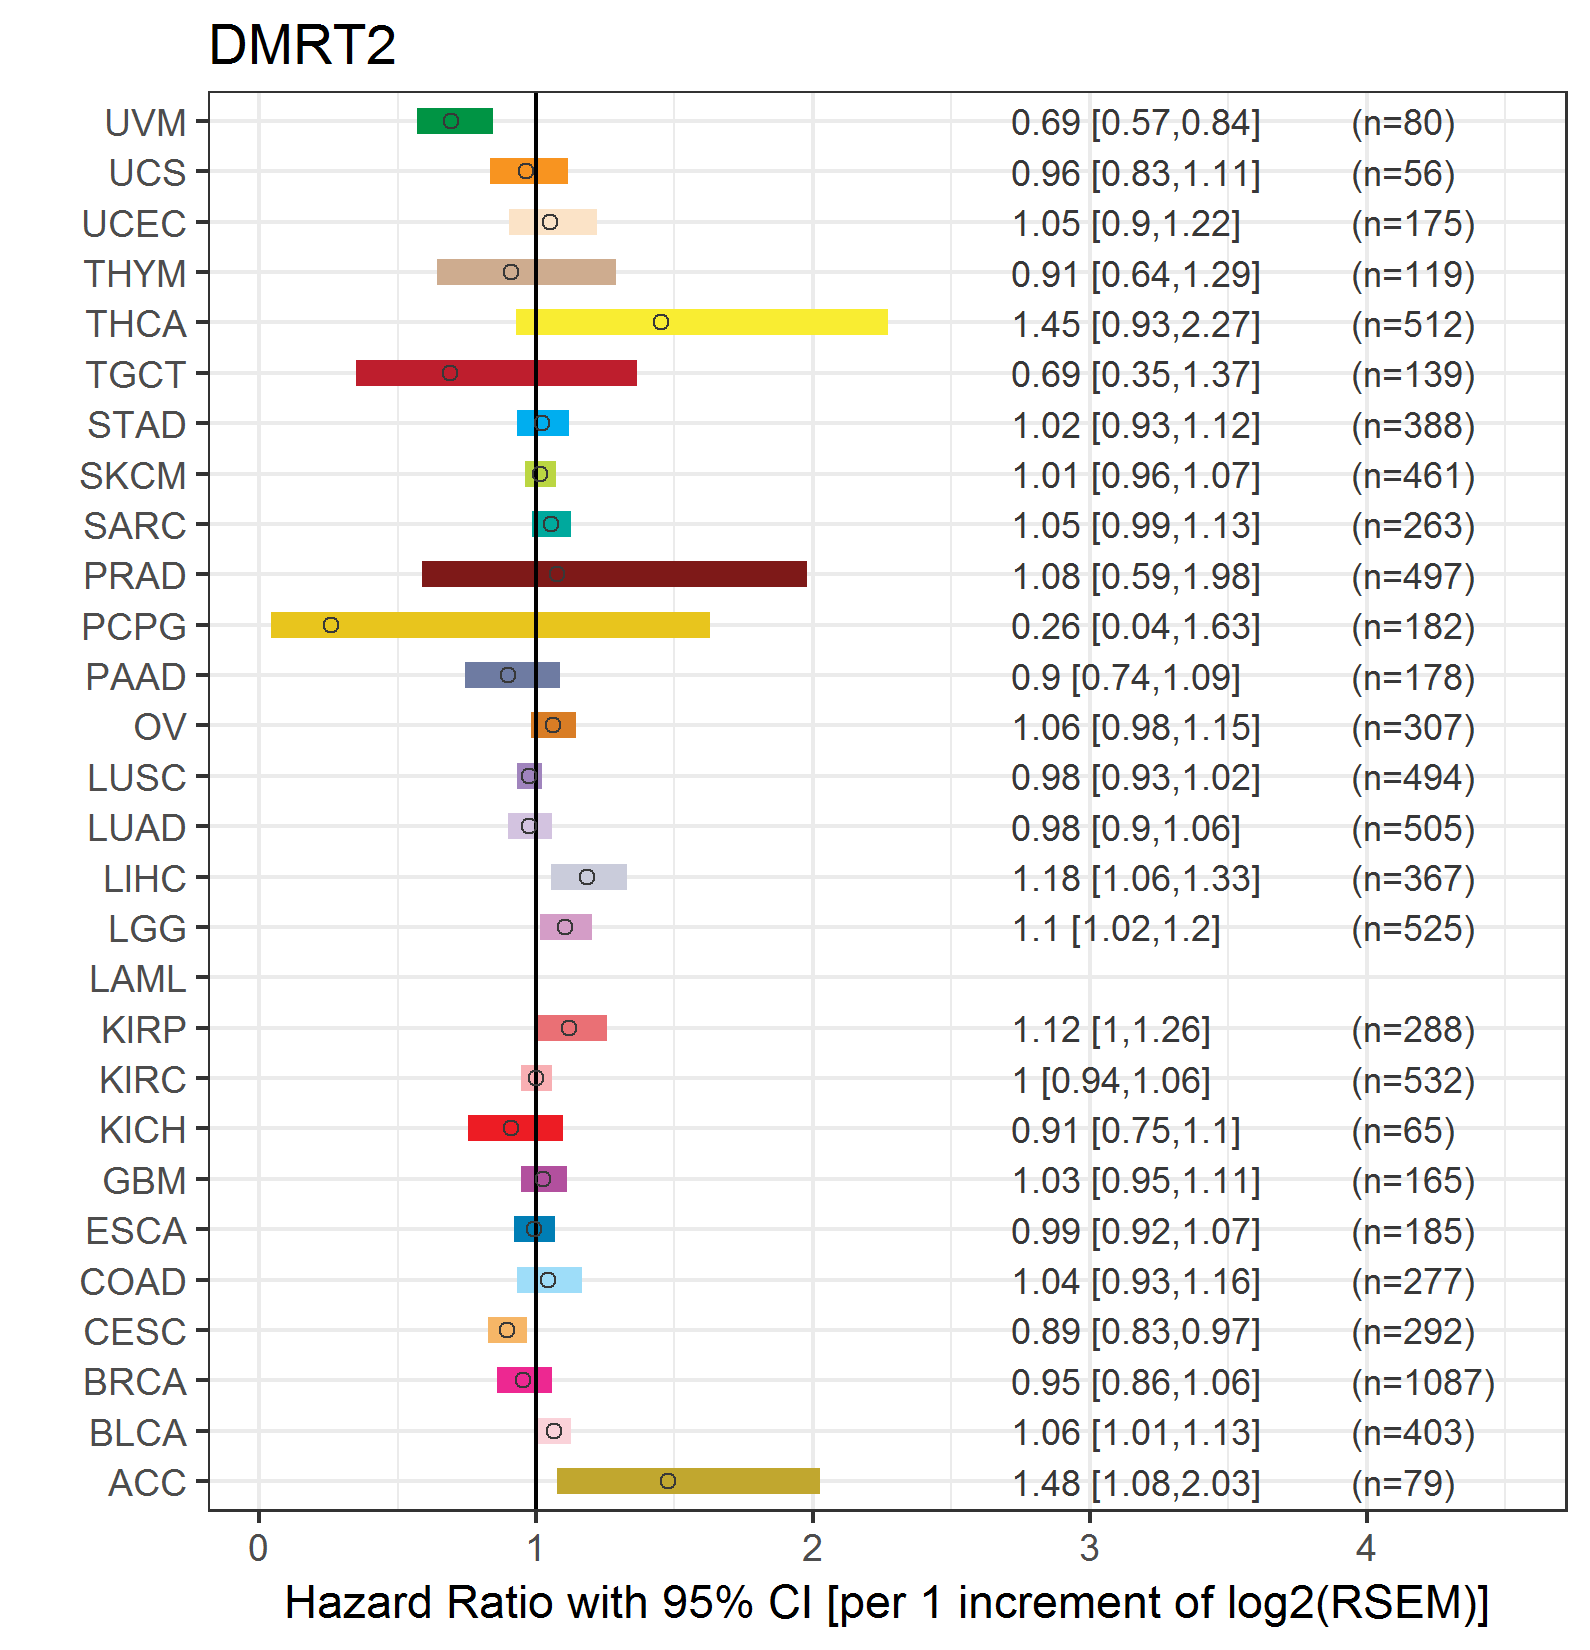 |
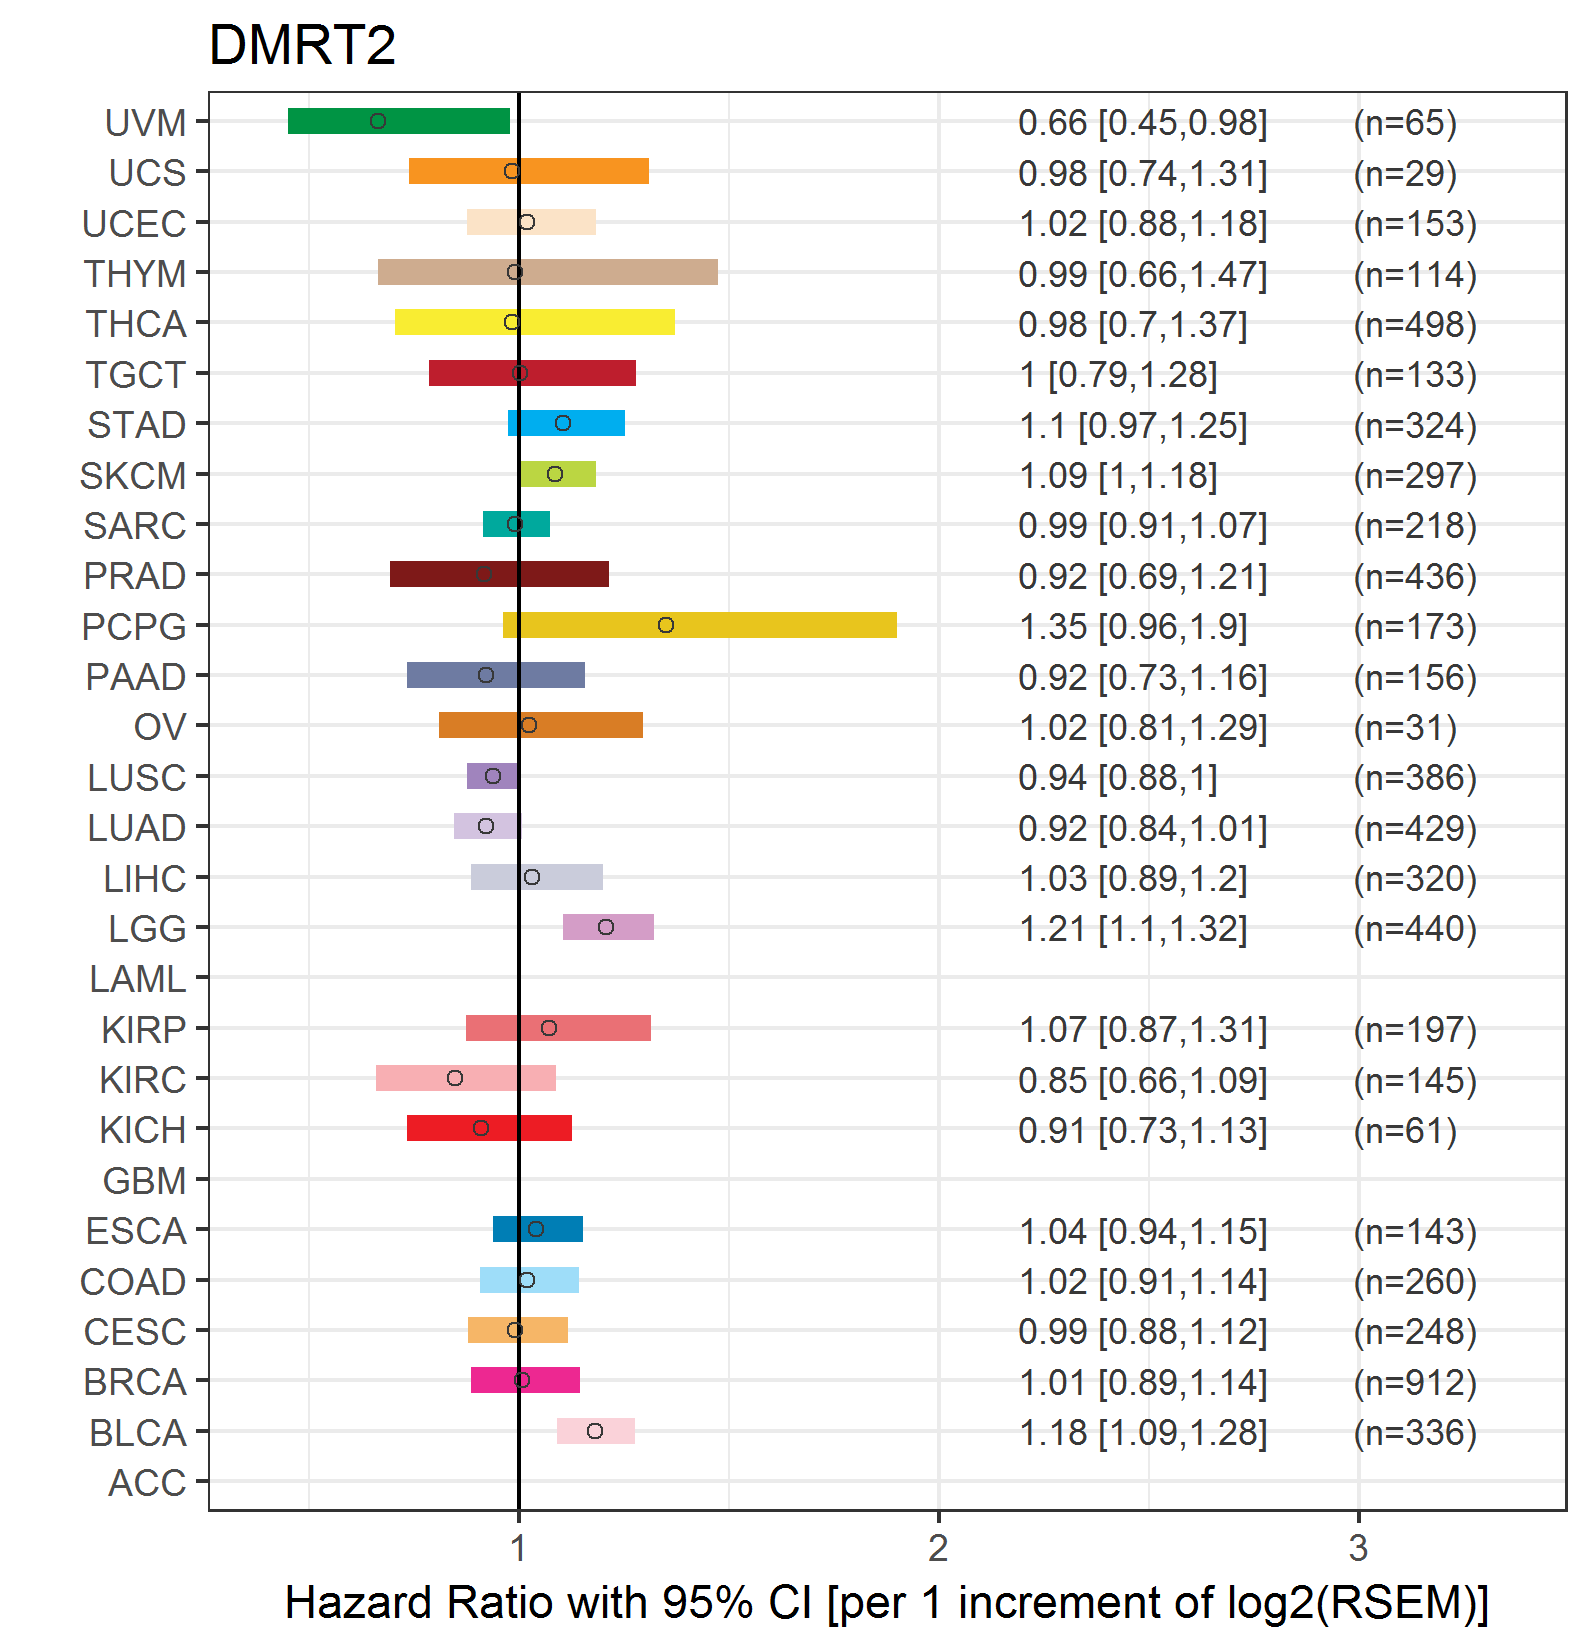
| Forest plot of Cox proportional hazard ratio (HR) and 95% CI of relapse free survival (RFS) using 28 cancer types (TCGA IlluminaHiSeq_RNASeqV2, pan-cancer normalized log2(norm_counts+1) data, version 2016-08-16) (TCGA clinicalMatrix, phenotype data, version 2016-04-27) * Click on the image enlarge it in a new window. |
 |
| Top |
| TissGeneClin for DMRT2 |
| TissGeneDrug for DMRT2 |
| Drug information targeting TissGene (DrugBank Version 5.0.6, 2017-04-01) |
| DrugBank ID | Drug name | Drug activity | Drug type | Drug status |
| Top |
| TissGeneDisease for DMRT2 |
| Disease information associated with TissGene (DisGeNet, 2016-06-01) |
| Disease ID | Disease name | # pubmeds | Source |
| umls:C0279626 | Squamous cell carcinoma of esophagus | 1 | BeFree |
| umls:C1263846 | Attention deficit hyperactivity disorder | 1 | GAD |
|
Copyright 2016-Present - The University of Texas Health Science Center at Houston (UTHealth) Web File Viewing | How to Report, Fraud, Waste and Abuse | State of Texas | Statewide Search | Texas Homeland Security | Site Policies |