 |
| |
| |
| |
| |
| |
| |
|

| TissGeneSummary for SLC17A3 |
 Gene summary Gene summary |
| Basic gene information | Gene symbol | SLC17A3 |
| Gene name | solute carrier family 17 (organic anion transporter), member 3 | |
| Synonyms | NPT4 | |
| Cytomap | UCSC genome browser: 6p21.3 | |
| Type of gene | protein-coding | |
| RefGenes | NM_001098486.1, NM_006632.3, | |
| Description | Na(+)/PI cotransporter 4sodium-dependent phosphate transport protein 4sodium/phosphate cotransporter 4solute carrier family 17 (sodium phosphate), member 3 | |
| Modification date | 20141211 | |
| dbXrefs | MIM : 611034 | |
| HGNC : HGNC | ||
| Ensembl : ENSG00000124564 | ||
| HPRD : 10233 | ||
| Vega : OTTHUMG00000014412 | ||
| Protein | UniProt: go to UniProt's Cross Reference DB Table | |
| Expression | CleanEX: HS_SLC17A3 | |
| BioGPS: 10786 | ||
| Pathway | NCI Pathway Interaction Database: SLC17A3 | |
| KEGG: SLC17A3 | ||
| REACTOME: SLC17A3 | ||
| Pathway Commons: SLC17A3 | ||
| Context | iHOP: SLC17A3 | |
| ligand binding site mutation search in PubMed: SLC17A3 | ||
| UCL Cancer Institute: SLC17A3 | ||
| Assigned class in TissGDB* | B | |
| Included tissue-specific gene expression resources | HPA,TiGER,GTEx | |
| Specific-tissues in normal samples (assigned by TissGDB using HPA, TiGER, and GTEx) | Kidney | |
| Cancer types related to the specific-tissues in cancer samples (assigned by TissGDB using TCGA) | KIRC,KIRP,KICH | |
| Reference showing the relevant tissue of SLC17A3 | ||
| Description by TissGene annotations | ||
| * Class A consists of genes with literature evidence and is part of the cTissGenes. Class B consists of only cTissGenes without additional evidence. The remaining genes belong to Class C. |
| Gene ontology having evidence of Inferred from Direct Assay (IDA) from Entrez |
| GO ID | GO term | PubMed ID | GO:0006855 | drug transmembrane transport | 20810651 | GO:0015711 | organic anion transport | 20810651 | GO:0015747 | urate transport | 20810651 | GO:0015849 | organic acid transport | 20810651 | GO:0015893 | drug transport | 20810651 | GO:0044070 | regulation of anion transport | 20810651 | GO:1901998 | toxin transport | 20810651 | GO:0006855 | drug transmembrane transport | 20810651 | GO:0015711 | organic anion transport | 20810651 | GO:0015747 | urate transport | 20810651 | GO:0015849 | organic acid transport | 20810651 | GO:0015893 | drug transport | 20810651 | GO:0044070 | regulation of anion transport | 20810651 | GO:1901998 | toxin transport | 20810651 |
| Top |
| TissGeneExp for SLC17A3 |
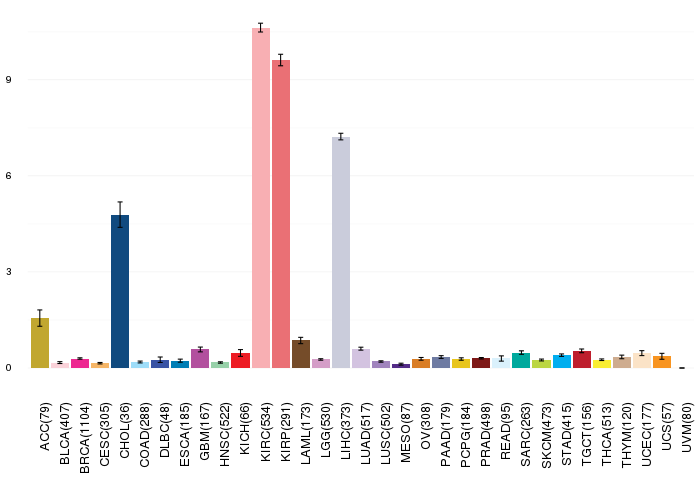
| Gene expressions across 28 cancer types (X-axis: cancer type and Y-axis: log2(norm_counts+1)) (TCGA IlluminaHiSeq_RNASeqV2, pan-cancer normalized log2(norm_counts+1) data, version 2016-08-16) |
 |
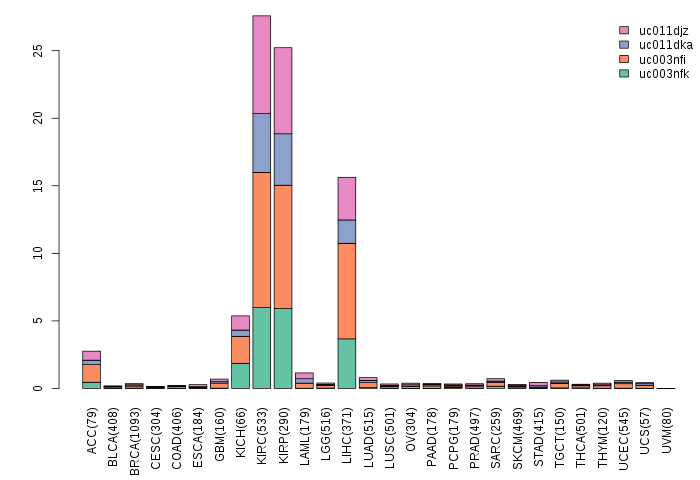
| Gene isoform expressions across 28 cancer types (X-axis: cancer type and Y-axis: log2(norm_counts+1)) (TCGA pan-cancer tcga_rsem_isoform_tpm, version 2016-09-01) |
 |
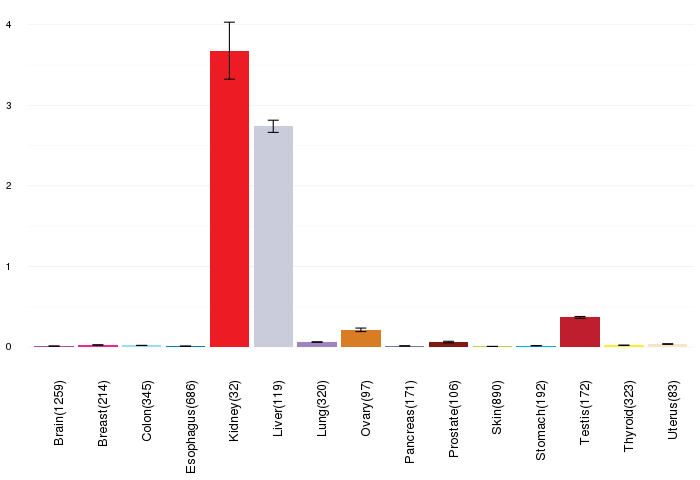
| Gene expressions across normal tissues of GTEx data (GTEx GTEx_Analysis_v6_RNA-seq_RNA-SeQCv1.1.8_gene_rpkm.gct) - Here, we shows the matched tissue types only among our 28 cancer types. |
 |
| Different expressions across 14 cancer types with more than 10 samples between matched tumors and normals (X-axis: cancer type and Y-axis: log2(norm_counts+1)) (TCGA IlluminaHiSeq_RNASeqV2, pan-cancer normalized log2(norm_counts+1) data, version 2016-08-16) |
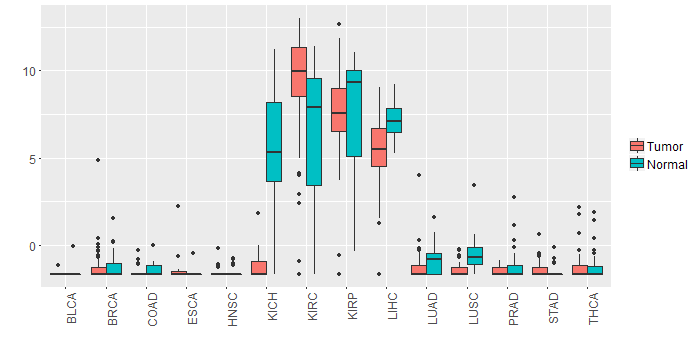 |
| - Significantly differentially expressed cancer types and information. (|Fold change|>1 and FDR<0.05) |
| Cancer type | Mean(exp) in tumor | Mean(exp) in matched normal | Log2FC | P-val. | FDR |
| KIRC | 9.331821156 | 6.658344767 | 2.673476389 | 4.11E-06 | 9.94E-06 |
| LIHC | 5.481959823 | 7.137723823 | -1.655764 | 1.63E-06 | 8.36E-06 |
| KICH | -1.125342177 | 5.717157823 | -6.8425 | 4.09E-10 | 2.84E-09 |
| Top |
| TissGene-miRNA for SLC17A3 |
| Significantly anti-correlated miRNAs of TissGene across 28 cancer types (Gene-miRNA relations from TargetScanHuman Relsease 7.1, Conserved_Site_Context_Scores.txt.zip, 06.01.2016) (TCGA IlluminaHiSeq_miRNASeq, log2(RPM+1) data, version 2016-11-21) (TCGA IlluminaHiSeq_RNASeqV2, log2(normalized_count+1) data, version 2016-08-16) (Spearman’s Rank Correlation (p-value<0.05 and coefficient<-0.25)) |
| Cancer type | miRNA id | miRNA accession | P-val. | Coeff. | # samples |
| Top |
| TissGeneMut for SLC17A3 |
| TissGeneSNV for SLC17A3 |
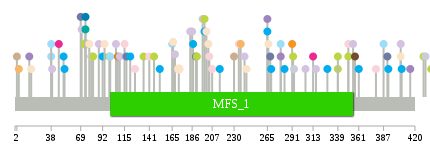
| nsSNV counts per each loci. Different colors of circles represent different cancer types. Circle size denotes number of samples. (TCGA somatic mutation (SNPs and small INDELs) data, version 2016-04-25) * Click on the image to enlarge it in a new window. |
 |
 |
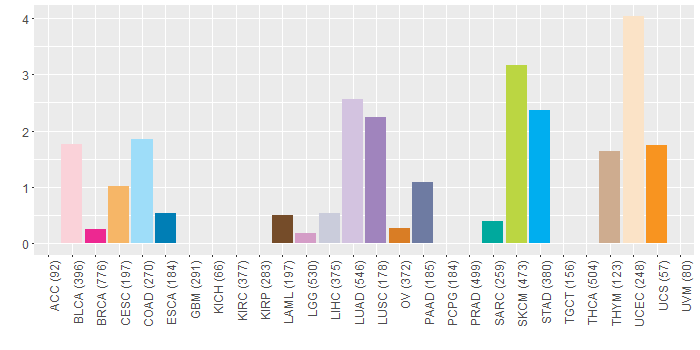
| Somatic nucleotide variants of TissGene across 28 cancer types (X-axis: cancer type and Y-axis: % of mutated samples) The numbers in parentheses are numbers of samples with mutation (nsSNVs). (TCGA somatic mutation (SNPs and small INDELs) data, version 2016-04-25) |
 |
| - nsSNVs sorted by frequency. |
| AAchange | Cancer type | # samples |
| p.R172* | UCEC | 2 |
| p.S74F | SKCM | 2 |
| p.S92R | STAD | 1 |
| p.R199X | STAD | 1 |
| p.R121* | STAD | 1 |
| p.L406F | STAD | 1 |
| p.E190D | PAAD | 1 |
| p.A2V | THYM | 1 |
| p.G279R | COAD | 1 |
| p.S293P | LIHC | 1 |
| p.F237L | CESC | 1 |
| p.E268D | PAAD | 1 |
| p.Q110E | LUAD | 1 |
| p.M313I | BRCA | 1 |
| p.G184E | LUAD | 1 |
| p.L291I | UCS | 1 |
| p.G350A | BLCA | 1 |
| p.T52M | STAD | 1 |
| p.D355E | LUAD | 1 |
| p.S204R | BLCA | 1 |
| p.E457K | BLCA | 1 |
| p.R201I | UCEC | 1 |
| p.Y415* | LUSC | 1 |
| p.C203Y | UCEC | 1 |
| p.A94S | UCEC | 1 |
| p.S146F | SKCM | 1 |
| p.Y269C | STAD | 1 |
| p.S80Y | LUAD | 1 |
| p.P99S | SKCM | 1 |
| p.K15R | LUSC | 1 |
| p.S69I | PAAD | 1 |
| p.S265X | STAD | 1 |
| p.G431A | LIHC | 1 |
| p.R292K | SKCM | 1 |
| p.A17T | UCEC | 1 |
| p.S437L | SKCM | 1 |
| p.P456L | SKCM | 1 |
| p.Y235H | BLCA | 1 |
| p.E266* | UCEC | 1 |
| p.L168I | LUAD | 1 |
| p.S265T | LUSC | 1 |
| p.P99S | HNSC | 1 |
| p.S187* | STAD | 1 |
| p.S74Y | ESCA | 1 |
| p.W230X | THYM | 1 |
| p.K361N | STAD | 1 |
| p.R38L | COAD | 1 |
| p.R38C | COAD | 1 |
| p.G241V | LUAD | 1 |
| p.G350E | SKCM | 1 |
| p.G106E | LUAD | 1 |
| p.W183* | HNSC | 1 |
| p.L328F | STAD | 1 |
| p.V392I | STAD | 1 |
| p.Q186E | LUAD | 1 |
| p.G405R | UCEC | 1 |
| p.P387L | COAD | 1 |
| p.W152* | STAD | 1 |
| p.K283N | STAD | 1 |
| p.S108P | READ | 1 |
| p.I165T | COAD | 1 |
| p.F88L | LUAD | 1 |
| p.Q197L | LUAD | 1 |
| p.L429F | SKCM | 1 |
| p.R199Q | SKCM | 1 |
| p.P339S | SKCM | 1 |
| p.I115M | BLCA | 1 |
| p.L409X | READ | 1 |
| p.A100T | COAD | 1 |
| p.L357F | LAML | 1 |
| p.S108T | OV | 1 |
| p.S305N | LUAD | 1 |
| p.L451F | SKCM | 1 |
| p.S80C | HNSC | 1 |
| p.P339L | SKCM | 1 |
| p.Y316* | LUAD | 1 |
| p.A391V | PAAD | 1 |
| p.P445H | UCEC | 1 |
| p.W261* | HNSC | 1 |
| p.V166A | UCEC | 1 |
| p.H46R | BRCA | 1 |
| p.V82E | SKCM | 1 |
| p.T51A | STAD | 1 |
| p.E191K | SKCM | 1 |
| p.Y39C | LUAD | 1 |
| p.S215Y | STAD | 1 |
| p.V243I | UCEC | 1 |
| p.R434T | HNSC | 1 |
| p.R141Q | BLCA | 1 |
| p.E488* | UCEC | 1 |
| p.T70I | LUAD | 1 |
| p.K4N | CESC | 1 |
| p.E379K | BLCA | 1 |
| p.S74Y | HNSC | 1 |
| p.G405V | LUAD | 1 |
| p.G459E | LGG | 1 |
| p.D78A | UCEC | 1 |
| p.G135R | SKCM | 1 |
| p.S126R | BLCA | 1 |
| p.S74F | SARC | 1 |
| p.L207S | BLCA | 1 |
| p.G117D | PAAD | 1 |
| p.G279V | LUSC | 1 |
| Top |
| TissGeneCNV for SLC17A3 |
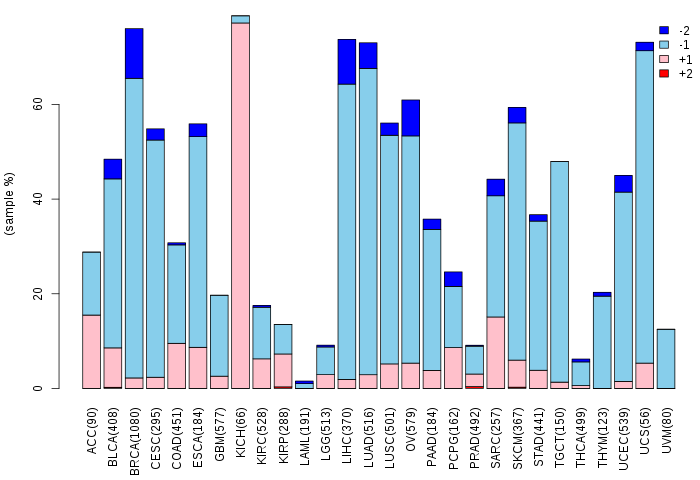
| Copy number variations of TissGene across 28 cancer types (X-axis: cancer type and Y-axis: % of CNV samples) (TCGA Gistic2_CopyNumber_Gistic2_all_data_by_genes, Gistic2 copy number data, version 2016-08-16) |
 |
| Top |
| TissGeneFusions for SLC17A3 |
| Fusion genes including TissGene (ChimerDB 3.0, 2016-12-01 and TCGA fusion Portal 2015-12-01) |
| Database | Src | Cancer type | Sample | Fusion gene | ORF | 5'-gene BP | 3'-gene BP |
| Top |
| TissGeneNet for SLC17A3 |
| Co-expressed gene networks based on protein-protein interaction data (CePIN) (TCGA IlluminaHiSeq_RNASeqV2, pan-cancer normalized log2(norm_counts+1) data, version 2016-08-16) (PINA2 ppi data) |
| Top |
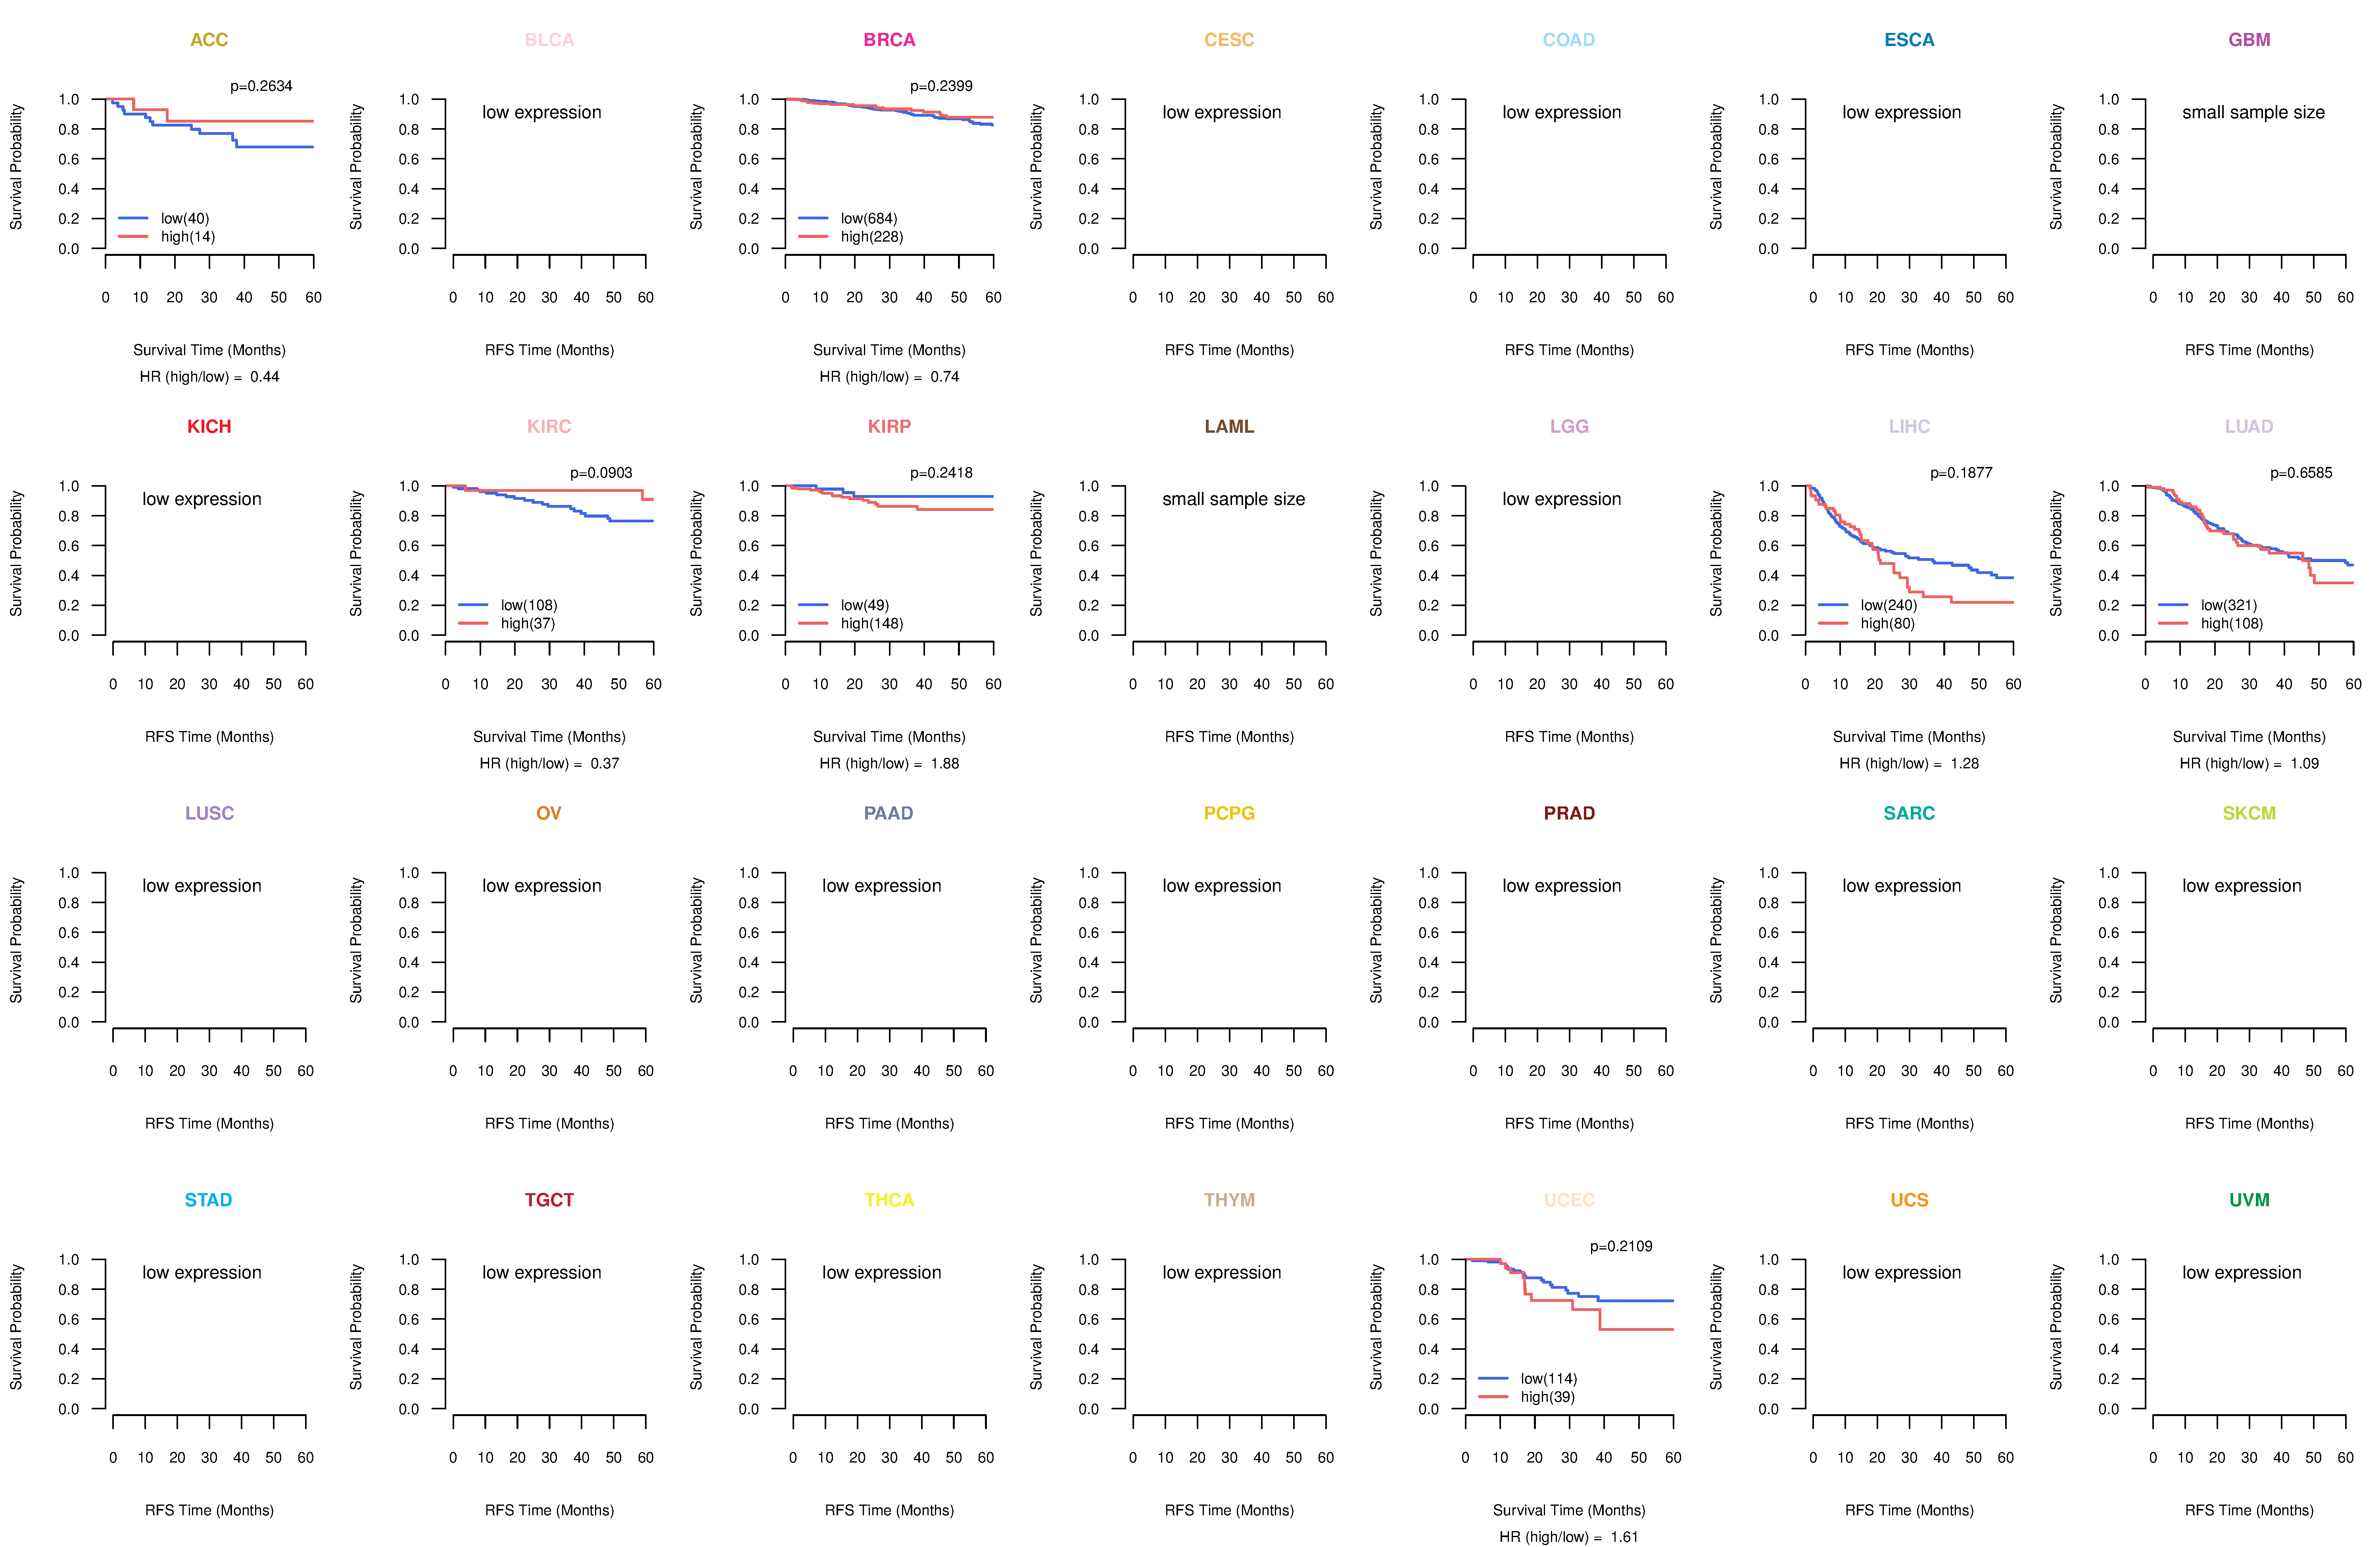
| TissGeneProg for SLC17A3 |
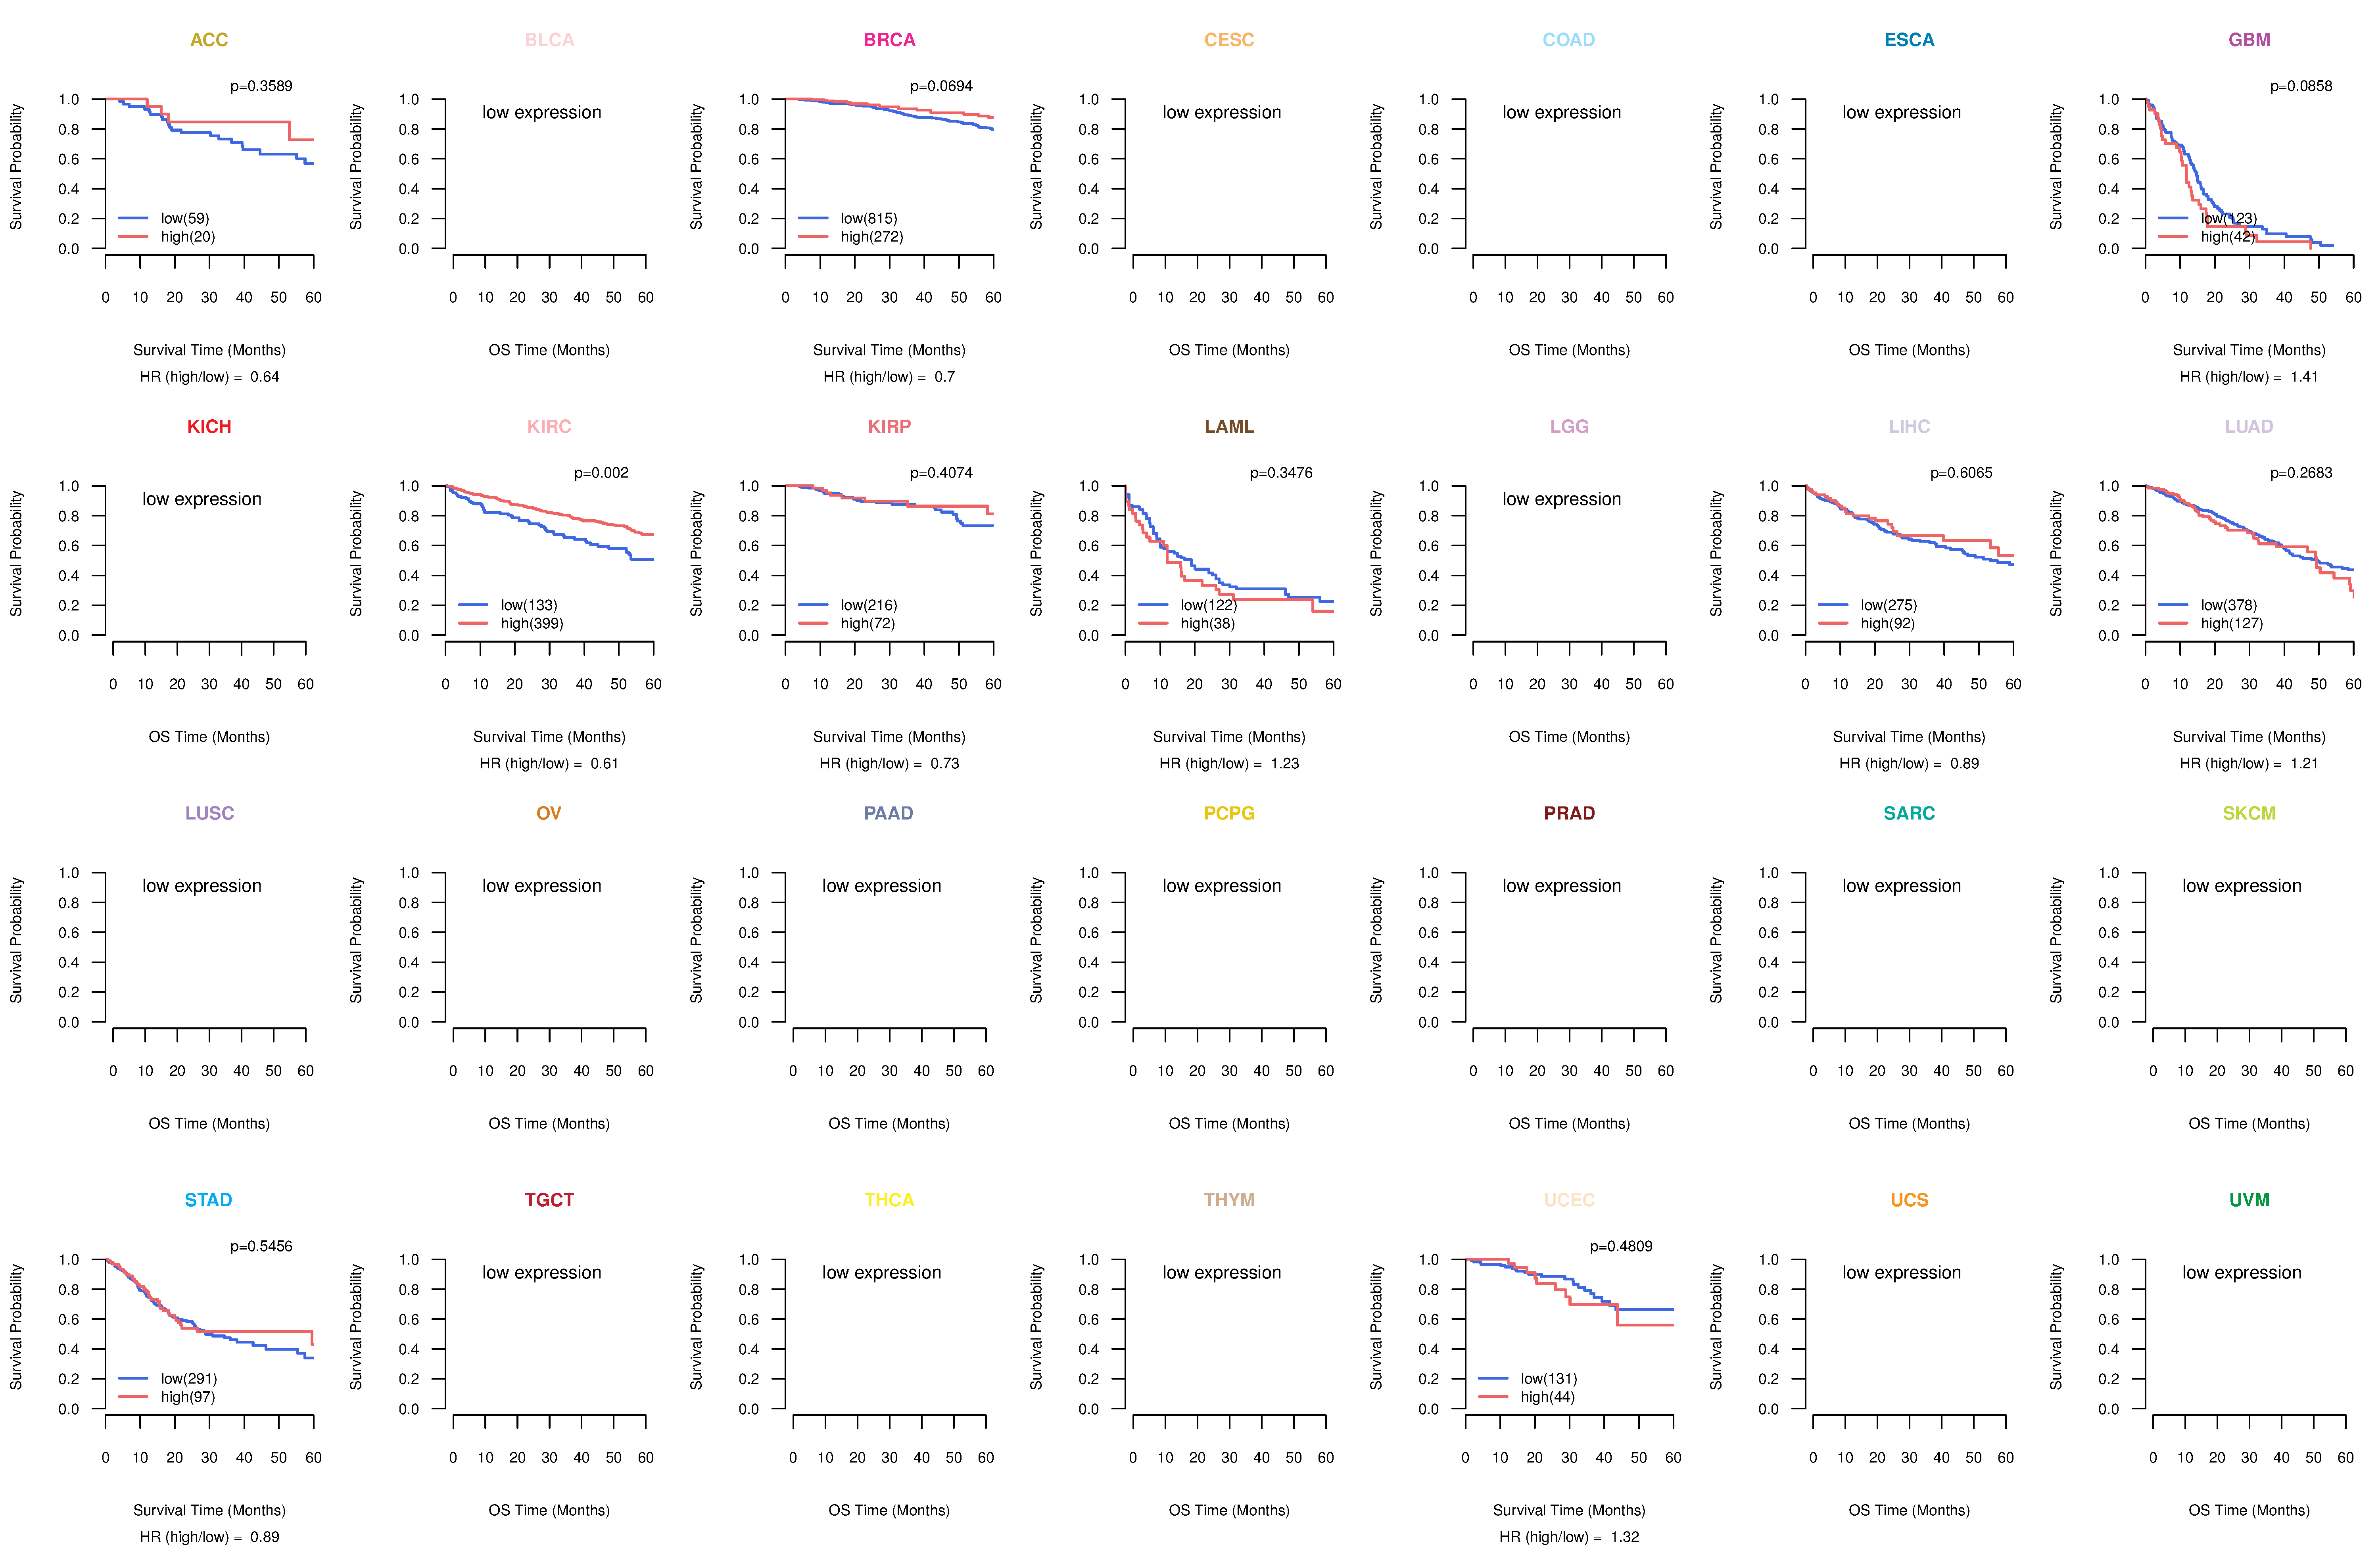
| Kaplan-Meier plots with logrank tests of overall survival (OS) using 28 cancer types (TCGA IlluminaHiSeq_RNASeqV2, pan-cancer normalized log2(norm_counts+1) data, version 2016-08-16) (TCGA clinicalMatrix, phenotype data, version 2016-04-27) * Click on the image to enlarge it in a new window. |
 |
| Kaplan-Meier plots with logrank test of relapse free survival (RFS) using 28 cancer types (TCGA IlluminaHiSeq_RNASeqV2, pan-cancer normalized log2(norm_counts+1) data, version 2016-08-16) (TCGA clinicalMatrix, phenotype data, version 2016-04-27) * Click on the image enlarge it in a new window. |
 |
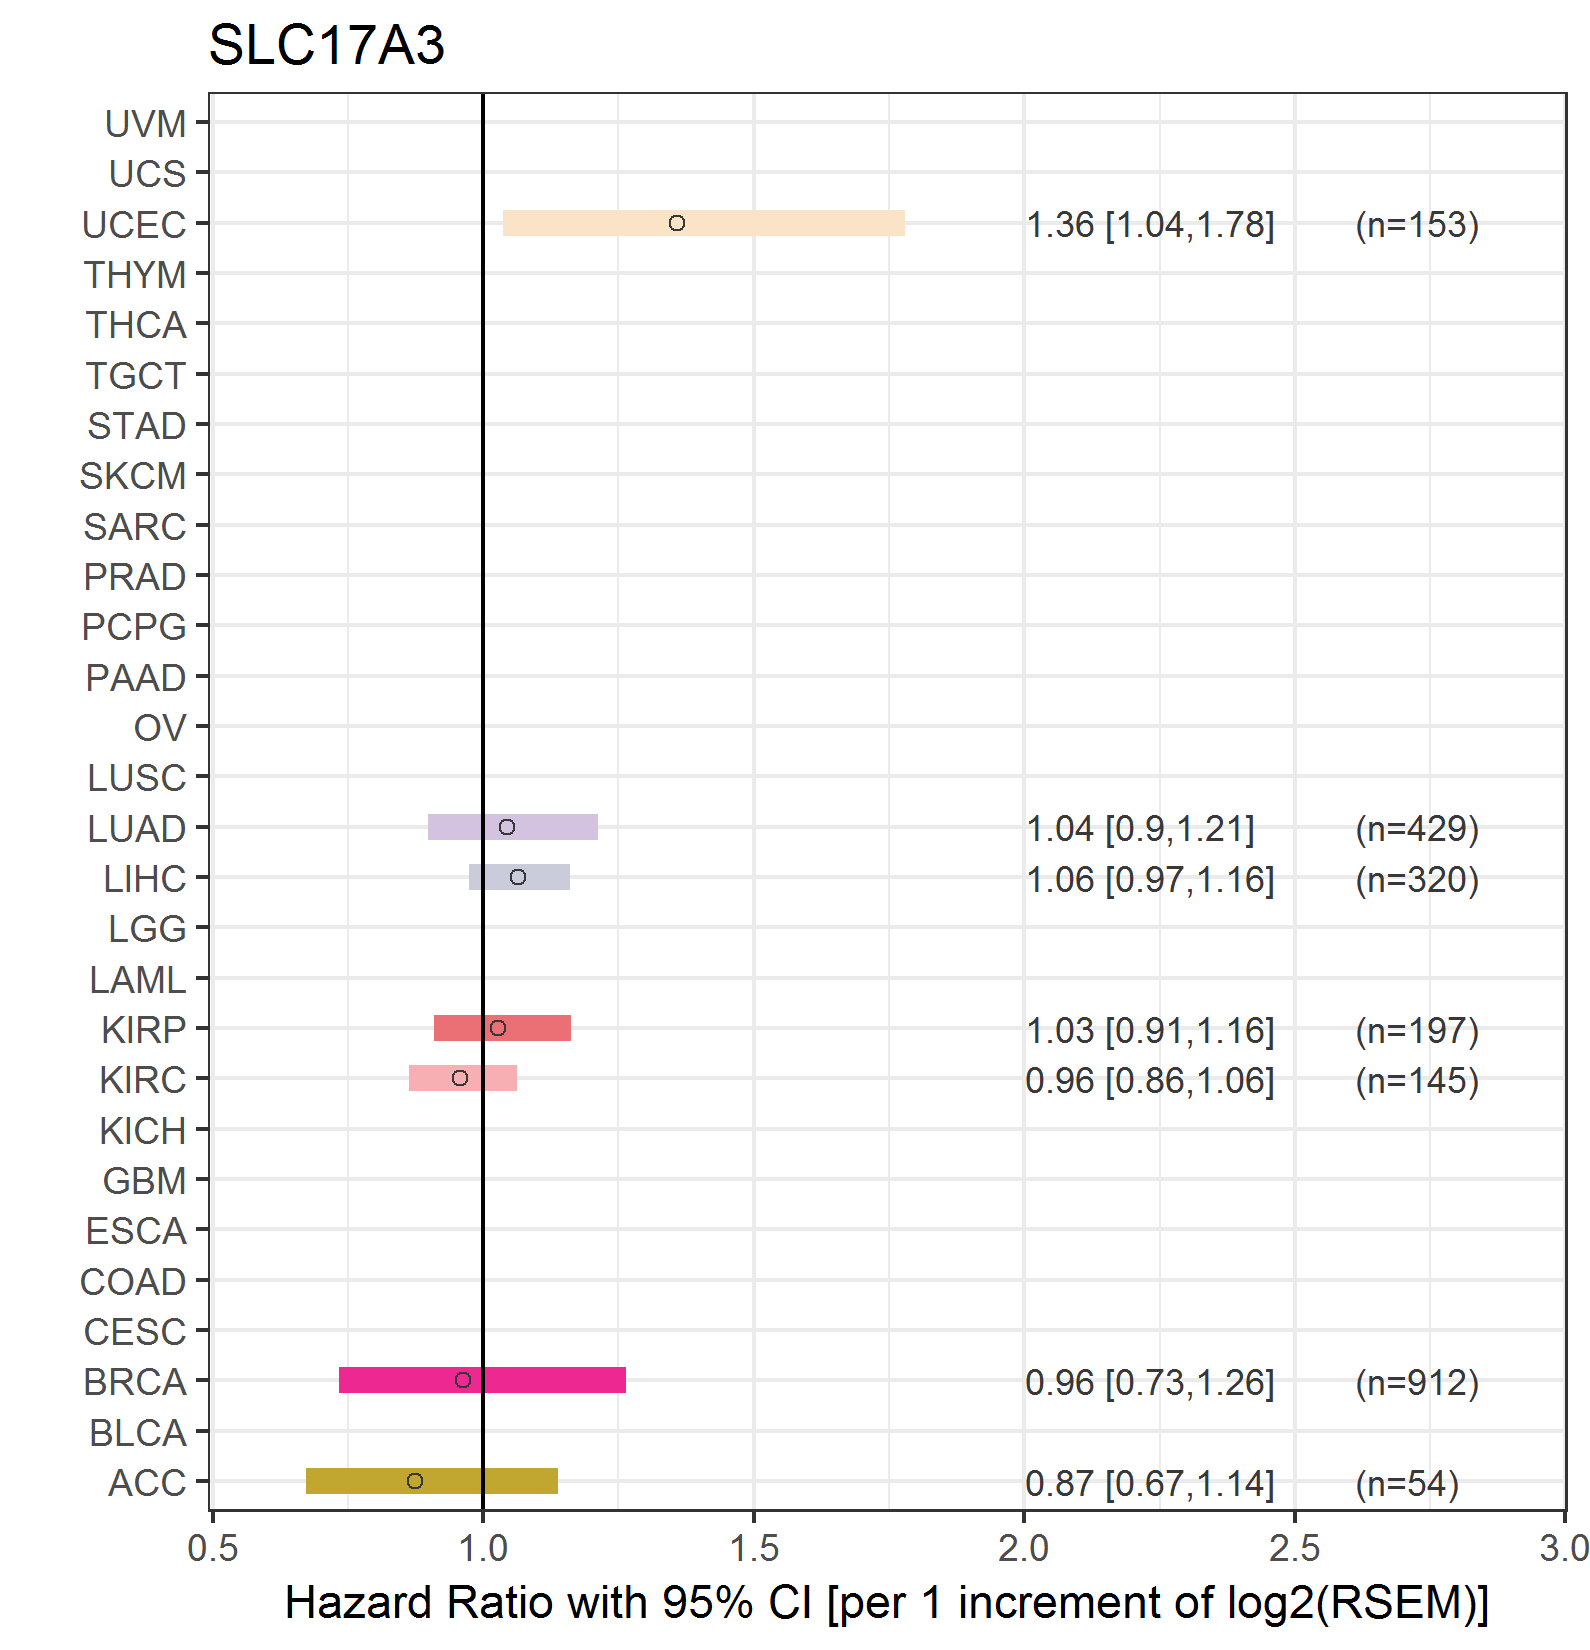
| Forest plot of Cox proportional hazard ratio (HR) and 95% CI of overall survival (OS) using 28 cancer types (TCGA IlluminaHiSeq_RNASeqV2, pan-cancer normalized log2(norm_counts+1) data, version 2016-08-16) (TCGA clinicalMatrix, phenotype data, version 2016-04-27) * Click on the image enlarge it in a new window. |
 |
| Forest plot of Cox proportional hazard ratio (HR) and 95% CI of relapse free survival (RFS) using 28 cancer types (TCGA IlluminaHiSeq_RNASeqV2, pan-cancer normalized log2(norm_counts+1) data, version 2016-08-16) (TCGA clinicalMatrix, phenotype data, version 2016-04-27) * Click on the image enlarge it in a new window. |
 |
| Top |
| TissGeneClin for SLC17A3 |
| TissGeneDrug for SLC17A3 |
| Drug information targeting TissGene (DrugBank Version 5.0.6, 2017-04-01) |
| DrugBank ID | Drug name | Drug activity | Drug type | Drug status |
| Top |
| TissGeneDisease for SLC17A3 |
| Disease information associated with TissGene (DisGeNet, 2016-06-01) |
| Disease ID | Disease name | # pubmeds | Source |
| umls:C0018099 | Gout | 2 | GAD |
| umls:C0000786 | Spontaneous abortion | 1 | GAD |
| umls:C0036341 | Schizophrenia | 1 | GAD |
| umls:C0040336 | Tobacco Use Disorder | 1 | GAD |
| umls:C0342749 | GLYCOGEN STORAGE DISEASE Ic | 1 | BeFree |
| umls:C0740394 | Hyperuricemia | 1 | GAD |
| umls:C0948008 | Ischemic stroke | 1 | BeFree |
| umls:C1261502 | Finding of Mean Corpuscular Hemoglobin | 1 | GAD |
| umls:C3272363 | Ischemic Cerebrovascular Accident | 1 | BeFree |
| umls:C2675207 | URIC ACID CONCENTRATION, SERUM, QUANTITATIVE TRAIT LOCUS 4 | 0 | CLINVAR |
|
Copyright 2016-Present - The University of Texas Health Science Center at Houston (UTHealth) Web File Viewing | How to Report, Fraud, Waste and Abuse | State of Texas | Statewide Search | Texas Homeland Security | Site Policies |