 |
| |
| |
| |
| |
| |
| |
|

| TissGeneSummary for FTCD |
 Gene summary Gene summary |
| Basic gene information | Gene symbol | FTCD |
| Gene name | formimidoyltransferase cyclodeaminase | |
| Synonyms | LCHC1 | |
| Cytomap | UCSC genome browser: 21q22.3 | |
| Type of gene | protein-coding | |
| RefGenes | NM_006657.2, NM_206965.1, | |
| Description | formimidoyltransferase-cyclodeaminaseformiminotransferase cyclodeaminaseformiminotransferase-cyclodeaminase | |
| Modification date | 20141207 | |
| dbXrefs | MIM : 606806 | |
| HGNC : HGNC | ||
| Ensembl : ENSG00000160282 | ||
| HPRD : 08430 | ||
| Vega : OTTHUMG00000090488 | ||
| Protein | UniProt: go to UniProt's Cross Reference DB Table | |
| Expression | CleanEX: HS_FTCD | |
| BioGPS: 10841 | ||
| Pathway | NCI Pathway Interaction Database: FTCD | |
| KEGG: FTCD | ||
| REACTOME: FTCD | ||
| Pathway Commons: FTCD | ||
| Context | iHOP: FTCD | |
| ligand binding site mutation search in PubMed: FTCD | ||
| UCL Cancer Institute: FTCD | ||
| Assigned class in TissGDB* | C | |
| Included tissue-specific gene expression resources | TiGER,GTEx | |
| Specific-tissues in normal samples (assigned by TissGDB using HPA, TiGER, and GTEx) | KidneyLiver | |
| Cancer types related to the specific-tissues in cancer samples (assigned by TissGDB using TCGA) | KIRC,KIRP,KICHLIHC | |
| Reference showing the relevant tissue of FTCD | ||
| Description by TissGene annotations | Have significant anti-correlated miRNA TissgsKTS | |
| * Class A consists of genes with literature evidence and is part of the cTissGenes. Class B consists of only cTissGenes without additional evidence. The remaining genes belong to Class C. |
| Gene ontology having evidence of Inferred from Direct Assay (IDA) from Entrez |
| GO ID | GO term | PubMed ID |
| Top |
| TissGeneExp for FTCD |
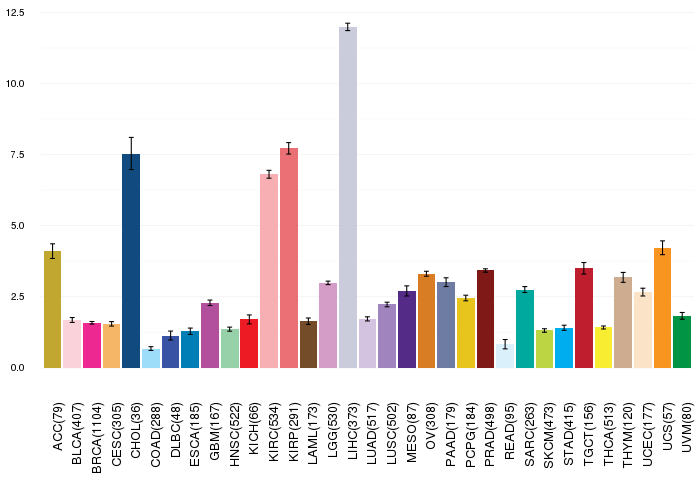
| Gene expressions across 28 cancer types (X-axis: cancer type and Y-axis: log2(norm_counts+1)) (TCGA IlluminaHiSeq_RNASeqV2, pan-cancer normalized log2(norm_counts+1) data, version 2016-08-16) |
 |
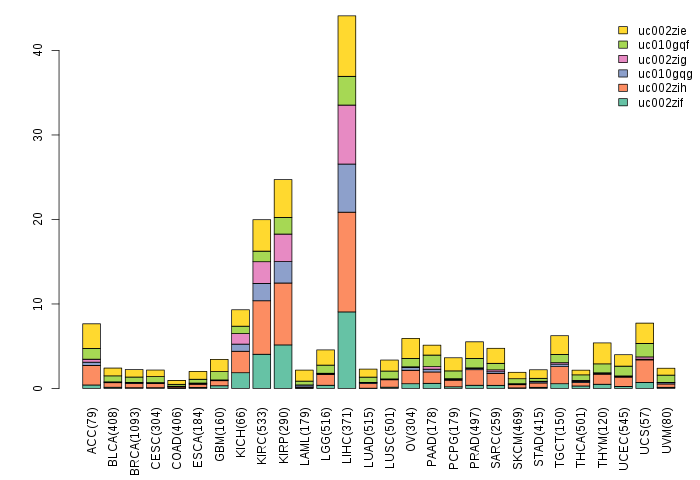
| Gene isoform expressions across 28 cancer types (X-axis: cancer type and Y-axis: log2(norm_counts+1)) (TCGA pan-cancer tcga_rsem_isoform_tpm, version 2016-09-01) |
 |
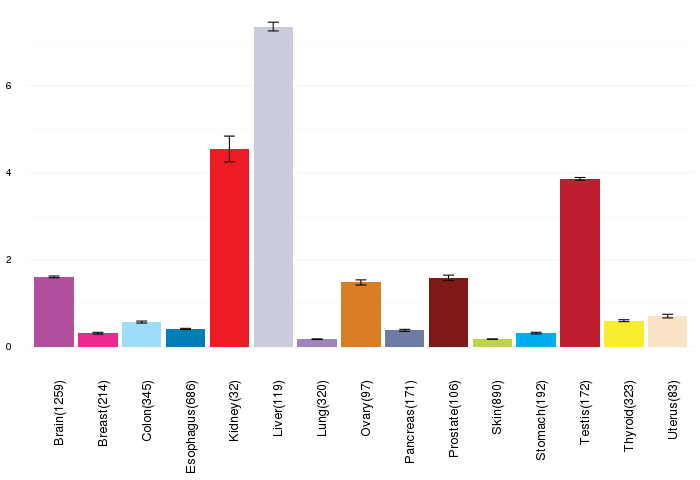
| Gene expressions across normal tissues of GTEx data (GTEx GTEx_Analysis_v6_RNA-seq_RNA-SeQCv1.1.8_gene_rpkm.gct) - Here, we shows the matched tissue types only among our 28 cancer types. |
 |
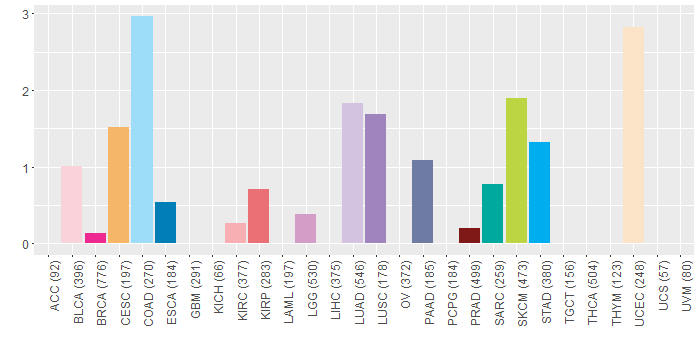
| Different expressions across 14 cancer types with more than 10 samples between matched tumors and normals (X-axis: cancer type and Y-axis: log2(norm_counts+1)) (TCGA IlluminaHiSeq_RNASeqV2, pan-cancer normalized log2(norm_counts+1) data, version 2016-08-16) |
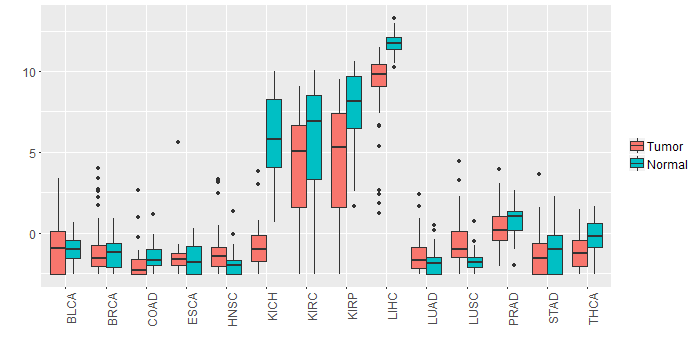 |
| - Significantly differentially expressed cancer types and information. (|Fold change|>1 and FDR<0.05) |
| Cancer type | Mean(exp) in tumor | Mean(exp) in matched normal | Log2FC | P-val. | FDR |
| LUSC | -0.5117557 | -1.716500798 | 1.204745098 | 1.67E-06 | 4.05E-06 |
| THCA | -1.223392058 | -0.206198837 | -1.01719322 | 6.72E-07 | 2.60E-06 |
| LIHC | 9.099445163 | 11.74970716 | -2.650262 | 9.95E-10 | 1.09E-08 |
| KICH | -0.663246837 | 6.170377163 | -6.833624 | 6.77E-14 | 1.03E-12 |
| KIRC | 4.171655329 | 5.844971996 | -1.673316667 | 0.00249 | 0.004496446 |
| KIRP | 4.522548038 | 7.767910538 | -3.2453625 | 5.69E-05 | 0.000205758 |
| Top |
| TissGene-miRNA for FTCD |
| Significantly anti-correlated miRNAs of TissGene across 28 cancer types (Gene-miRNA relations from TargetScanHuman Relsease 7.1, Conserved_Site_Context_Scores.txt.zip, 06.01.2016) (TCGA IlluminaHiSeq_miRNASeq, log2(RPM+1) data, version 2016-11-21) (TCGA IlluminaHiSeq_RNASeqV2, log2(normalized_count+1) data, version 2016-08-16) (Spearman’s Rank Correlation (p-value<0.05 and coefficient<-0.25)) |
| Cancer type | miRNA id | miRNA accession | P-val. | Coeff. | # samples |
| ACC | hsa-miR-6884-5p | MIMAT0027668 | 0.018 | -0.27 | 78 |
| ACC | hsa-miR-6884-5p | MIMAT0027668 | 0.018 | -0.27 | 78 |
| LUAD | hsa-miR-29a-3p | MIMAT0000086 | 0.01 | -0.33 | 60 |
| Top |
| TissGeneMut for FTCD |
| TissGeneSNV for FTCD |
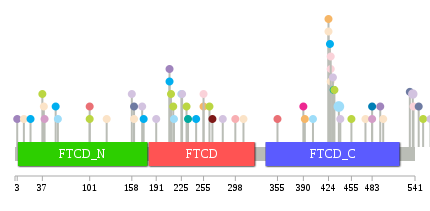
| nsSNV counts per each loci. Different colors of circles represent different cancer types. Circle size denotes number of samples. (TCGA somatic mutation (SNPs and small INDELs) data, version 2016-04-25) * Click on the image to enlarge it in a new window. |
 |
 |
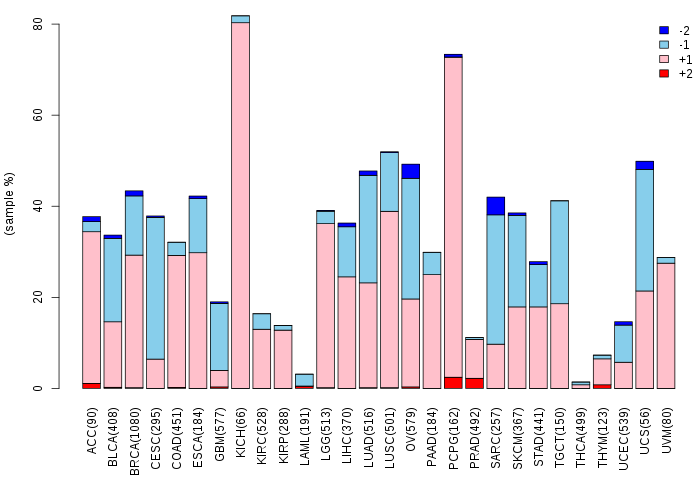
| Somatic nucleotide variants of TissGene across 28 cancer types (X-axis: cancer type and Y-axis: % of mutated samples) The numbers in parentheses are numbers of samples with mutation (nsSNVs). (TCGA somatic mutation (SNPs and small INDELs) data, version 2016-04-25) |
 |
| - nsSNVs sorted by frequency. |
| AAchange | Cancer type | # samples |
| p.A438V | COAD | 4 |
| p.R538L | LUAD | 2 |
| p.G191V | LUAD | 1 |
| p.V58M | COAD | 1 |
| p.T390A | BRCA | 1 |
| p.A483V | LGG | 1 |
| p.G209A | LUSC | 1 |
| p.R255* | BLCA | 1 |
| p.A281V | LUAD | 1 |
| p.S170R | HNSC | 1 |
| p.A403T | COAD | 1 |
| p.A245S | STAD | 1 |
| p.W158C | LUAD | 1 |
| p.L309R | UCEC | 1 |
| p.E539* | BLCA | 1 |
| p.V234M | SARC | 1 |
| p.D39G | UCEC | 1 |
| p.K427R | BLCA | 1 |
| p.P263S | SKCM | 1 |
| p.E431D | SARC | 1 |
| p.D534V | PAAD | 1 |
| p.T174M | STAD | 1 |
| p.Q3* | LUSC | 1 |
| p.G209V | STAD | 1 |
| p.D21N | STAD | 1 |
| p.Y225H | COAD | 1 |
| p.V101M | SKCM | 1 |
| p.D161N | UCEC | 1 |
| p.D211N | SKCM | 1 |
| p.R215H | COAD | 1 |
| p.S12L | UCEC | 1 |
| p.D474N | UCEC | 1 |
| p.P55L | STAD | 1 |
| p.S267* | PRAD | 1 |
| p.R255* | CESC | 1 |
| p.K427N | UCEC | 1 |
| p.D37N | SKCM | 1 |
| p.A483V | ESCA | 1 |
| p.Y124H | UCEC | 1 |
| p.G172V | LUAD | 1 |
| p.G214R | SKCM | 1 |
| p.P552S | SKCM | 1 |
| p.P562T | LUAD | 1 |
| p.A546T | PAAD | 1 |
| p.P426S | STAD | 1 |
| p.A232T | SKCM | 1 |
| p.G424S | CESC | 1 |
| p.A494T | LUSC | 1 |
| p.D161N | PAAD | 1 |
| p.P455S | SKCM | 1 |
| p.Q298K | KIRC | 1 |
| p.G355A | KIRP | 1 |
| p.R392Q | CESC | 1 |
| p.L226V | LUAD | 1 |
| p.R424M | UCEC | 1 |
| p.A40T | LGG | 1 |
| p.V498M | UCEC | 1 |
| p.Q482* | HNSC | 1 |
| p.E432K | SKCM | 1 |
| p.R215G | HNSC | 1 |
| p.V101M | KIRP | 1 |
| p.P430S | LUAD | 1 |
| p.L440I | LUAD | 1 |
| p.K427N | BLCA | 1 |
| Top |
| TissGeneCNV for FTCD |
| Copy number variations of TissGene across 28 cancer types (X-axis: cancer type and Y-axis: % of CNV samples) (TCGA Gistic2_CopyNumber_Gistic2_all_data_by_genes, Gistic2 copy number data, version 2016-08-16) |
 |
| Top |
| TissGeneFusions for FTCD |
| Fusion genes including TissGene (ChimerDB 3.0, 2016-12-01 and TCGA fusion Portal 2015-12-01) |
| Database | Src | Cancer type | Sample | Fusion gene | ORF | 5'-gene BP | 3'-gene BP |
| Chimerdb3.0 | ChiTaRs | NA | AI040520 | ECH1-FTCD | chr19:39306170 | chr21:47569203 | |
| TCGAfusionPortal | PRADA | BRCA | TCGA-C8-A275-01A | SETD4-FTCD | 5UTR-CDS | Chr21:37432645 | Chr21:47558837 |
| Top |
| TissGeneNet for FTCD |
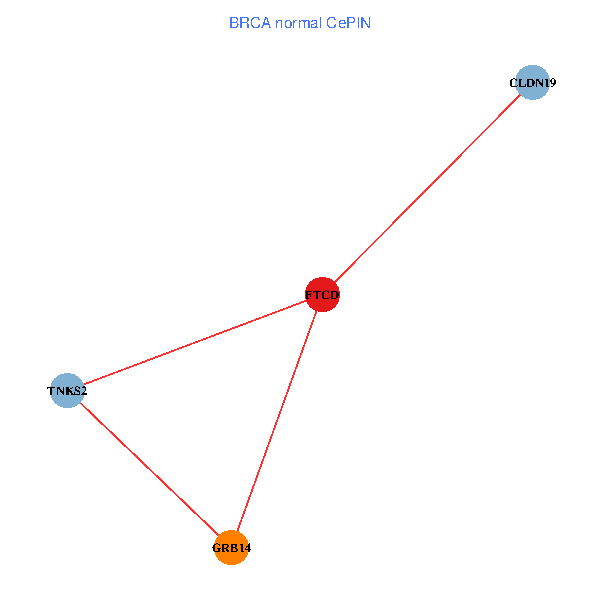
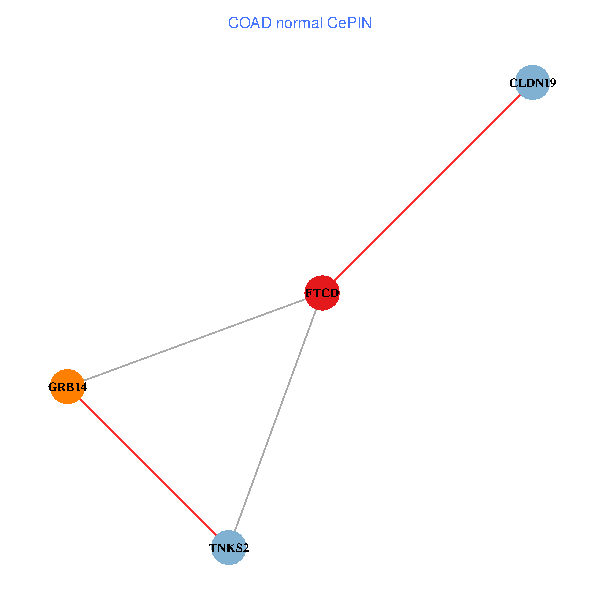
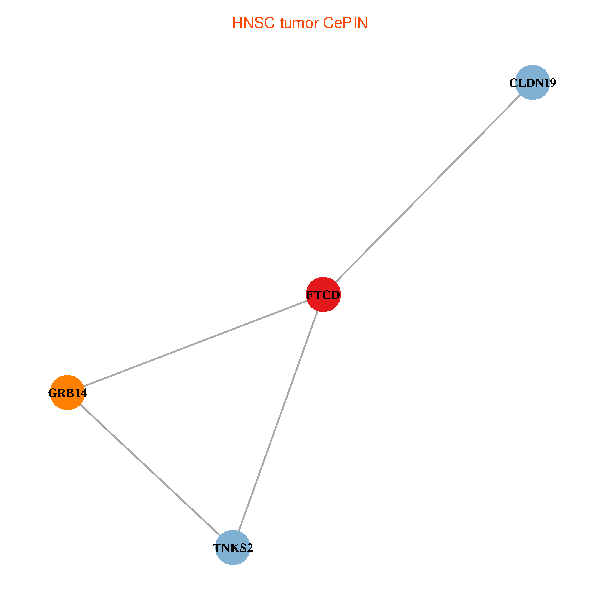
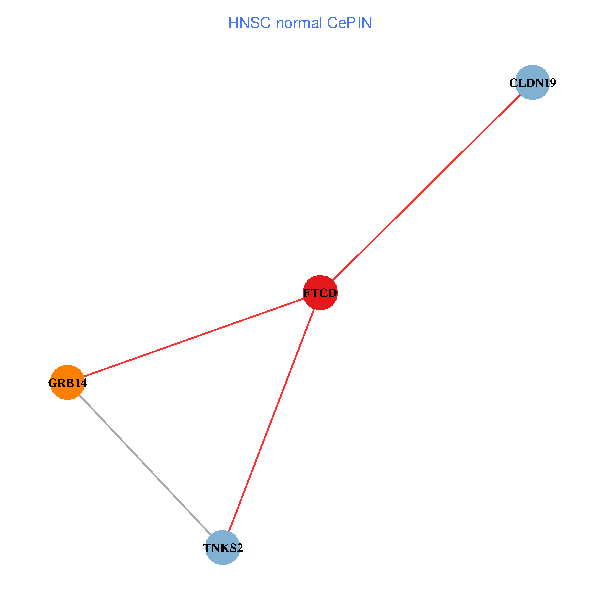
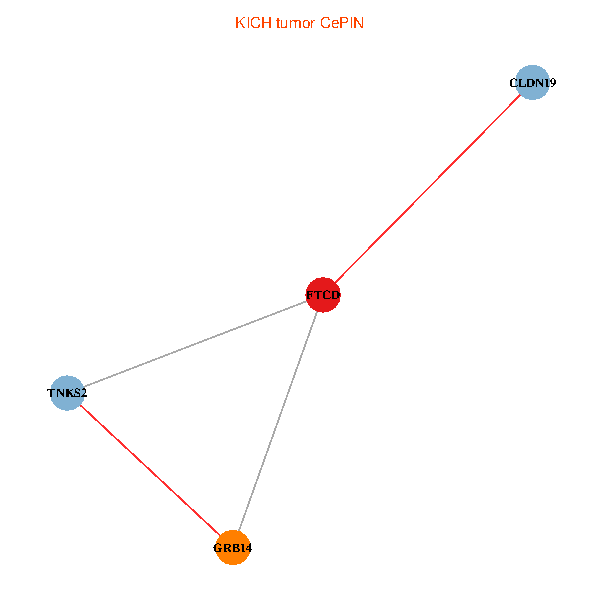
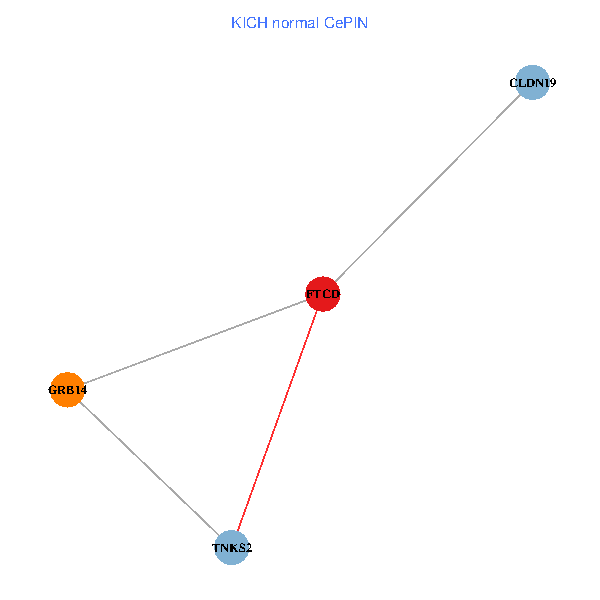
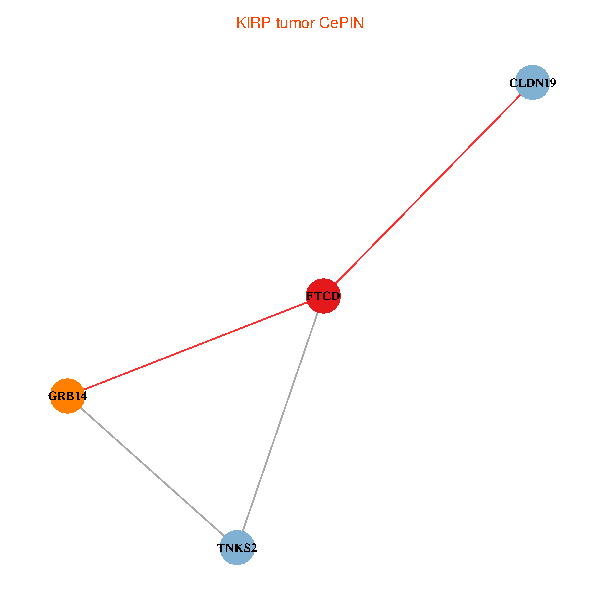
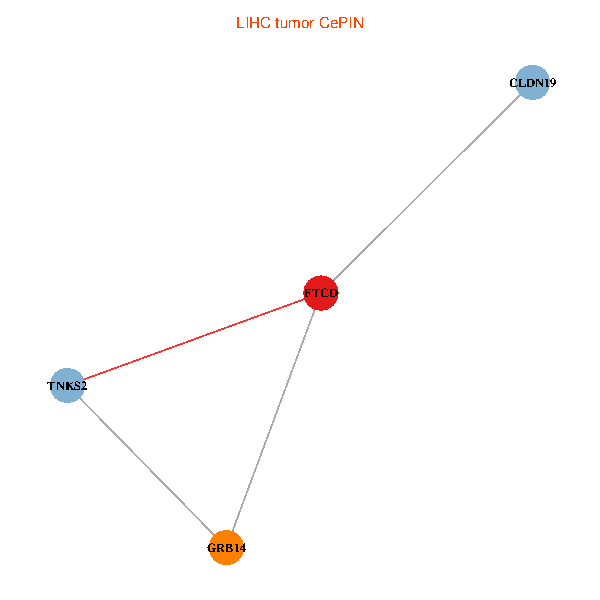
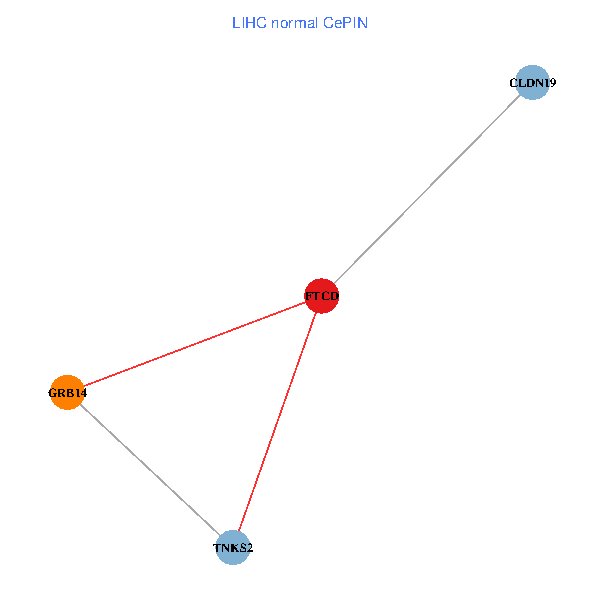
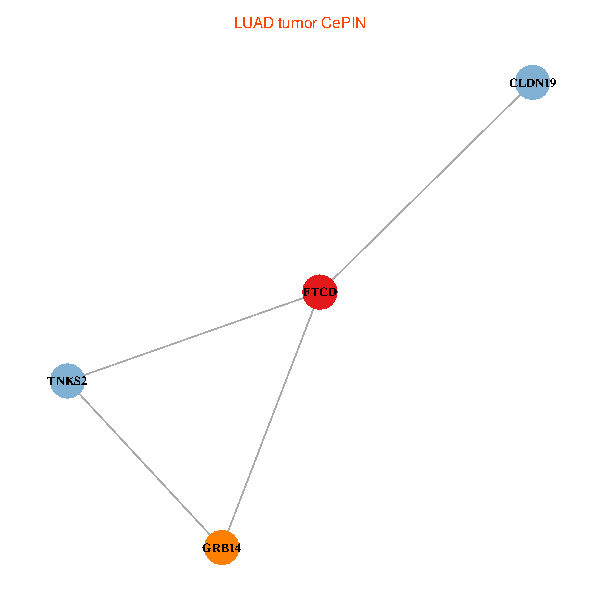
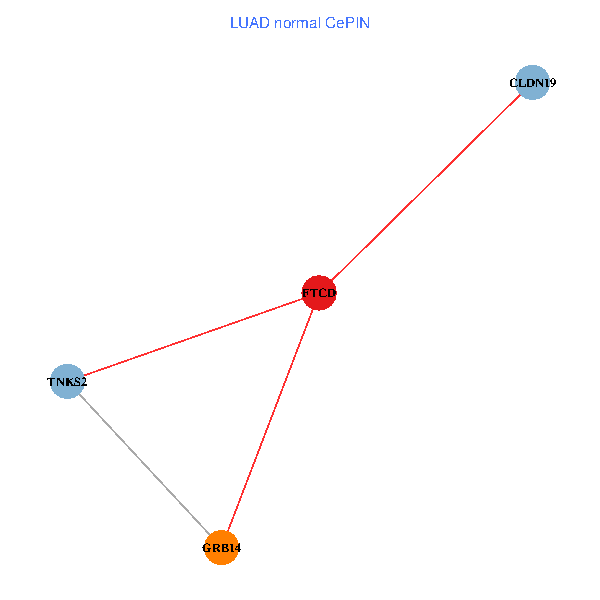
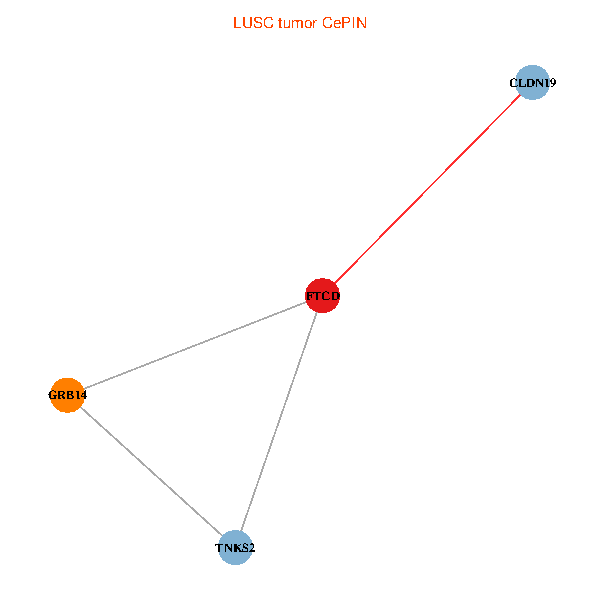
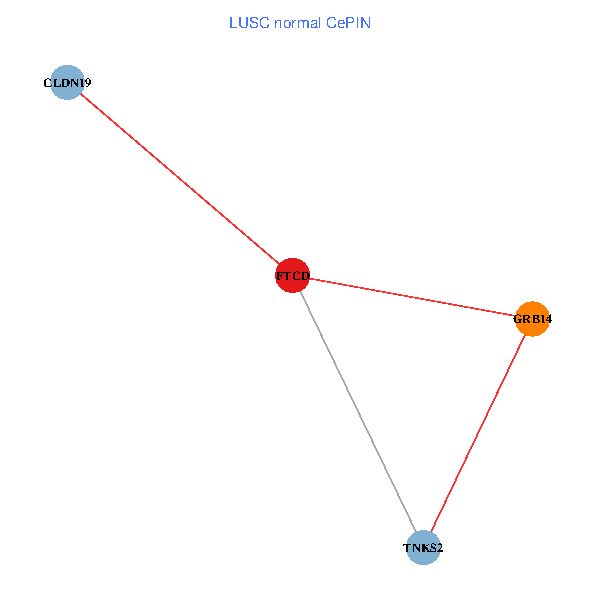
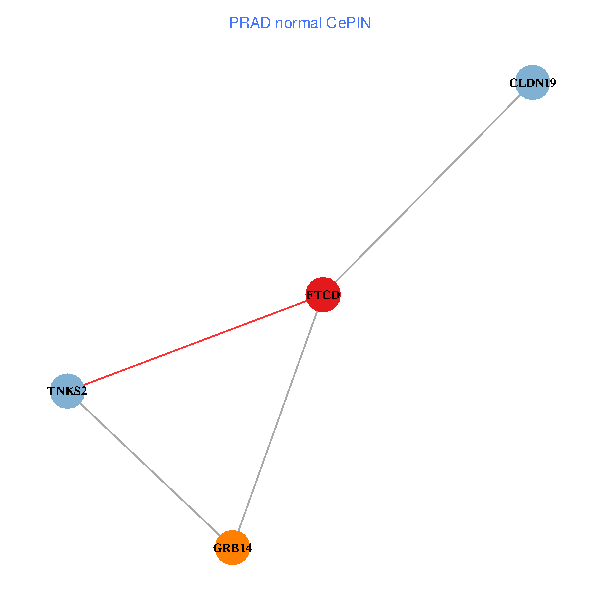
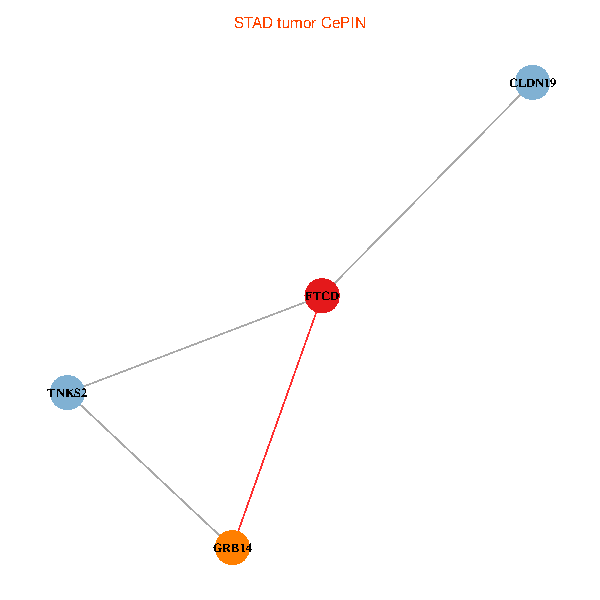
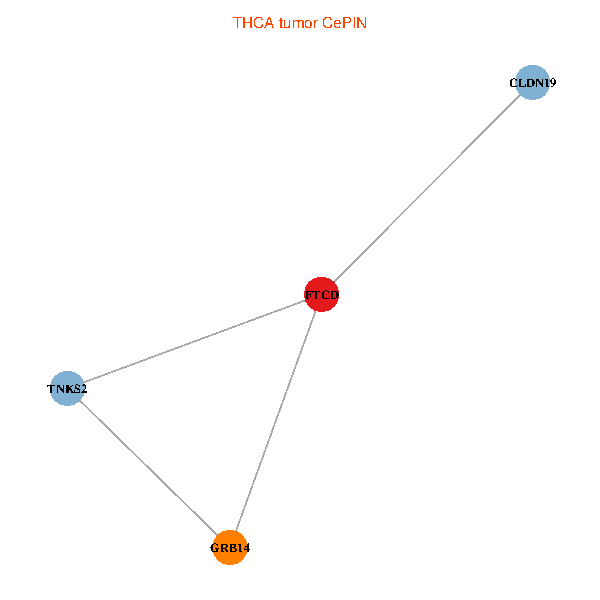
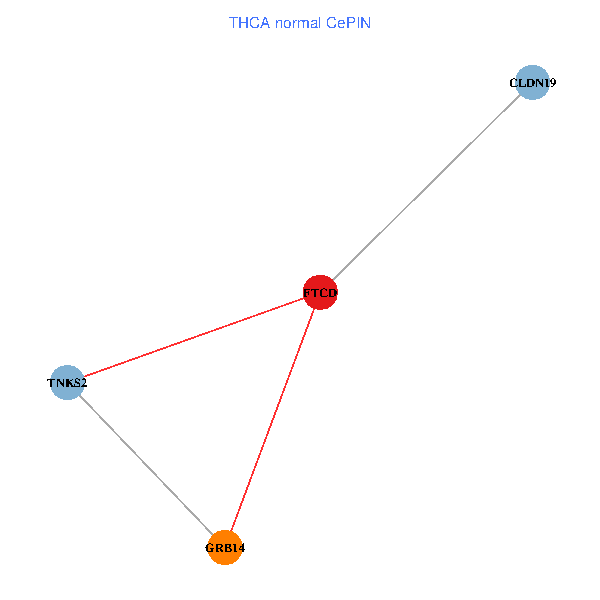
| Co-expressed gene networks based on protein-protein interaction data (CePIN) (TCGA IlluminaHiSeq_RNASeqV2, pan-cancer normalized log2(norm_counts+1) data, version 2016-08-16) (PINA2 ppi data) |
| BRCA (tumor) | BRCA (normal) |
| FTCD, GRB14, TNKS2, CLDN19 (tumor) | FTCD, GRB14, TNKS2, CLDN19 (normal) |
 |  |
| COAD (tumor) | COAD (normal) |
| FTCD, GRB14, TNKS2, CLDN19 (tumor) | FTCD, GRB14, TNKS2, CLDN19 (normal) |
 |  |
| HNSC (tumor) | HNSC (normal) |
| FTCD, GRB14, TNKS2, CLDN19 (tumor) | FTCD, GRB14, TNKS2, CLDN19 (normal) |
 |  |
| KICH (tumor) | KICH (normal) |
| FTCD, GRB14, TNKS2, CLDN19 (tumor) | FTCD, GRB14, TNKS2, CLDN19 (normal) |
 |  |
| KIRC (tumor) | KIRC (normal) |
| FTCD, GRB14, TNKS2, CLDN19 (tumor) | FTCD, GRB14, TNKS2, CLDN19 (normal) |
 |  |
| KIRP (tumor) | KIRP (normal) |
| FTCD, GRB14, TNKS2, CLDN19 (tumor) | FTCD, GRB14, TNKS2, CLDN19 (normal) |
 |  |
| LIHC (tumor) | LIHC (normal) |
| FTCD, GRB14, TNKS2, CLDN19 (tumor) | FTCD, GRB14, TNKS2, CLDN19 (normal) |
 |  |
| LUAD (tumor) | LUAD (normal) |
| FTCD, GRB14, TNKS2, CLDN19 (tumor) | FTCD, GRB14, TNKS2, CLDN19 (normal) |
 |  |
| LUSC (tumor) | LUSC (normal) |
| FTCD, GRB14, TNKS2, CLDN19 (tumor) | FTCD, GRB14, TNKS2, CLDN19 (normal) |
 |  |
| PRAD (tumor) | PRAD (normal) |
| FTCD, GRB14, TNKS2, CLDN19 (tumor) | FTCD, GRB14, TNKS2, CLDN19 (normal) |
 |  |
| STAD (tumor) | STAD (normal) |
| FTCD, GRB14, TNKS2, CLDN19 (tumor) | FTCD, GRB14, TNKS2, CLDN19 (normal) |
 |  |
| THCA (tumor) | THCA (normal) |
| FTCD, GRB14, TNKS2, CLDN19 (tumor) | FTCD, GRB14, TNKS2, CLDN19 (normal) |
 |  |
| Top |
| TissGeneProg for FTCD |
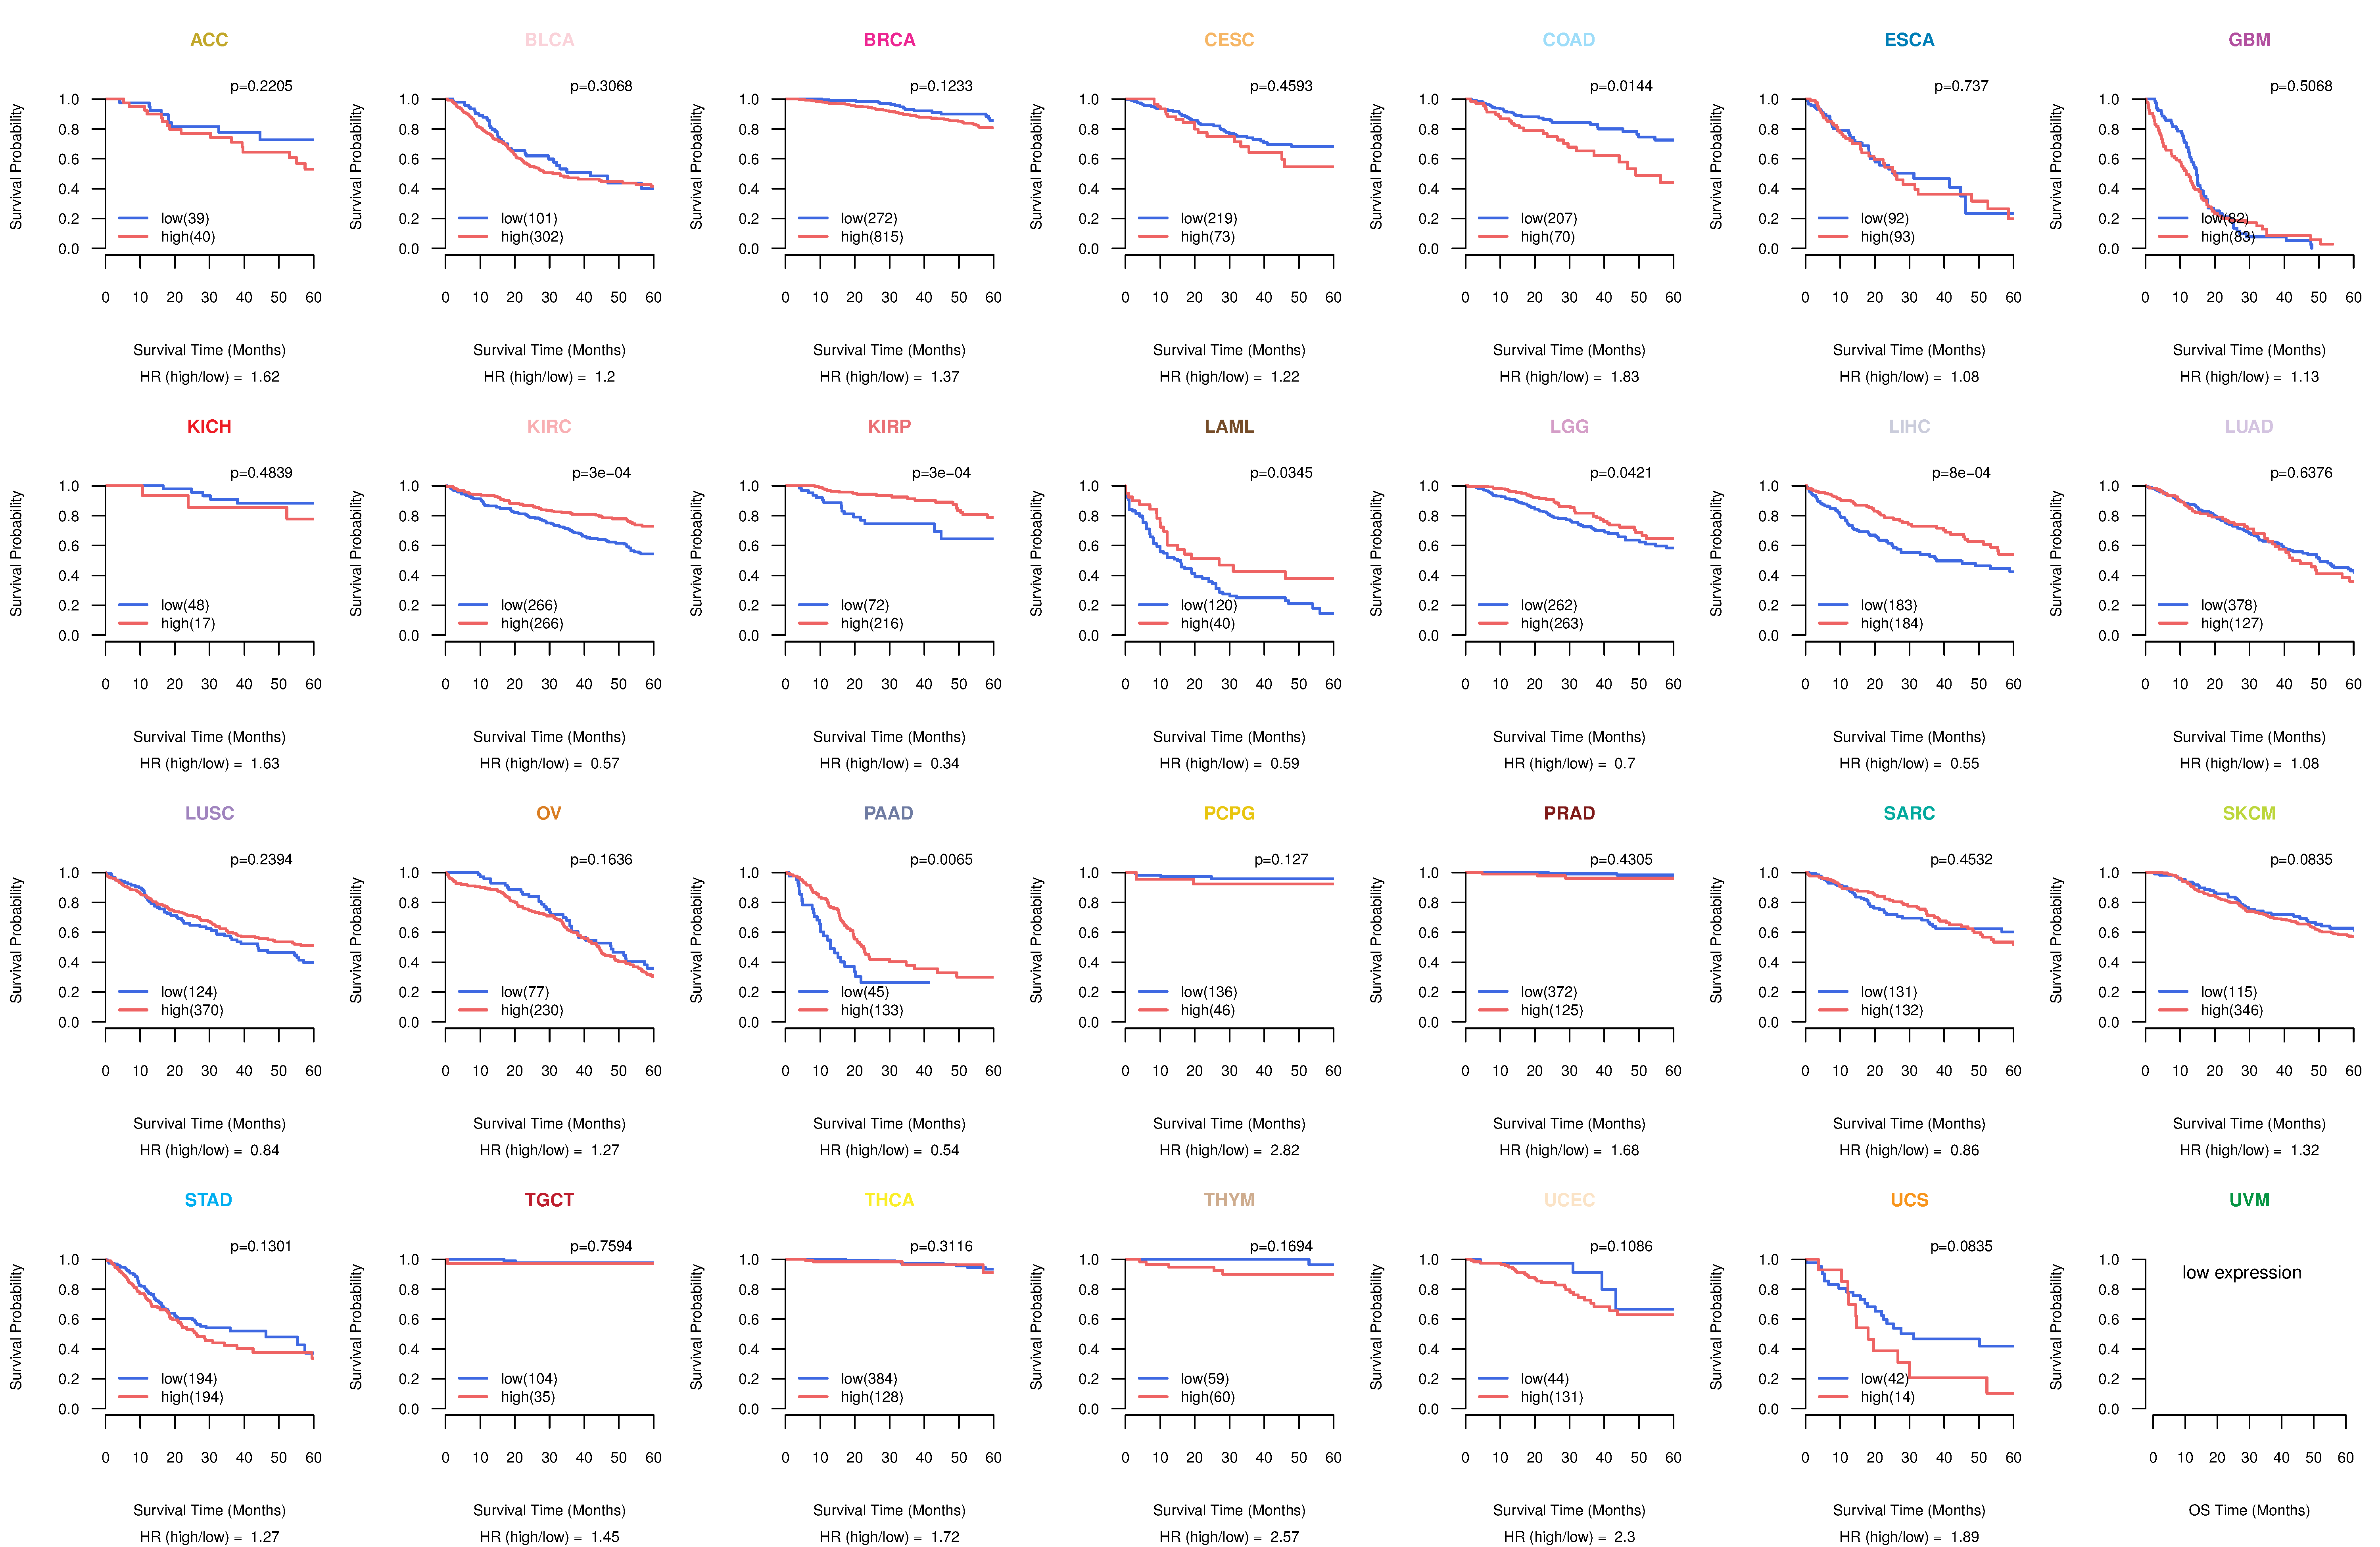
| Kaplan-Meier plots with logrank tests of overall survival (OS) using 28 cancer types (TCGA IlluminaHiSeq_RNASeqV2, pan-cancer normalized log2(norm_counts+1) data, version 2016-08-16) (TCGA clinicalMatrix, phenotype data, version 2016-04-27) * Click on the image to enlarge it in a new window. |
 |
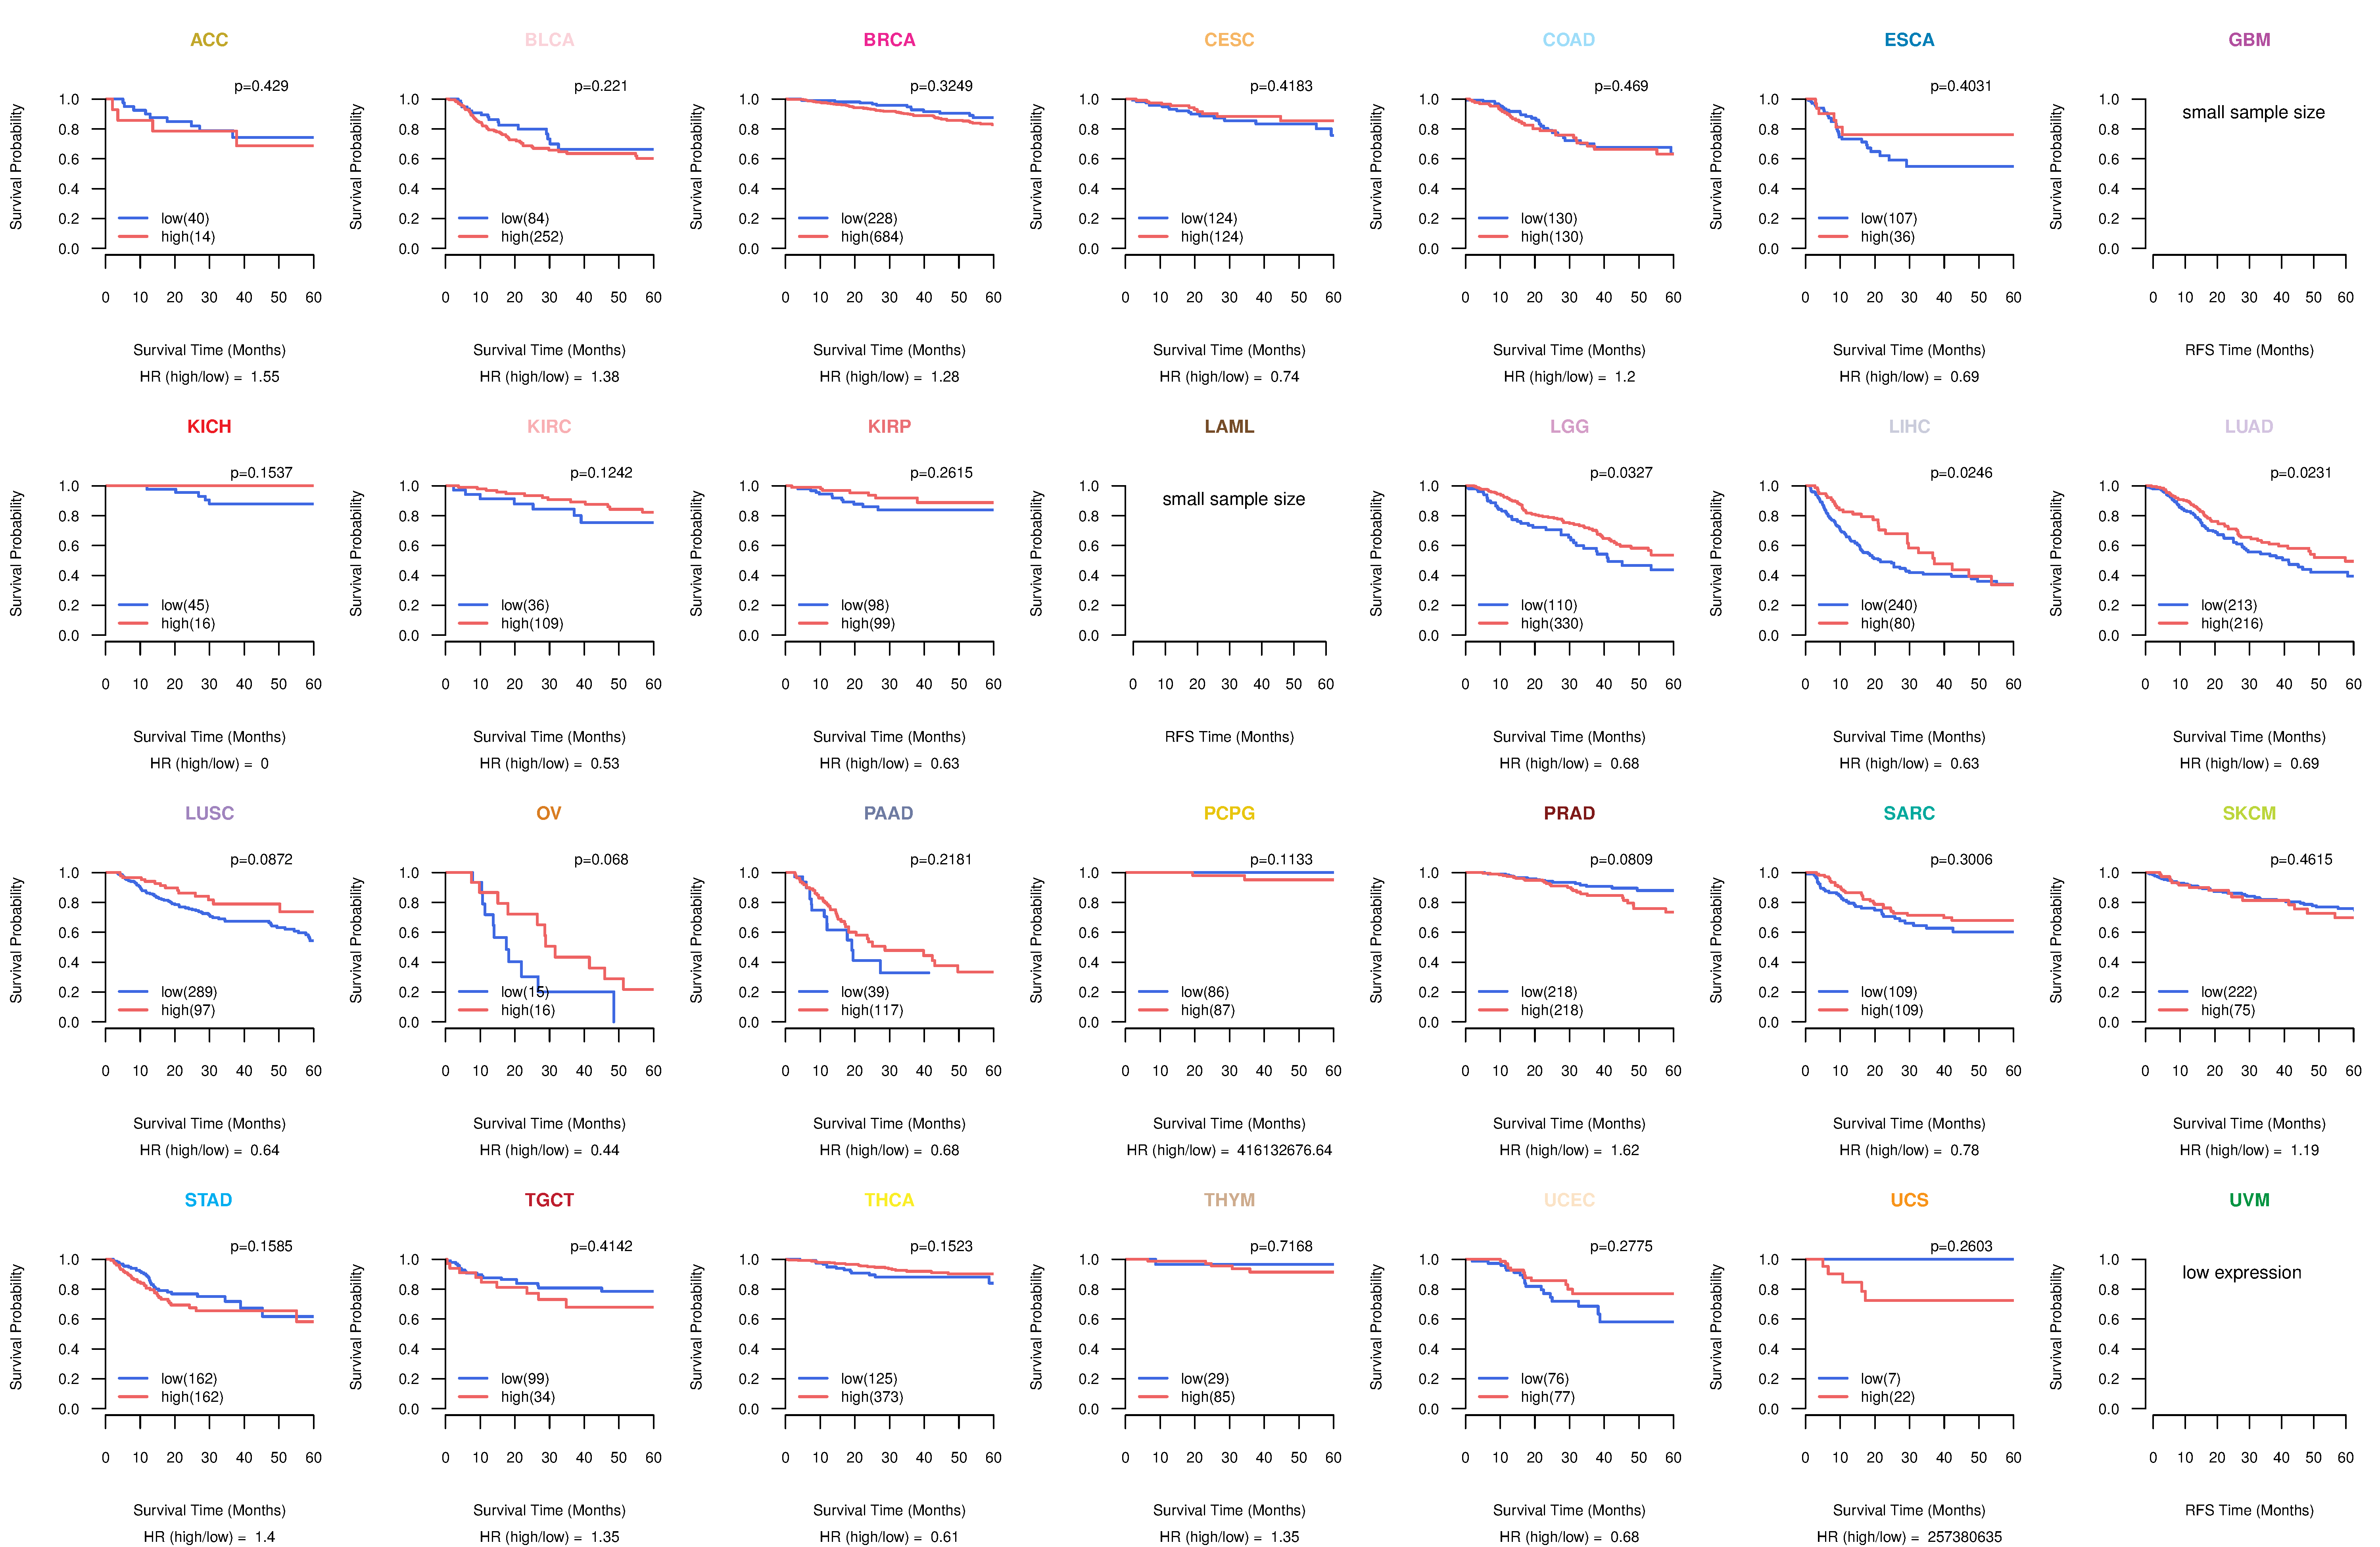
| Kaplan-Meier plots with logrank test of relapse free survival (RFS) using 28 cancer types (TCGA IlluminaHiSeq_RNASeqV2, pan-cancer normalized log2(norm_counts+1) data, version 2016-08-16) (TCGA clinicalMatrix, phenotype data, version 2016-04-27) * Click on the image enlarge it in a new window. |
 |
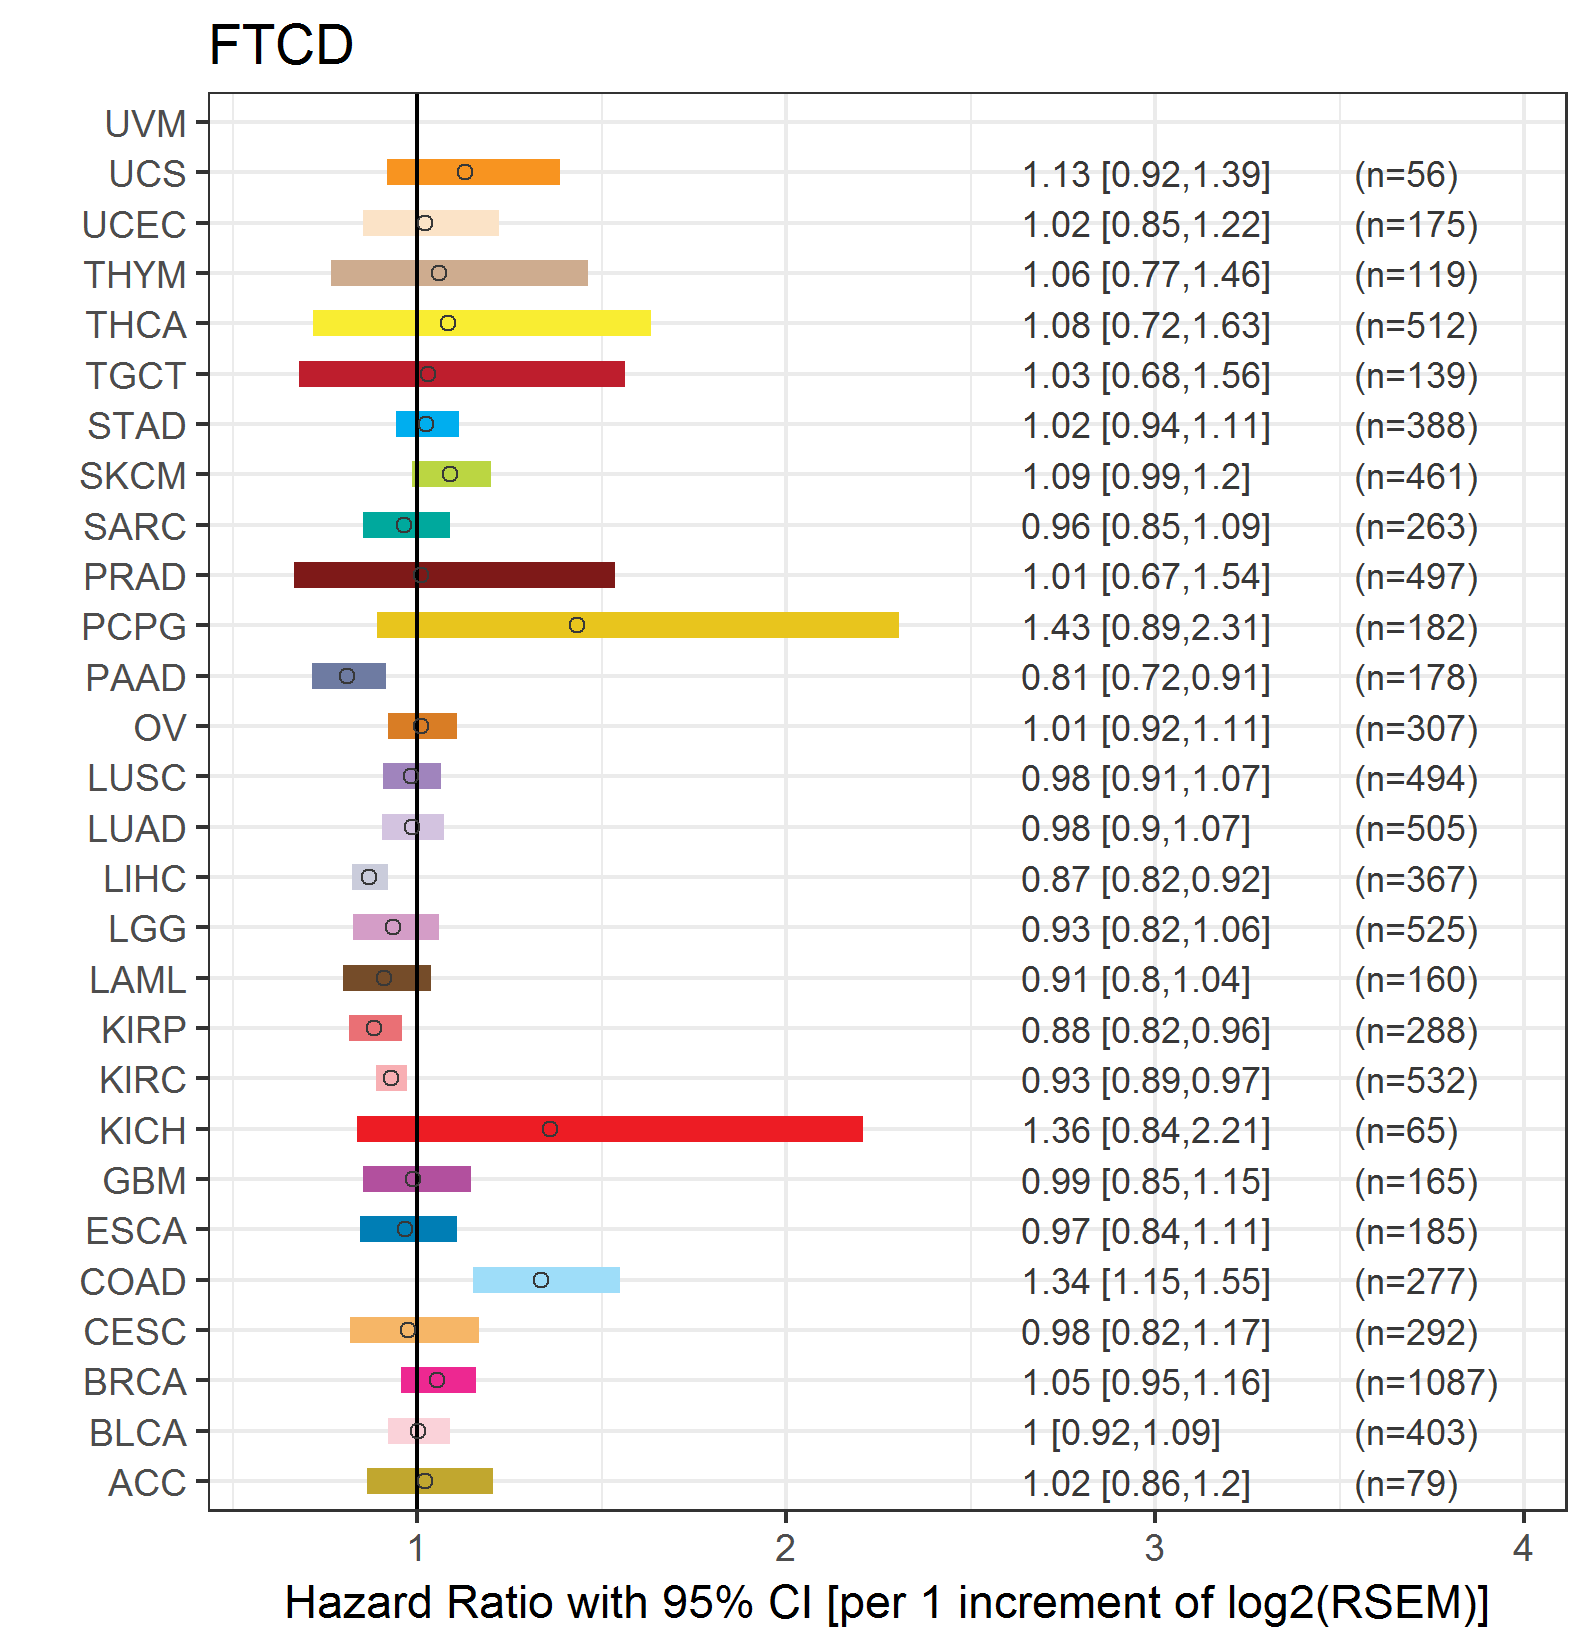
| Forest plot of Cox proportional hazard ratio (HR) and 95% CI of overall survival (OS) using 28 cancer types (TCGA IlluminaHiSeq_RNASeqV2, pan-cancer normalized log2(norm_counts+1) data, version 2016-08-16) (TCGA clinicalMatrix, phenotype data, version 2016-04-27) * Click on the image enlarge it in a new window. |
 |
| Forest plot of Cox proportional hazard ratio (HR) and 95% CI of relapse free survival (RFS) using 28 cancer types (TCGA IlluminaHiSeq_RNASeqV2, pan-cancer normalized log2(norm_counts+1) data, version 2016-08-16) (TCGA clinicalMatrix, phenotype data, version 2016-04-27) * Click on the image enlarge it in a new window. |
 |
| Top |
| TissGeneClin for FTCD |
| TissGeneDrug for FTCD |
| Drug information targeting TissGene (DrugBank Version 5.0.6, 2017-04-01) |
| DrugBank ID | Drug name | Drug activity | Drug type | Drug status |
| DB00116 | Tetrahydrofolic acid | Cofactor | Small molecule | Approved|Nutraceutical |
| Top |
| TissGeneDisease for FTCD |
| Disease information associated with TissGene (DisGeNet, 2016-06-01) |
| Disease ID | Disease name | # pubmeds | Source |
| umls:C0241910 | Hepatitis, Autoimmune | 3 | BeFree |
| umls:C2239176 | Liver carcinoma | 3 | BeFree |
| umls:C0002395 | Alzheimer's Disease | 1 | GAD |
| umls:C0006413 | Burkitt Lymphoma | 1 | CTD_human |
| umls:C0008924 | Cleft Lip | 1 | GAD |
| umls:C0008925 | Cleft Palate | 1 | GAD |
| umls:C0028259 | Nodule | 1 | BeFree |
| umls:C0080178 | Spina Bifida | 1 | GAD |
| umls:C0086692 | Benign Neoplasm | 1 | BeFree |
| umls:C0268609 | Glutamate formiminotransferase deficiency | 1 | BeFree,CLINVAR,CTD_human,ORPHANET,UNIPROT |
| umls:C0333980 | Focal Nodular Hyperplasia | 1 | BeFree |
|
Copyright 2016-Present - The University of Texas Health Science Center at Houston (UTHealth) Web File Viewing | How to Report, Fraud, Waste and Abuse | State of Texas | Statewide Search | Texas Homeland Security | Site Policies |