 |
| |
| |
| |
| |
| |
| |
|

| TissGeneSummary for CYP46A1 |
 Gene summary Gene summary |
| Basic gene information | Gene symbol | CYP46A1 |
| Gene name | cytochrome P450, family 46, subfamily A, polypeptide 1 | |
| Synonyms | CP46|CYP46 | |
| Cytomap | UCSC genome browser: 14q32.1 | |
| Type of gene | protein-coding | |
| RefGenes | NM_006668.1, | |
| Description | CH24Hcholesterol 24-hydroxylasecytochrome P450 46A1cytochrome P450, subfamily 46 (cholesterol 24-hydroxylase) | |
| Modification date | 20141207 | |
| dbXrefs | MIM : 604087 | |
| HGNC : HGNC | ||
| Ensembl : ENSG00000036530 | ||
| HPRD : 04970 | ||
| Vega : OTTHUMG00000171510 | ||
| Protein | UniProt: go to UniProt's Cross Reference DB Table | |
| Expression | CleanEX: HS_CYP46A1 | |
| BioGPS: 10858 | ||
| Pathway | NCI Pathway Interaction Database: CYP46A1 | |
| KEGG: CYP46A1 | ||
| REACTOME: CYP46A1 | ||
| Pathway Commons: CYP46A1 | ||
| Context | iHOP: CYP46A1 | |
| ligand binding site mutation search in PubMed: CYP46A1 | ||
| UCL Cancer Institute: CYP46A1 | ||
| Assigned class in TissGDB* | C | |
| Included tissue-specific gene expression resources | HPA,TiGER | |
| Specific-tissues in normal samples (assigned by TissGDB using HPA, TiGER, and GTEx) | Brain | |
| Cancer types related to the specific-tissues in cancer samples (assigned by TissGDB using TCGA) | GBM,LGG | |
| Reference showing the relevant tissue of CYP46A1 | ||
| Description by TissGene annotations | Have significant anti-correlated miRNA | |
| * Class A consists of genes with literature evidence and is part of the cTissGenes. Class B consists of only cTissGenes without additional evidence. The remaining genes belong to Class C. |
| Gene ontology having evidence of Inferred from Direct Assay (IDA) from Entrez |
| GO ID | GO term | PubMed ID | GO:0006707 | cholesterol catabolic process | 18621681 | GO:0006805 | xenobiotic metabolic process | 20667828 | GO:0006707 | cholesterol catabolic process | 18621681 | GO:0006805 | xenobiotic metabolic process | 20667828 |
| Top |
| TissGeneExp for CYP46A1 |
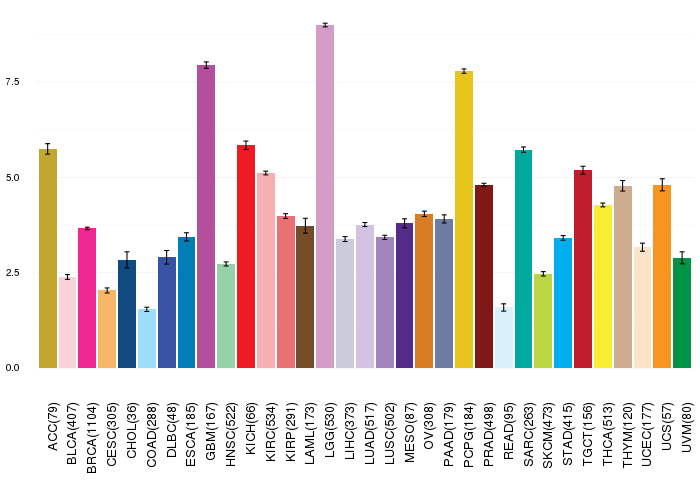
| Gene expressions across 28 cancer types (X-axis: cancer type and Y-axis: log2(norm_counts+1)) (TCGA IlluminaHiSeq_RNASeqV2, pan-cancer normalized log2(norm_counts+1) data, version 2016-08-16) |
 |
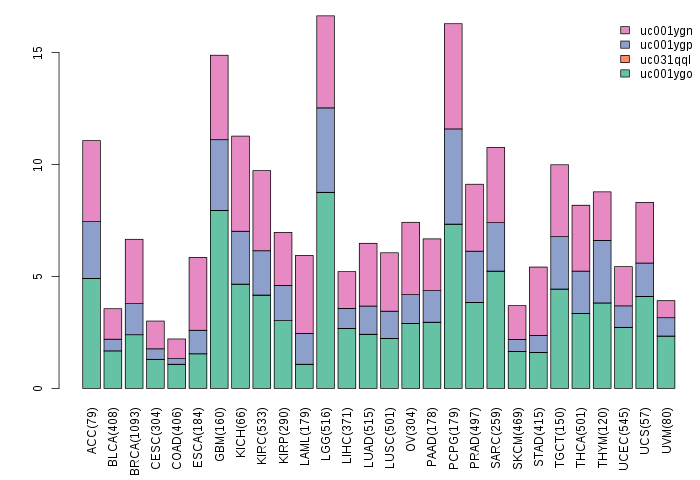
| Gene isoform expressions across 28 cancer types (X-axis: cancer type and Y-axis: log2(norm_counts+1)) (TCGA pan-cancer tcga_rsem_isoform_tpm, version 2016-09-01) |
 |
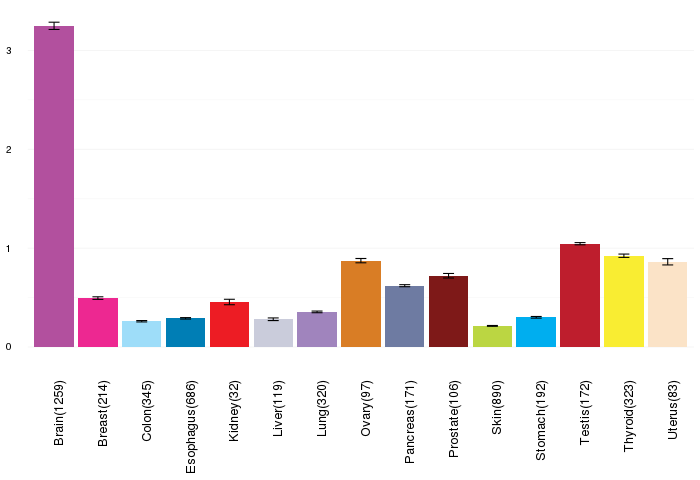
| Gene expressions across normal tissues of GTEx data (GTEx GTEx_Analysis_v6_RNA-seq_RNA-SeQCv1.1.8_gene_rpkm.gct) - Here, we shows the matched tissue types only among our 28 cancer types. |
 |
| Different expressions across 14 cancer types with more than 10 samples between matched tumors and normals (X-axis: cancer type and Y-axis: log2(norm_counts+1)) (TCGA IlluminaHiSeq_RNASeqV2, pan-cancer normalized log2(norm_counts+1) data, version 2016-08-16) |
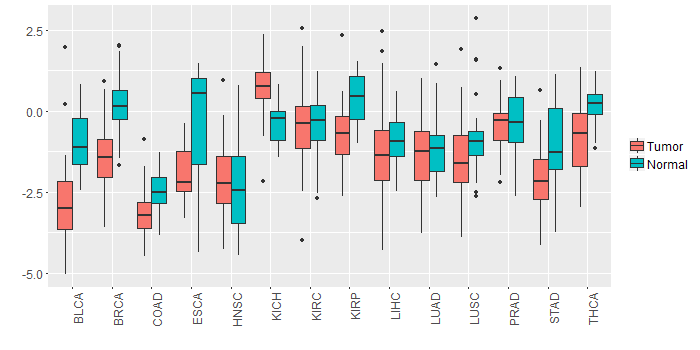 |
| - Significantly differentially expressed cancer types and information. (|Fold change|>1 and FDR<0.05) |
| Cancer type | Mean(exp) in tumor | Mean(exp) in matched normal | Log2FC | P-val. | FDR |
| BRCA | -1.468427696 | 0.250175813 | -1.718603509 | 3.16E-35 | 5.99E-34 |
| THCA | -0.853879286 | 0.199147832 | -1.053027119 | 5.19E-09 | 2.69E-08 |
| KIRP | -0.74399025 | 0.36700975 | -1.111 | 5.71E-06 | 2.49E-05 |
| BLCA | -2.667094362 | -0.980999625 | -1.686094737 | 0.000551 | 0.004423913 |
| KICH | 0.686288375 | -0.351295625 | 1.037584 | 3.68E-05 | 0.000104385 |
| Top |
| TissGene-miRNA for CYP46A1 |
| Significantly anti-correlated miRNAs of TissGene across 28 cancer types (Gene-miRNA relations from TargetScanHuman Relsease 7.1, Conserved_Site_Context_Scores.txt.zip, 06.01.2016) (TCGA IlluminaHiSeq_miRNASeq, log2(RPM+1) data, version 2016-11-21) (TCGA IlluminaHiSeq_RNASeqV2, log2(normalized_count+1) data, version 2016-08-16) (Spearman’s Rank Correlation (p-value<0.05 and coefficient<-0.25)) |
| Cancer type | miRNA id | miRNA accession | P-val. | Coeff. | # samples |
| UCS | hsa-miR-296-5p | MIMAT0000690 | 0.027 | -0.31 | 56 |
| Top |
| TissGeneMut for CYP46A1 |
| TissGeneSNV for CYP46A1 |
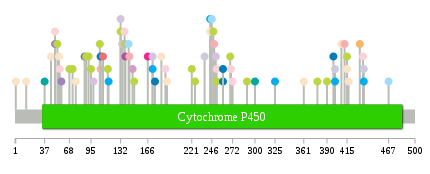
| nsSNV counts per each loci. Different colors of circles represent different cancer types. Circle size denotes number of samples. (TCGA somatic mutation (SNPs and small INDELs) data, version 2016-04-25) * Click on the image to enlarge it in a new window. |
 |
 |
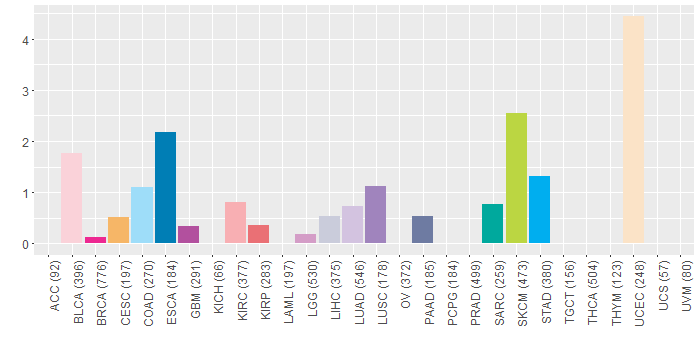
| Somatic nucleotide variants of TissGene across 28 cancer types (X-axis: cancer type and Y-axis: % of mutated samples) The numbers in parentheses are numbers of samples with mutation (nsSNVs). (TCGA somatic mutation (SNPs and small INDELs) data, version 2016-04-25) |
 |
| - nsSNVs sorted by frequency. |
| AAchange | Cancer type | # samples |
| p.R252C | SKCM | 1 |
| p.G184D | HNSC | 1 |
| p.D37G | SARC | 1 |
| p.S246I | COAD | 1 |
| p.E116K | SKCM | 1 |
| p.D1A | UCEC | 1 |
| p.Q175E | ESCA | 1 |
| p.V172M | LUAD | 1 |
| p.A8S | HNSC | 1 |
| p.S436T | STAD | 1 |
| p.E269K | SKCM | 1 |
| p.R260H | ESCA | 1 |
| p.G56D | BLCA | 1 |
| p.E166K | BRCA | 1 |
| p.R107H | ESCA | 1 |
| p.P408L | UCEC | 1 |
| p.V172M | STAD | 1 |
| p.L150* | HNSC | 1 |
| p.R400Q | LIHC | 1 |
| p.V87I | PAAD | 1 |
| p.R147W | LGG | 1 |
| p.R415C | SKCM | 1 |
| p.L361M | UCEC | 1 |
| p.G72R | SKCM | 1 |
| p.T225A | SKCM | 1 |
| p.R219H | HNSC | 1 |
| p.R98L | LUAD | 1 |
| p.S149F | SKCM | 1 |
| p.G117A | STAD | 1 |
| p.S106F | SKCM | 1 |
| p.W50* | LUSC | 1 |
| p.V325M | STAD | 1 |
| p.D142E | COAD | 1 |
| p.E132D | LUAD | 1 |
| p.W134C | LUAD | 1 |
| p.R251L | LUAD | 1 |
| p.V300L | SARC | 1 |
| p.E137Q | BLCA | 1 |
| p.L143P | KIRC | 1 |
| p.G68E | SKCM | 1 |
| p.E89K | SKCM | 1 |
| p.E54* | HNSC | 1 |
| p.W50R | BLCA | 1 |
| p.R467H | COAD | 1 |
| p.R58H | LUSC | 1 |
| p.G221E | SKCM | 1 |
| p.R110S | KIRP | 1 |
| p.G337D | HNSC | 1 |
| p.R260C | ESCA | 1 |
| p.R372H | HNSC | 1 |
| p.D289N | READ | 1 |
| p.R138Q | GBM | 1 |
| p.R252H | BLCA | 1 |
| p.V144I | HNSC | 1 |
| p.R248C | SKCM | 1 |
| p.R400W | STAD | 1 |
| p.R76W | UCEC | 1 |
| p.R244W | UCEC | 1 |
| p.G417S | UCEC | 1 |
| p.A14V | UCEC | 1 |
| p.R244Q | HNSC | 1 |
| p.R415H | UCEC | 1 |
| p.T378A | SKCM | 1 |
| p.G270D | BLCA | 1 |
| p.P390L | SKCM | 1 |
| p.R237Q | LIHC | 1 |
| p.E92K | SKCM | 1 |
| p.M398I | ESCA | 1 |
| p.R95C | SKCM | 1 |
| p.E137K | SKCM | 1 |
| p.R244W | STAD | 1 |
| p.N412K | KIRC | 1 |
| p.N249K | KIRC | 1 |
| p.R435H | BLCA | 1 |
| p.R91Q | HNSC | 1 |
| p.S436P | LIHC | 1 |
| p.M183I | UCEC | 1 |
| p.R272H | BLCA | 1 |
| p.Y188* | BLCA | 1 |
| p.K104N | READ | 1 |
| p.E290K | SKCM | 1 |
| p.R76W | CHOL | 1 |
| p.D53N | SKCM | 1 |
| p.R45Q | UCEC | 1 |
| p.V55I | UCEC | 1 |
| p.S431C | CESC | 1 |
| p.K107N | KIRC | 1 |
| p.D190G | UCEC | 1 |
| p.G132E | SKCM | 1 |
| Top |
| TissGeneCNV for CYP46A1 |
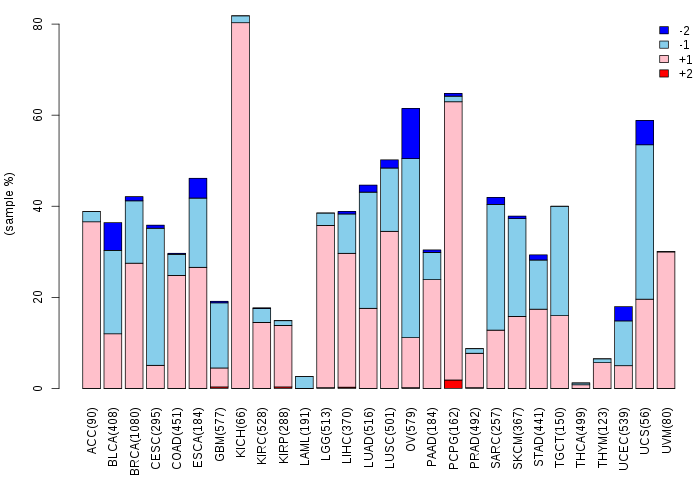
| Copy number variations of TissGene across 28 cancer types (X-axis: cancer type and Y-axis: % of CNV samples) (TCGA Gistic2_CopyNumber_Gistic2_all_data_by_genes, Gistic2 copy number data, version 2016-08-16) |
 |
| Top |
| TissGeneFusions for CYP46A1 |
| Fusion genes including TissGene (ChimerDB 3.0, 2016-12-01 and TCGA fusion Portal 2015-12-01) |
| Database | Src | Cancer type | Sample | Fusion gene | ORF | 5'-gene BP | 3'-gene BP |
| Chimerdb3.0 | ChiTaRs | NA | AK095062 | ZNF708-CYP46A1 | chr19:21477544 | chr14:100192913 | |
| TCGAfusionPortal | PRADA | BRCA | TCGA-AO-A0JD-01A | TRIP11-CYP46A1 | Out-of-frame | Chr14:92465584 | Chr14:100165803 |
| Top |
| TissGeneNet for CYP46A1 |
| Co-expressed gene networks based on protein-protein interaction data (CePIN) (TCGA IlluminaHiSeq_RNASeqV2, pan-cancer normalized log2(norm_counts+1) data, version 2016-08-16) (PINA2 ppi data) |
| Top |
| TissGeneProg for CYP46A1 |
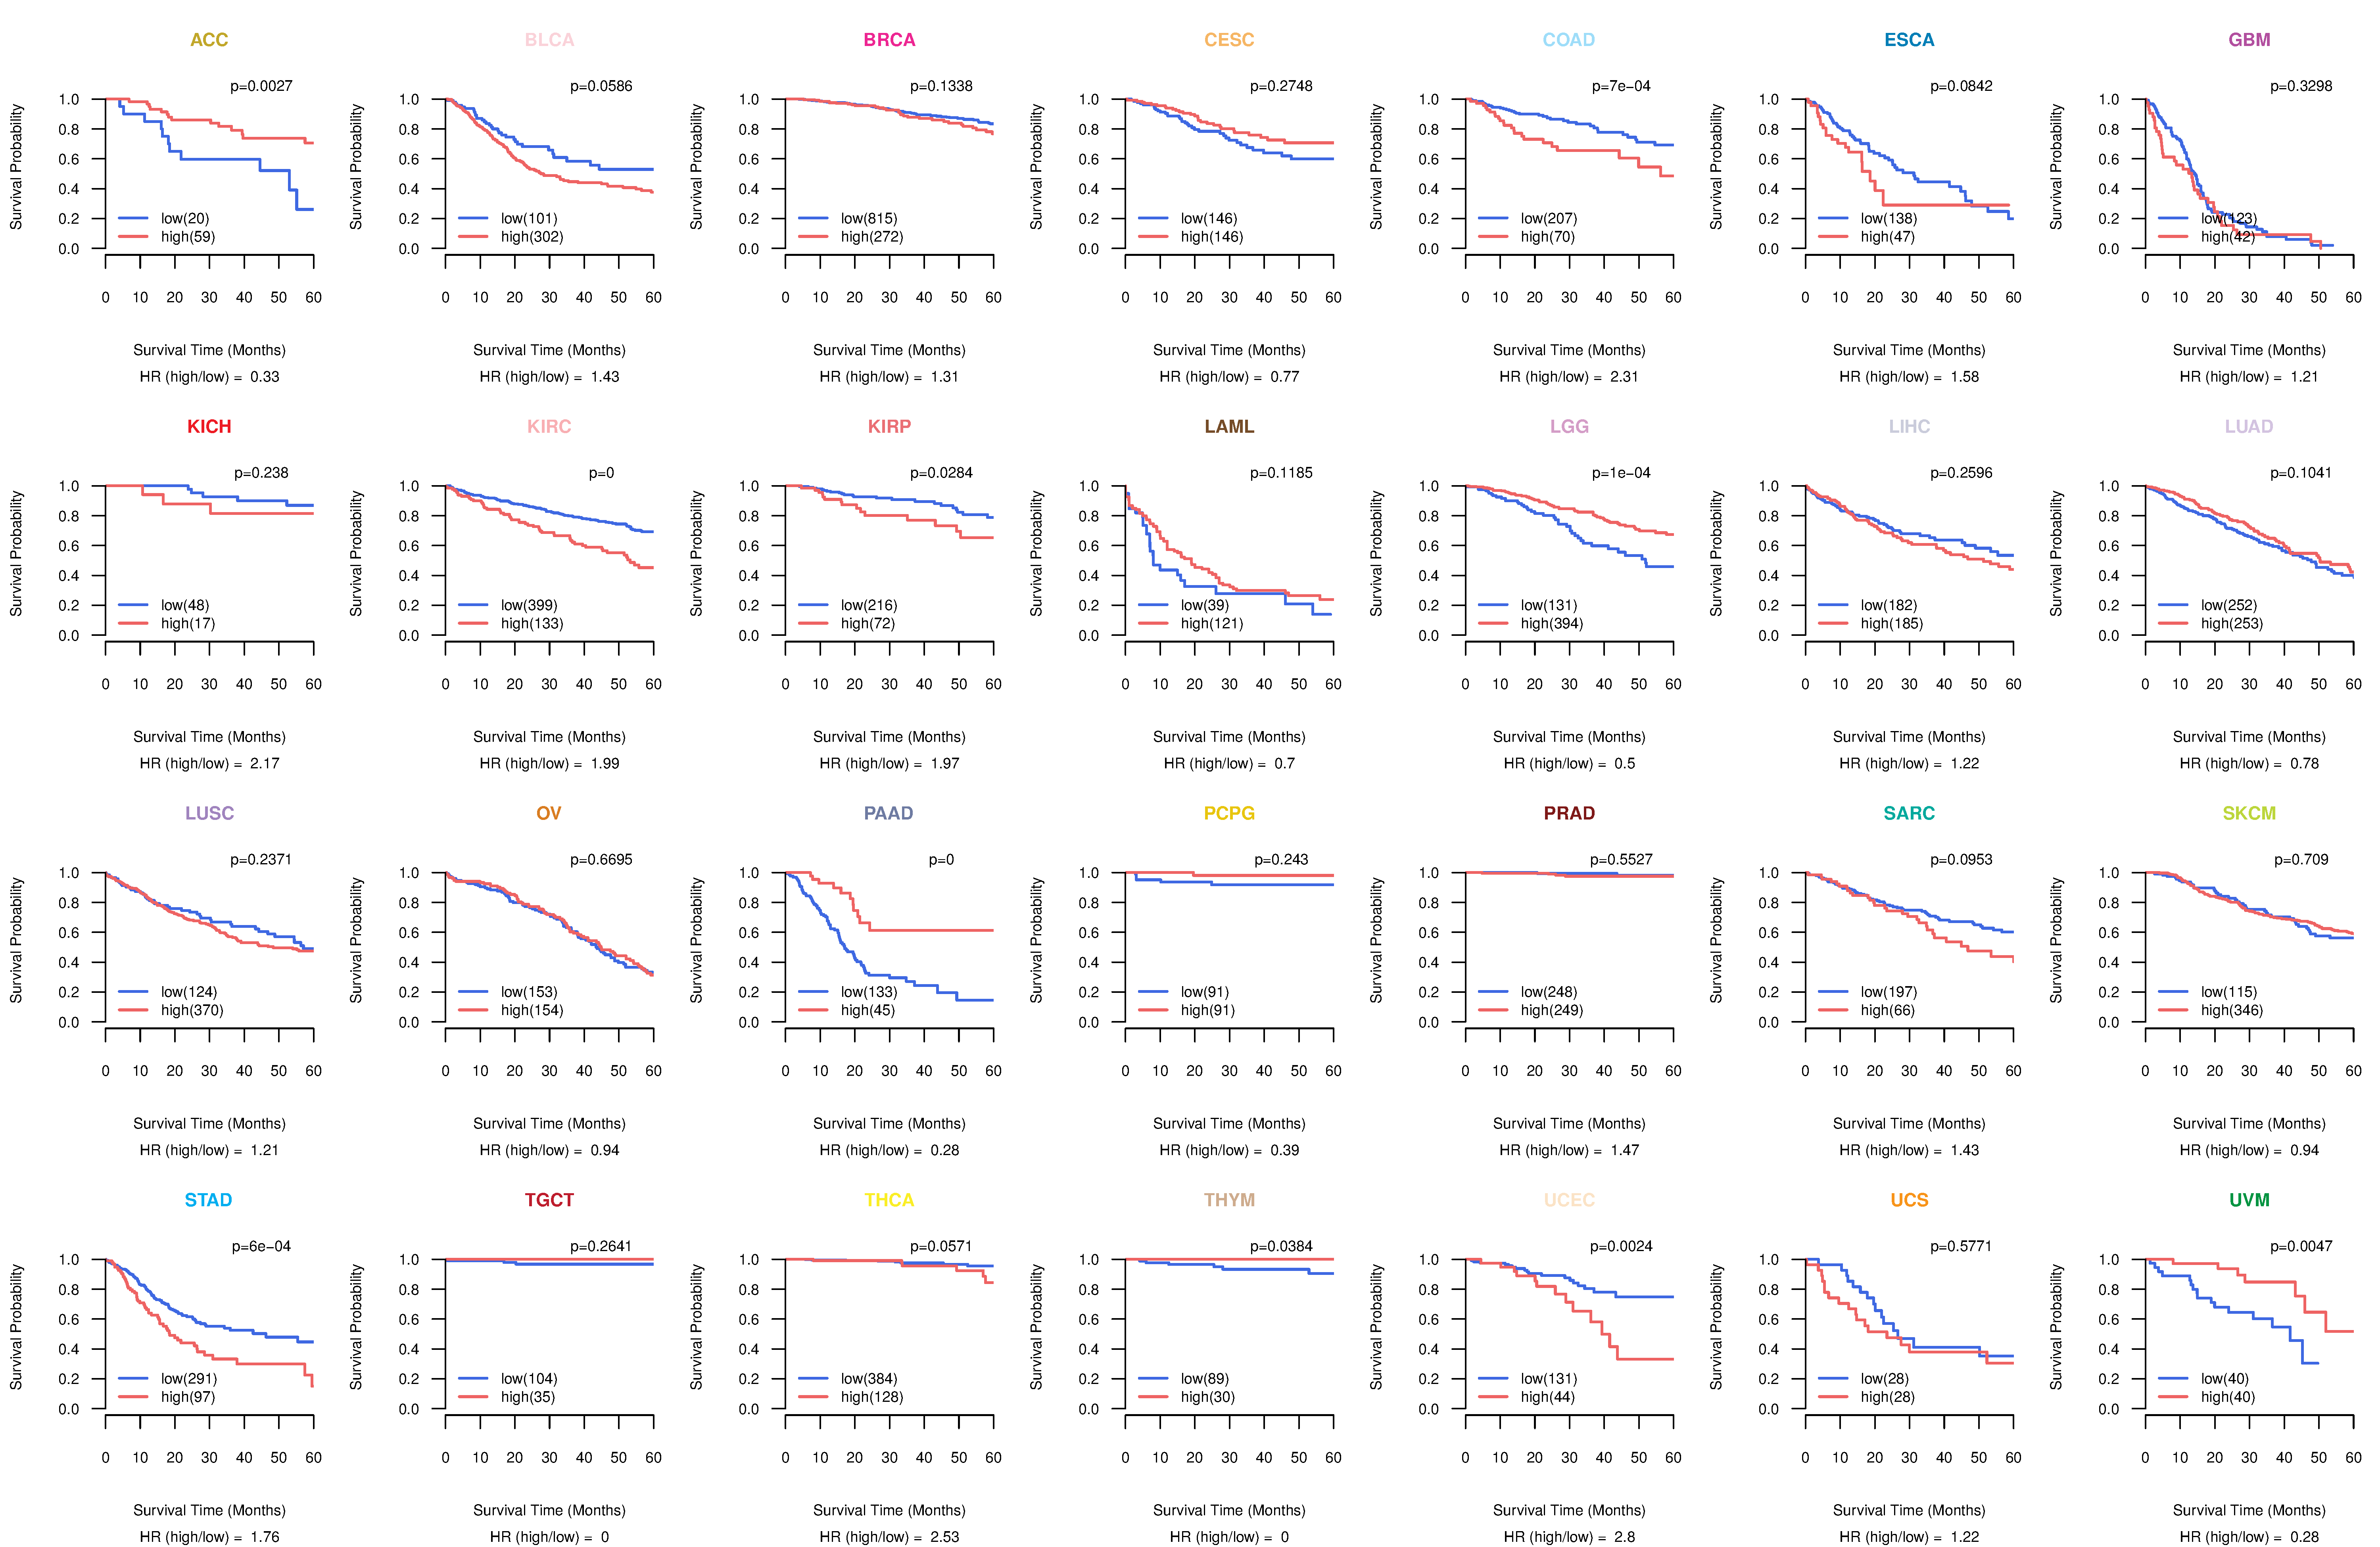
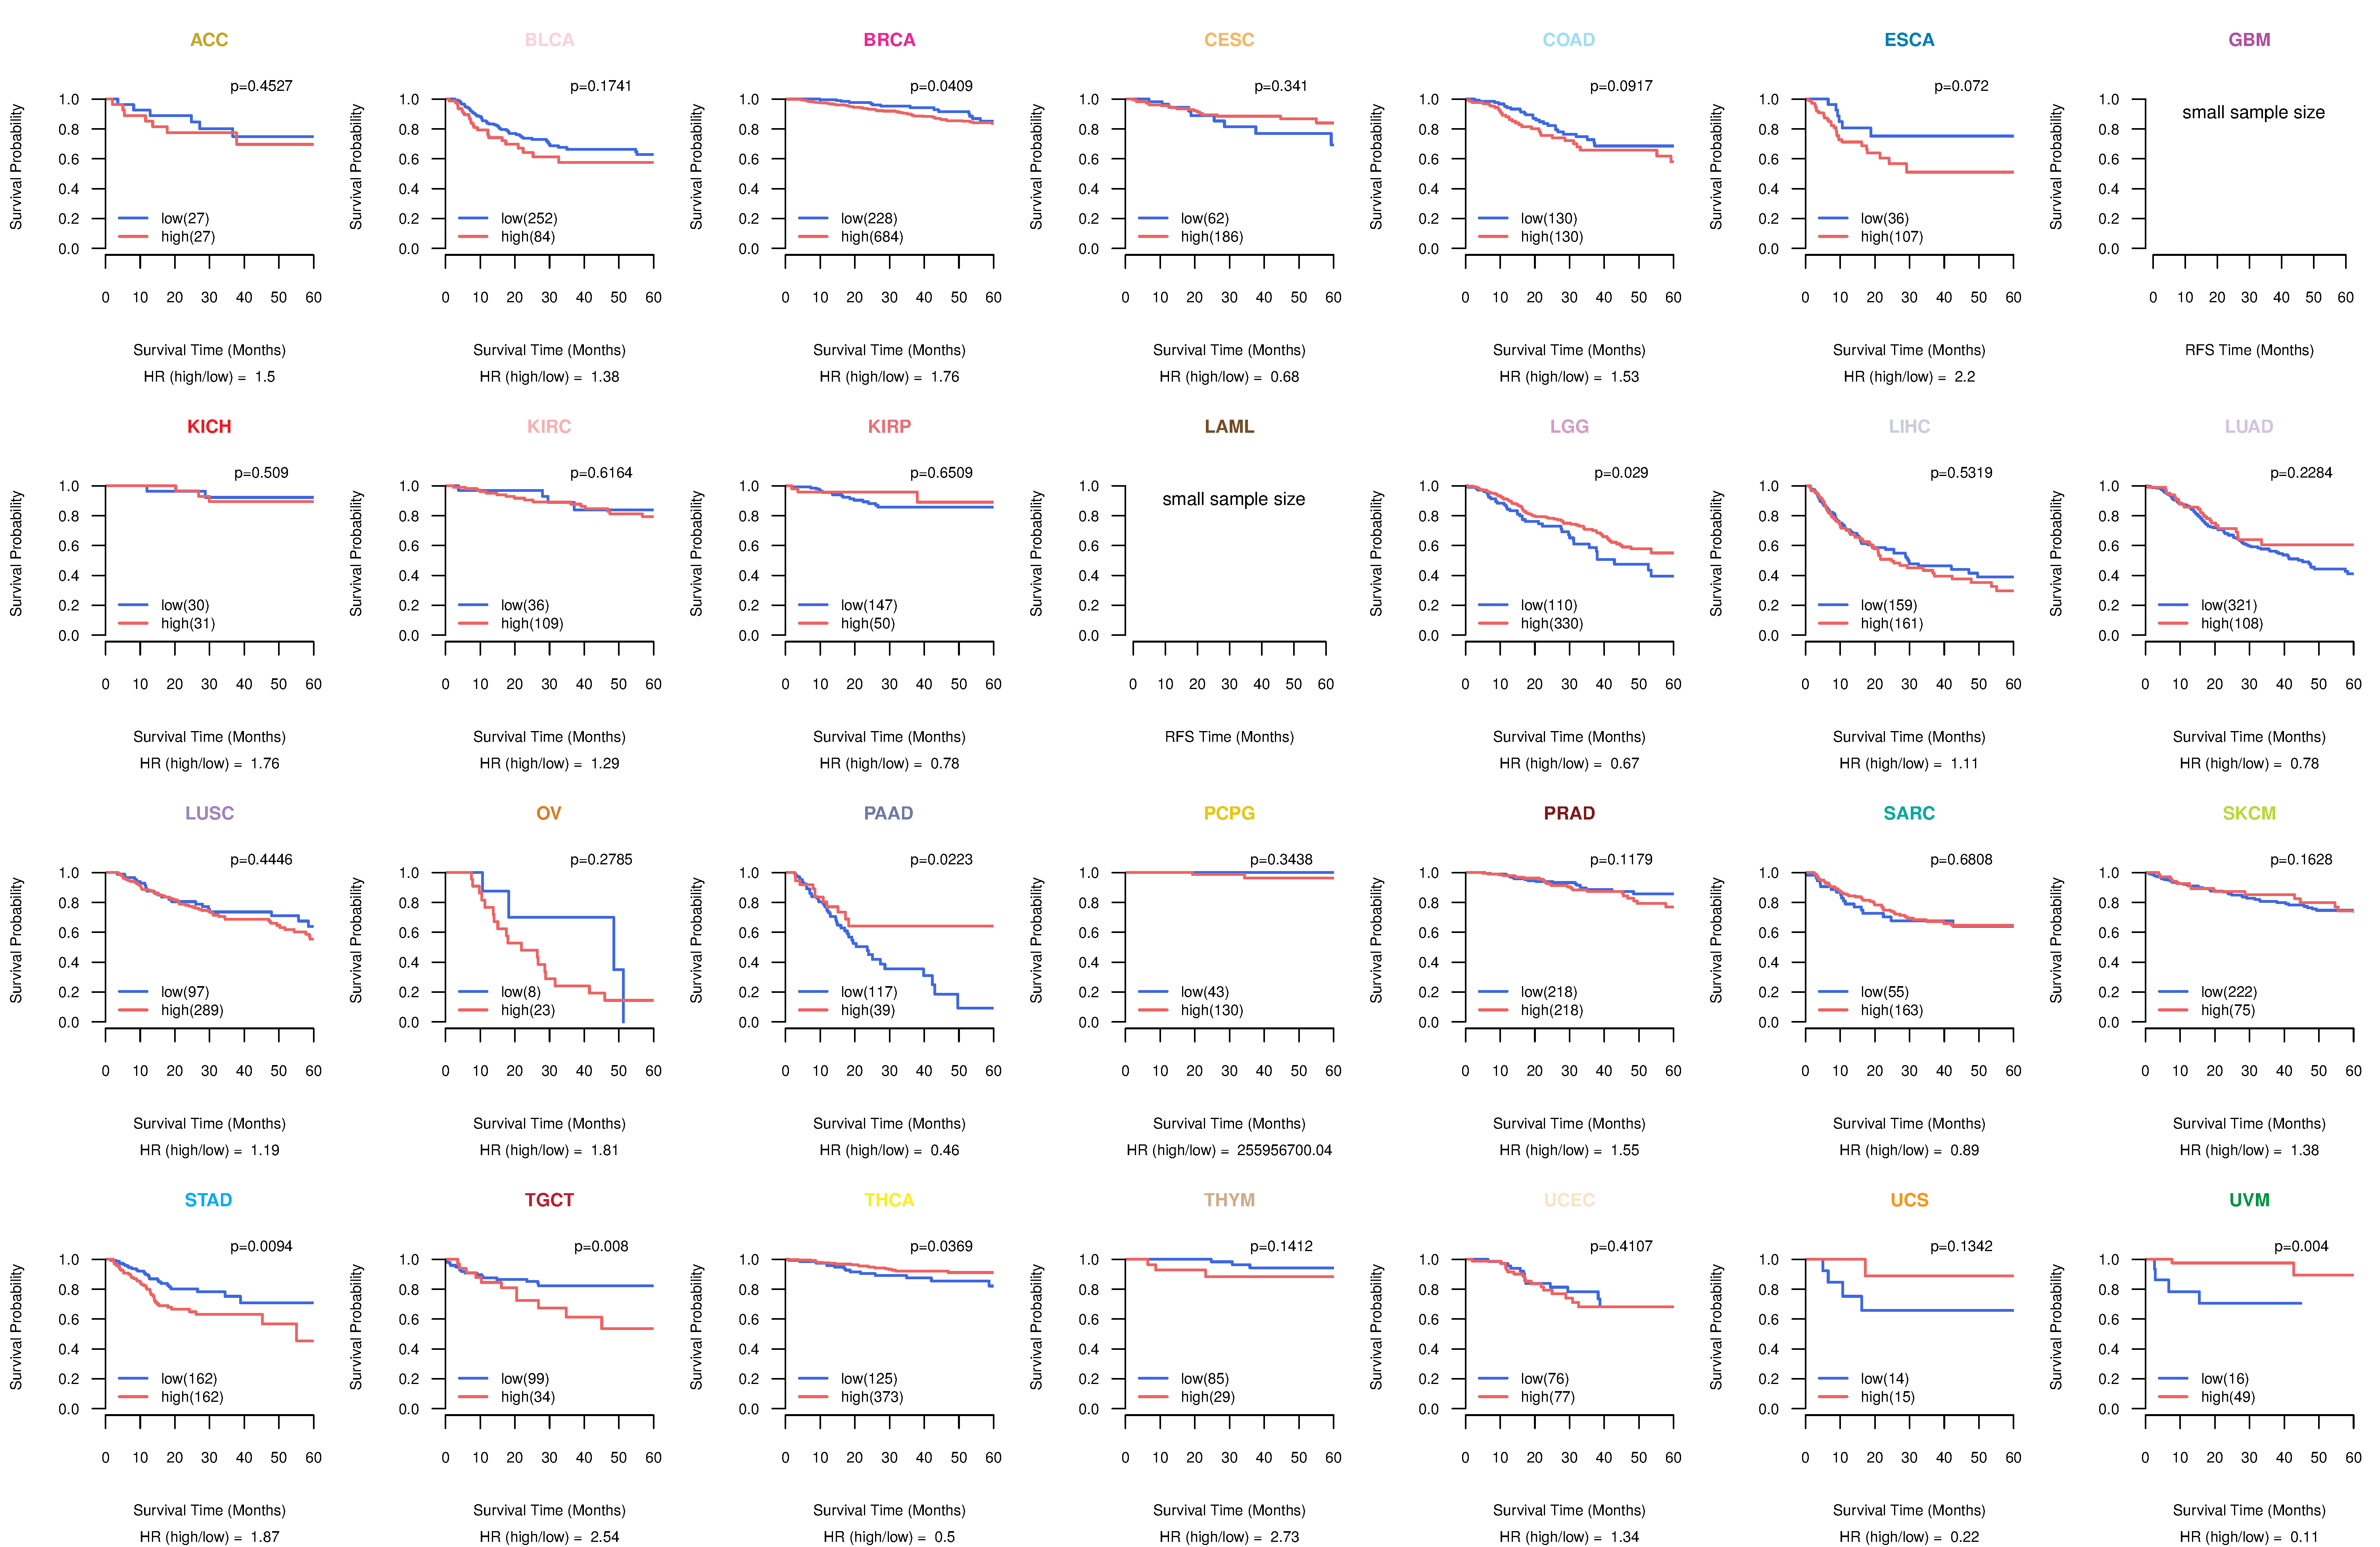
| Kaplan-Meier plots with logrank tests of overall survival (OS) using 28 cancer types (TCGA IlluminaHiSeq_RNASeqV2, pan-cancer normalized log2(norm_counts+1) data, version 2016-08-16) (TCGA clinicalMatrix, phenotype data, version 2016-04-27) * Click on the image to enlarge it in a new window. |
 |
| Kaplan-Meier plots with logrank test of relapse free survival (RFS) using 28 cancer types (TCGA IlluminaHiSeq_RNASeqV2, pan-cancer normalized log2(norm_counts+1) data, version 2016-08-16) (TCGA clinicalMatrix, phenotype data, version 2016-04-27) * Click on the image enlarge it in a new window. |
 |
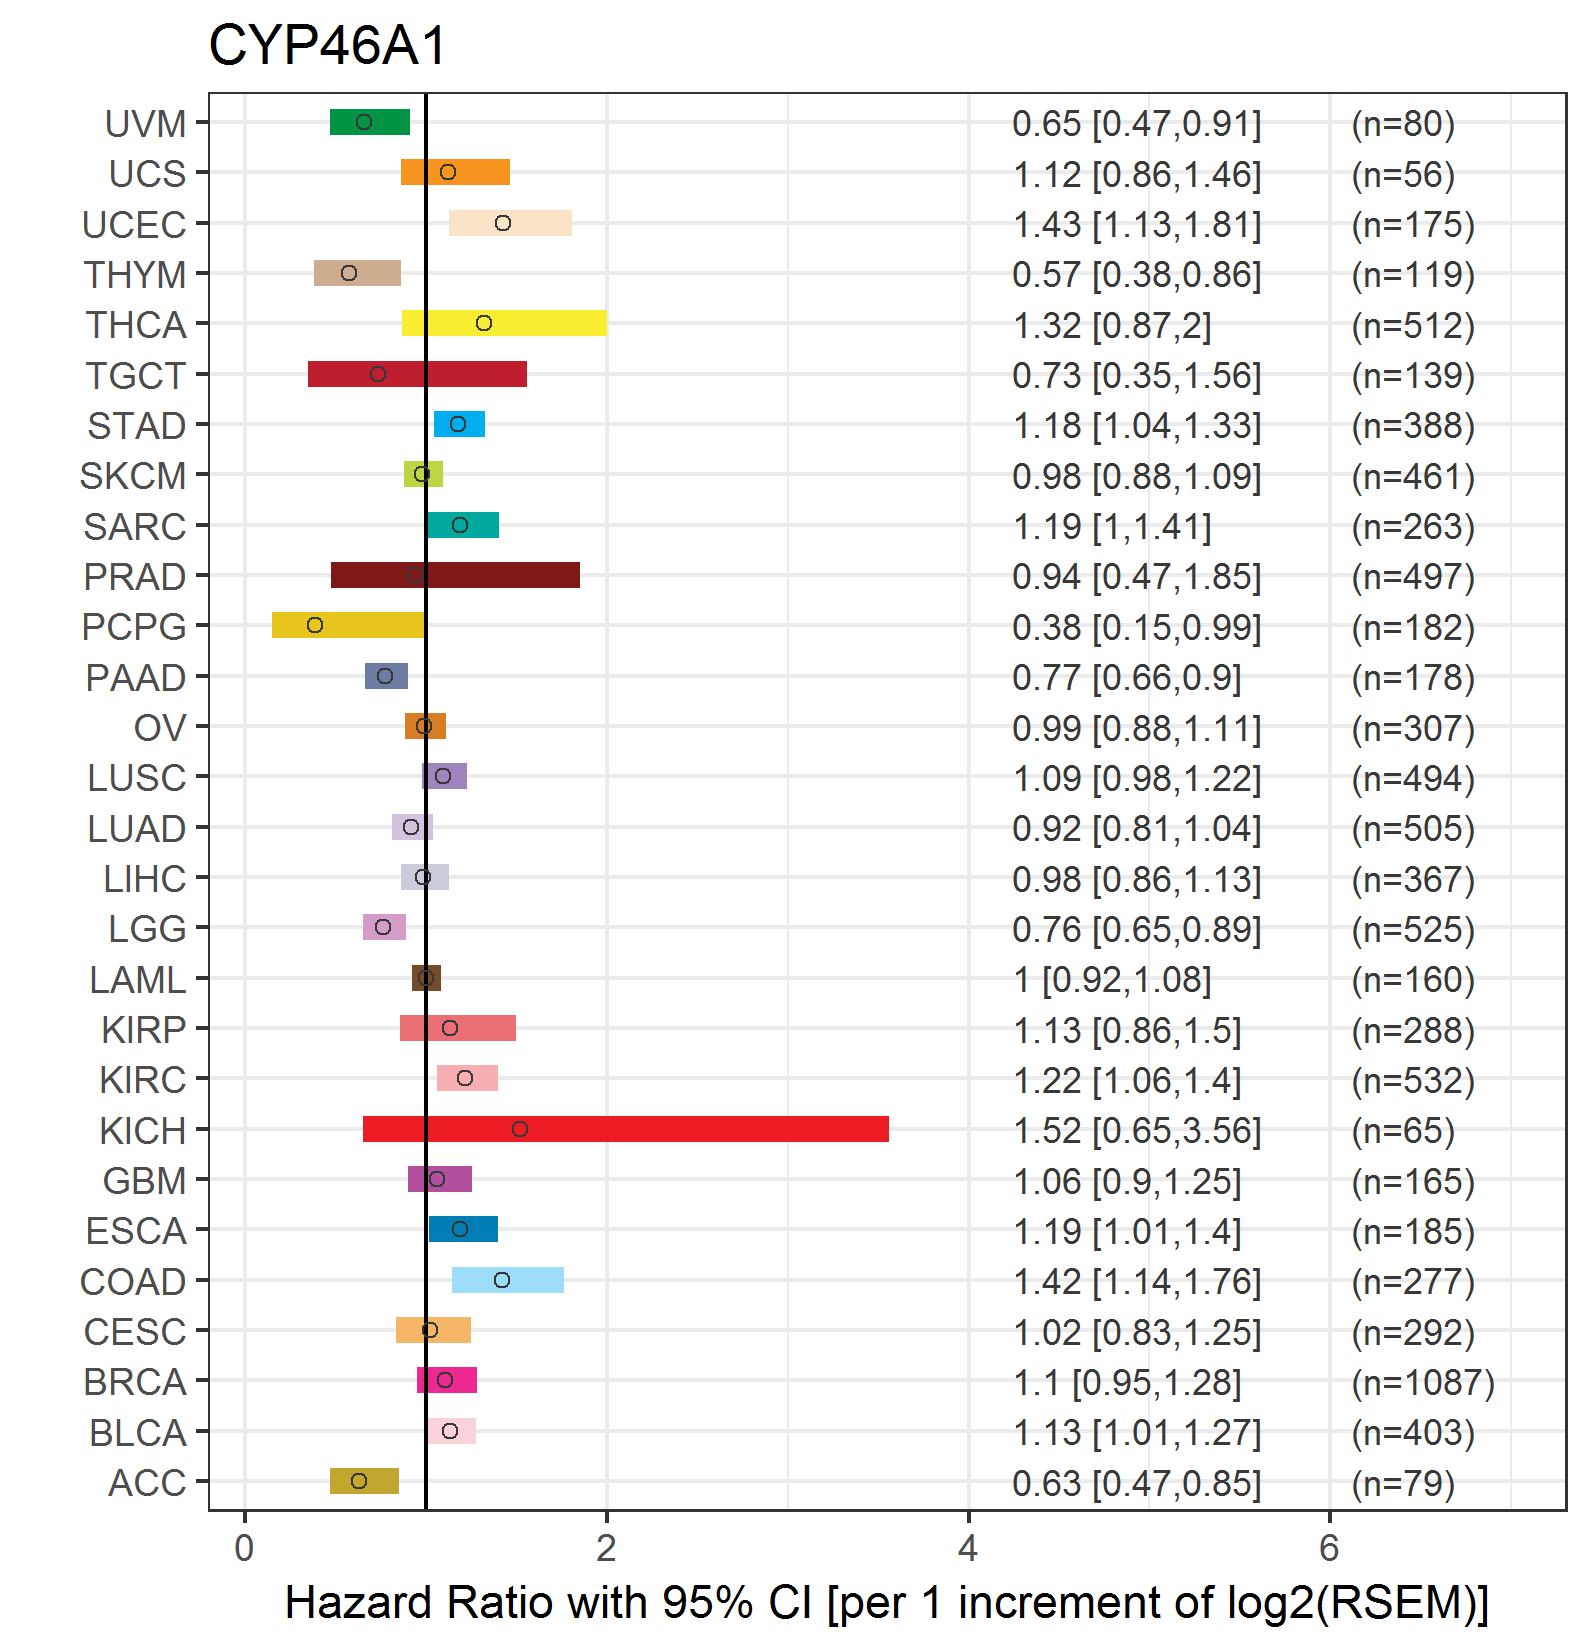
| Forest plot of Cox proportional hazard ratio (HR) and 95% CI of overall survival (OS) using 28 cancer types (TCGA IlluminaHiSeq_RNASeqV2, pan-cancer normalized log2(norm_counts+1) data, version 2016-08-16) (TCGA clinicalMatrix, phenotype data, version 2016-04-27) * Click on the image enlarge it in a new window. |
 |
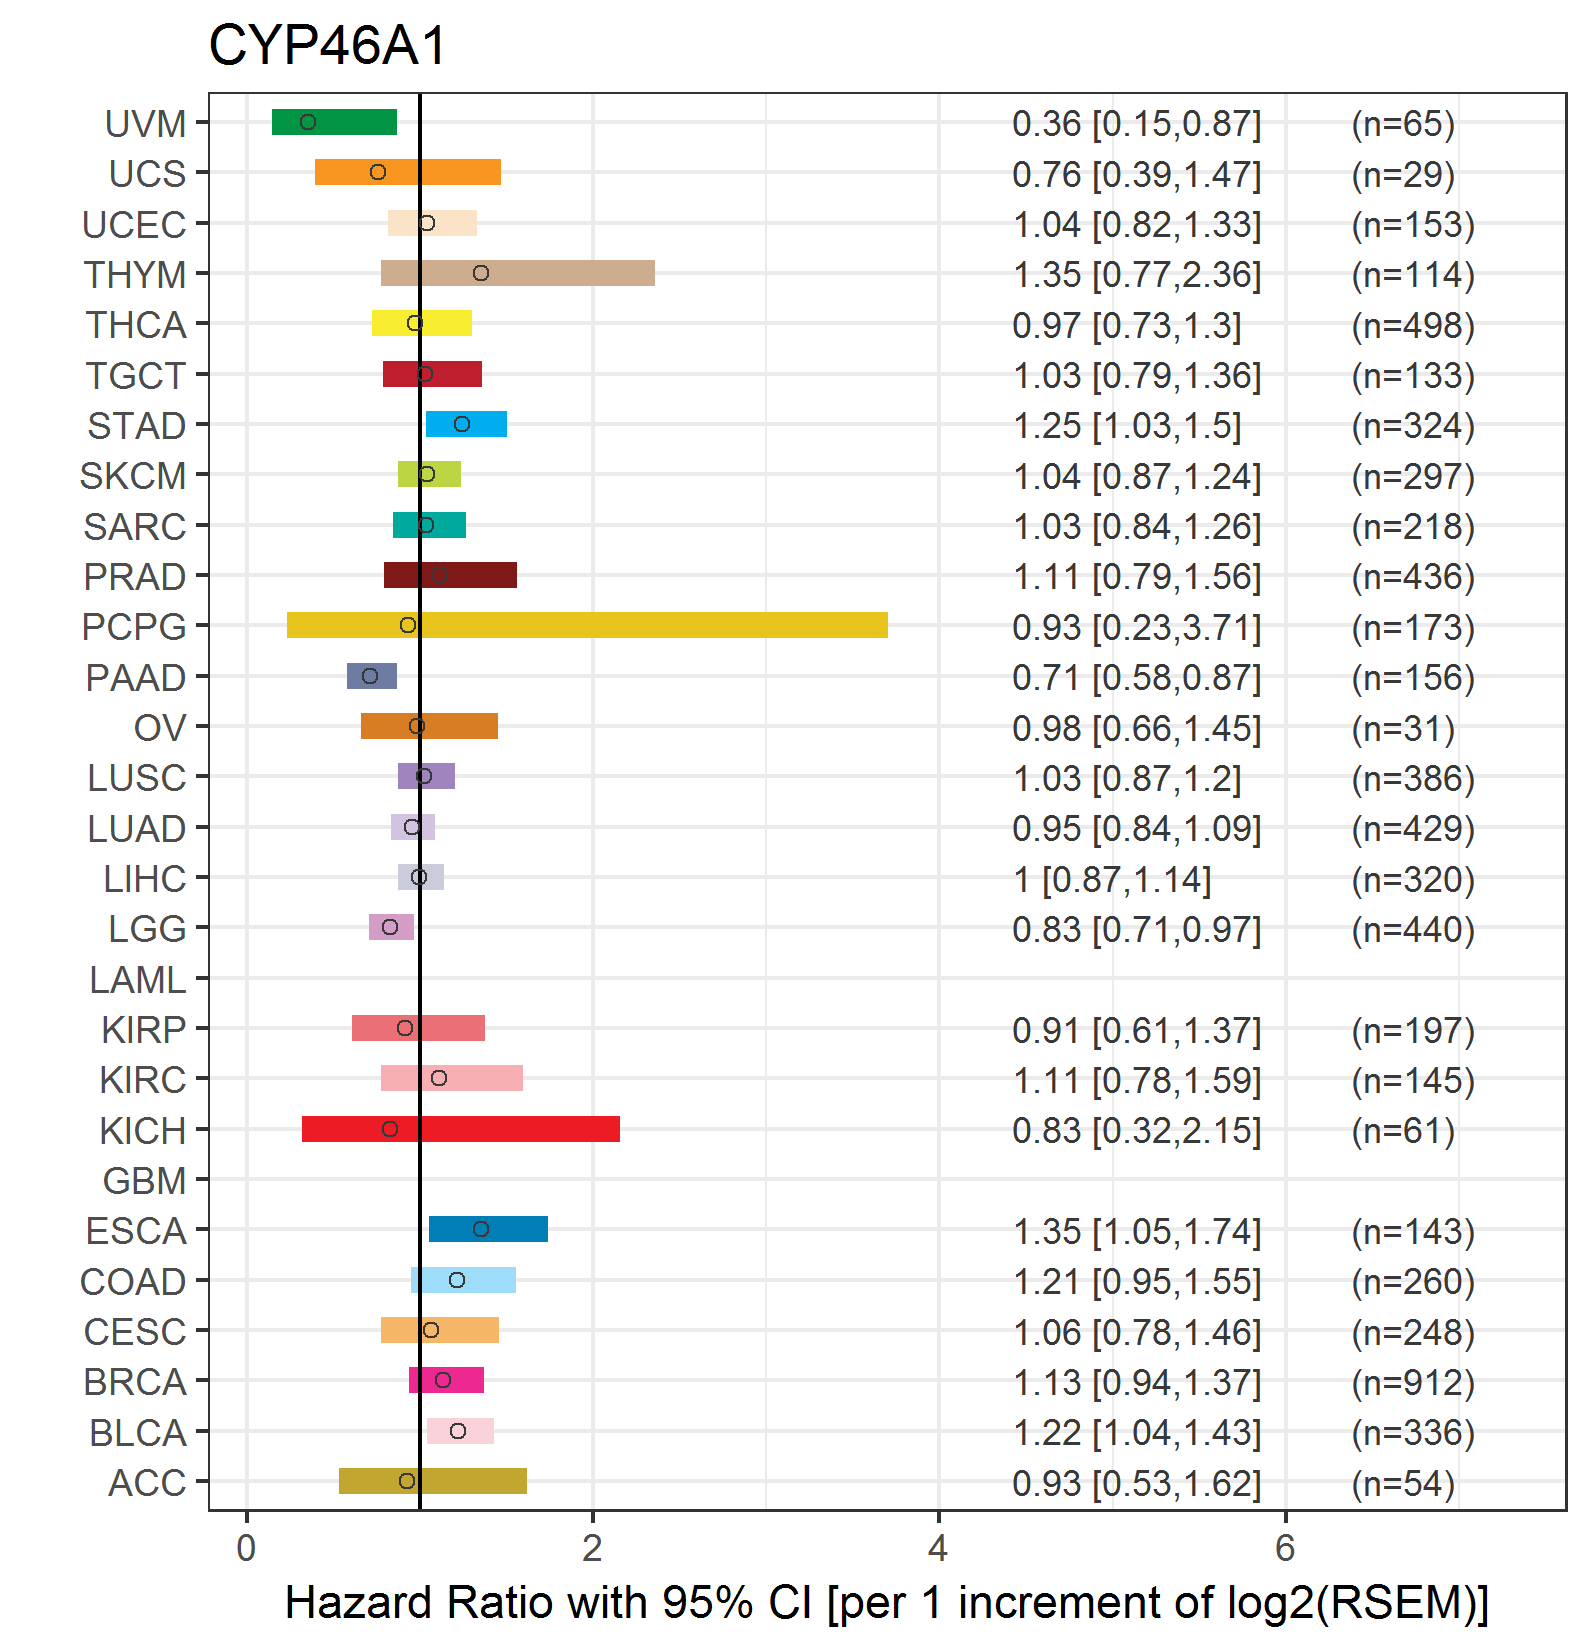
| Forest plot of Cox proportional hazard ratio (HR) and 95% CI of relapse free survival (RFS) using 28 cancer types (TCGA IlluminaHiSeq_RNASeqV2, pan-cancer normalized log2(norm_counts+1) data, version 2016-08-16) (TCGA clinicalMatrix, phenotype data, version 2016-04-27) * Click on the image enlarge it in a new window. |
 |
| Top |
| TissGeneClin for CYP46A1 |
| TissGeneDrug for CYP46A1 |
| Drug information targeting TissGene (DrugBank Version 5.0.6, 2017-04-01) |
| DrugBank ID | Drug name | Drug activity | Drug type | Drug status |
| Top |
| TissGeneDisease for CYP46A1 |
| Disease information associated with TissGene (DisGeNet, 2016-06-01) |
| Disease ID | Disease name | # pubmeds | Source |
| umls:C0002395 | Alzheimer's Disease | 22 | BeFree,CTD_human,GAD,LHGDN |
| umls:C0338656 | Impaired cognition | 4 | BeFree |
| umls:C0339573 | Glaucoma, Primary Open Angle | 3 | BeFree |
| umls:C1270972 | Mild cognitive disorder | 3 | BeFree |
| umls:C0242383 | Age related macular degeneration | 2 | BeFree,GAD |
| umls:C0333463 | Senile Plaques | 2 | BeFree |
| umls:C2936349 | Plaque, Amyloid | 2 | BeFree |
| umls:C0085648 | Synovial Cyst | 1 | BeFree |
| umls:C1258666 | Myxoid cyst | 1 | BeFree |
| umls:C1314691 | Age at menarche | 1 | GAD |
|
Copyright 2016-Present - The University of Texas Health Science Center at Houston (UTHealth) Web File Viewing | How to Report, Fraud, Waste and Abuse | State of Texas | Statewide Search | Texas Homeland Security | Site Policies |