 |
| |
| |
| |
| |
| |
| |
|

| TissGeneSummary for SLC27A2 |
 Gene summary Gene summary |
| Basic gene information | Gene symbol | SLC27A2 |
| Gene name | solute carrier family 27 (fatty acid transporter), member 2 | |
| Synonyms | ACSVL1|FACVL1|FATP2|HsT17226|VLACS|VLCS|hFACVL1 | |
| Cytomap | UCSC genome browser: 15q21.2 | |
| Type of gene | protein-coding | |
| RefGenes | NM_001159629.1, NM_003645.3, | |
| Description | FATP-2THCA-CoA ligasefatty acid transport protein 2fatty-acid-coenzyme A ligase, very long-chain 1long-chain-fatty-acid--CoA ligasesolute carrier family 27 member 2very long-chain acyl-CoA synthetasevery long-chain fatty-acid-coenzyme A ligase 1ve | |
| Modification date | 20141211 | |
| dbXrefs | MIM : 603247 | |
| HGNC : HGNC | ||
| Ensembl : ENSG00000140284 | ||
| HPRD : 11935 | ||
| Vega : OTTHUMG00000131643 | ||
| Protein | UniProt: go to UniProt's Cross Reference DB Table | |
| Expression | CleanEX: HS_SLC27A2 | |
| BioGPS: 11001 | ||
| Pathway | NCI Pathway Interaction Database: SLC27A2 | |
| KEGG: SLC27A2 | ||
| REACTOME: SLC27A2 | ||
| Pathway Commons: SLC27A2 | ||
| Context | iHOP: SLC27A2 | |
| ligand binding site mutation search in PubMed: SLC27A2 | ||
| UCL Cancer Institute: SLC27A2 | ||
| Assigned class in TissGDB* | C | |
| Included tissue-specific gene expression resources | TiGER,GTEx | |
| Specific-tissues in normal samples (assigned by TissGDB using HPA, TiGER, and GTEx) | KidneyLiver | |
| Cancer types related to the specific-tissues in cancer samples (assigned by TissGDB using TCGA) | KIRC,KIRP,KICHLIHC | |
| Reference showing the relevant tissue of SLC27A2 | ||
| Description by TissGene annotations | Fused withTSGene | |
| * Class A consists of genes with literature evidence and is part of the cTissGenes. Class B consists of only cTissGenes without additional evidence. The remaining genes belong to Class C. |
| Gene ontology having evidence of Inferred from Direct Assay (IDA) from Entrez |
| GO ID | GO term | PubMed ID | GO:0001561 | fatty acid alpha-oxidation | 10198260 | GO:0001676 | long-chain fatty acid metabolic process | 22022213 | GO:0006635 | fatty acid beta-oxidation | 10198260 | GO:0006699 | bile acid biosynthetic process | 11980911 | GO:0044539 | long-chain fatty acid import | 22022213 | GO:0097089 | methyl-branched fatty acid metabolic process | 10198260 | GO:0001561 | fatty acid alpha-oxidation | 10198260 | GO:0001676 | long-chain fatty acid metabolic process | 22022213 | GO:0006635 | fatty acid beta-oxidation | 10198260 | GO:0006699 | bile acid biosynthetic process | 11980911 | GO:0044539 | long-chain fatty acid import | 22022213 | GO:0097089 | methyl-branched fatty acid metabolic process | 10198260 |
| Top |
| TissGeneExp for SLC27A2 |
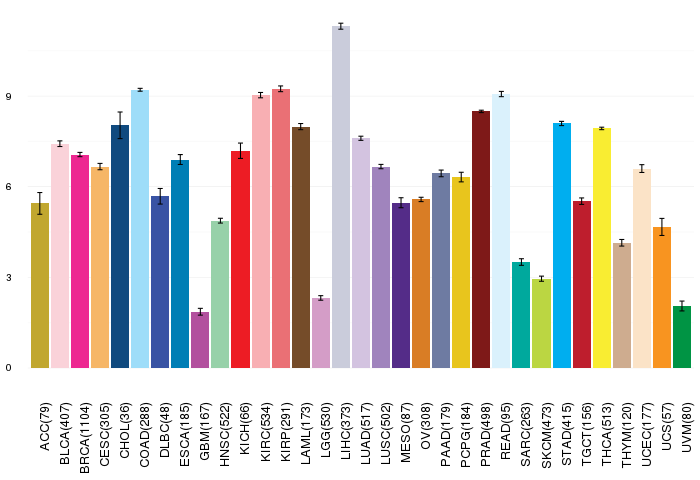
| Gene expressions across 28 cancer types (X-axis: cancer type and Y-axis: log2(norm_counts+1)) (TCGA IlluminaHiSeq_RNASeqV2, pan-cancer normalized log2(norm_counts+1) data, version 2016-08-16) |
 |
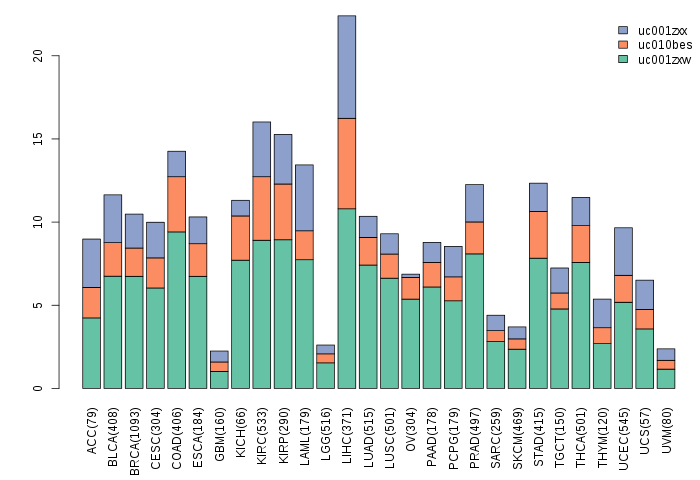
| Gene isoform expressions across 28 cancer types (X-axis: cancer type and Y-axis: log2(norm_counts+1)) (TCGA pan-cancer tcga_rsem_isoform_tpm, version 2016-09-01) |
 |
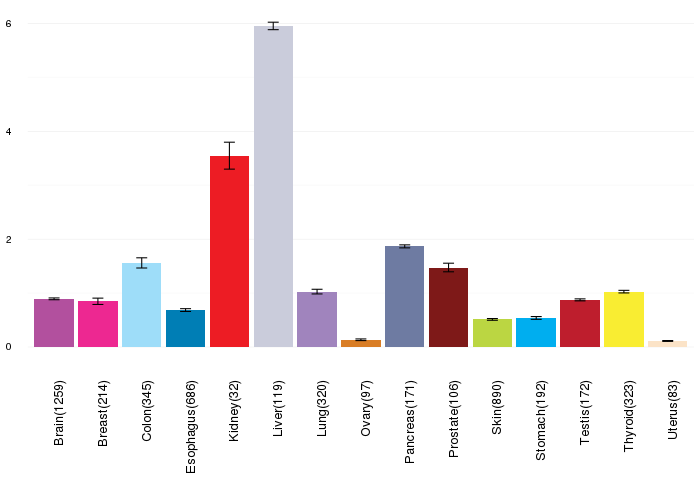
| Gene expressions across normal tissues of GTEx data (GTEx GTEx_Analysis_v6_RNA-seq_RNA-SeQCv1.1.8_gene_rpkm.gct) - Here, we shows the matched tissue types only among our 28 cancer types. |
 |
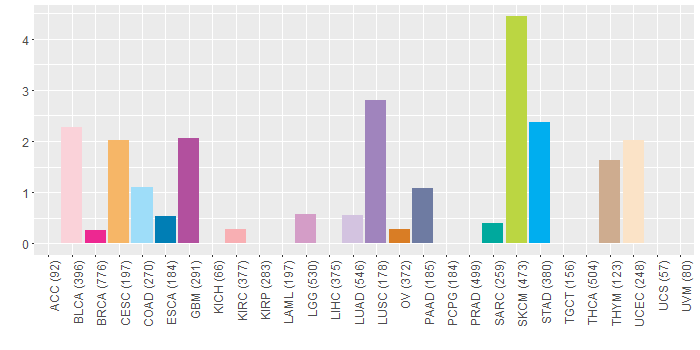
| Different expressions across 14 cancer types with more than 10 samples between matched tumors and normals (X-axis: cancer type and Y-axis: log2(norm_counts+1)) (TCGA IlluminaHiSeq_RNASeqV2, pan-cancer normalized log2(norm_counts+1) data, version 2016-08-16) |
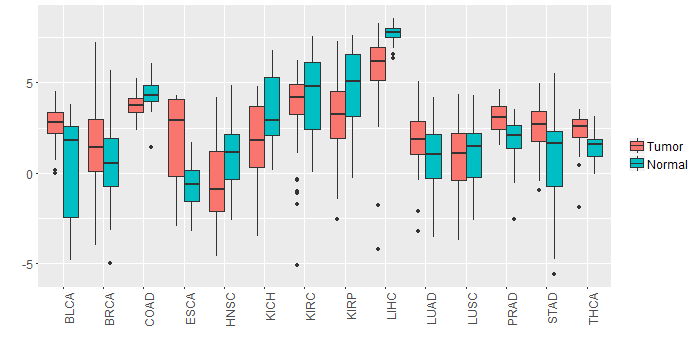 |
| - Significantly differentially expressed cancer types and information. (|Fold change|>1 and FDR<0.05) |
| Cancer type | Mean(exp) in tumor | Mean(exp) in matched normal | Log2FC | P-val. | FDR |
| LIHC | 5.667771999 | 7.729953999 | -2.062182 | 6.18E-08 | 4.59E-07 |
| PRAD | 3.061265538 | 1.87709823 | 1.184167308 | 8.86E-09 | 1.12E-07 |
| BLCA | 2.587943473 | 0.381243473 | 2.2067 | 0.00523 | 0.027304038 |
| STAD | 2.547197749 | 0.921053999 | 1.62614375 | 0.00557 | 0.021268132 |
| KIRP | 3.060750874 | 4.715644624 | -1.65489375 | 0.0049 | 0.011576185 |
| HNSC | -0.530599489 | 0.831751674 | -1.362351163 | 0.00192 | 0.005975104 |
| KICH | 1.485909999 | 3.447849999 | -1.96194 | 0.00241 | 0.004864139 |
| LUAD | 1.920485034 | 0.896538482 | 1.023946552 | 0.00105 | 0.002293233 |
| Top |
| TissGene-miRNA for SLC27A2 |
| Significantly anti-correlated miRNAs of TissGene across 28 cancer types (Gene-miRNA relations from TargetScanHuman Relsease 7.1, Conserved_Site_Context_Scores.txt.zip, 06.01.2016) (TCGA IlluminaHiSeq_miRNASeq, log2(RPM+1) data, version 2016-11-21) (TCGA IlluminaHiSeq_RNASeqV2, log2(normalized_count+1) data, version 2016-08-16) (Spearman’s Rank Correlation (p-value<0.05 and coefficient<-0.25)) |
| Cancer type | miRNA id | miRNA accession | P-val. | Coeff. | # samples |
| Top |
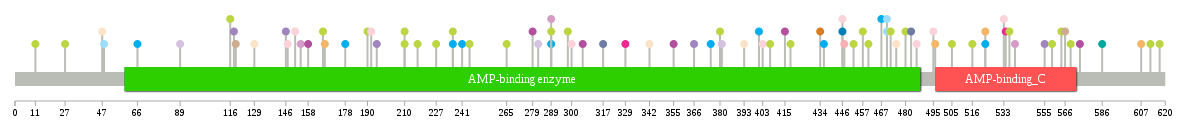
| TissGeneMut for SLC27A2 |
| TissGeneSNV for SLC27A2 |
| nsSNV counts per each loci. Different colors of circles represent different cancer types. Circle size denotes number of samples. (TCGA somatic mutation (SNPs and small INDELs) data, version 2016-04-25) * Click on the image to enlarge it in a new window. |
 |
 |
| Somatic nucleotide variants of TissGene across 28 cancer types (X-axis: cancer type and Y-axis: % of mutated samples) The numbers in parentheses are numbers of samples with mutation (nsSNVs). (TCGA somatic mutation (SNPs and small INDELs) data, version 2016-04-25) |
 |
| - nsSNVs sorted by frequency. |
| AAchange | Cancer type | # samples |
| p.R342Q | UCEC | 1 |
| p.A586S | SARC | 1 |
| p.N89I | LUAD | 1 |
| p.I475V | UCEC | 1 |
| p.R470H | COAD | 1 |
| p.D505N | SKCM | 1 |
| p.E536K | SKCM | 1 |
| p.G539R | LGG | 1 |
| p.M468I | MESO | 1 |
| p.W119X | THYM | 1 |
| p.G11E | SKCM | 1 |
| p.R523C | CESC | 1 |
| p.S158L | GBM | 1 |
| p.G569E | SKCM | 1 |
| p.T393I | UCEC | 1 |
| p.N373S | HNSC | 1 |
| p.F147L | BLCA | 1 |
| p.E533Q | BLCA | 1 |
| p.A612V | SKCM | 1 |
| p.A380V | SKCM | 1 |
| p.T617I | SKCM | 1 |
| p.E472K | SKCM | 1 |
| p.R289Q | STAD | 1 |
| p.D452N | SKCM | 1 |
| p.C279Y | GBM | 1 |
| p.W210* | SKCM | 1 |
| p.R574H | GBM | 1 |
| p.G47R | UCEC | 1 |
| p.G190R | SKCM | 1 |
| p.V118L | LUSC | 1 |
| p.Y407F | SKCM | 1 |
| p.P418S | SKCM | 1 |
| p.V401M | STAD | 1 |
| p.E167D | CESC | 1 |
| p.K447N | KIRC | 1 |
| p.E446D | ESCA | 1 |
| p.A375V | STAD | 1 |
| p.P265L | SKCM | 1 |
| p.R486Q | BLCA | 1 |
| p.M236V | STAD | 1 |
| p.D192Y | BLCA | 1 |
| p.R236Q | SKCM | 1 |
| p.A116V | SKCM | 1 |
| p.Y460F | SKCM | 1 |
| p.E166K | SKCM | 1 |
| p.R555S | LUSC | 1 |
| p.R480K | SKCM | 1 |
| p.A282S | LUAD | 1 |
| p.V306I | GBM | 1 |
| p.D258N | HNSC | 1 |
| p.R329H | BRCA | 1 |
| p.D483G | PAAD | 1 |
| p.R289Q | LGG | 1 |
| p.S178P | STAD | 1 |
| p.T564I | SKCM | 1 |
| p.T66M | STAD | 1 |
| p.C146Y | LUSC | 1 |
| p.R470C | COAD | 1 |
| p.D300N | BLCA | 1 |
| p.E566D | THYM | 1 |
| p.K403N | BLCA | 1 |
| p.P434L | OV | 1 |
| p.F27Y | SKCM | 1 |
| p.R289Q | SKCM | 1 |
| p.R241H | STAD | 1 |
| p.E366K | LUSC | 1 |
| p.V154M | LGG | 1 |
| p.T495I | BLCA | 1 |
| p.G151R | BLCA | 1 |
| p.E607K | CESC | 1 |
| p.V415I | GBM | 1 |
| p.N436D | STAD | 1 |
| p.G227E | SKCM | 1 |
| p.D355G | GBM | 1 |
| p.W245X | SKCM | 1 |
| p.L195P | LUSC | 1 |
| p.N534S | BRCA | 1 |
| p.S217F | SKCM | 1 |
| p.R523G | STAD | 1 |
| p.R317L | PAAD | 1 |
| p.W298* | SKCM | 1 |
| p.K48Q | COAD | 1 |
| p.C129S | UCEC | 1 |
| p.G516E | SKCM | 1 |
| p.L467I | STAD | 1 |
| p.E496K | CESC | 1 |
| p.G457R | SKCM | 1 |
| p.E446D | BLCA | 1 |
| p.W210X | SKCM | 1 |
| p.A559V | SKCM | 1 |
| p.V381F | LUAD | 1 |
| Top |
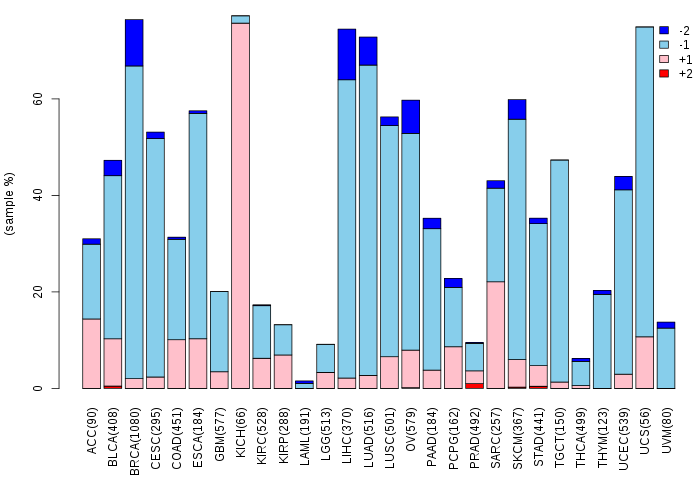
| TissGeneCNV for SLC27A2 |
| Copy number variations of TissGene across 28 cancer types (X-axis: cancer type and Y-axis: % of CNV samples) (TCGA Gistic2_CopyNumber_Gistic2_all_data_by_genes, Gistic2 copy number data, version 2016-08-16) |
 |
| Top |
| TissGeneFusions for SLC27A2 |
| Fusion genes including TissGene (ChimerDB 3.0, 2016-12-01 and TCGA fusion Portal 2015-12-01) |
| Database | Src | Cancer type | Sample | Fusion gene | ORF | 5'-gene BP | 3'-gene BP |
| Chimerdb3.0 | ChiTaRs | NA | AA888112 | RBM14-SLC27A2 | chr11:66394814 | chr15:50518217 | |
| TCGAfusionPortal | PRADA | BRCA | TCGA-D8-A140-01A | USP8-SLC27A2 | Out-of-frame | Chr15:50731374 | Chr15:50489697 |
| TCGAfusionPortal | PRADA | PRAD | TCGA-G9-6348-01A | MAP1B-SLC27A2 | In-frame | Chr5:71411626 | Chr15:50489697 |
| Top |
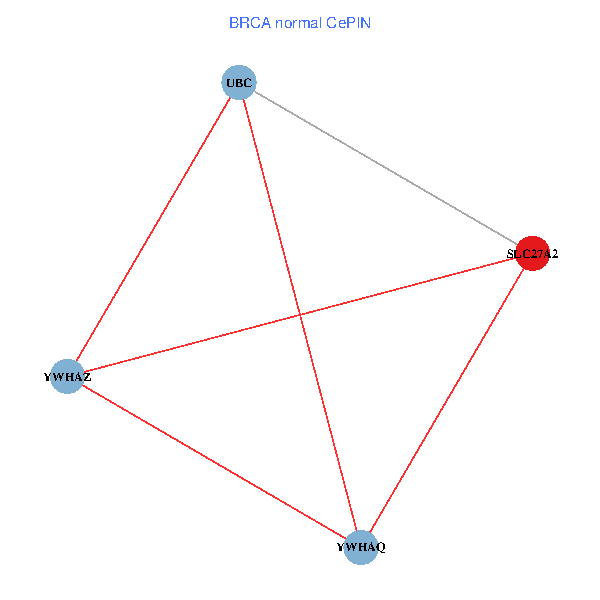
| TissGeneNet for SLC27A2 |
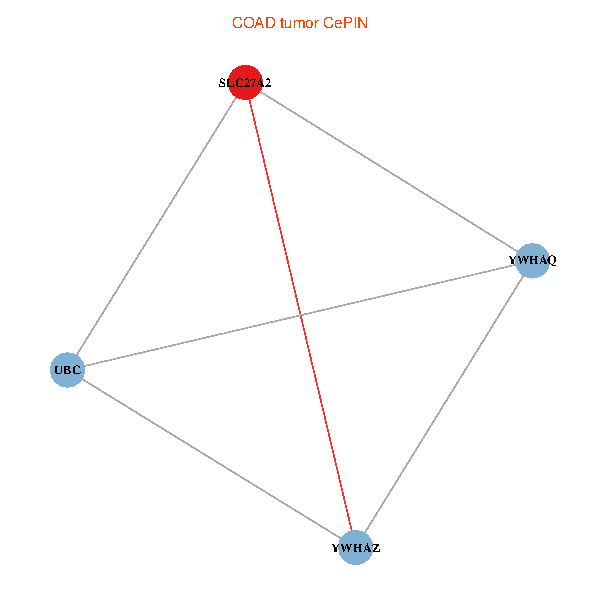
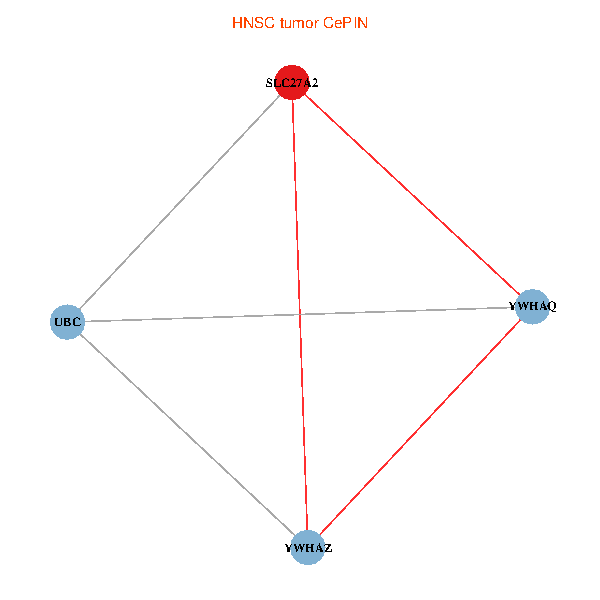
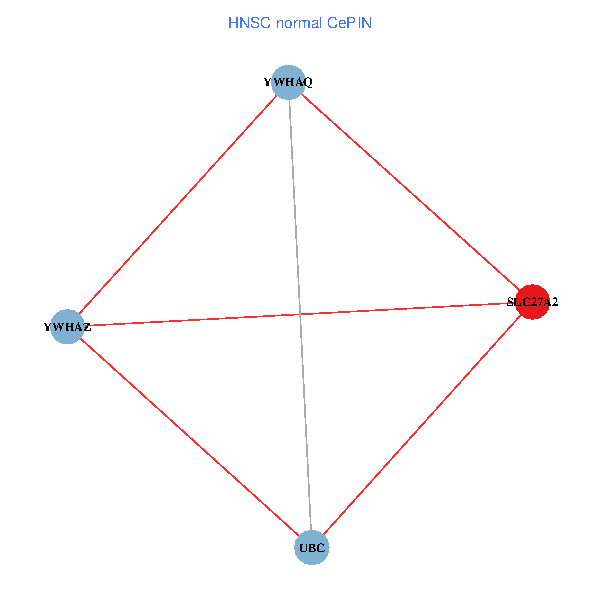
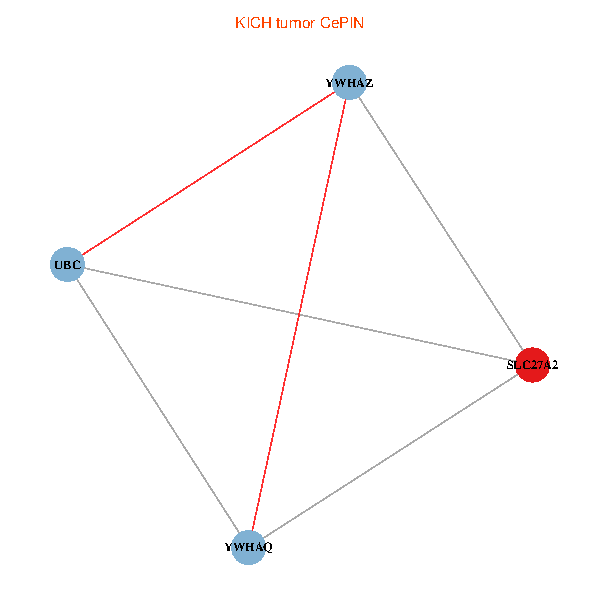
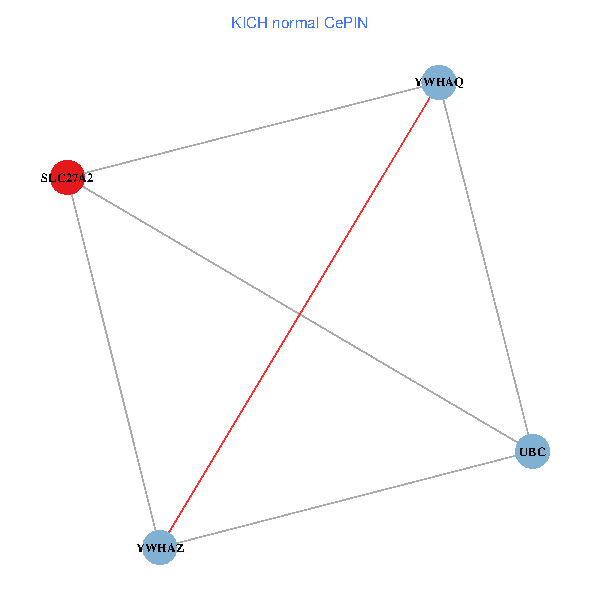
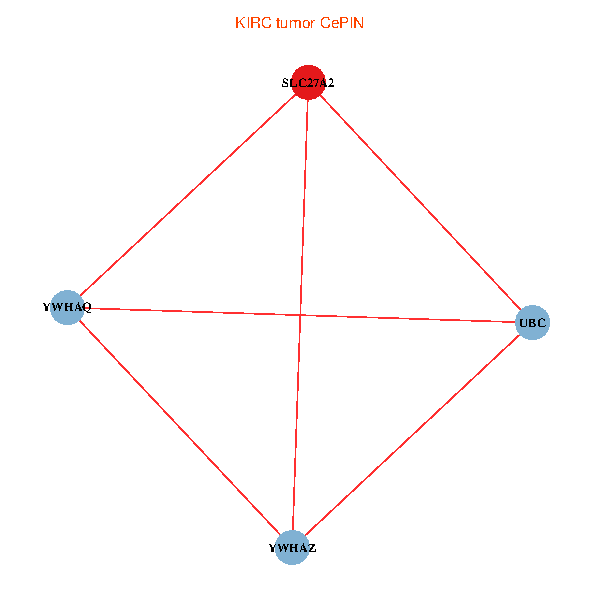
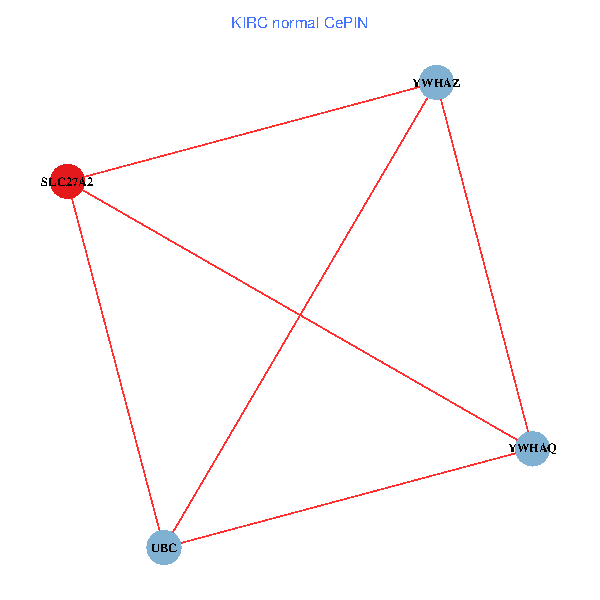
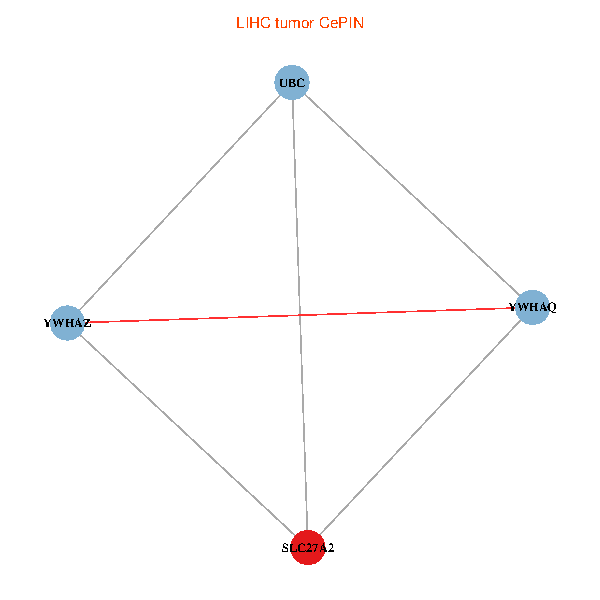
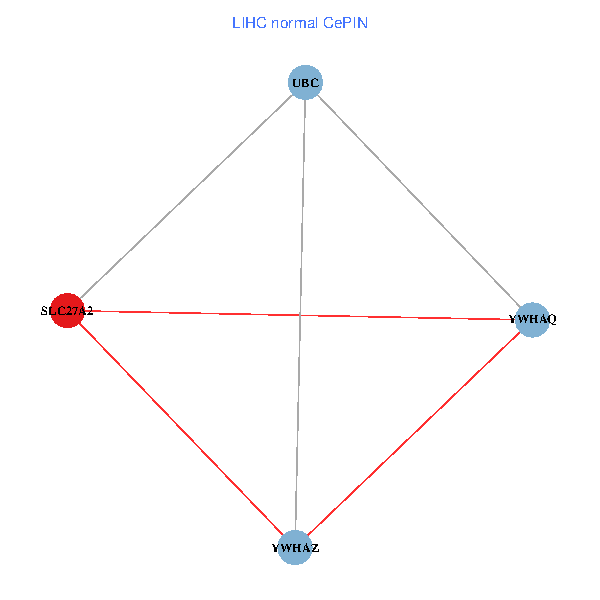
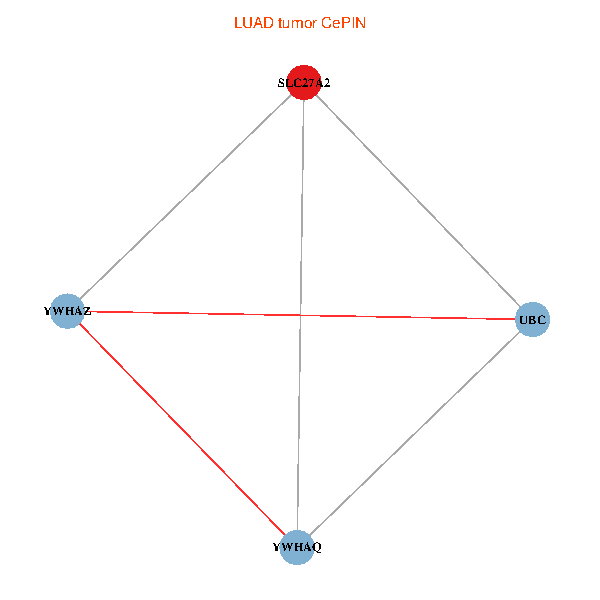
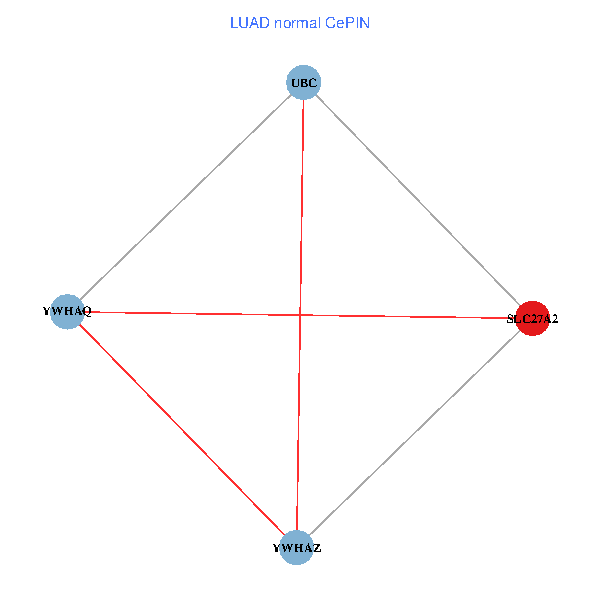
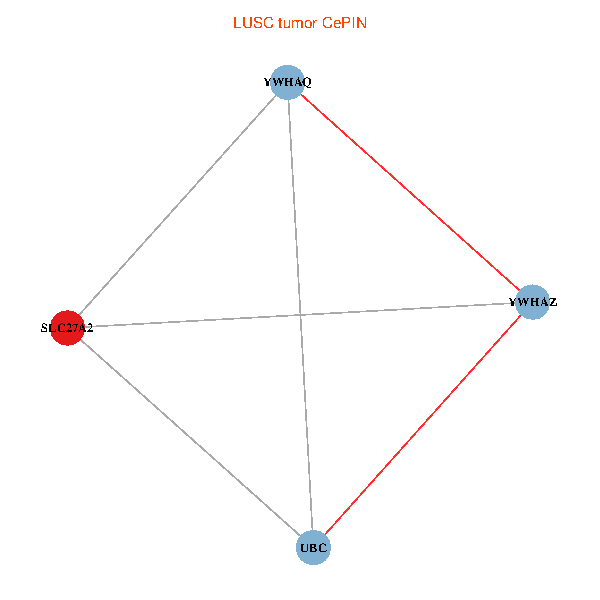
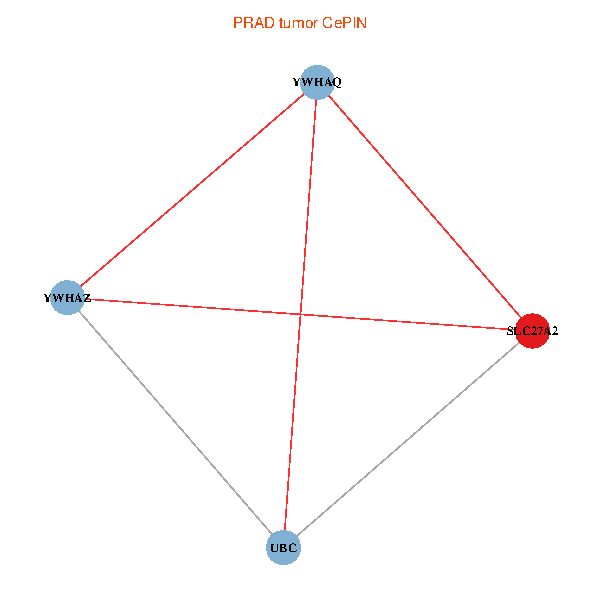
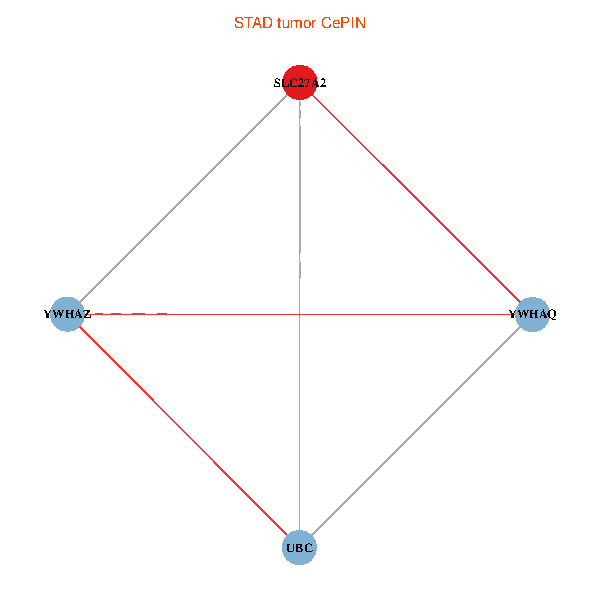
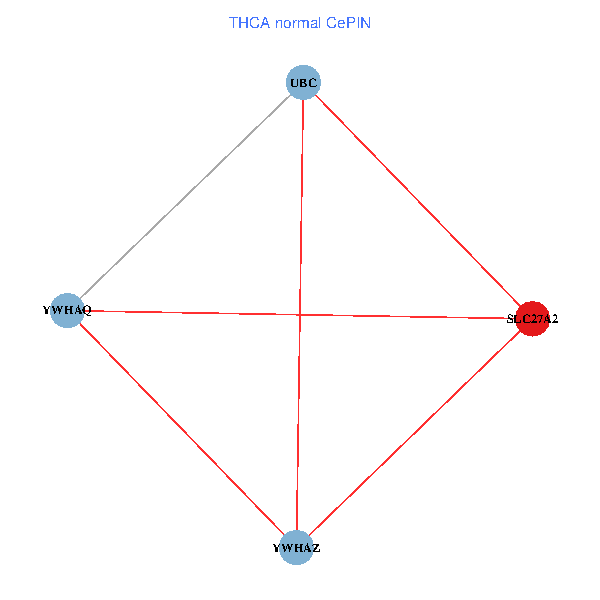
| Co-expressed gene networks based on protein-protein interaction data (CePIN) (TCGA IlluminaHiSeq_RNASeqV2, pan-cancer normalized log2(norm_counts+1) data, version 2016-08-16) (PINA2 ppi data) |
| BRCA (tumor) | BRCA (normal) |
| SLC27A2, UBC, YWHAZ, YWHAQ (tumor) | SLC27A2, UBC, YWHAZ, YWHAQ (normal) |
 |  |
| COAD (tumor) | COAD (normal) |
| SLC27A2, UBC, YWHAZ, YWHAQ (tumor) | SLC27A2, UBC, YWHAZ, YWHAQ (normal) |
 |  |
| HNSC (tumor) | HNSC (normal) |
| SLC27A2, UBC, YWHAZ, YWHAQ (tumor) | SLC27A2, UBC, YWHAZ, YWHAQ (normal) |
 |  |
| KICH (tumor) | KICH (normal) |
| SLC27A2, UBC, YWHAZ, YWHAQ (tumor) | SLC27A2, UBC, YWHAZ, YWHAQ (normal) |
 |  |
| KIRC (tumor) | KIRC (normal) |
| SLC27A2, UBC, YWHAZ, YWHAQ (tumor) | SLC27A2, UBC, YWHAZ, YWHAQ (normal) |
 |  |
| KIRP (tumor) | KIRP (normal) |
| SLC27A2, UBC, YWHAZ, YWHAQ (tumor) | SLC27A2, UBC, YWHAZ, YWHAQ (normal) |
 |  |
| LIHC (tumor) | LIHC (normal) |
| SLC27A2, UBC, YWHAZ, YWHAQ (tumor) | SLC27A2, UBC, YWHAZ, YWHAQ (normal) |
 |  |
| LUAD (tumor) | LUAD (normal) |
| SLC27A2, UBC, YWHAZ, YWHAQ (tumor) | SLC27A2, UBC, YWHAZ, YWHAQ (normal) |
 |  |
| LUSC (tumor) | LUSC (normal) |
| SLC27A2, UBC, YWHAZ, YWHAQ (tumor) | SLC27A2, UBC, YWHAZ, YWHAQ (normal) |
 |  |
| PRAD (tumor) | PRAD (normal) |
| SLC27A2, UBC, YWHAZ, YWHAQ (tumor) | SLC27A2, UBC, YWHAZ, YWHAQ (normal) |
 |  |
| STAD (tumor) | STAD (normal) |
| SLC27A2, UBC, YWHAZ, YWHAQ (tumor) | SLC27A2, UBC, YWHAZ, YWHAQ (normal) |
 |  |
| THCA (tumor) | THCA (normal) |
| SLC27A2, UBC, YWHAZ, YWHAQ (tumor) | SLC27A2, UBC, YWHAZ, YWHAQ (normal) |
 |  |
| Top |
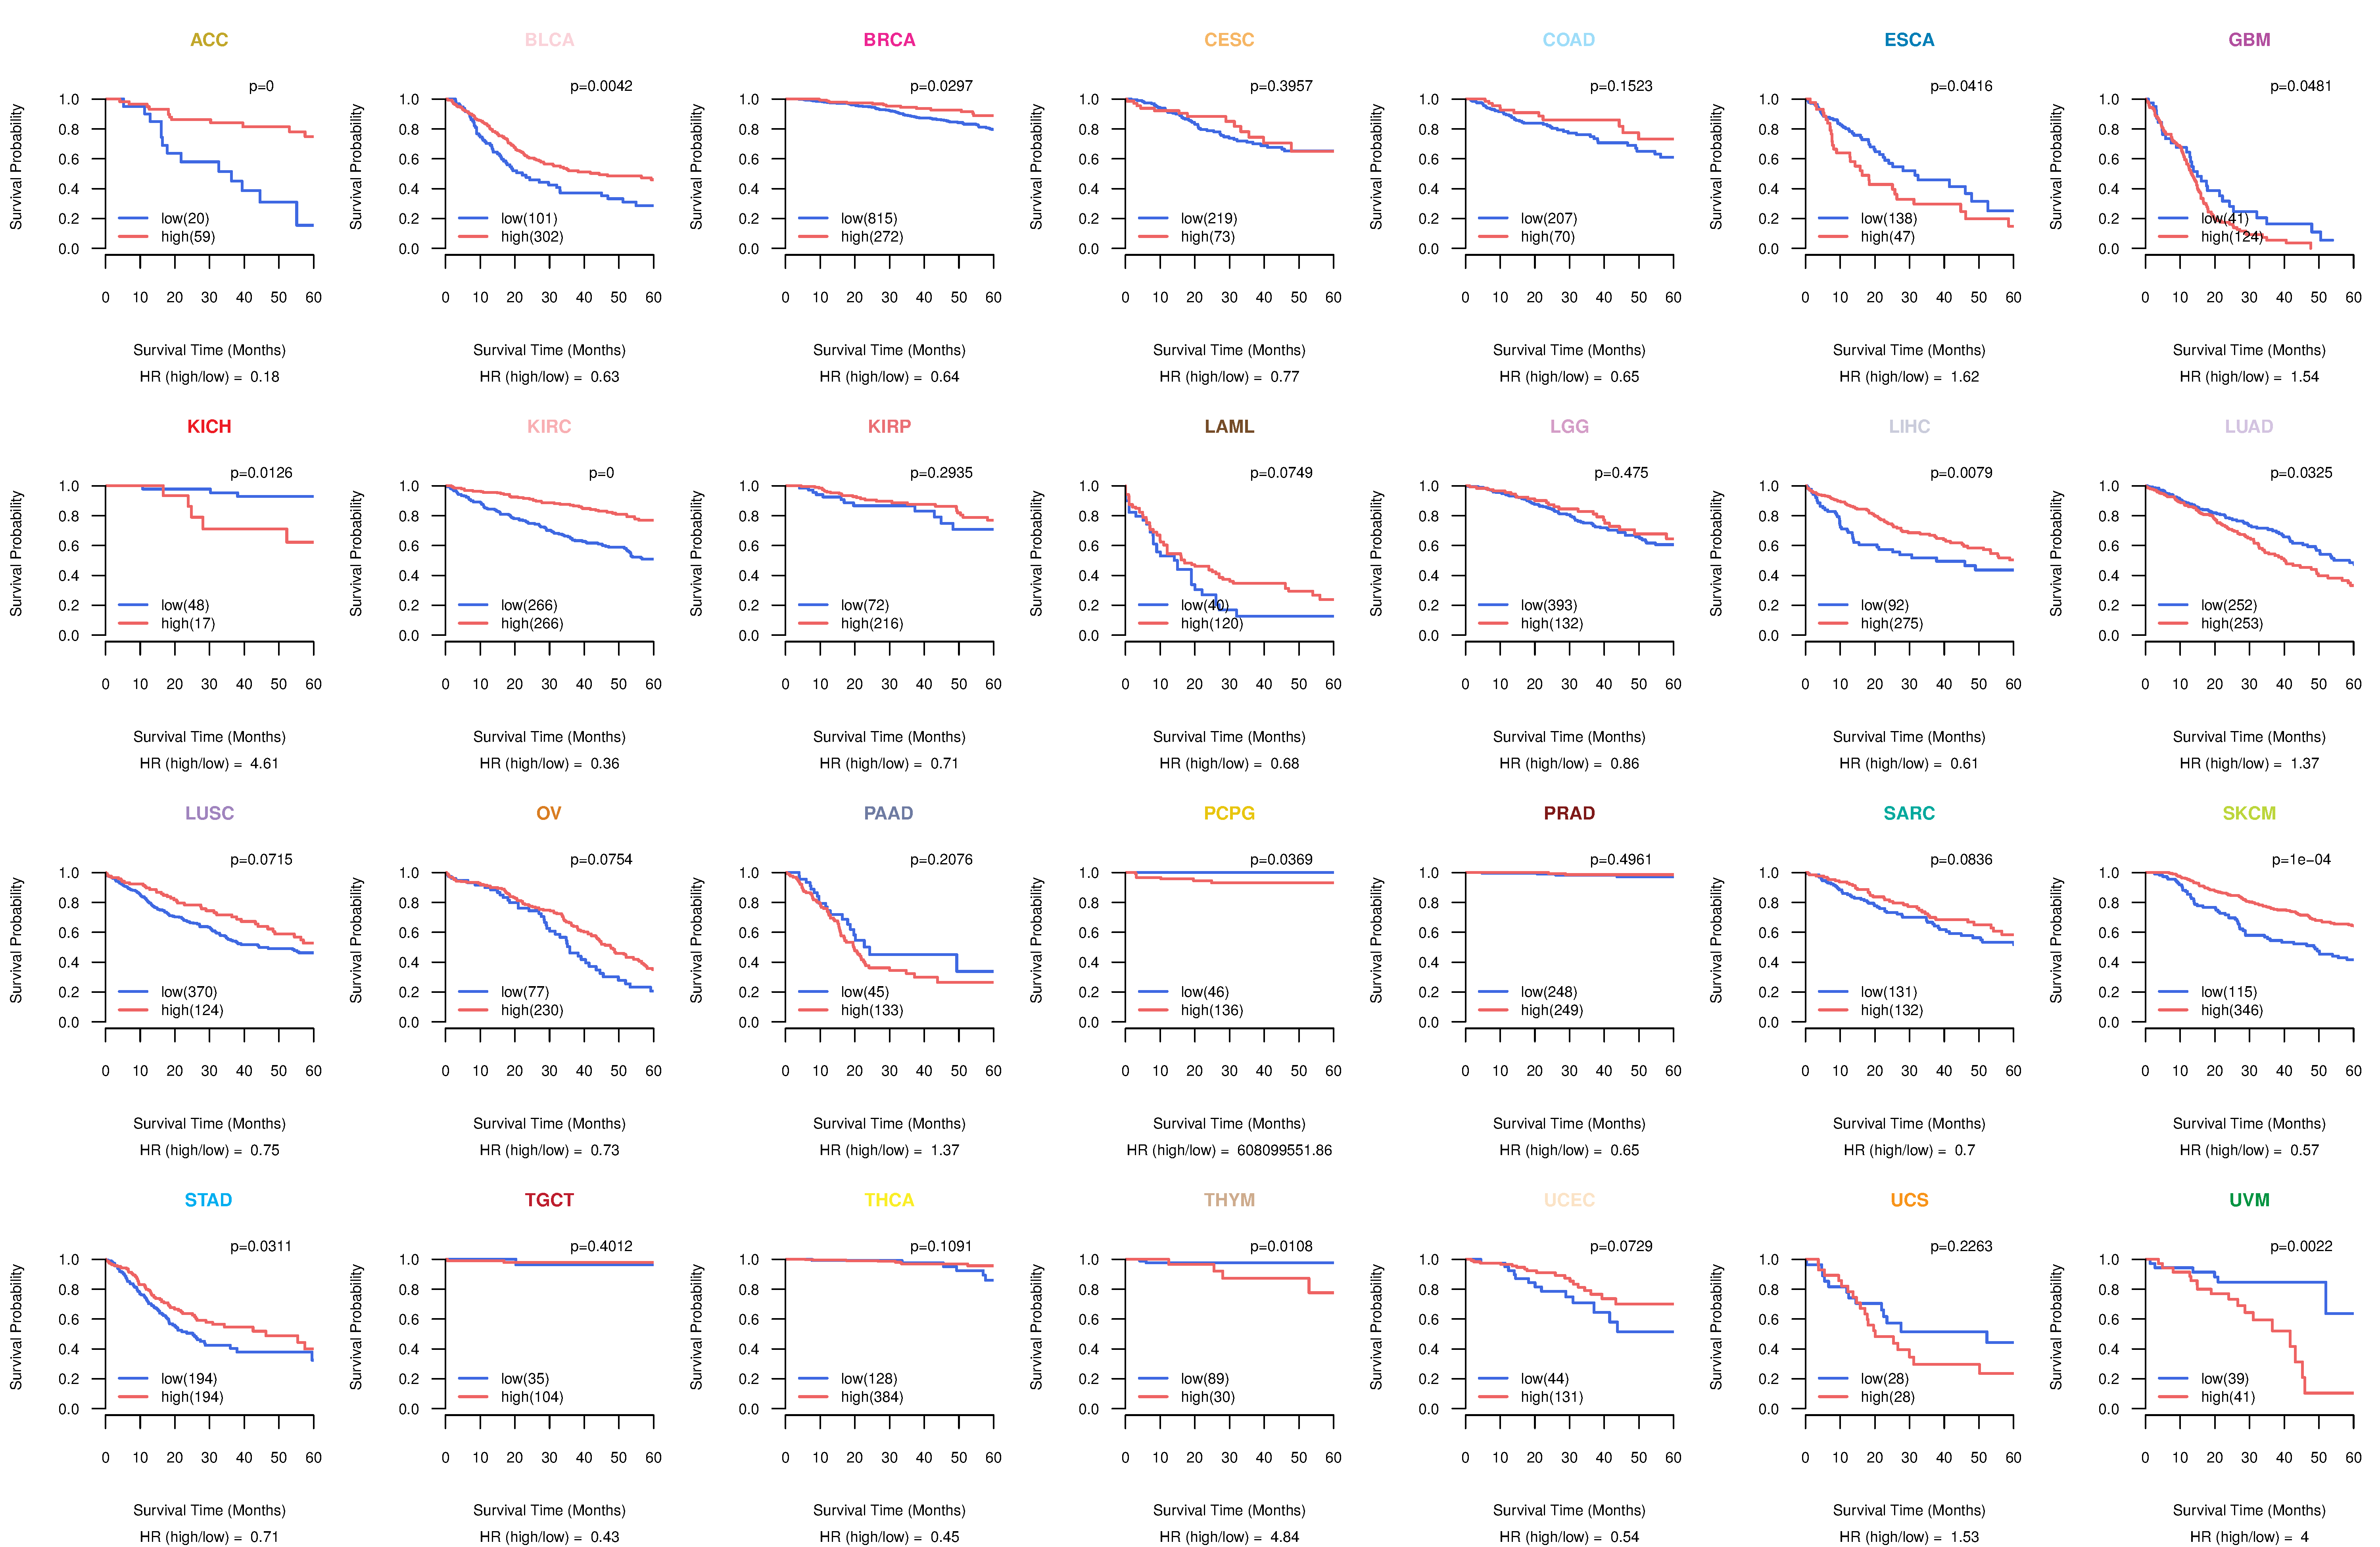
| TissGeneProg for SLC27A2 |
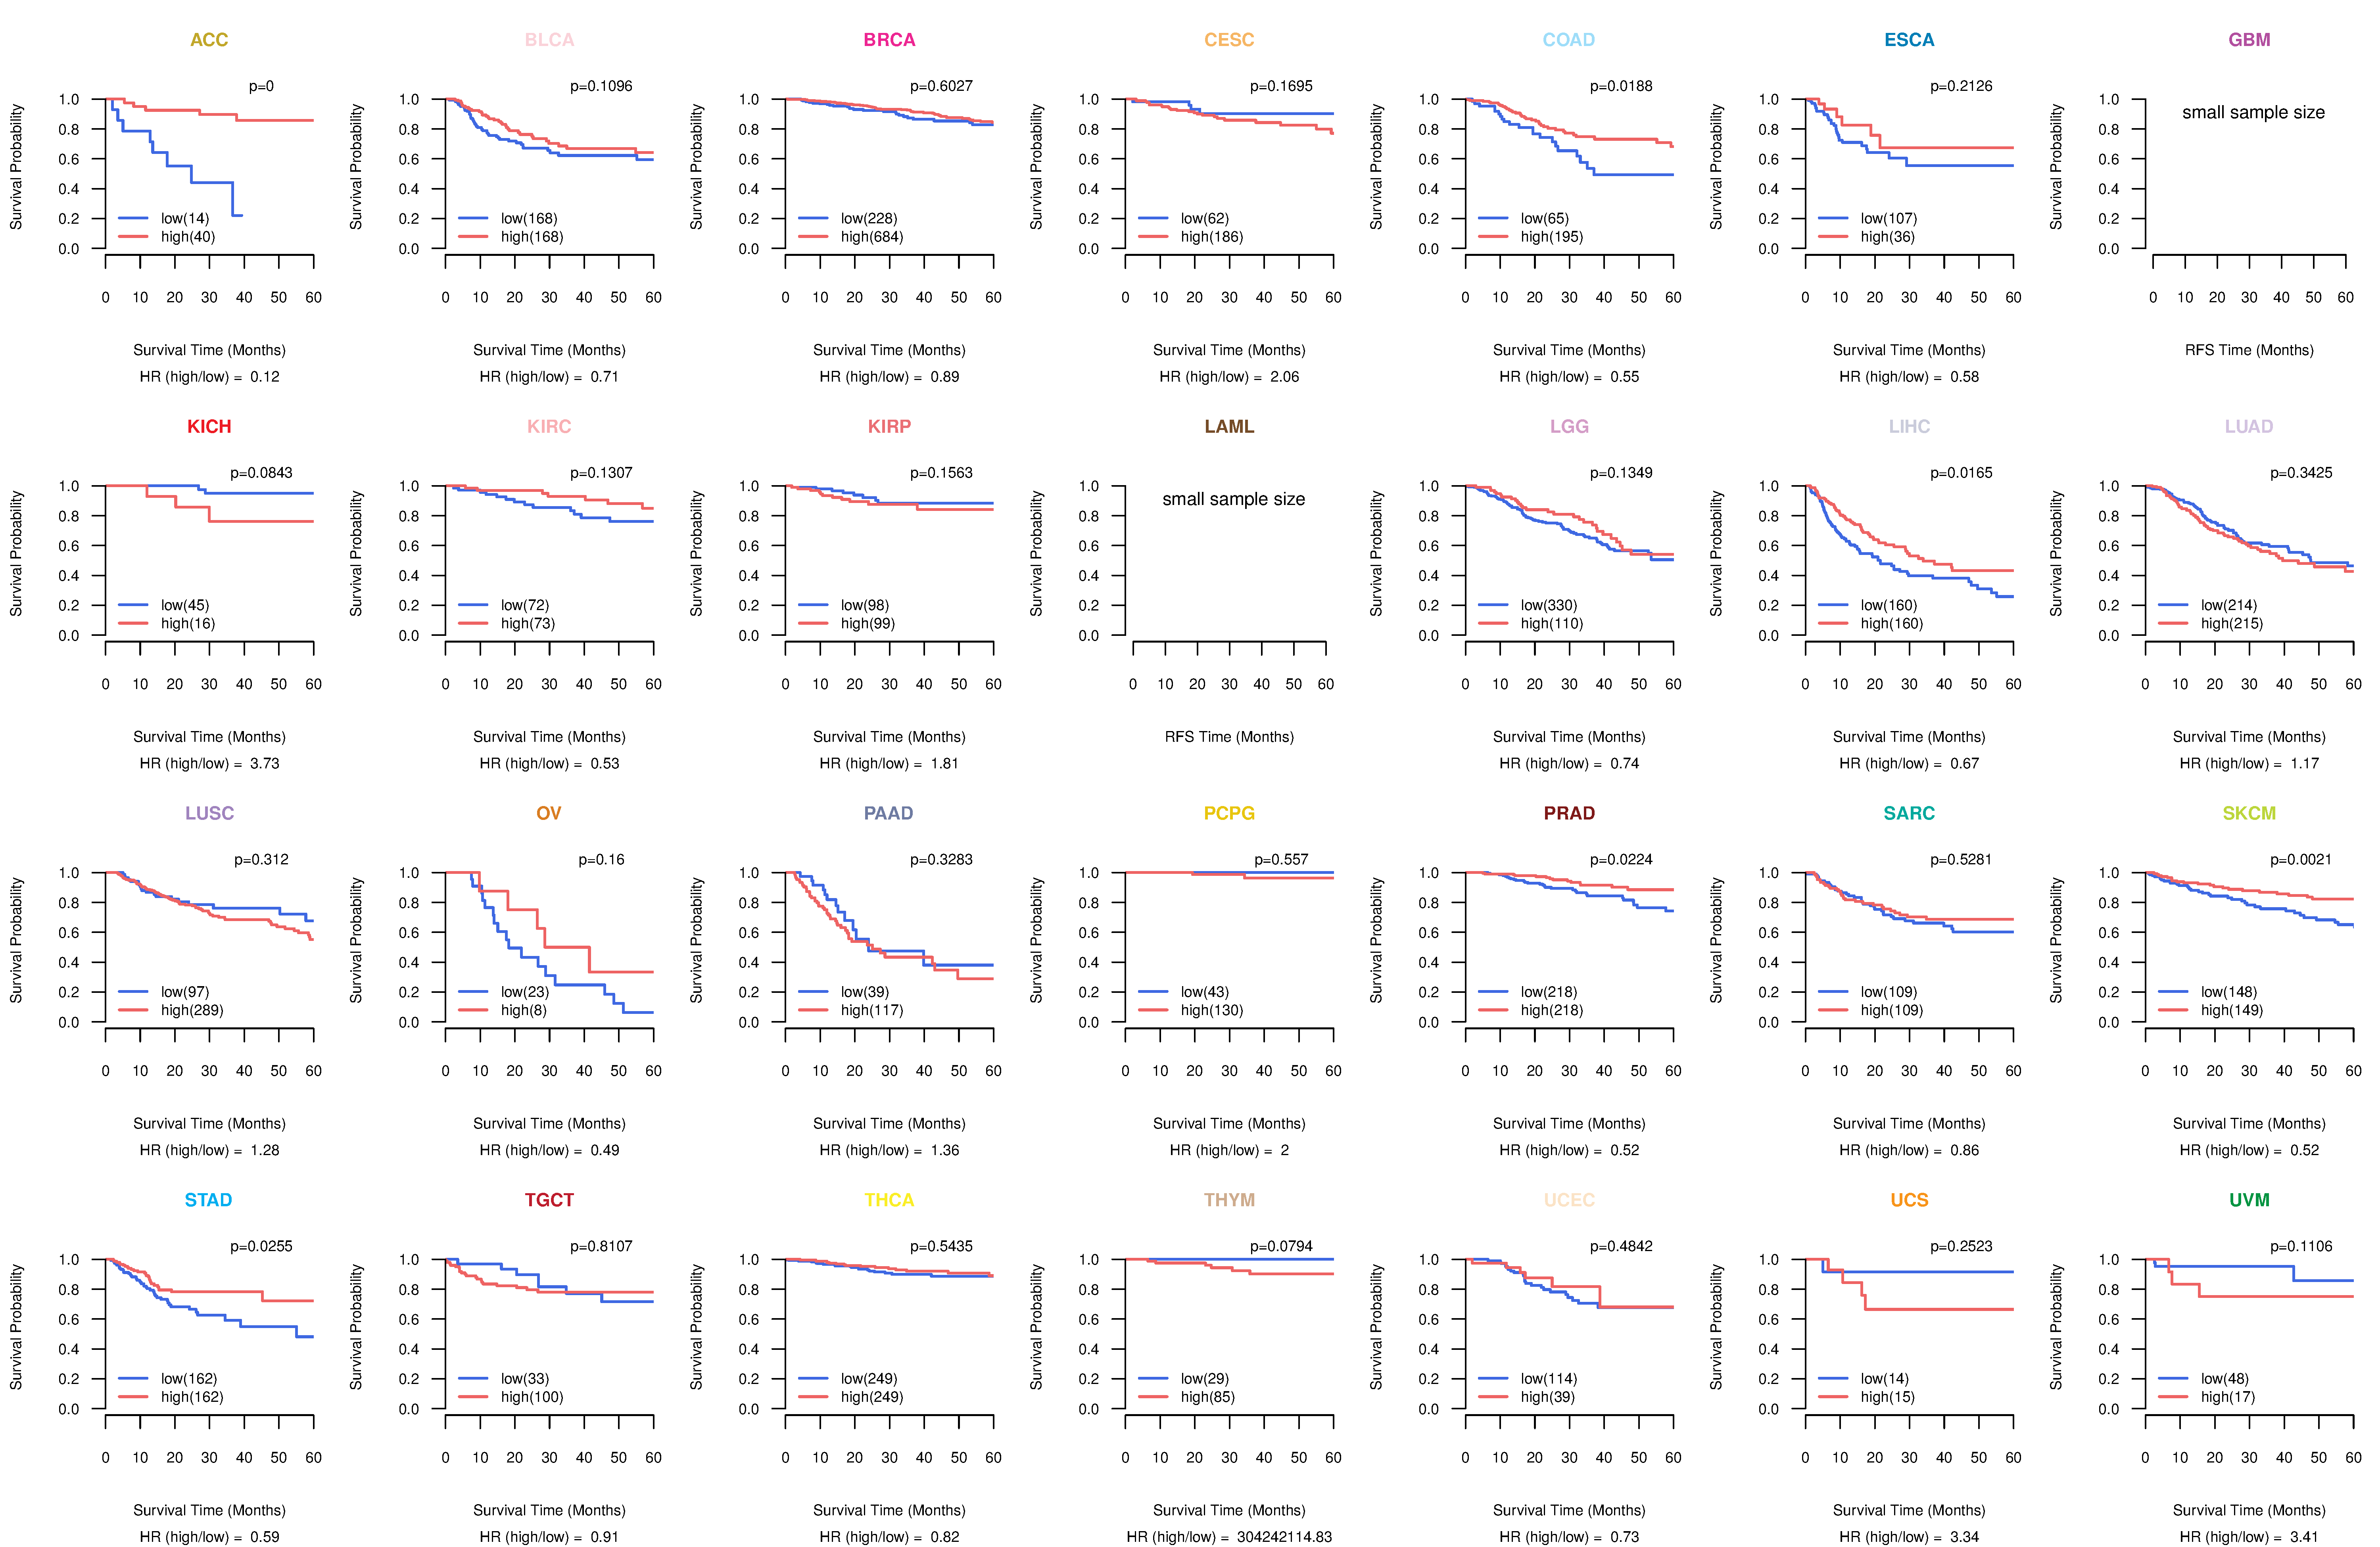
| Kaplan-Meier plots with logrank tests of overall survival (OS) using 28 cancer types (TCGA IlluminaHiSeq_RNASeqV2, pan-cancer normalized log2(norm_counts+1) data, version 2016-08-16) (TCGA clinicalMatrix, phenotype data, version 2016-04-27) * Click on the image to enlarge it in a new window. |
 |
| Kaplan-Meier plots with logrank test of relapse free survival (RFS) using 28 cancer types (TCGA IlluminaHiSeq_RNASeqV2, pan-cancer normalized log2(norm_counts+1) data, version 2016-08-16) (TCGA clinicalMatrix, phenotype data, version 2016-04-27) * Click on the image enlarge it in a new window. |
 |
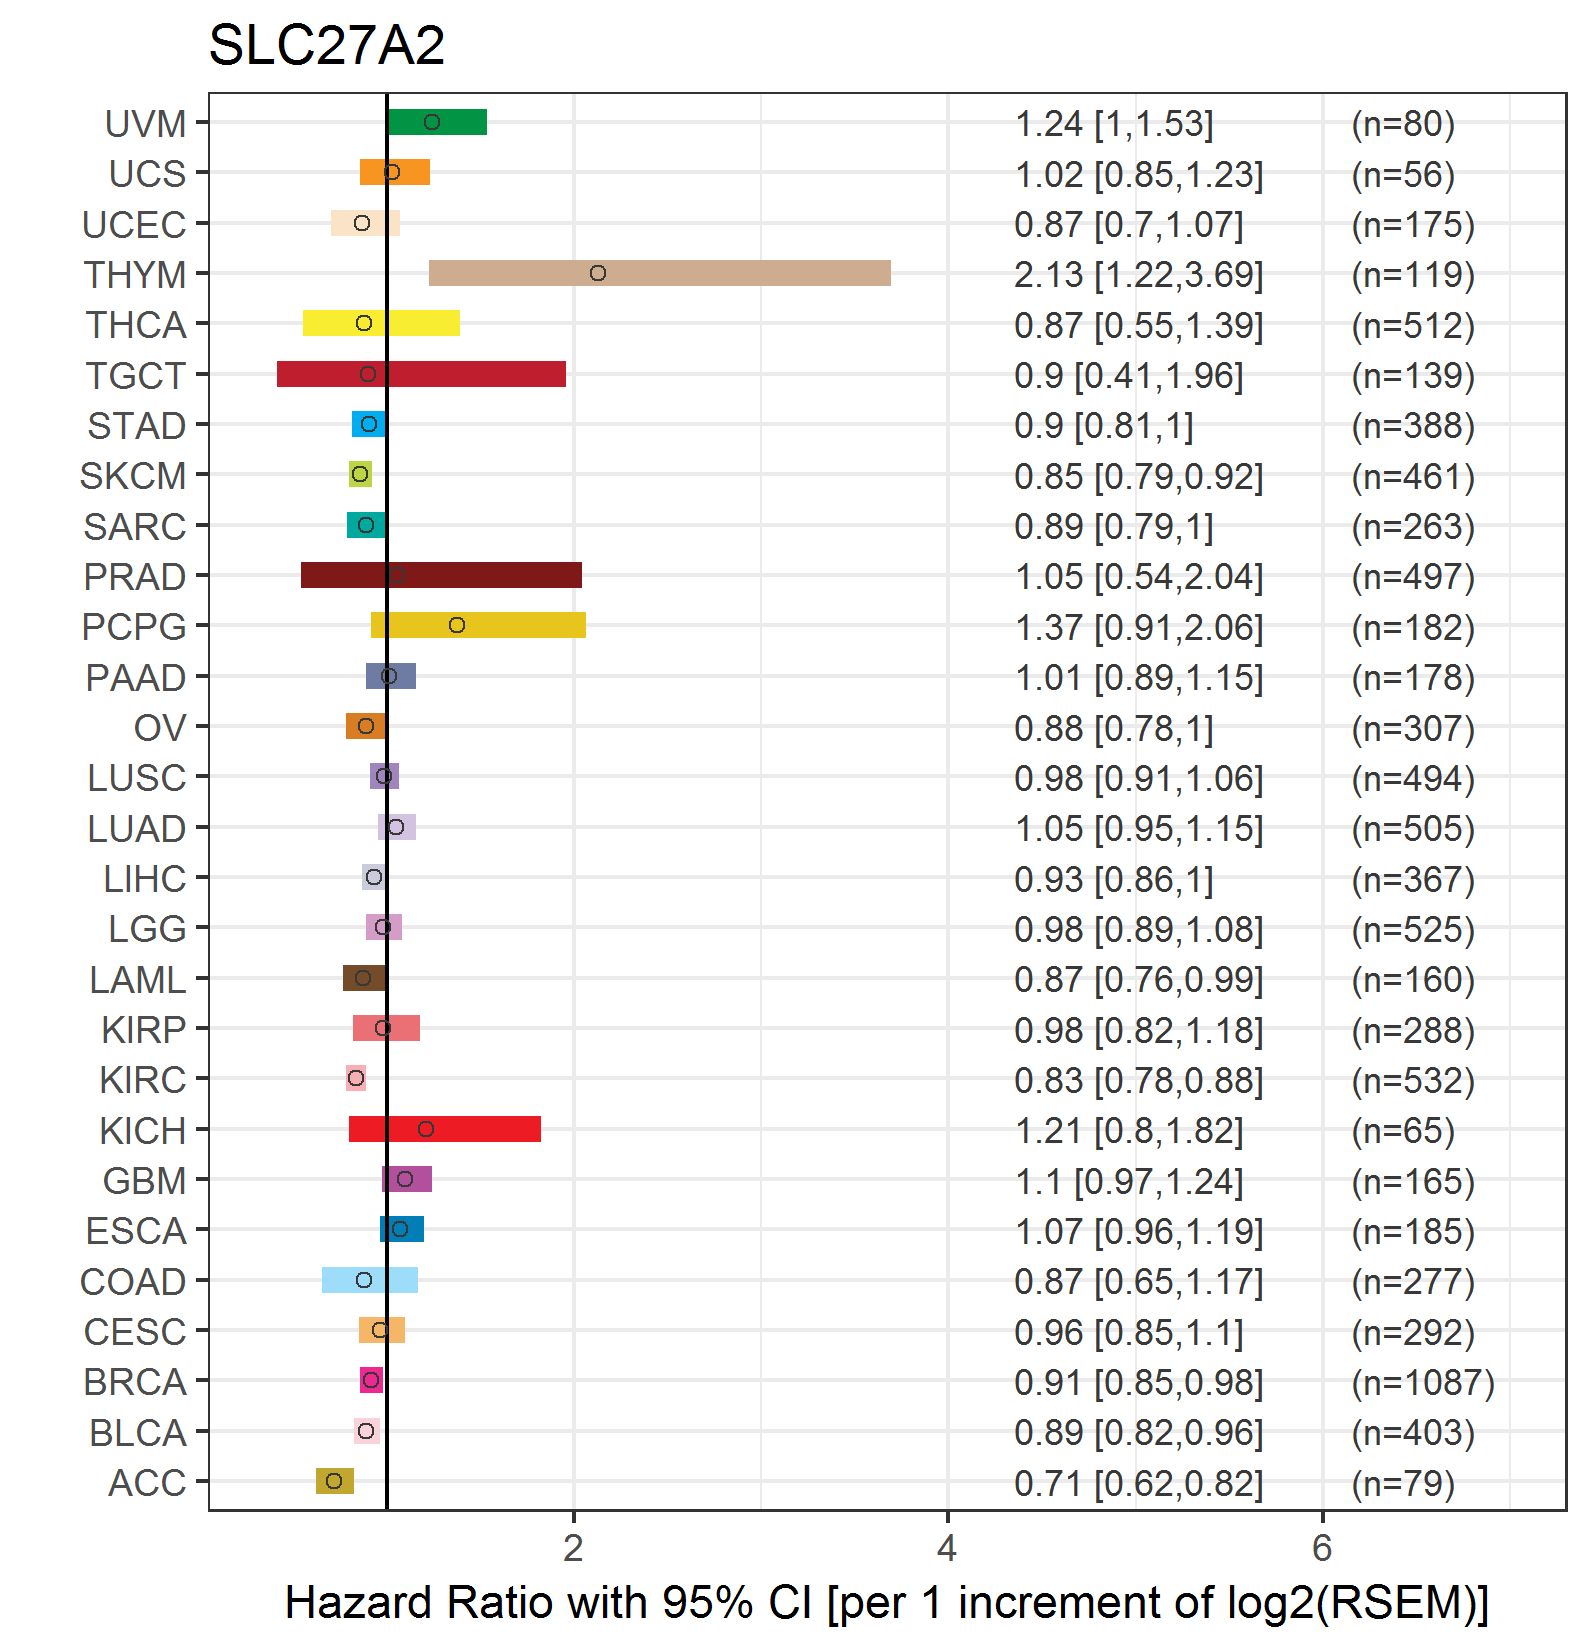
| Forest plot of Cox proportional hazard ratio (HR) and 95% CI of overall survival (OS) using 28 cancer types (TCGA IlluminaHiSeq_RNASeqV2, pan-cancer normalized log2(norm_counts+1) data, version 2016-08-16) (TCGA clinicalMatrix, phenotype data, version 2016-04-27) * Click on the image enlarge it in a new window. |
 |
| Forest plot of Cox proportional hazard ratio (HR) and 95% CI of relapse free survival (RFS) using 28 cancer types (TCGA IlluminaHiSeq_RNASeqV2, pan-cancer normalized log2(norm_counts+1) data, version 2016-08-16) (TCGA clinicalMatrix, phenotype data, version 2016-04-27) * Click on the image enlarge it in a new window. |
 |
| Top |
| TissGeneClin for SLC27A2 |
| TissGeneDrug for SLC27A2 |
| Drug information targeting TissGene (DrugBank Version 5.0.6, 2017-04-01) |
| DrugBank ID | Drug name | Drug activity | Drug type | Drug status |
| Top |
| TissGeneDisease for SLC27A2 |
| Disease information associated with TissGene (DisGeNet, 2016-06-01) |
| Disease ID | Disease name | # pubmeds | Source |
| umls:C0162309 | Adrenoleukodystrophy | 7 | BeFree |
| umls:C1527231 | Adrenomyeloneuropathy | 2 | BeFree |
| umls:C0002395 | Alzheimer's Disease | 1 | GAD |
| umls:C0006142 | Malignant neoplasm of breast | 1 | BeFree |
| umls:C0242379 | Malignant neoplasm of lung | 1 | BeFree |
| umls:C0400966 | Non-alcoholic Fatty Liver Disease | 1 | BeFree |
| umls:C0497406 | Overweight | 1 | BeFree |
| umls:C0555198 | Malignant Glioma | 1 | BeFree |
| umls:C0678222 | Breast Carcinoma | 1 | BeFree |
| umls:C0684249 | Carcinoma of lung | 1 | BeFree |
| umls:C1458155 | Mammary Neoplasms | 1 | BeFree |
|
Copyright 2016-Present - The University of Texas Health Science Center at Houston (UTHealth) Web File Viewing | How to Report, Fraud, Waste and Abuse | State of Texas | Statewide Search | Texas Homeland Security | Site Policies |