 |
| |
| |
| |
| |
| |
| |
|

| TissGeneSummary for SOX30 |
 Gene summary Gene summary |
| Basic gene information | Gene symbol | SOX30 |
| Gene name | SRY (sex determining region Y)-box 30 | |
| Synonyms | - | |
| Cytomap | UCSC genome browser: 5q33 | |
| Type of gene | protein-coding | |
| RefGenes | NM_007017.2, NM_178424.1, | |
| Description | Sox30 protein type IItranscription factor SOX-30 | |
| Modification date | 20141207 | |
| dbXrefs | MIM : 606698 | |
| HGNC : HGNC | ||
| Ensembl : ENSG00000039600 | ||
| HPRD : 09461 | ||
| Vega : OTTHUMG00000130247 | ||
| Protein | UniProt: go to UniProt's Cross Reference DB Table | |
| Expression | CleanEX: HS_SOX30 | |
| BioGPS: 11063 | ||
| Pathway | NCI Pathway Interaction Database: SOX30 | |
| KEGG: SOX30 | ||
| REACTOME: SOX30 | ||
| Pathway Commons: SOX30 | ||
| Context | iHOP: SOX30 | |
| ligand binding site mutation search in PubMed: SOX30 | ||
| UCL Cancer Institute: SOX30 | ||
| Assigned class in TissGDB* | A | |
| Included tissue-specific gene expression resources | ||
| Specific-tissues in normal samples (assigned by TissGDB using HPA, TiGER, and GTEx) | Testis | |
| Cancer types related to the specific-tissues in cancer samples (assigned by TissGDB using TCGA) | TGCT | |
| Reference showing the relevant tissue of SOX30 | Epigenetic regulation of sox30 is associated with testis development in mice. Han F, Dong Y, Liu W, Ma X, Shi R, Chen H, Cui Z, Ao L, Zhang H, Cao J, Liu J. PLoS One. 2014 May 8;9(5):e97203. doi: 10.1371/journal.pone.0097203. eCollection 2014 (pmid:24810894) go to article | |
| Description by TissGene annotations | Fused withOncogene | |
| * Class A consists of genes with literature evidence and is part of the cTissGenes. Class B consists of only cTissGenes without additional evidence. The remaining genes belong to Class C. |
| Gene ontology having evidence of Inferred from Direct Assay (IDA) from Entrez |
| GO ID | GO term | PubMed ID | GO:0006357 | regulation of transcription from RNA polymerase II promoter | 10359848 | GO:0006357 | regulation of transcription from RNA polymerase II promoter | 10359848 | GO:0006366 | transcription from RNA polymerase II promoter | 10359848 | GO:0006357 | regulation of transcription from RNA polymerase II promoter | 10359848 | GO:0006357 | regulation of transcription from RNA polymerase II promoter | 10359848 | GO:0006366 | transcription from RNA polymerase II promoter | 10359848 |
| Top |
| TissGeneExp for SOX30 |
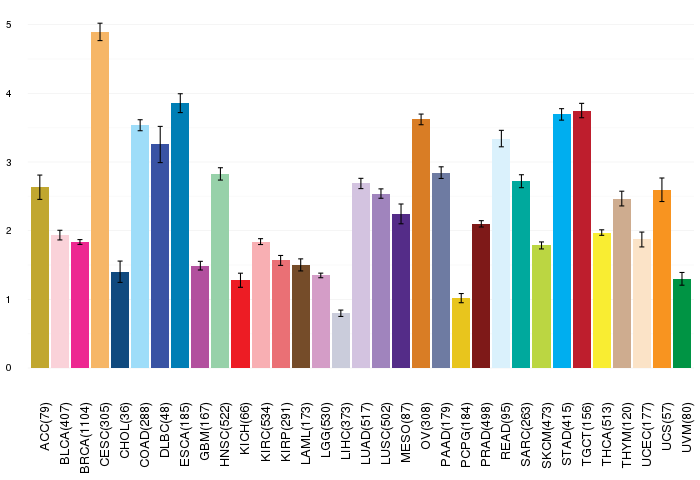
| Gene expressions across 28 cancer types (X-axis: cancer type and Y-axis: log2(norm_counts+1)) (TCGA IlluminaHiSeq_RNASeqV2, pan-cancer normalized log2(norm_counts+1) data, version 2016-08-16) |
 |
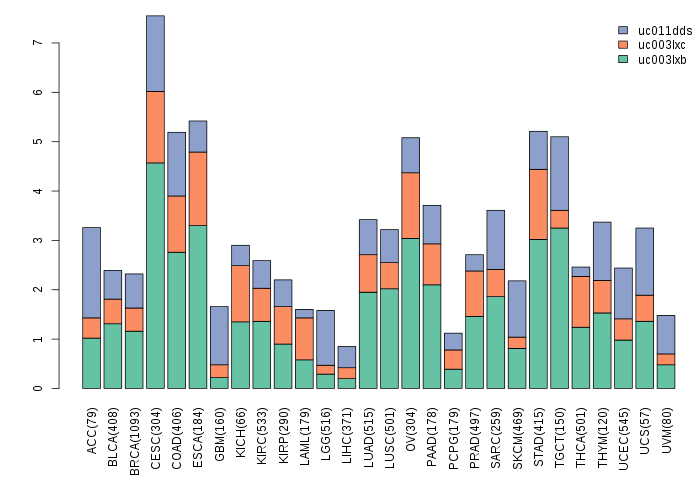
| Gene isoform expressions across 28 cancer types (X-axis: cancer type and Y-axis: log2(norm_counts+1)) (TCGA pan-cancer tcga_rsem_isoform_tpm, version 2016-09-01) |
 |
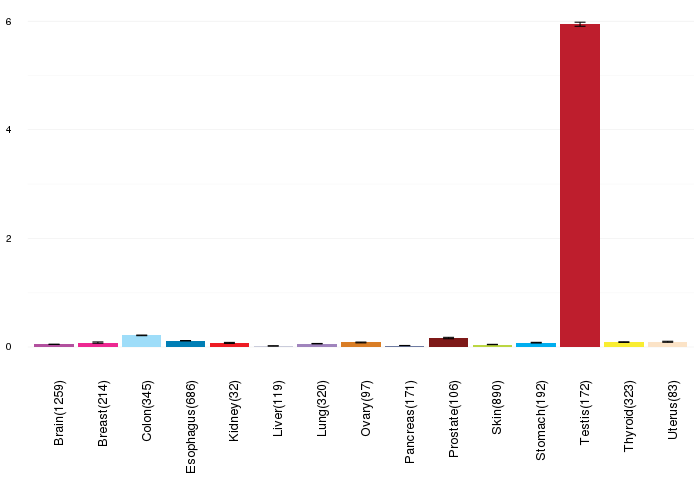
| Gene expressions across normal tissues of GTEx data (GTEx GTEx_Analysis_v6_RNA-seq_RNA-SeQCv1.1.8_gene_rpkm.gct) - Here, we shows the matched tissue types only among our 28 cancer types. |
 |
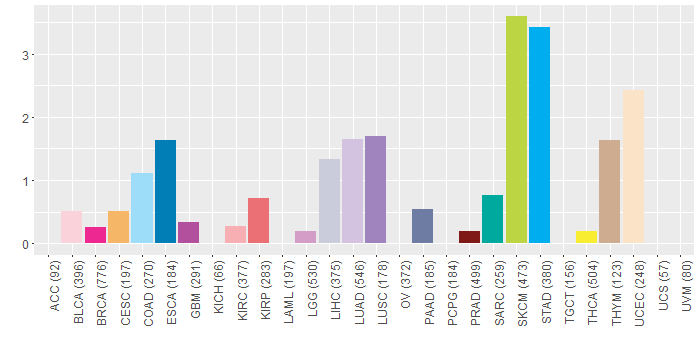
| Different expressions across 14 cancer types with more than 10 samples between matched tumors and normals (X-axis: cancer type and Y-axis: log2(norm_counts+1)) (TCGA IlluminaHiSeq_RNASeqV2, pan-cancer normalized log2(norm_counts+1) data, version 2016-08-16) |
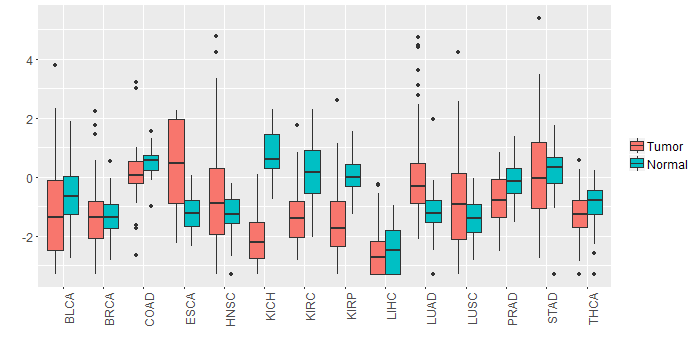 |
| - Significantly differentially expressed cancer types and information. (|Fold change|>1 and FDR<0.05) |
| Cancer type | Mean(exp) in tumor | Mean(exp) in matched normal | Log2FC | P-val. | FDR |
| KICH | -2.072516431 | 0.782407569 | -2.854924 | 3.46E-15 | 7.33E-14 |
| KIRC | -1.384384931 | 0.124333125 | -1.508718056 | 5.59E-18 | 3.64E-17 |
| KIRP | -1.567219306 | 0.128371319 | -1.695590625 | 2.78E-08 | 1.94E-07 |
| LUAD | 0.079524121 | -1.247094845 | 1.326618966 | 3.29E-07 | 1.19E-06 |
| Top |
| TissGene-miRNA for SOX30 |
| Significantly anti-correlated miRNAs of TissGene across 28 cancer types (Gene-miRNA relations from TargetScanHuman Relsease 7.1, Conserved_Site_Context_Scores.txt.zip, 06.01.2016) (TCGA IlluminaHiSeq_miRNASeq, log2(RPM+1) data, version 2016-11-21) (TCGA IlluminaHiSeq_RNASeqV2, log2(normalized_count+1) data, version 2016-08-16) (Spearman’s Rank Correlation (p-value<0.05 and coefficient<-0.25)) |
| Cancer type | miRNA id | miRNA accession | P-val. | Coeff. | # samples |
| Top |
| TissGeneMut for SOX30 |
| TissGeneSNV for SOX30 |
| nsSNV counts per each loci. Different colors of circles represent different cancer types. Circle size denotes number of samples. (TCGA somatic mutation (SNPs and small INDELs) data, version 2016-04-25) * Click on the image to enlarge it in a new window. |
 |
 |
| Somatic nucleotide variants of TissGene across 28 cancer types (X-axis: cancer type and Y-axis: % of mutated samples) The numbers in parentheses are numbers of samples with mutation (nsSNVs). (TCGA somatic mutation (SNPs and small INDELs) data, version 2016-04-25) |
 |
| - nsSNVs sorted by frequency. |
| AAchange | Cancer type | # samples |
| p.R339Q | ESCA | 2 |
| p.S526F | SKCM | 1 |
| p.P204L | SKCM | 1 |
| p.A32T | CESC | 1 |
| p.R512H | COAD | 1 |
| p.A188V | LGG | 1 |
| p.R153P | CESC | 1 |
| p.P579Q | UCEC | 1 |
| p.L484I | LUAD | 1 |
| p.L418I | THYM | 1 |
| p.H522Y | LUSC | 1 |
| p.Y623H | COAD | 1 |
| p.R409H | STAD | 1 |
| p.T602I | STAD | 1 |
| p.V749M | DLBC | 1 |
| p.R179* | SKCM | 1 |
| p.R413Q | UCEC | 1 |
| p.R415X | STAD | 1 |
| p.H464R | LIHC | 1 |
| p.P152L | DLBC | 1 |
| p.R415* | STAD | 1 |
| p.G176R | HNSC | 1 |
| p.C55R | STAD | 1 |
| p.S632I | HNSC | 1 |
| p.G201S | SKCM | 1 |
| p.P516S | SKCM | 1 |
| p.L597I | STAD | 1 |
| p.E90K | SKCM | 1 |
| p.R179P | BLCA | 1 |
| p.L286S | PRAD | 1 |
| p.S577R | LIHC | 1 |
| p.D147N | KIRP | 1 |
| p.K383N | READ | 1 |
| p.E190K | STAD | 1 |
| p.R339Q | SKCM | 1 |
| p.R409C | SKCM | 1 |
| p.Y447H | PAAD | 1 |
| p.Q477L | LIHC | 1 |
| p.Q486H | SARC | 1 |
| p.P594A | STAD | 1 |
| p.A553V | SKCM | 1 |
| p.G270R | SKCM | 1 |
| p.R208L | STAD | 1 |
| p.V313I | LUAD | 1 |
| p.E282K | BRCA | 1 |
| p.R443H | STAD | 1 |
| p.R415Q | UCEC | 1 |
| p.A188E | LUAD | 1 |
| p.G639X | THYM | 1 |
| p.R443L | LUAD | 1 |
| p.V294L | LUAD | 1 |
| p.H700Y | SKCM | 1 |
| p.R415* | BRCA | 1 |
| p.D326E | KIRP | 1 |
| p.Q482* | SKCM | 1 |
| p.N430I | LUAD | 1 |
| p.P710L | LIHC | 1 |
| p.P253L | THCA | 1 |
| p.G151W | UCEC | 1 |
| p.F612S | LIHC | 1 |
| p.S517F | SKCM | 1 |
| p.P619L | HNSC | 1 |
| p.S300F | SKCM | 1 |
| p.Q382L | LUAD | 1 |
| p.K383N | SARC | 1 |
| p.P417A | SKCM | 1 |
| p.P585S | SKCM | 1 |
| p.R333T | LUSC | 1 |
| p.E157K | SKCM | 1 |
| p.E746V | STAD | 1 |
| p.G198D | STAD | 1 |
| p.Q482X | SKCM | 1 |
| p.S163F | LUAD | 1 |
| p.P160S | BLCA | 1 |
| p.I284V | KIRC | 1 |
| p.A553T | STAD | 1 |
| p.R352Q | READ | 1 |
| p.R576K | READ | 1 |
| p.P500T | ESCA | 1 |
| p.P585L | LUSC | 1 |
| p.E229X | SKCM | 1 |
| p.L291M | STAD | 1 |
| p.Q255P | GBM | 1 |
| p.P457T | LUAD | 1 |
| p.S281L | SKCM | 1 |
| p.P268L | STAD | 1 |
| p.Y656H | UCEC | 1 |
| p.S48N | COAD | 1 |
| p.F610L | LUAD | 1 |
| p.R545M | UCEC | 1 |
| Top |
| TissGeneCNV for SOX30 |
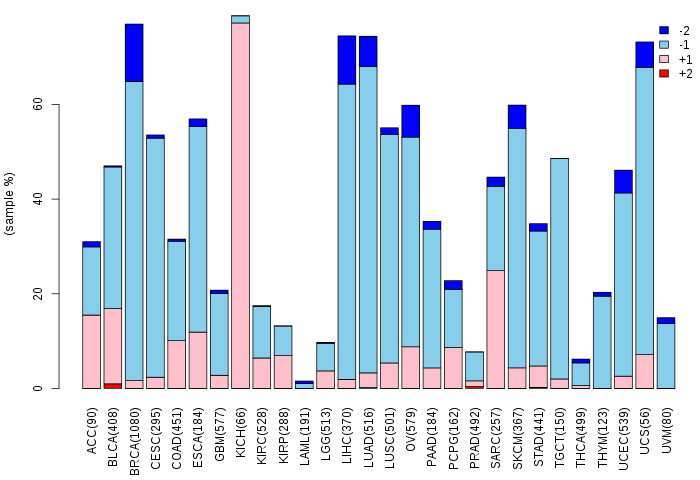
| Copy number variations of TissGene across 28 cancer types (X-axis: cancer type and Y-axis: % of CNV samples) (TCGA Gistic2_CopyNumber_Gistic2_all_data_by_genes, Gistic2 copy number data, version 2016-08-16) |
 |
| Top |
| TissGeneFusions for SOX30 |
| Fusion genes including TissGene (ChimerDB 3.0, 2016-12-01 and TCGA fusion Portal 2015-12-01) |
| Database | Src | Cancer type | Sample | Fusion gene | ORF | 5'-gene BP | 3'-gene BP |
| Chimerdb3.0 | ChiTaRs | NA | AI917322 | SOX30-GOLGA5 | chr5:157065298 | chr14:93263831 |
| Top |
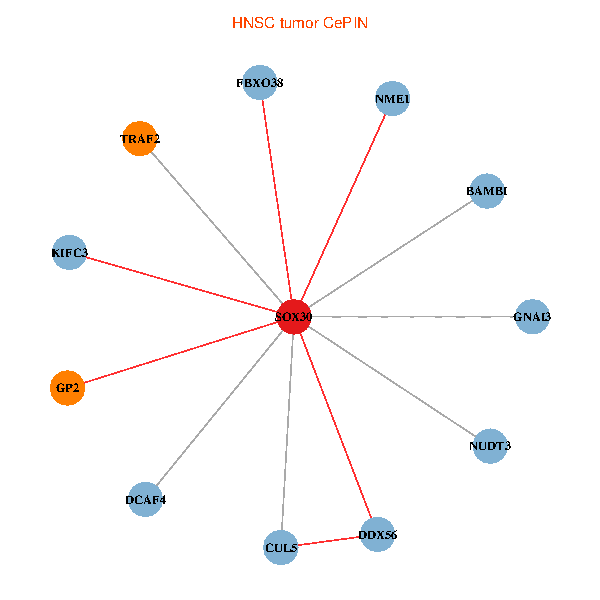
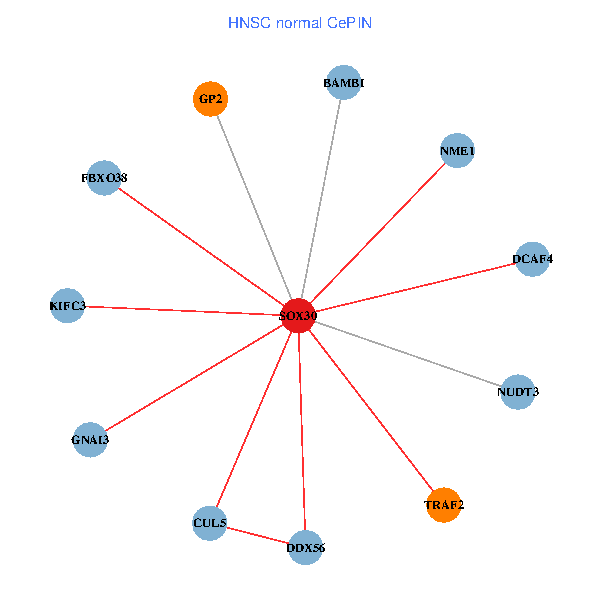
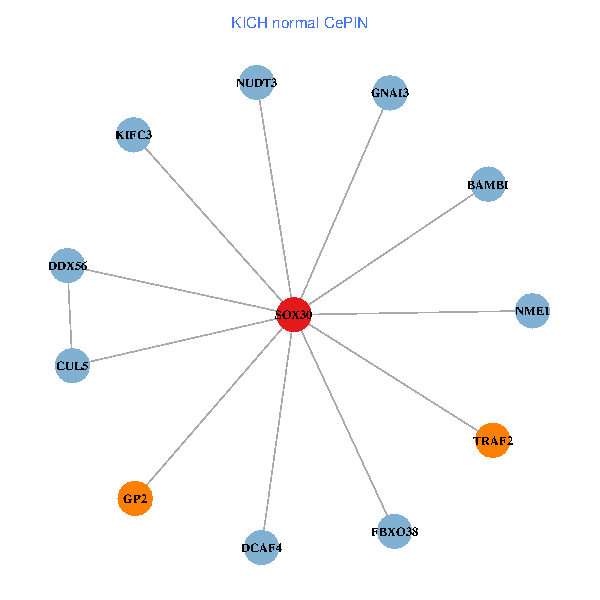
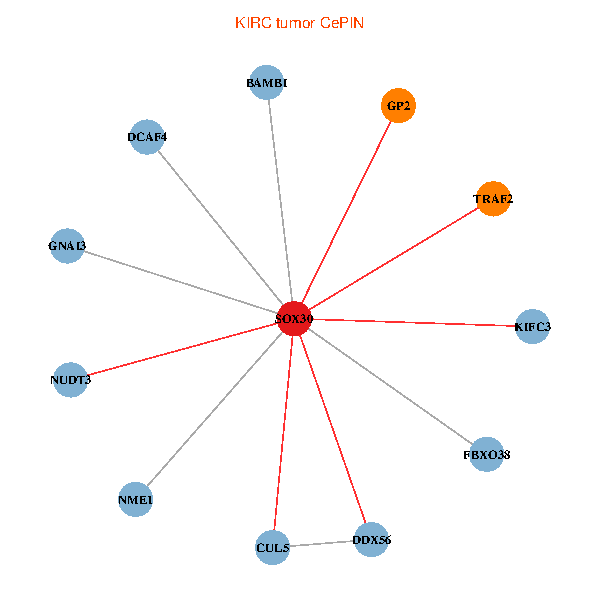
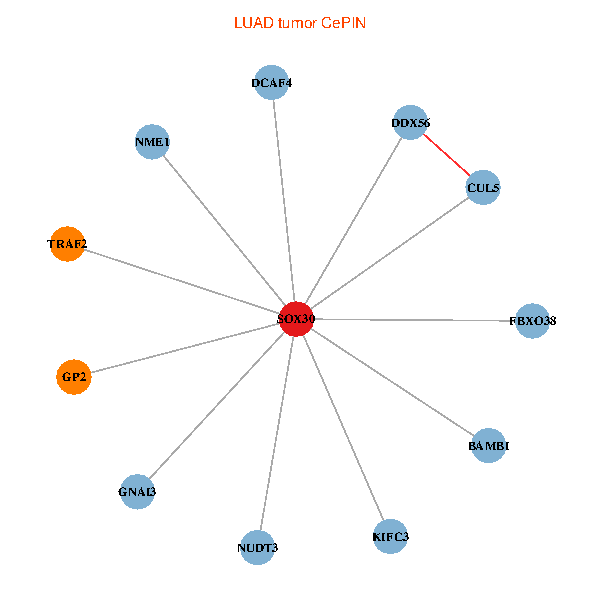
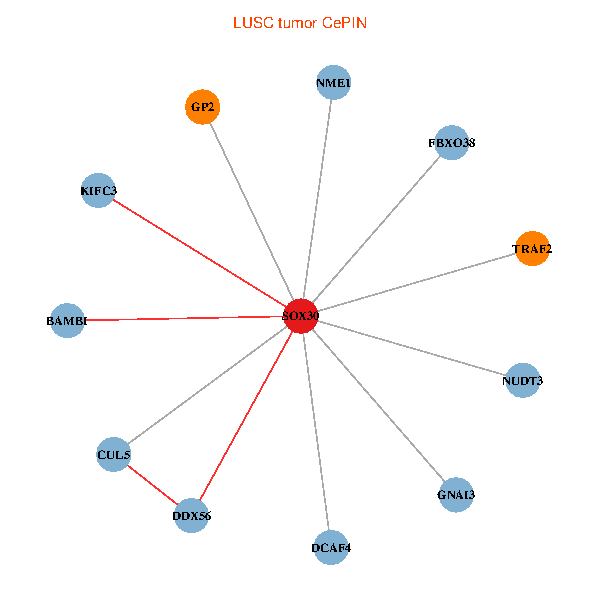
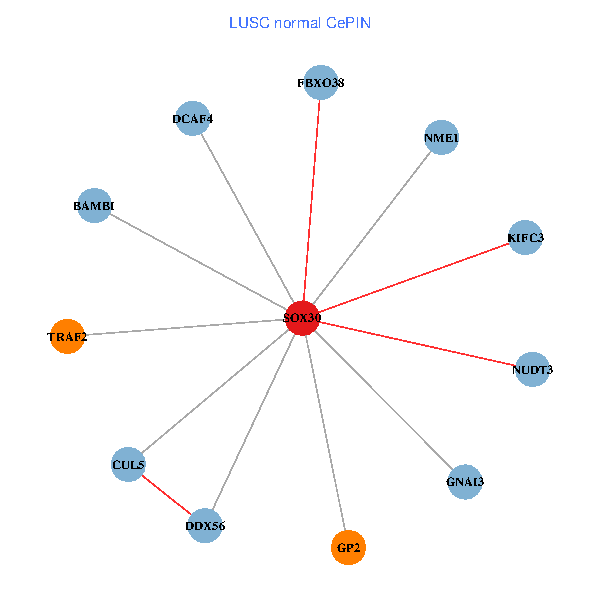
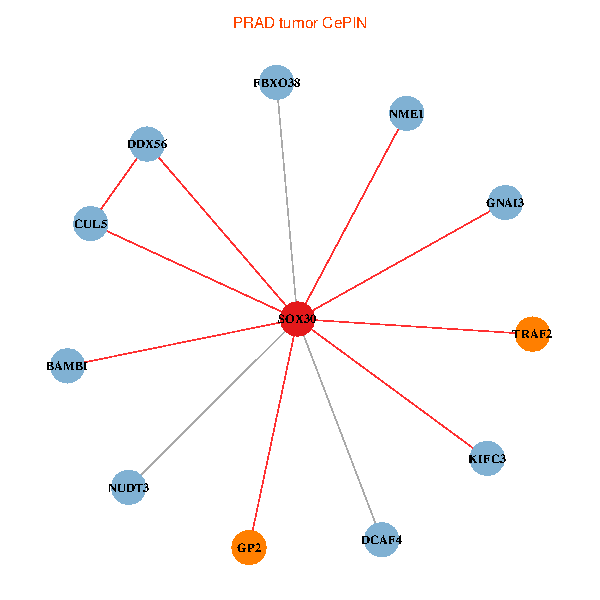
| TissGeneNet for SOX30 |
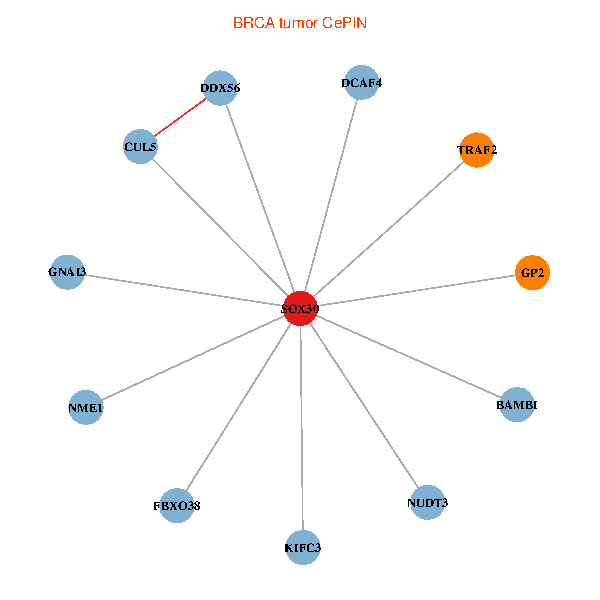
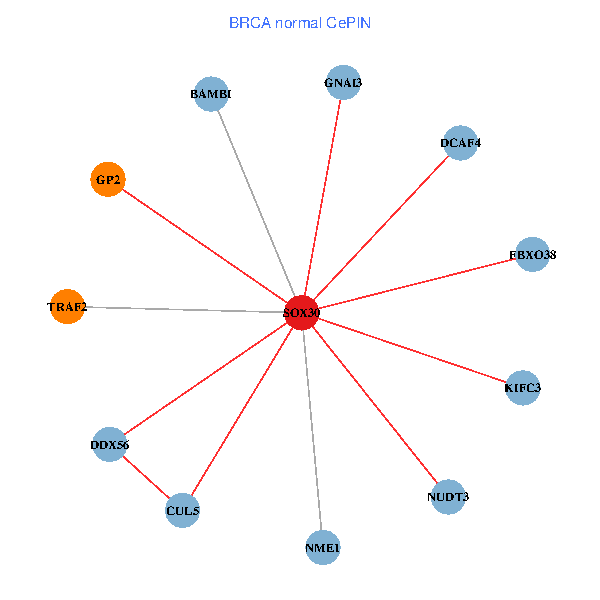
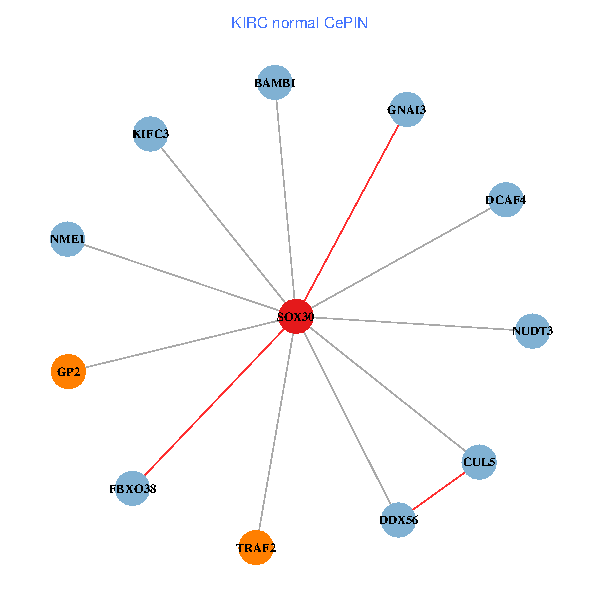
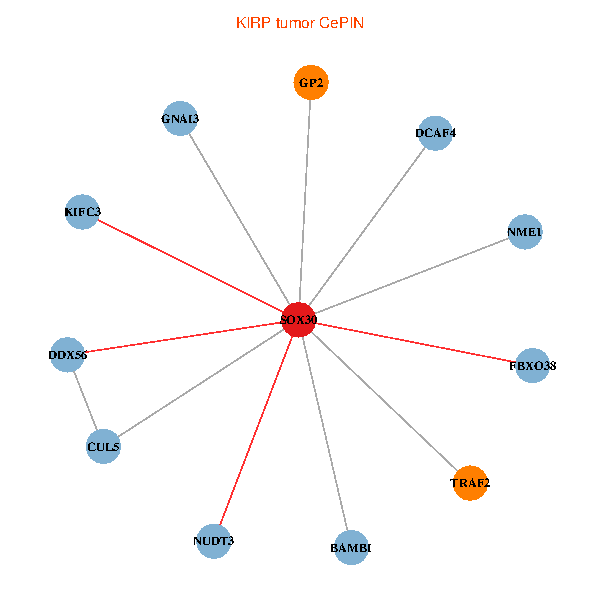
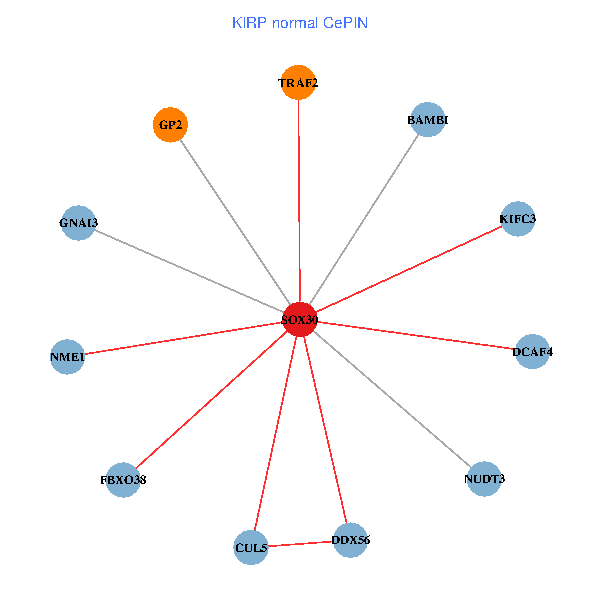
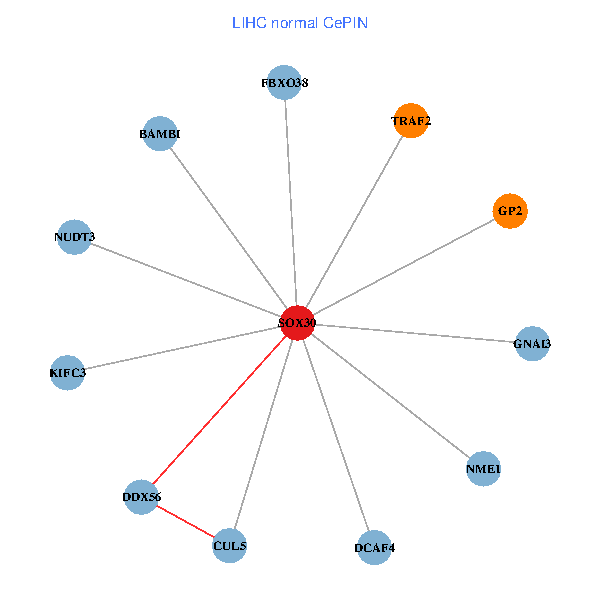
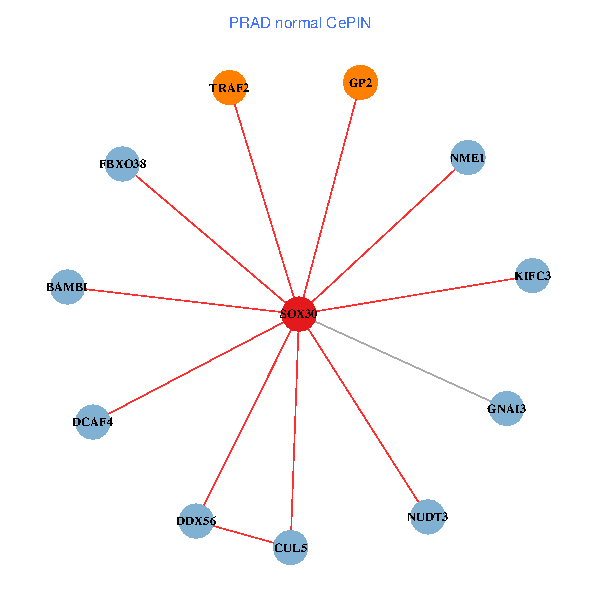
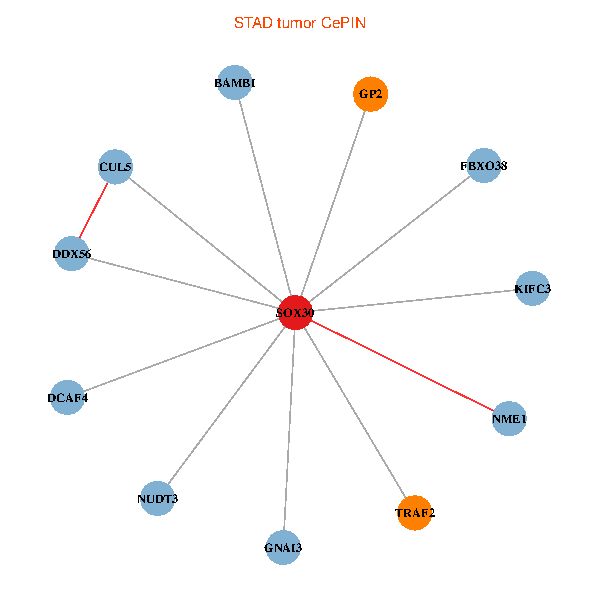
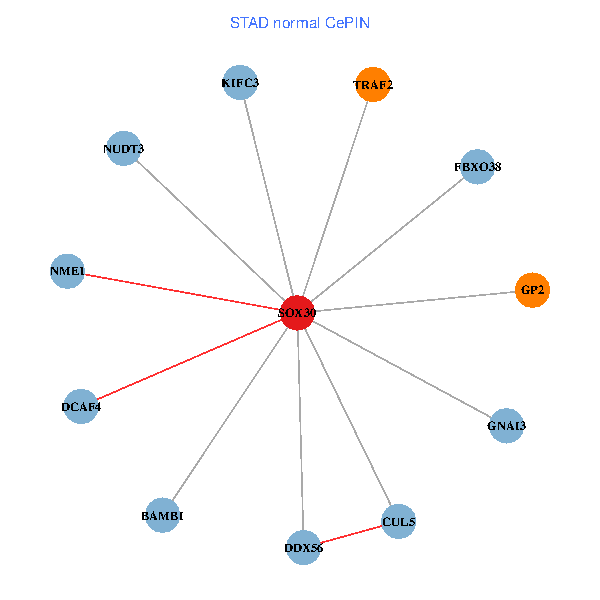
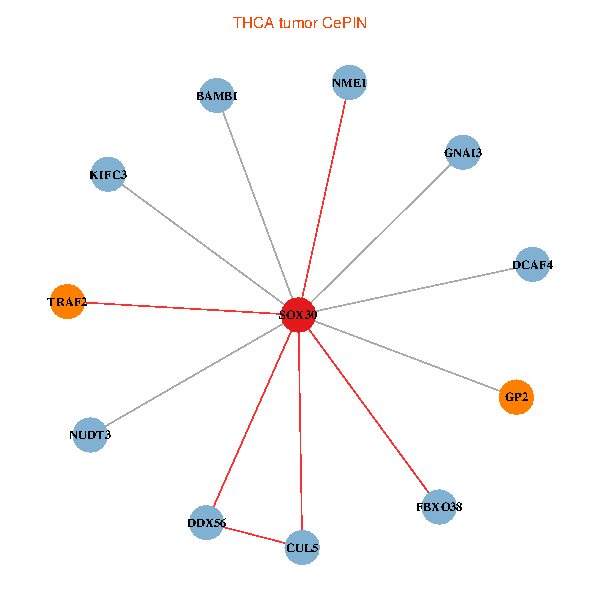
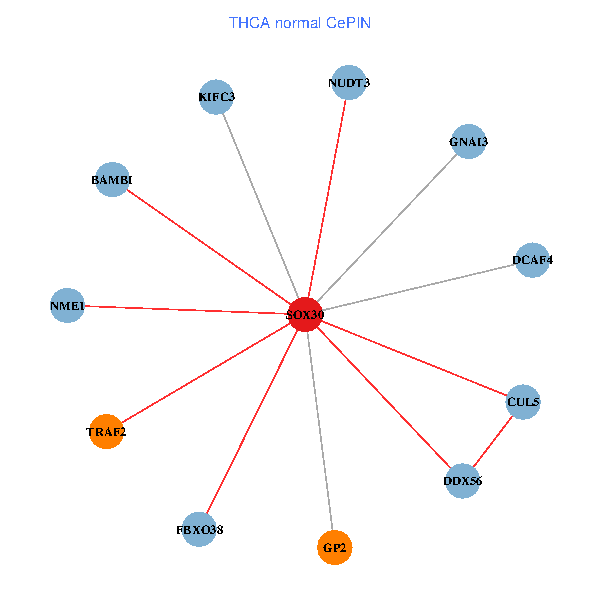
| Co-expressed gene networks based on protein-protein interaction data (CePIN) (TCGA IlluminaHiSeq_RNASeqV2, pan-cancer normalized log2(norm_counts+1) data, version 2016-08-16) (PINA2 ppi data) |
| BRCA (tumor) | BRCA (normal) |
| SOX30, CUL5, NUDT3, TRAF2, NME1, DDX56, KIFC3, GNAI3, BAMBI, FBXO38, DCAF4, GP2 (tumor) | SOX30, CUL5, NUDT3, TRAF2, NME1, DDX56, KIFC3, GNAI3, BAMBI, FBXO38, DCAF4, GP2 (normal) |
 |  |
| COAD (tumor) | COAD (normal) |
| SOX30, CUL5, NUDT3, TRAF2, NME1, DDX56, KIFC3, GNAI3, BAMBI, FBXO38, DCAF4, GP2 (tumor) | SOX30, CUL5, NUDT3, TRAF2, NME1, DDX56, KIFC3, GNAI3, BAMBI, FBXO38, DCAF4, GP2 (normal) |
 |  |
| HNSC (tumor) | HNSC (normal) |
| SOX30, CUL5, NUDT3, TRAF2, NME1, DDX56, KIFC3, GNAI3, BAMBI, FBXO38, DCAF4, GP2 (tumor) | SOX30, CUL5, NUDT3, TRAF2, NME1, DDX56, KIFC3, GNAI3, BAMBI, FBXO38, DCAF4, GP2 (normal) |
 |  |
| KICH (tumor) | KICH (normal) |
| SOX30, CUL5, NUDT3, TRAF2, NME1, DDX56, KIFC3, GNAI3, BAMBI, FBXO38, DCAF4, GP2 (tumor) | SOX30, CUL5, NUDT3, TRAF2, NME1, DDX56, KIFC3, GNAI3, BAMBI, FBXO38, DCAF4, GP2 (normal) |
 |  |
| KIRC (tumor) | KIRC (normal) |
| SOX30, CUL5, NUDT3, TRAF2, NME1, DDX56, KIFC3, GNAI3, BAMBI, FBXO38, DCAF4, GP2 (tumor) | SOX30, CUL5, NUDT3, TRAF2, NME1, DDX56, KIFC3, GNAI3, BAMBI, FBXO38, DCAF4, GP2 (normal) |
 |  |
| KIRP (tumor) | KIRP (normal) |
| SOX30, CUL5, NUDT3, TRAF2, NME1, DDX56, KIFC3, GNAI3, BAMBI, FBXO38, DCAF4, GP2 (tumor) | SOX30, CUL5, NUDT3, TRAF2, NME1, DDX56, KIFC3, GNAI3, BAMBI, FBXO38, DCAF4, GP2 (normal) |
 |  |
| LIHC (tumor) | LIHC (normal) |
| SOX30, CUL5, NUDT3, TRAF2, NME1, DDX56, KIFC3, GNAI3, BAMBI, FBXO38, DCAF4, GP2 (tumor) | SOX30, CUL5, NUDT3, TRAF2, NME1, DDX56, KIFC3, GNAI3, BAMBI, FBXO38, DCAF4, GP2 (normal) |
 |  |
| LUAD (tumor) | LUAD (normal) |
| SOX30, CUL5, NUDT3, TRAF2, NME1, DDX56, KIFC3, GNAI3, BAMBI, FBXO38, DCAF4, GP2 (tumor) | SOX30, CUL5, NUDT3, TRAF2, NME1, DDX56, KIFC3, GNAI3, BAMBI, FBXO38, DCAF4, GP2 (normal) |
 |  |
| LUSC (tumor) | LUSC (normal) |
| SOX30, CUL5, NUDT3, TRAF2, NME1, DDX56, KIFC3, GNAI3, BAMBI, FBXO38, DCAF4, GP2 (tumor) | SOX30, CUL5, NUDT3, TRAF2, NME1, DDX56, KIFC3, GNAI3, BAMBI, FBXO38, DCAF4, GP2 (normal) |
 |  |
| PRAD (tumor) | PRAD (normal) |
| SOX30, CUL5, NUDT3, TRAF2, NME1, DDX56, KIFC3, GNAI3, BAMBI, FBXO38, DCAF4, GP2 (tumor) | SOX30, CUL5, NUDT3, TRAF2, NME1, DDX56, KIFC3, GNAI3, BAMBI, FBXO38, DCAF4, GP2 (normal) |
 |  |
| STAD (tumor) | STAD (normal) |
| SOX30, CUL5, NUDT3, TRAF2, NME1, DDX56, KIFC3, GNAI3, BAMBI, FBXO38, DCAF4, GP2 (tumor) | SOX30, CUL5, NUDT3, TRAF2, NME1, DDX56, KIFC3, GNAI3, BAMBI, FBXO38, DCAF4, GP2 (normal) |
 |  |
| THCA (tumor) | THCA (normal) |
| SOX30, CUL5, NUDT3, TRAF2, NME1, DDX56, KIFC3, GNAI3, BAMBI, FBXO38, DCAF4, GP2 (tumor) | SOX30, CUL5, NUDT3, TRAF2, NME1, DDX56, KIFC3, GNAI3, BAMBI, FBXO38, DCAF4, GP2 (normal) |
 |  |
| Top |
| TissGeneProg for SOX30 |
| Kaplan-Meier plots with logrank tests of overall survival (OS) using 28 cancer types (TCGA IlluminaHiSeq_RNASeqV2, pan-cancer normalized log2(norm_counts+1) data, version 2016-08-16) (TCGA clinicalMatrix, phenotype data, version 2016-04-27) * Click on the image to enlarge it in a new window. |
 |
| Kaplan-Meier plots with logrank test of relapse free survival (RFS) using 28 cancer types (TCGA IlluminaHiSeq_RNASeqV2, pan-cancer normalized log2(norm_counts+1) data, version 2016-08-16) (TCGA clinicalMatrix, phenotype data, version 2016-04-27) * Click on the image enlarge it in a new window. |
 |
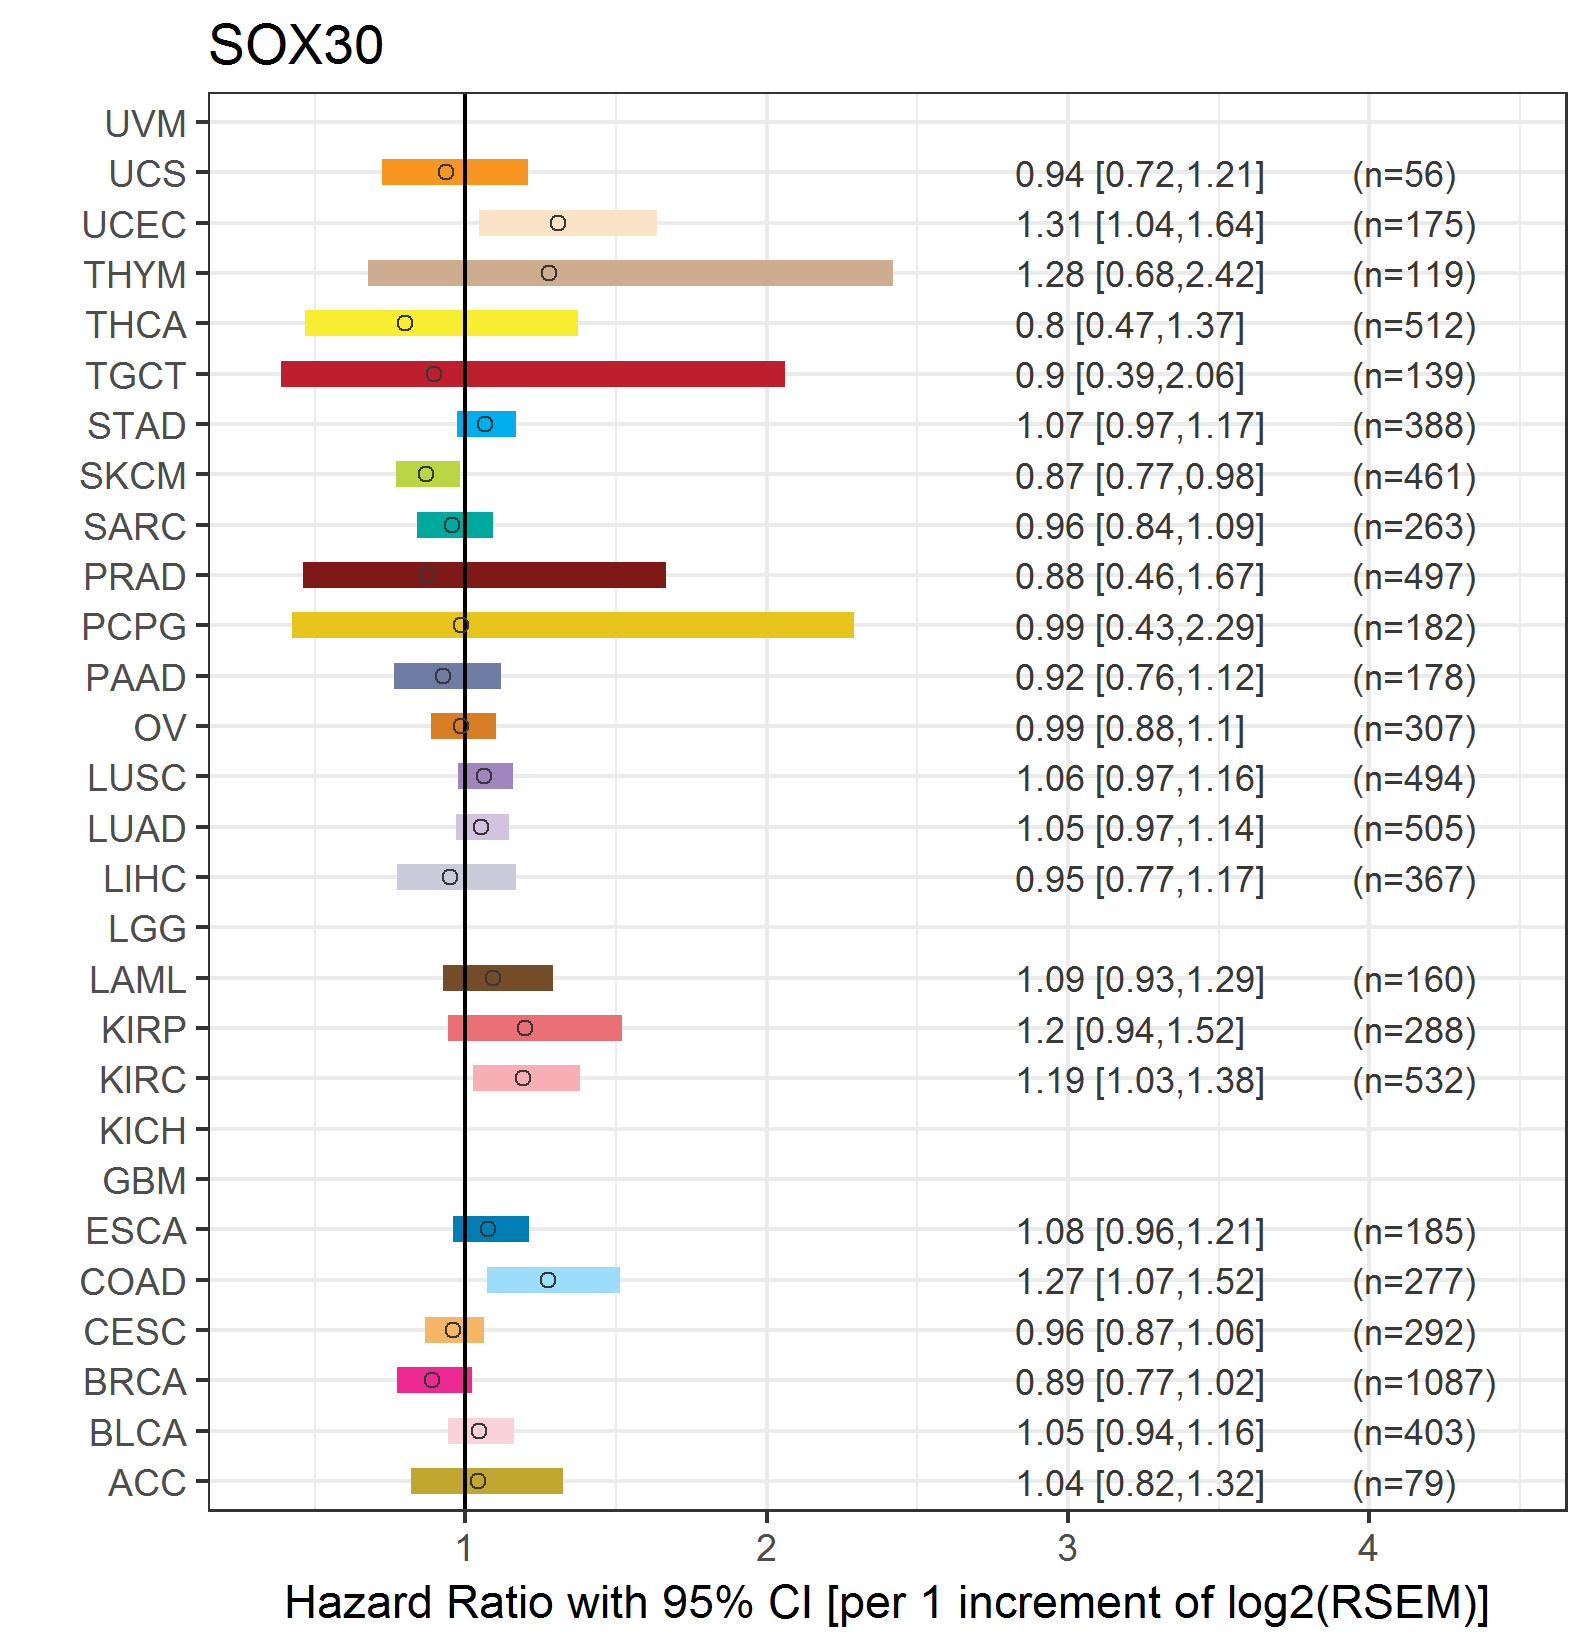
| Forest plot of Cox proportional hazard ratio (HR) and 95% CI of overall survival (OS) using 28 cancer types (TCGA IlluminaHiSeq_RNASeqV2, pan-cancer normalized log2(norm_counts+1) data, version 2016-08-16) (TCGA clinicalMatrix, phenotype data, version 2016-04-27) * Click on the image enlarge it in a new window. |
 |
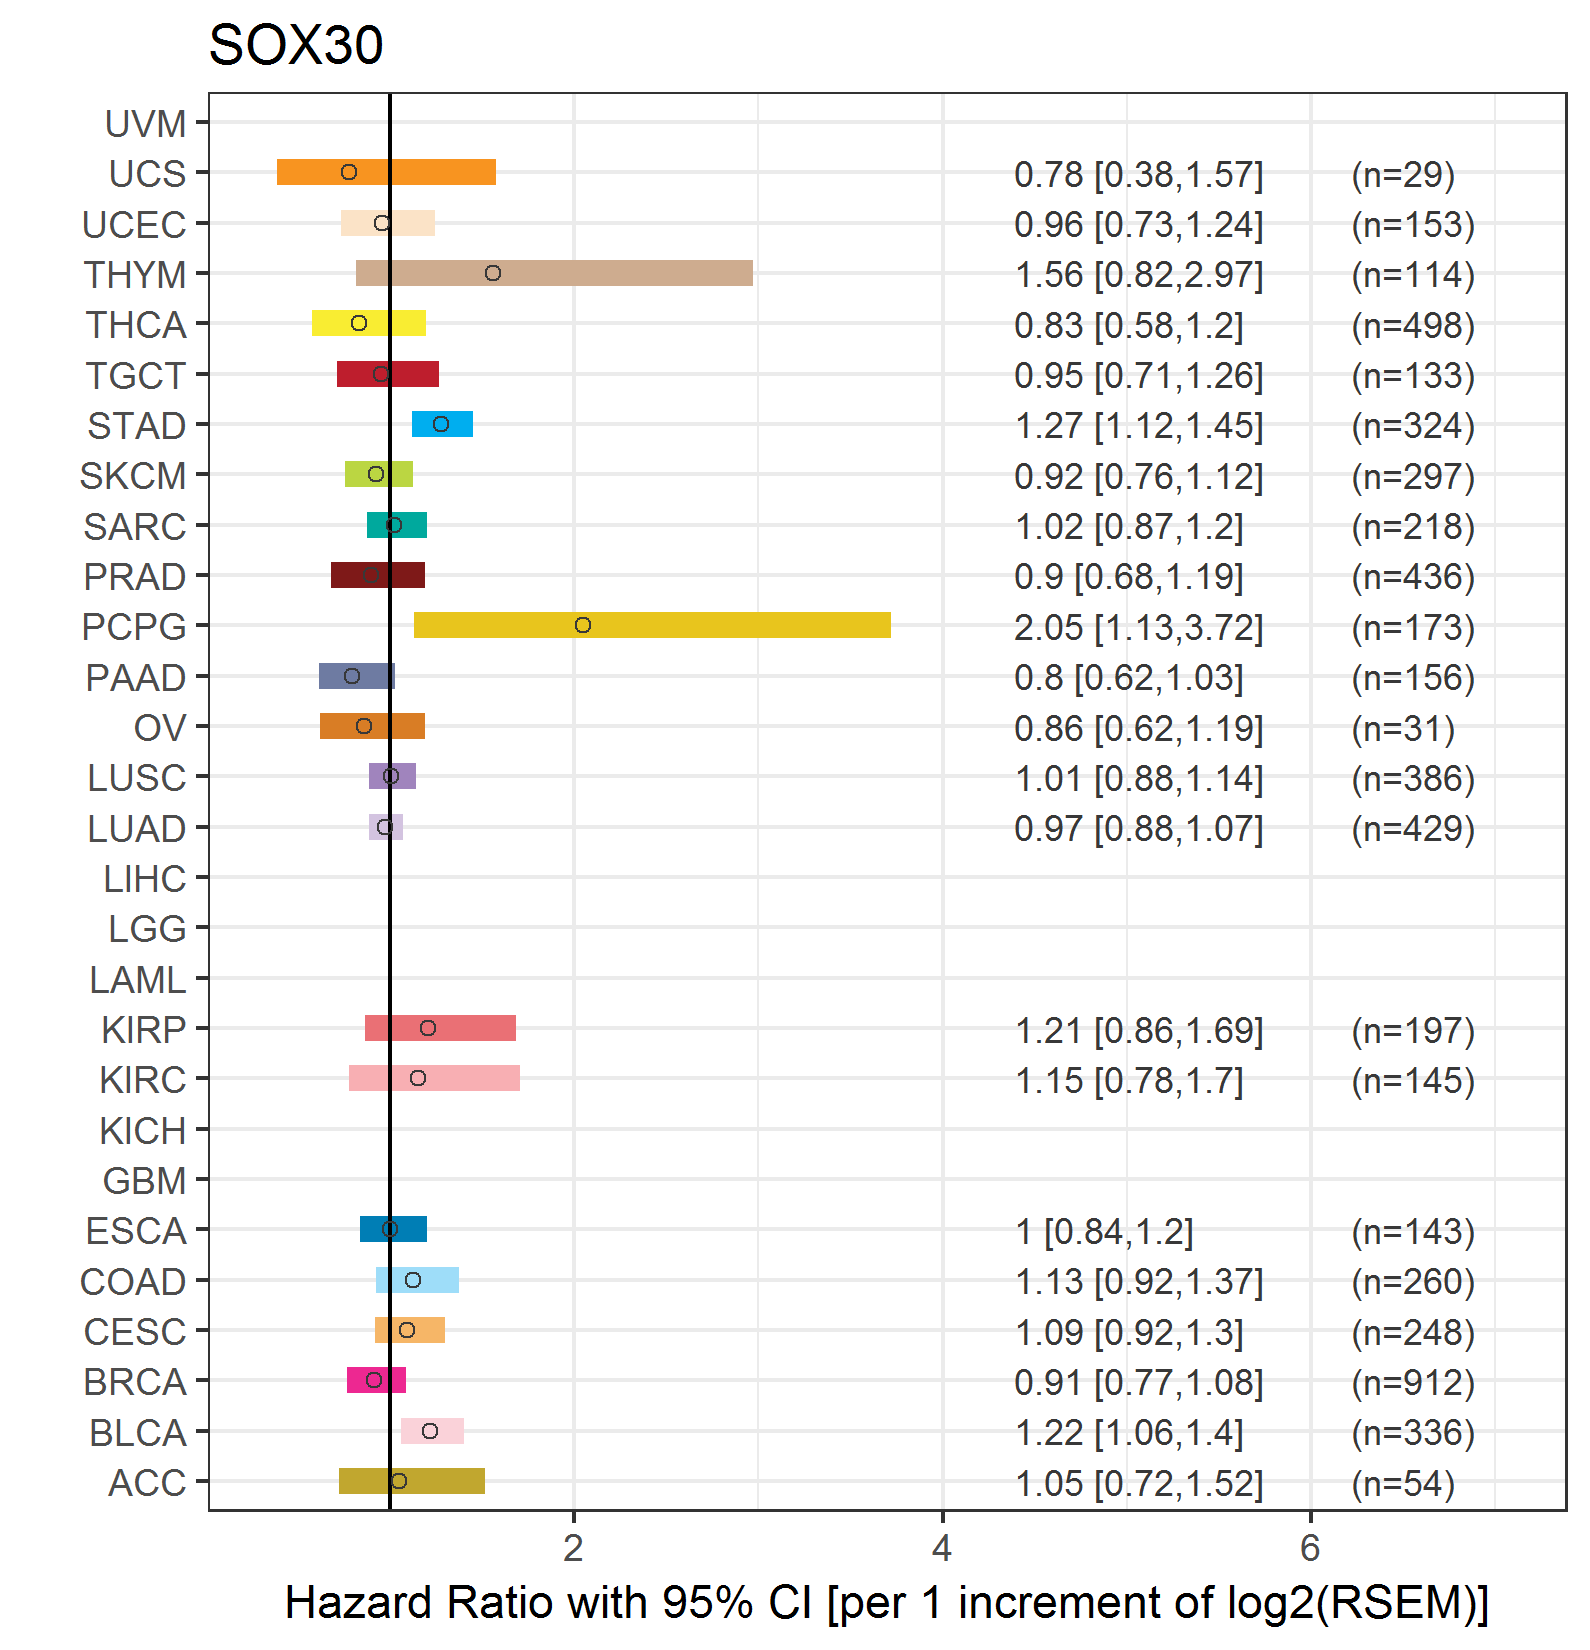
| Forest plot of Cox proportional hazard ratio (HR) and 95% CI of relapse free survival (RFS) using 28 cancer types (TCGA IlluminaHiSeq_RNASeqV2, pan-cancer normalized log2(norm_counts+1) data, version 2016-08-16) (TCGA clinicalMatrix, phenotype data, version 2016-04-27) * Click on the image enlarge it in a new window. |
 |
| Top |
| TissGeneClin for SOX30 |
| TissGeneDrug for SOX30 |
| Drug information targeting TissGene (DrugBank Version 5.0.6, 2017-04-01) |
| DrugBank ID | Drug name | Drug activity | Drug type | Drug status |
| Top |
| TissGeneDisease for SOX30 |
| Disease information associated with TissGene (DisGeNet, 2016-06-01) |
| Disease ID | Disease name | # pubmeds | Source |
| umls:C0024121 | Lung Neoplasms | 1 | BeFree |
| umls:C0242379 | Malignant neoplasm of lung | 1 | BeFree |
| umls:C0684249 | Carcinoma of lung | 1 | BeFree |
|
Copyright 2016-Present - The University of Texas Health Science Center at Houston (UTHealth) Web File Viewing | How to Report, Fraud, Waste and Abuse | State of Texas | Statewide Search | Texas Homeland Security | Site Policies |