 |
| |
| |
| |
| |
| |
| |
|

| TissGeneSummary for HSF2BP |
 Gene summary Gene summary |
| Basic gene information | Gene symbol | HSF2BP |
| Gene name | heat shock transcription factor 2 binding protein | |
| Synonyms | - | |
| Cytomap | UCSC genome browser: 21q22.3 | |
| Type of gene | protein-coding | |
| RefGenes | NM_007031.1, | |
| Description | heat shock factor 2-binding protein | |
| Modification date | 20141207 | |
| dbXrefs | MIM : 604554 | |
| HGNC : HGNC | ||
| Ensembl : ENSG00000160207 | ||
| HPRD : 05186 | ||
| Vega : OTTHUMG00000086863 | ||
| Protein | UniProt: go to UniProt's Cross Reference DB Table | |
| Expression | CleanEX: HS_HSF2BP | |
| BioGPS: 11077 | ||
| Pathway | NCI Pathway Interaction Database: HSF2BP | |
| KEGG: HSF2BP | ||
| REACTOME: HSF2BP | ||
| Pathway Commons: HSF2BP | ||
| Context | iHOP: HSF2BP | |
| ligand binding site mutation search in PubMed: HSF2BP | ||
| UCL Cancer Institute: HSF2BP | ||
| Assigned class in TissGDB* | B | |
| Included tissue-specific gene expression resources | HPA,TiGER,GTEx | |
| Specific-tissues in normal samples (assigned by TissGDB using HPA, TiGER, and GTEx) | Testis | |
| Cancer types related to the specific-tissues in cancer samples (assigned by TissGDB using TCGA) | TGCT | |
| Reference showing the relevant tissue of HSF2BP | ||
| Description by TissGene annotations | ||
| * Class A consists of genes with literature evidence and is part of the cTissGenes. Class B consists of only cTissGenes without additional evidence. The remaining genes belong to Class C. |
| Gene ontology having evidence of Inferred from Direct Assay (IDA) from Entrez |
| GO ID | GO term | PubMed ID |
| Top |
| TissGeneExp for HSF2BP |
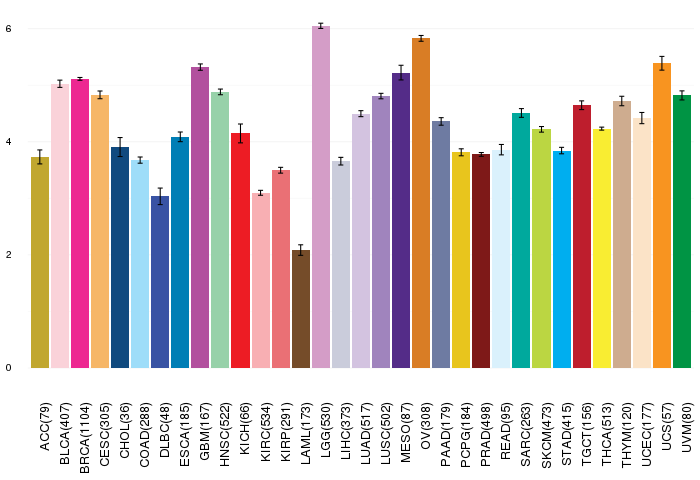
| Gene expressions across 28 cancer types (X-axis: cancer type and Y-axis: log2(norm_counts+1)) (TCGA IlluminaHiSeq_RNASeqV2, pan-cancer normalized log2(norm_counts+1) data, version 2016-08-16) |
 |
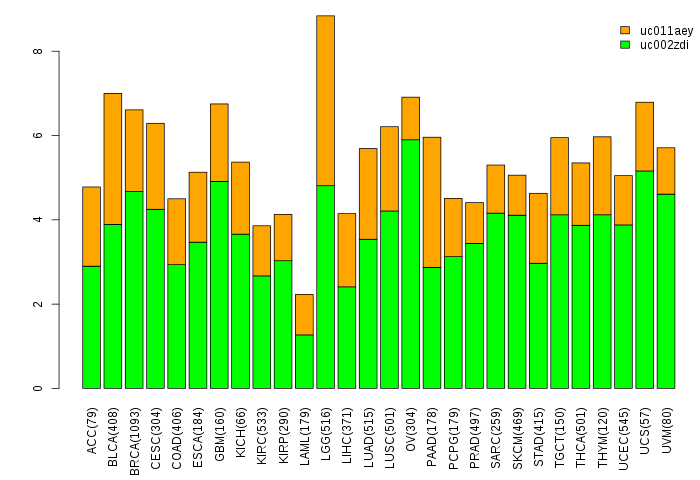
| Gene isoform expressions across 28 cancer types (X-axis: cancer type and Y-axis: log2(norm_counts+1)) (TCGA pan-cancer tcga_rsem_isoform_tpm, version 2016-09-01) |
 |
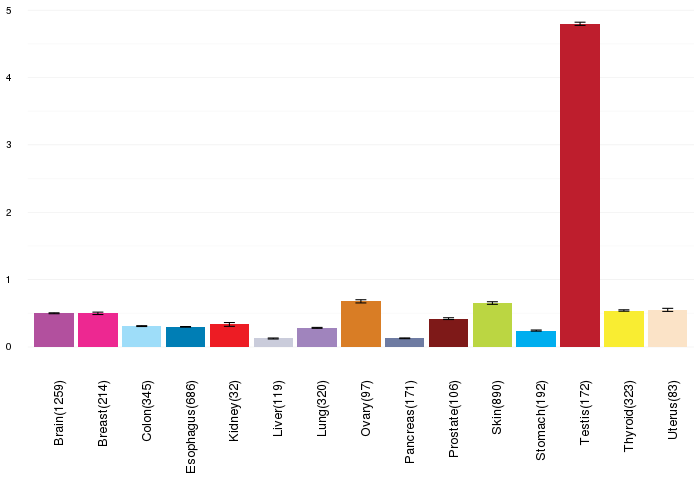
| Gene expressions across normal tissues of GTEx data (GTEx GTEx_Analysis_v6_RNA-seq_RNA-SeQCv1.1.8_gene_rpkm.gct) - Here, we shows the matched tissue types only among our 28 cancer types. |
 |
| Different expressions across 14 cancer types with more than 10 samples between matched tumors and normals (X-axis: cancer type and Y-axis: log2(norm_counts+1)) (TCGA IlluminaHiSeq_RNASeqV2, pan-cancer normalized log2(norm_counts+1) data, version 2016-08-16) |
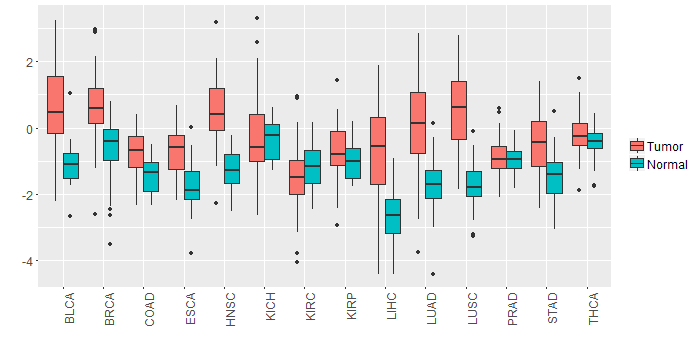 |
| - Significantly differentially expressed cancer types and information. (|Fold change|>1 and FDR<0.05) |
| Cancer type | Mean(exp) in tumor | Mean(exp) in matched normal | Log2FC | P-val. | FDR |
| LIHC | -0.72562415 | -2.68311215 | 1.957488 | 2.75E-12 | 4.93E-11 |
| LUSC | 0.48126236 | -1.723249405 | 2.204511765 | 3.29E-20 | 4.03E-19 |
| BRCA | 0.643379955 | -0.565414781 | 1.208794737 | 1.69E-23 | 1.54E-22 |
| LUAD | 0.026234402 | -1.75589146 | 1.782125862 | 1.71E-13 | 1.45E-12 |
| HNSC | 0.491062269 | -1.242684243 | 1.733746512 | 2.10E-14 | 1.24E-12 |
| BLCA | 0.663840482 | -1.061964781 | 1.725805263 | 7.76E-05 | 0.000913134 |
| STAD | -0.439171525 | -1.447246525 | 1.008075 | 2.79E-05 | 0.000267009 |
| Top |
| TissGene-miRNA for HSF2BP |
| Significantly anti-correlated miRNAs of TissGene across 28 cancer types (Gene-miRNA relations from TargetScanHuman Relsease 7.1, Conserved_Site_Context_Scores.txt.zip, 06.01.2016) (TCGA IlluminaHiSeq_miRNASeq, log2(RPM+1) data, version 2016-11-21) (TCGA IlluminaHiSeq_RNASeqV2, log2(normalized_count+1) data, version 2016-08-16) (Spearman’s Rank Correlation (p-value<0.05 and coefficient<-0.25)) |
| Cancer type | miRNA id | miRNA accession | P-val. | Coeff. | # samples |
| Top |
| TissGeneMut for HSF2BP |
| TissGeneSNV for HSF2BP |
| nsSNV counts per each loci. Different colors of circles represent different cancer types. Circle size denotes number of samples. (TCGA somatic mutation (SNPs and small INDELs) data, version 2016-04-25) * Click on the image to enlarge it in a new window. |
 |
| Somatic nucleotide variants of TissGene across 28 cancer types (X-axis: cancer type and Y-axis: % of mutated samples) The numbers in parentheses are numbers of samples with mutation (nsSNVs). (TCGA somatic mutation (SNPs and small INDELs) data, version 2016-04-25) |
 |
| - nsSNVs sorted by frequency. |
| AAchange | Cancer type | # samples |
| p.L102I | UCEC | 1 |
| p.T318I | SKCM | 1 |
| p.S309P | STAD | 1 |
| p.S292L | SARC | 1 |
| p.F296Y | SKCM | 1 |
| p.Q280H | SARC | 1 |
| p.A185T | UCEC | 1 |
| p.R328H | PRAD | 1 |
| p.L278F | SKCM | 1 |
| p.L327I | UCEC | 1 |
| p.V209L | STAD | 1 |
| p.E108X | KIRC | 1 |
| p.R304C | GBM | 1 |
| p.R66S | THYM | 1 |
| p.F256L | UCEC | 1 |
| p.R312H | LUAD | 1 |
| p.A319T | COAD | 1 |
| p.S298R | SARC | 1 |
| p.V141I | COAD | 1 |
| p.T157A | STAD | 1 |
| p.E270D | UCEC | 1 |
| p.R94K | PAAD | 1 |
| p.N63S | DLBC | 1 |
| p.R304H | SARC | 1 |
| p.P267L | SKCM | 1 |
| p.A143V | UCEC | 1 |
| p.L28P | STAD | 1 |
| p.F154V | UCEC | 1 |
| p.E270K | SKCM | 1 |
| p.K25Q | UCEC | 1 |
| p.S292L | SKCM | 1 |
| p.R312H | LGG | 1 |
| p.R84H | PAAD | 1 |
| p.D40Y | BLCA | 1 |
| p.A187V | HNSC | 1 |
| Top |
| TissGeneCNV for HSF2BP |
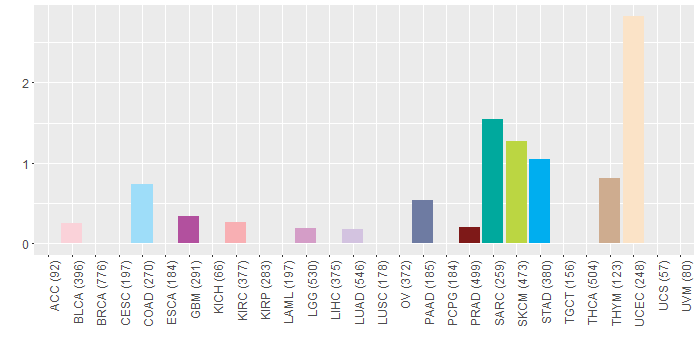
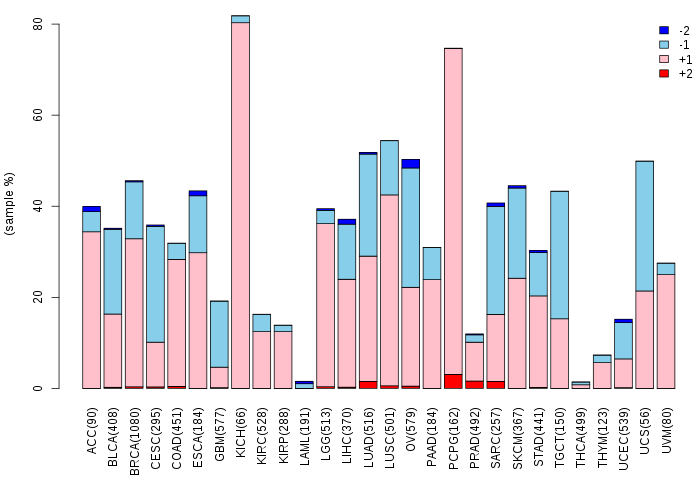
| Copy number variations of TissGene across 28 cancer types (X-axis: cancer type and Y-axis: % of CNV samples) (TCGA Gistic2_CopyNumber_Gistic2_all_data_by_genes, Gistic2 copy number data, version 2016-08-16) |
 |
| Top |
| TissGeneFusions for HSF2BP |
| Fusion genes including TissGene (ChimerDB 3.0, 2016-12-01 and TCGA fusion Portal 2015-12-01) |
| Database | Src | Cancer type | Sample | Fusion gene | ORF | 5'-gene BP | 3'-gene BP |
| TCGAfusionPortal | PRADA | BRCA | TCGA-C8-A12P-01A | ZNF345-HSF2BP | 5UTR-CDS | Chr19:37341870 | Chr21:45012209 |
| Top |
| TissGeneNet for HSF2BP |
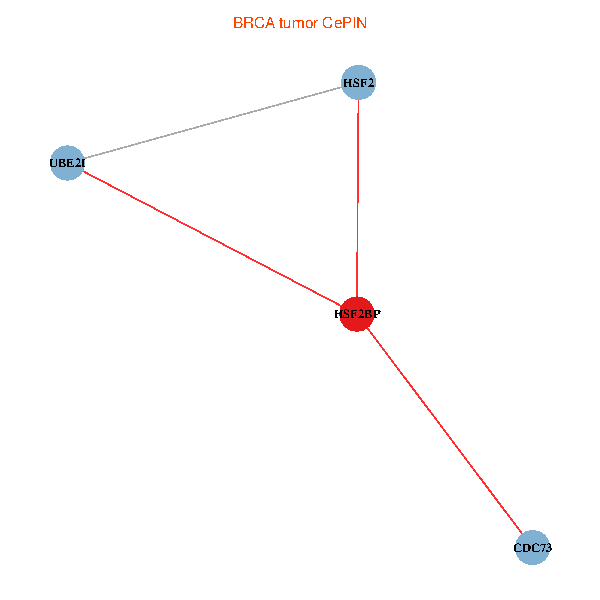
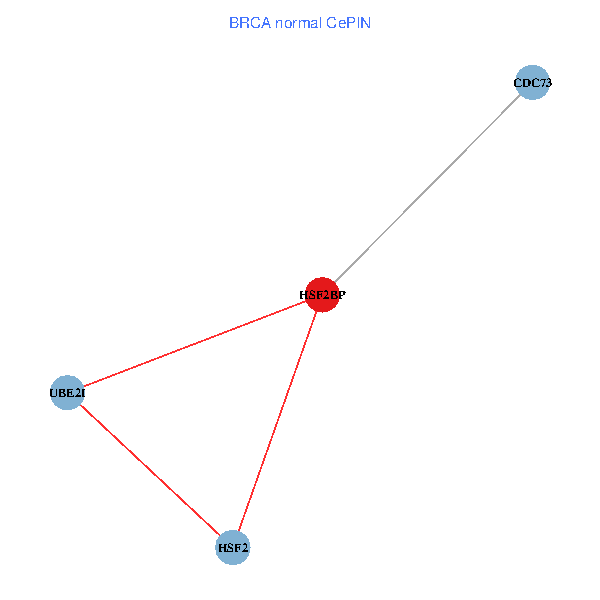
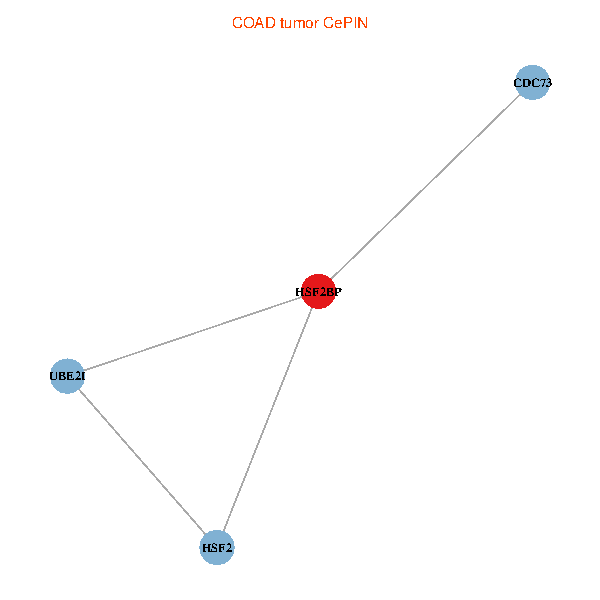
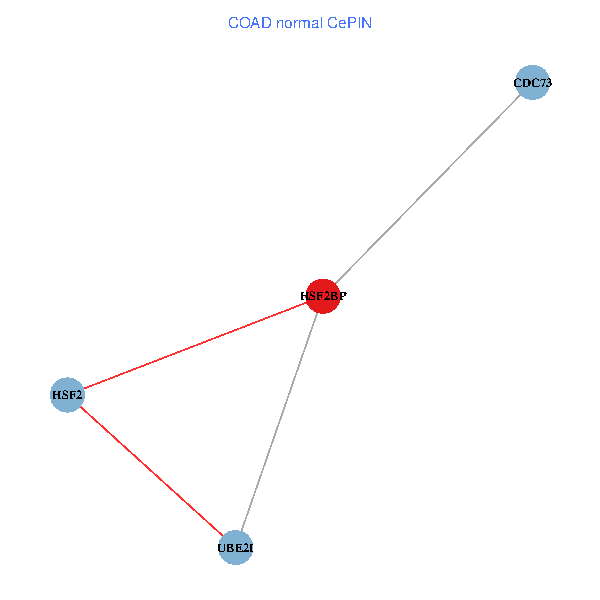
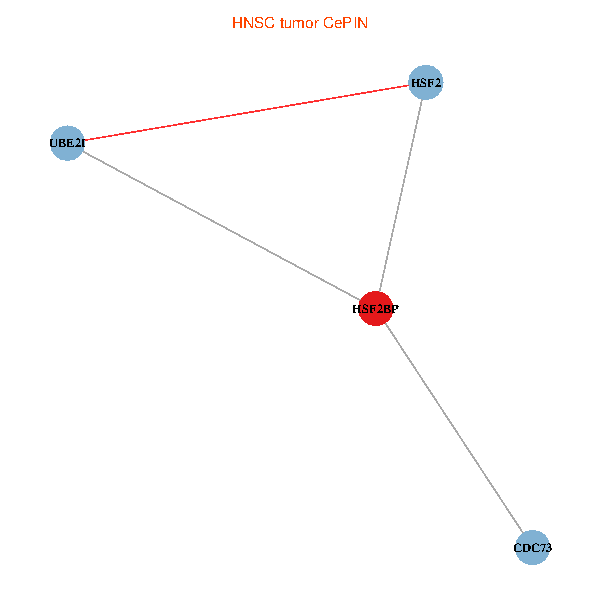
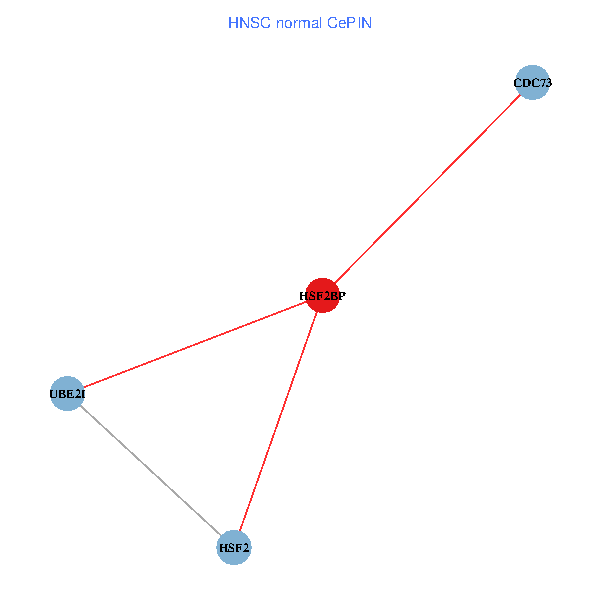
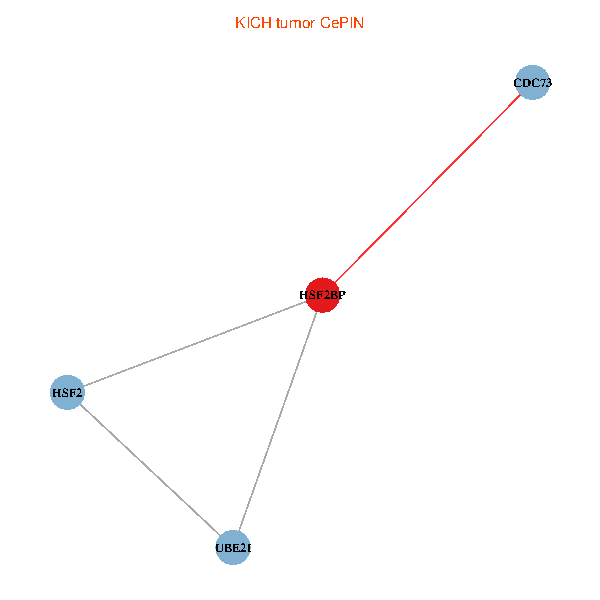
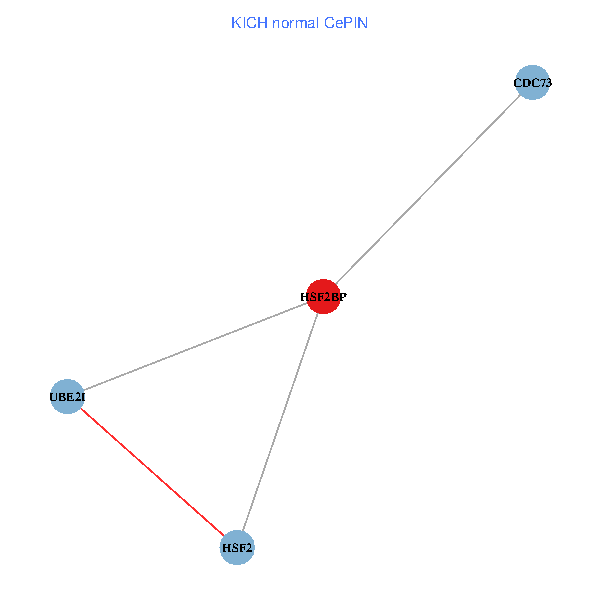
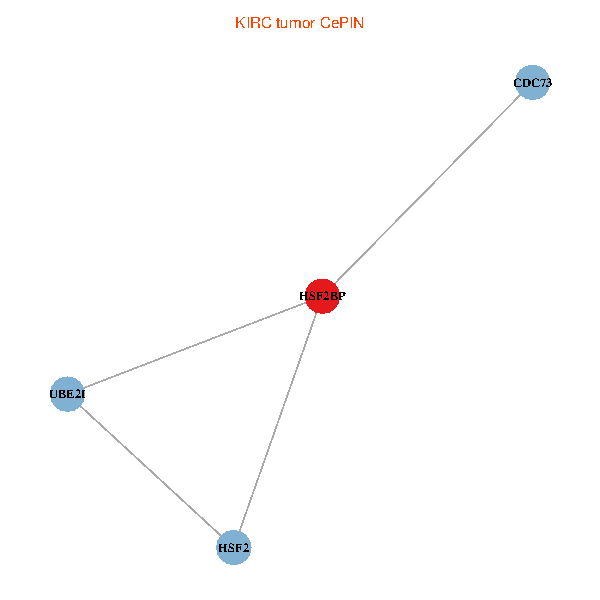
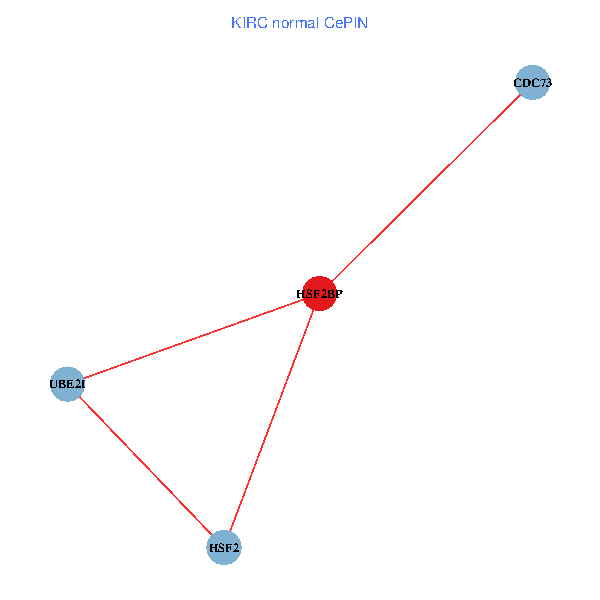
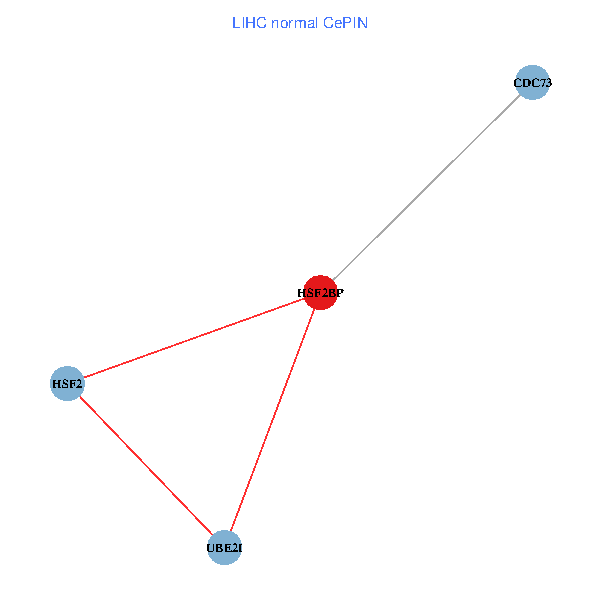
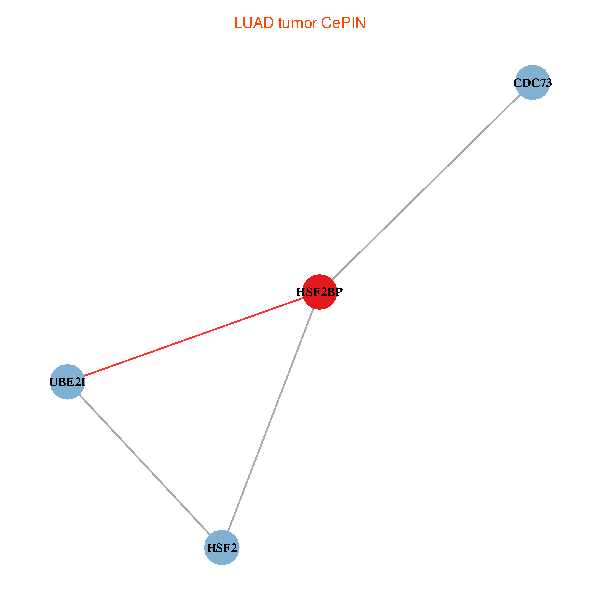
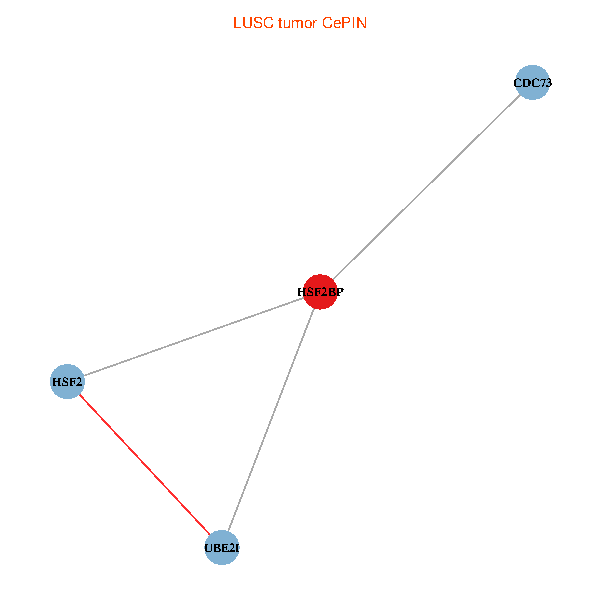
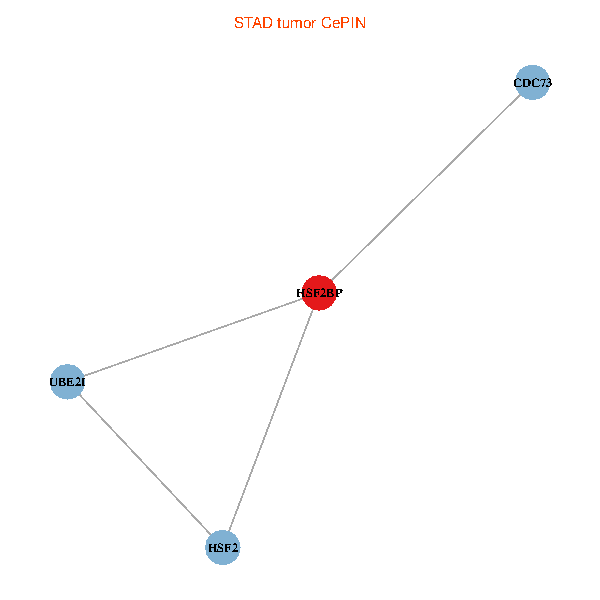
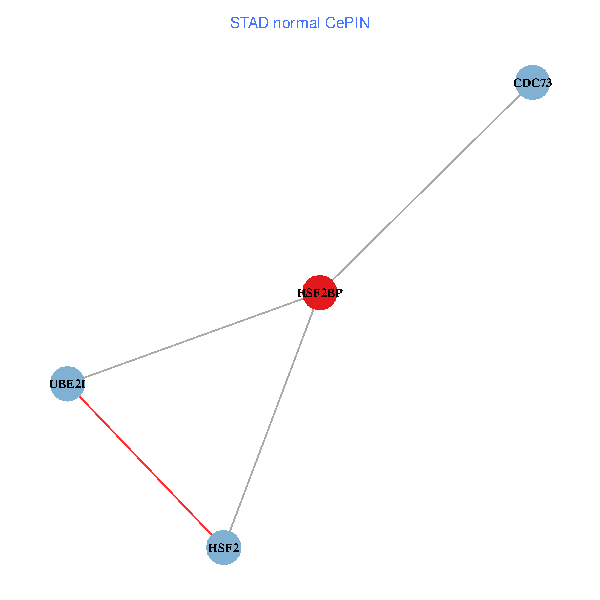
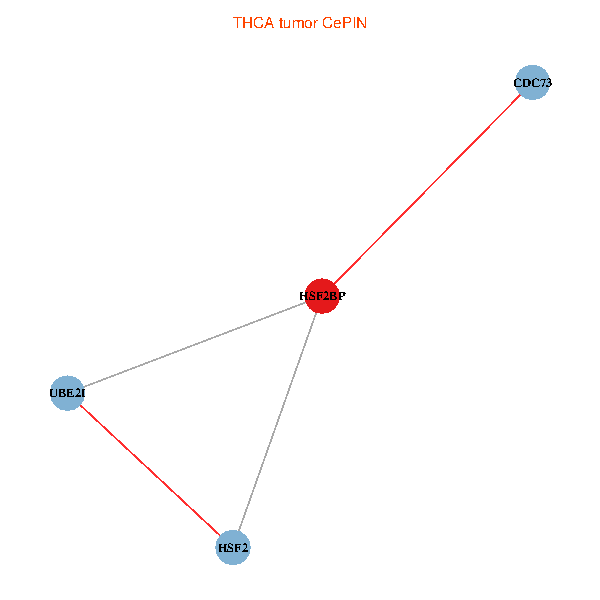
| Co-expressed gene networks based on protein-protein interaction data (CePIN) (TCGA IlluminaHiSeq_RNASeqV2, pan-cancer normalized log2(norm_counts+1) data, version 2016-08-16) (PINA2 ppi data) |
| BRCA (tumor) | BRCA (normal) |
| HSF2BP, HSF2, UBE2I, CDC73 (tumor) | HSF2BP, HSF2, UBE2I, CDC73 (normal) |
 |  |
| COAD (tumor) | COAD (normal) |
| HSF2BP, HSF2, UBE2I, CDC73 (tumor) | HSF2BP, HSF2, UBE2I, CDC73 (normal) |
 |  |
| HNSC (tumor) | HNSC (normal) |
| HSF2BP, HSF2, UBE2I, CDC73 (tumor) | HSF2BP, HSF2, UBE2I, CDC73 (normal) |
 |  |
| KICH (tumor) | KICH (normal) |
| HSF2BP, HSF2, UBE2I, CDC73 (tumor) | HSF2BP, HSF2, UBE2I, CDC73 (normal) |
 |  |
| KIRC (tumor) | KIRC (normal) |
| HSF2BP, HSF2, UBE2I, CDC73 (tumor) | HSF2BP, HSF2, UBE2I, CDC73 (normal) |
 |  |
| KIRP (tumor) | KIRP (normal) |
| HSF2BP, HSF2, UBE2I, CDC73 (tumor) | HSF2BP, HSF2, UBE2I, CDC73 (normal) |
 |  |
| LIHC (tumor) | LIHC (normal) |
| HSF2BP, HSF2, UBE2I, CDC73 (tumor) | HSF2BP, HSF2, UBE2I, CDC73 (normal) |
 |  |
| LUAD (tumor) | LUAD (normal) |
| HSF2BP, HSF2, UBE2I, CDC73 (tumor) | HSF2BP, HSF2, UBE2I, CDC73 (normal) |
 |  |
| LUSC (tumor) | LUSC (normal) |
| HSF2BP, HSF2, UBE2I, CDC73 (tumor) | HSF2BP, HSF2, UBE2I, CDC73 (normal) |
 |  |
| PRAD (tumor) | PRAD (normal) |
| HSF2BP, HSF2, UBE2I, CDC73 (tumor) | HSF2BP, HSF2, UBE2I, CDC73 (normal) |
 |  |
| STAD (tumor) | STAD (normal) |
| HSF2BP, HSF2, UBE2I, CDC73 (tumor) | HSF2BP, HSF2, UBE2I, CDC73 (normal) |
 |  |
| THCA (tumor) | THCA (normal) |
| HSF2BP, HSF2, UBE2I, CDC73 (tumor) | HSF2BP, HSF2, UBE2I, CDC73 (normal) |
 |  |
| Top |
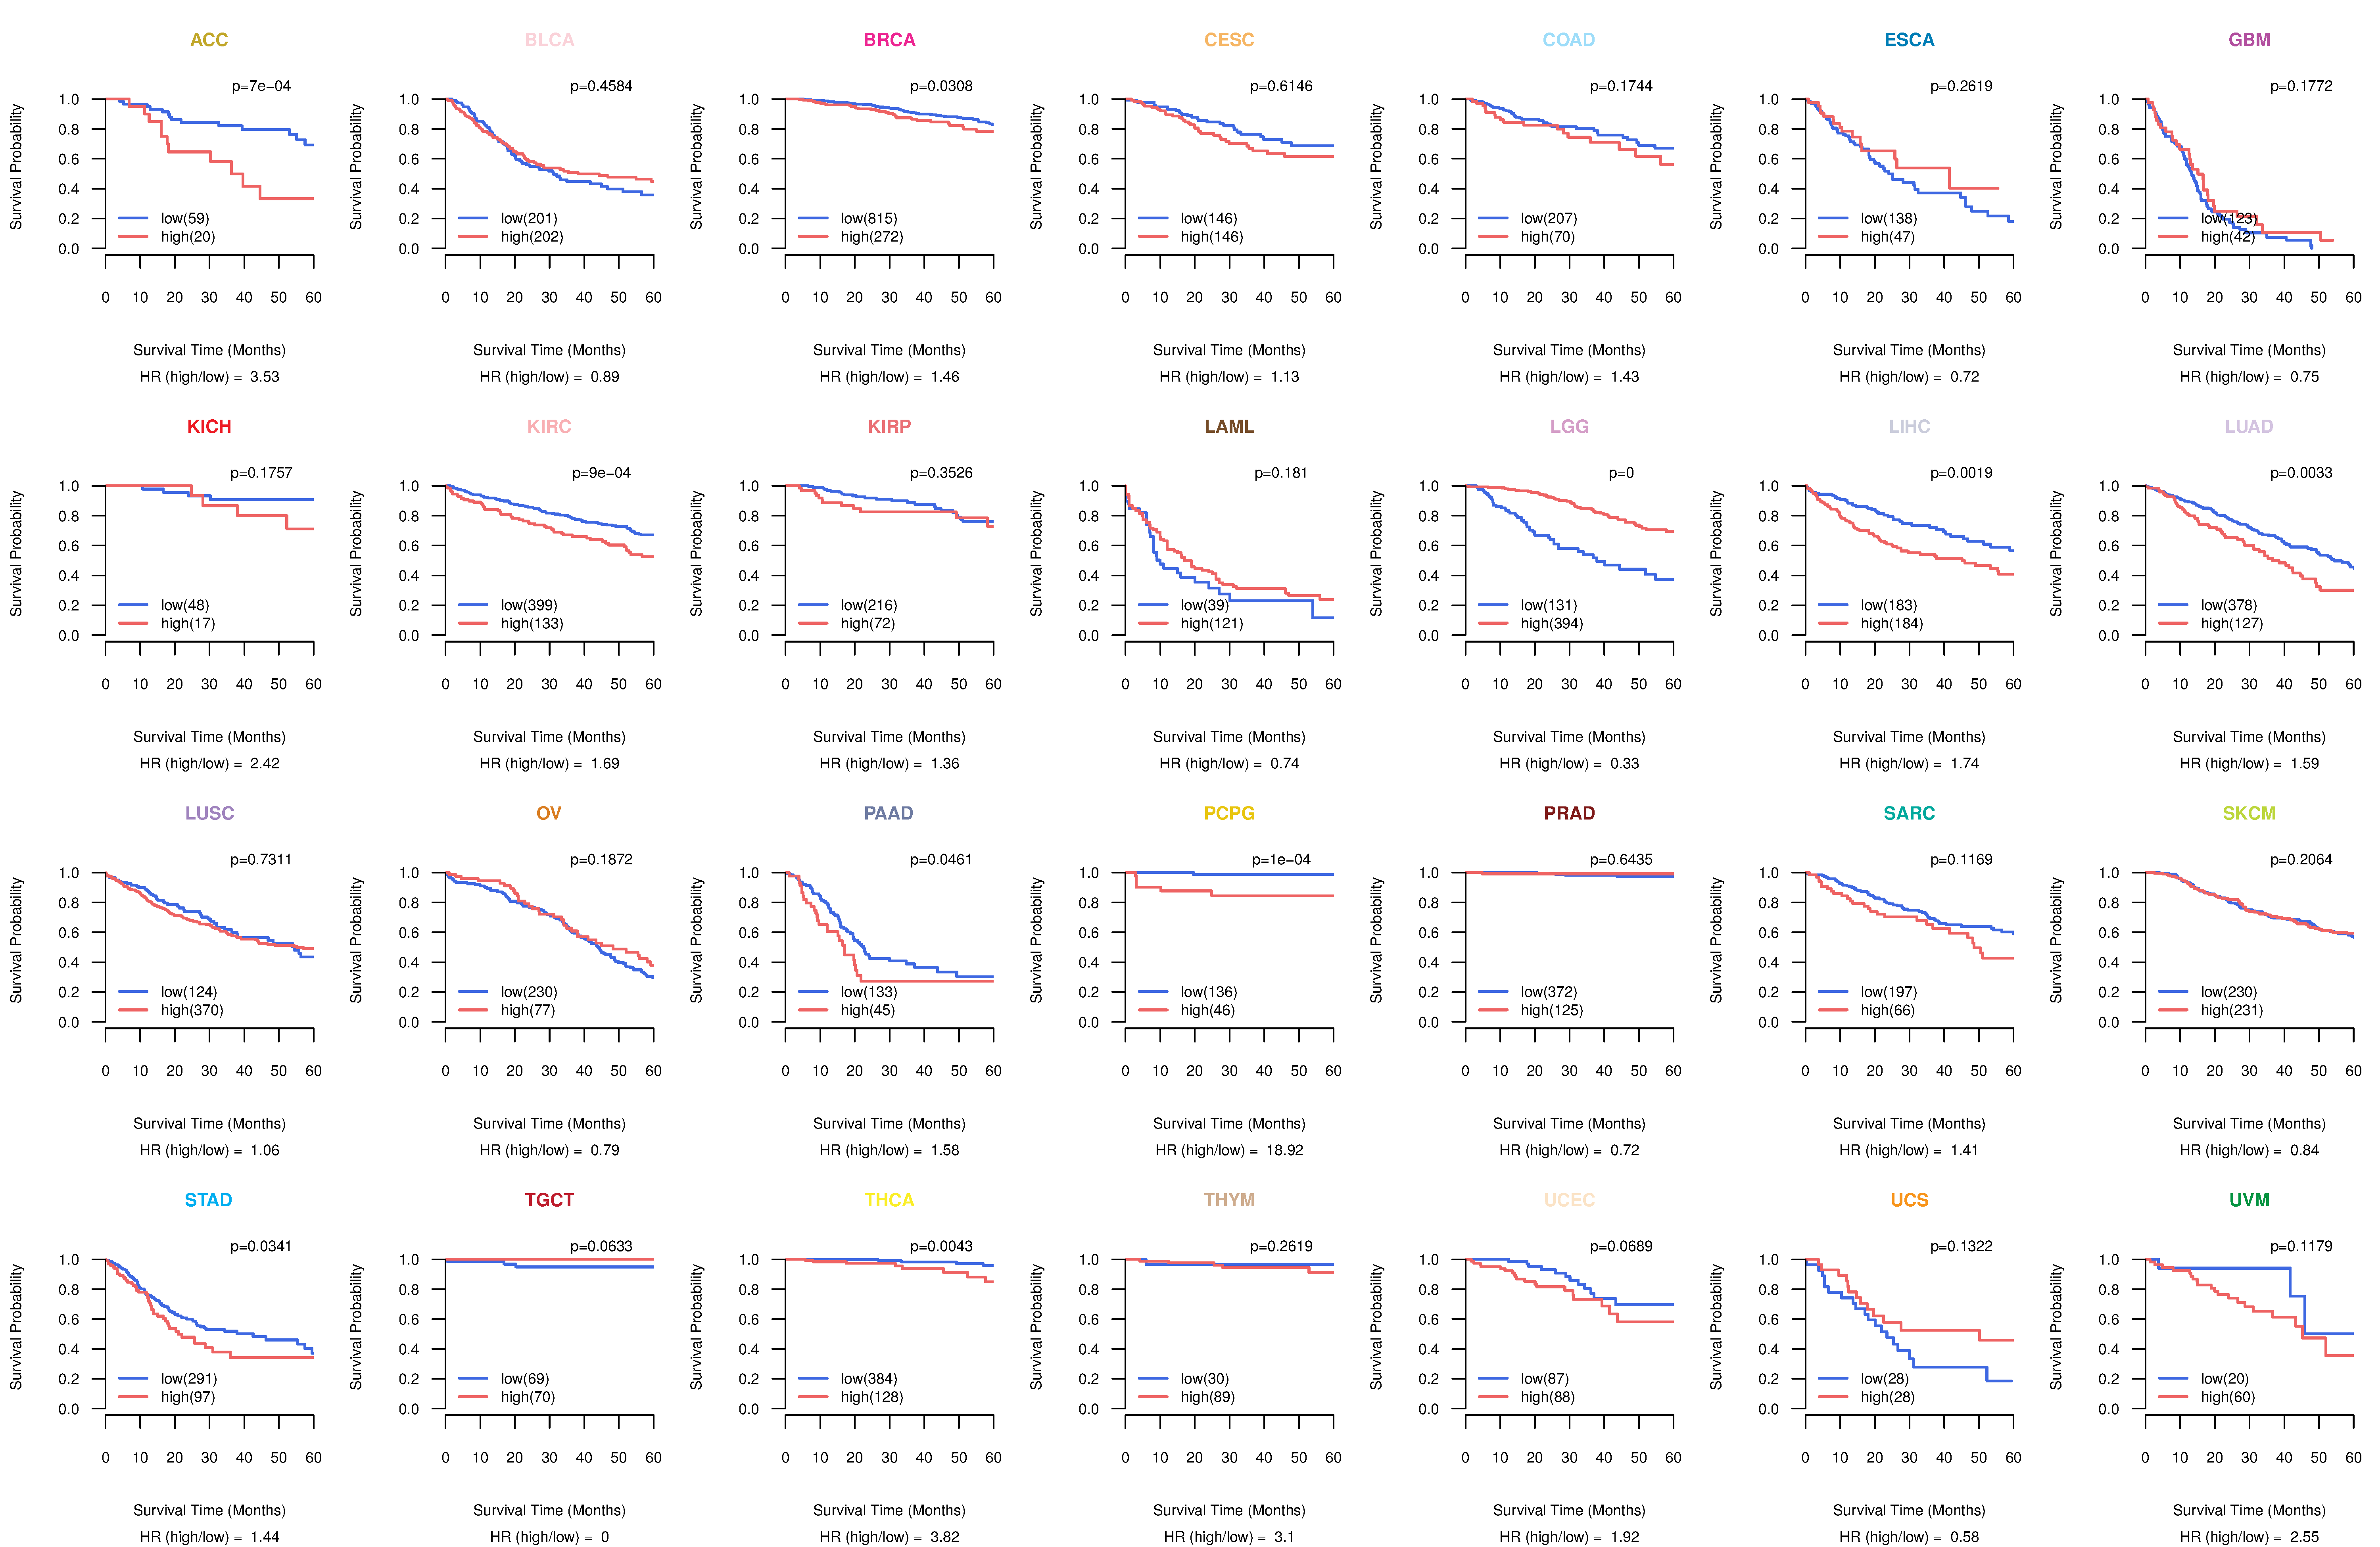
| TissGeneProg for HSF2BP |
| Kaplan-Meier plots with logrank tests of overall survival (OS) using 28 cancer types (TCGA IlluminaHiSeq_RNASeqV2, pan-cancer normalized log2(norm_counts+1) data, version 2016-08-16) (TCGA clinicalMatrix, phenotype data, version 2016-04-27) * Click on the image to enlarge it in a new window. |
 |
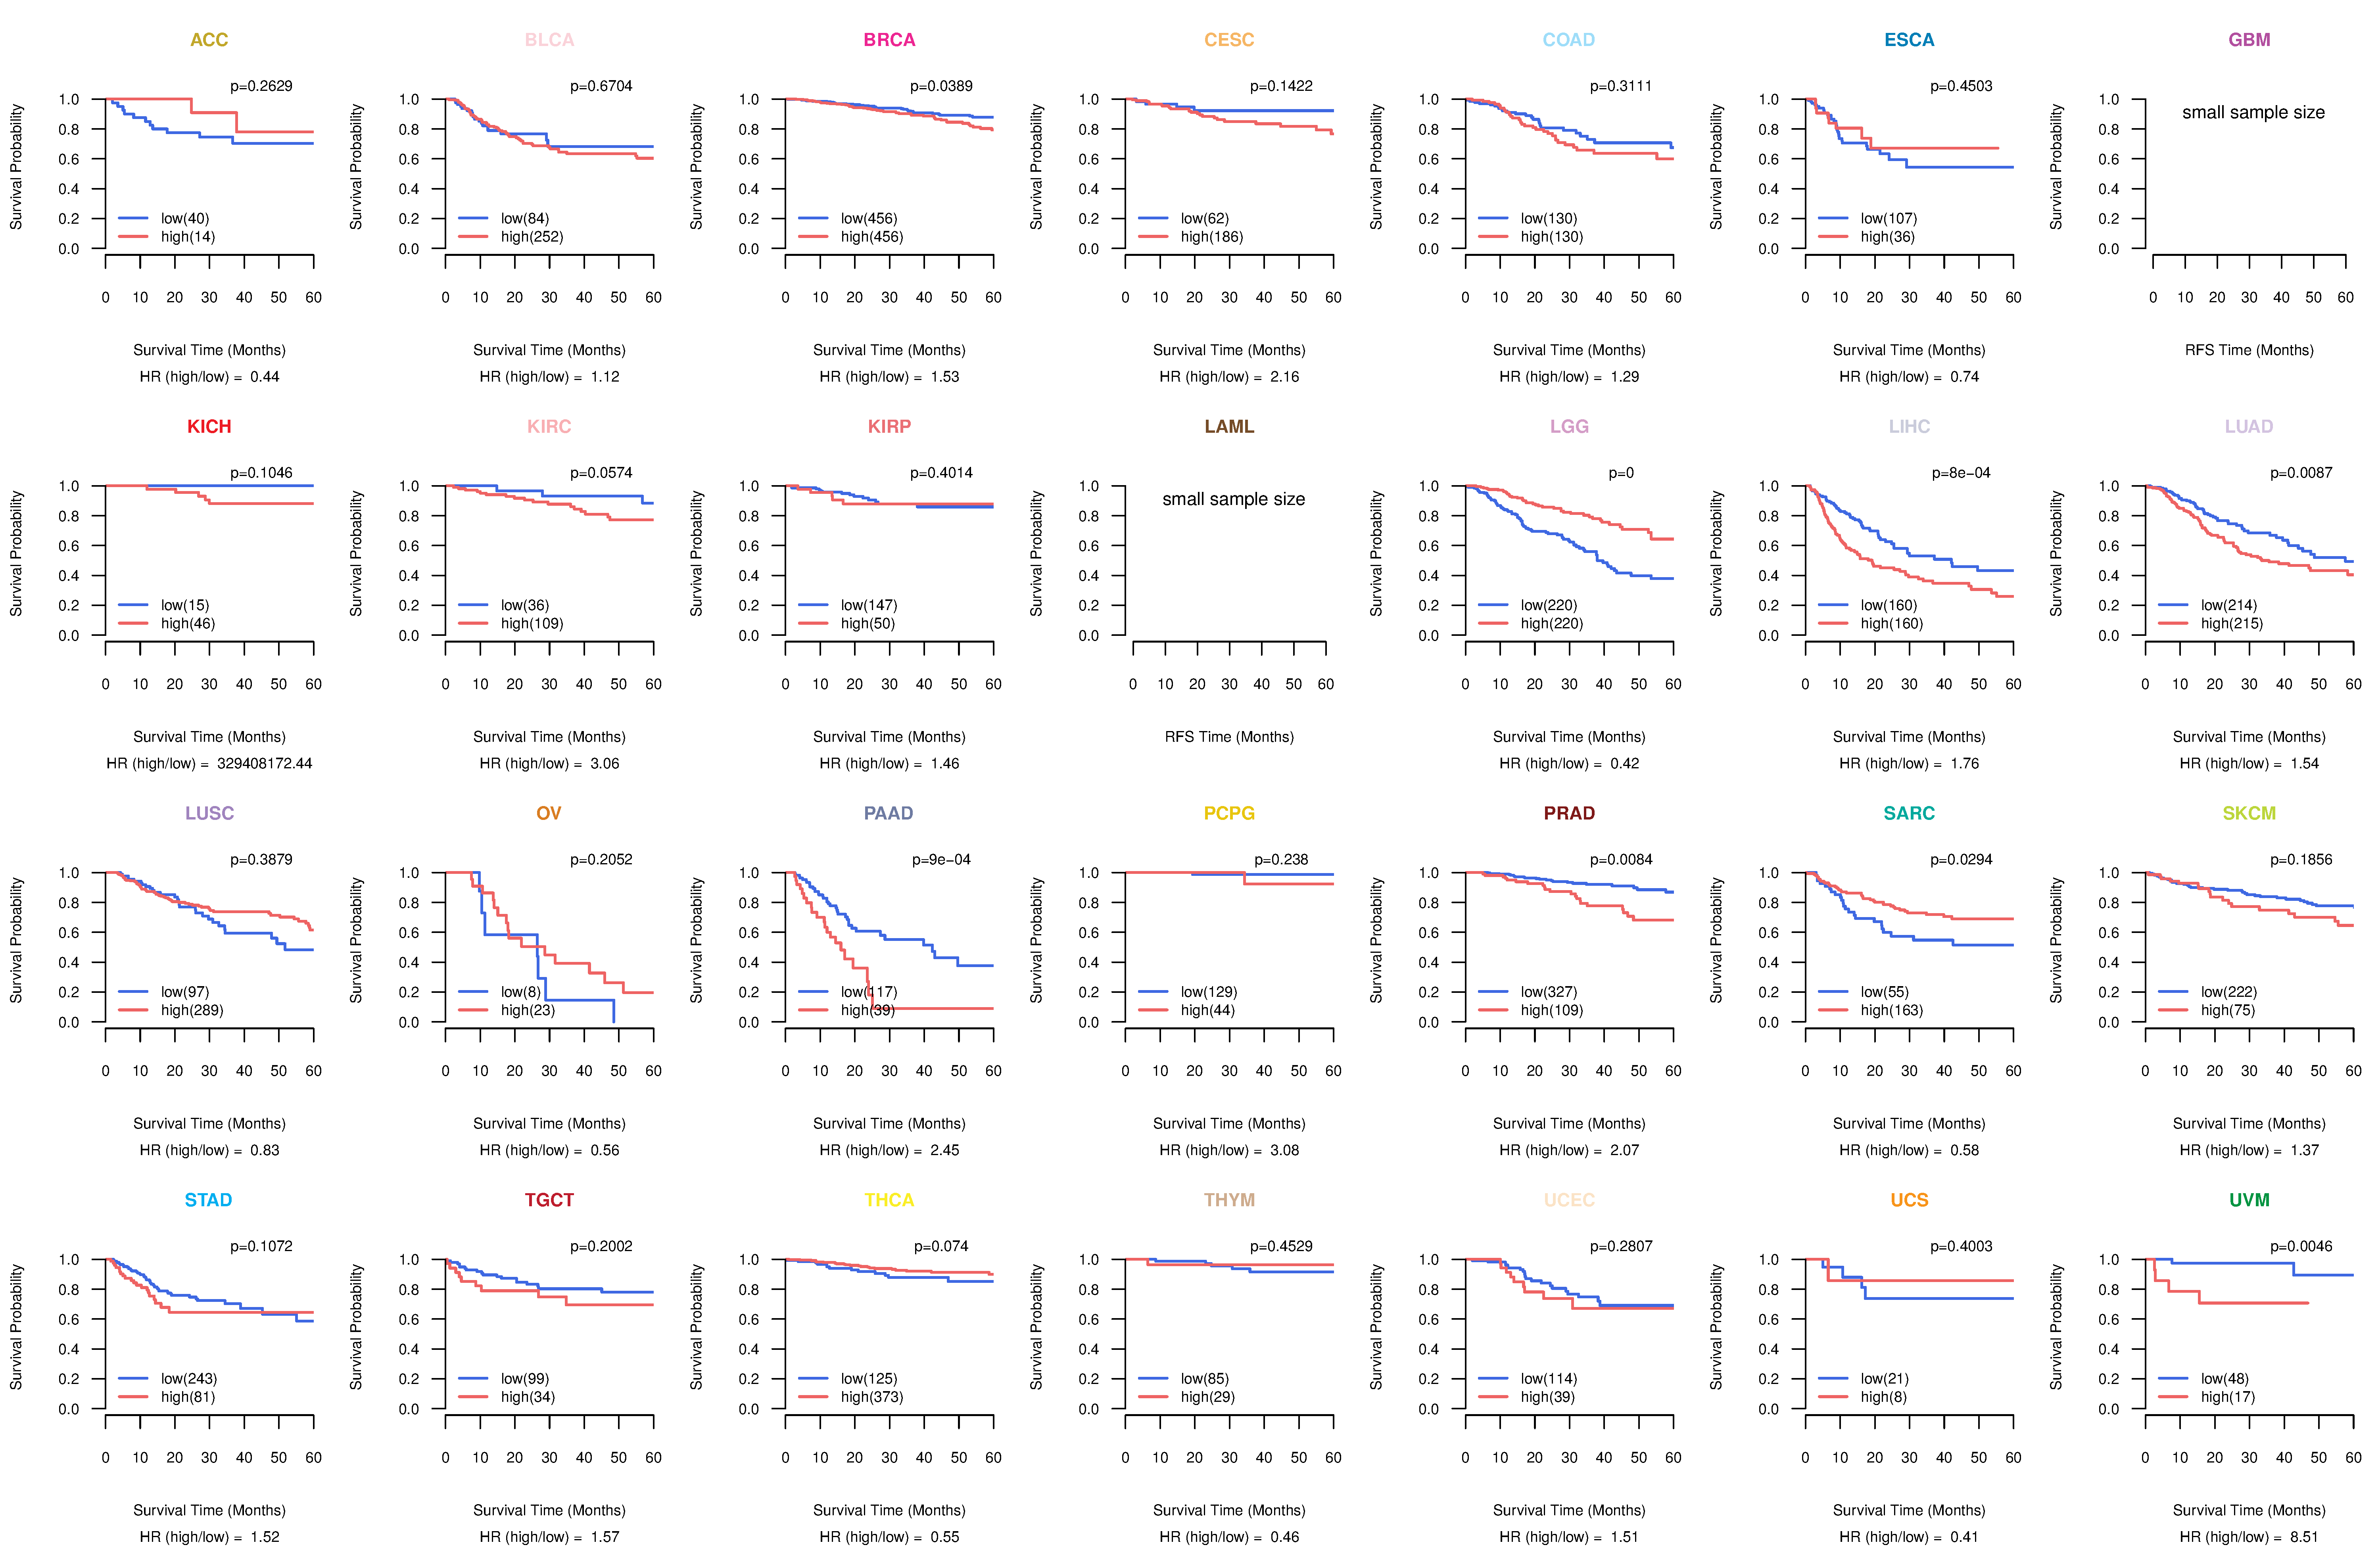
| Kaplan-Meier plots with logrank test of relapse free survival (RFS) using 28 cancer types (TCGA IlluminaHiSeq_RNASeqV2, pan-cancer normalized log2(norm_counts+1) data, version 2016-08-16) (TCGA clinicalMatrix, phenotype data, version 2016-04-27) * Click on the image enlarge it in a new window. |
 |
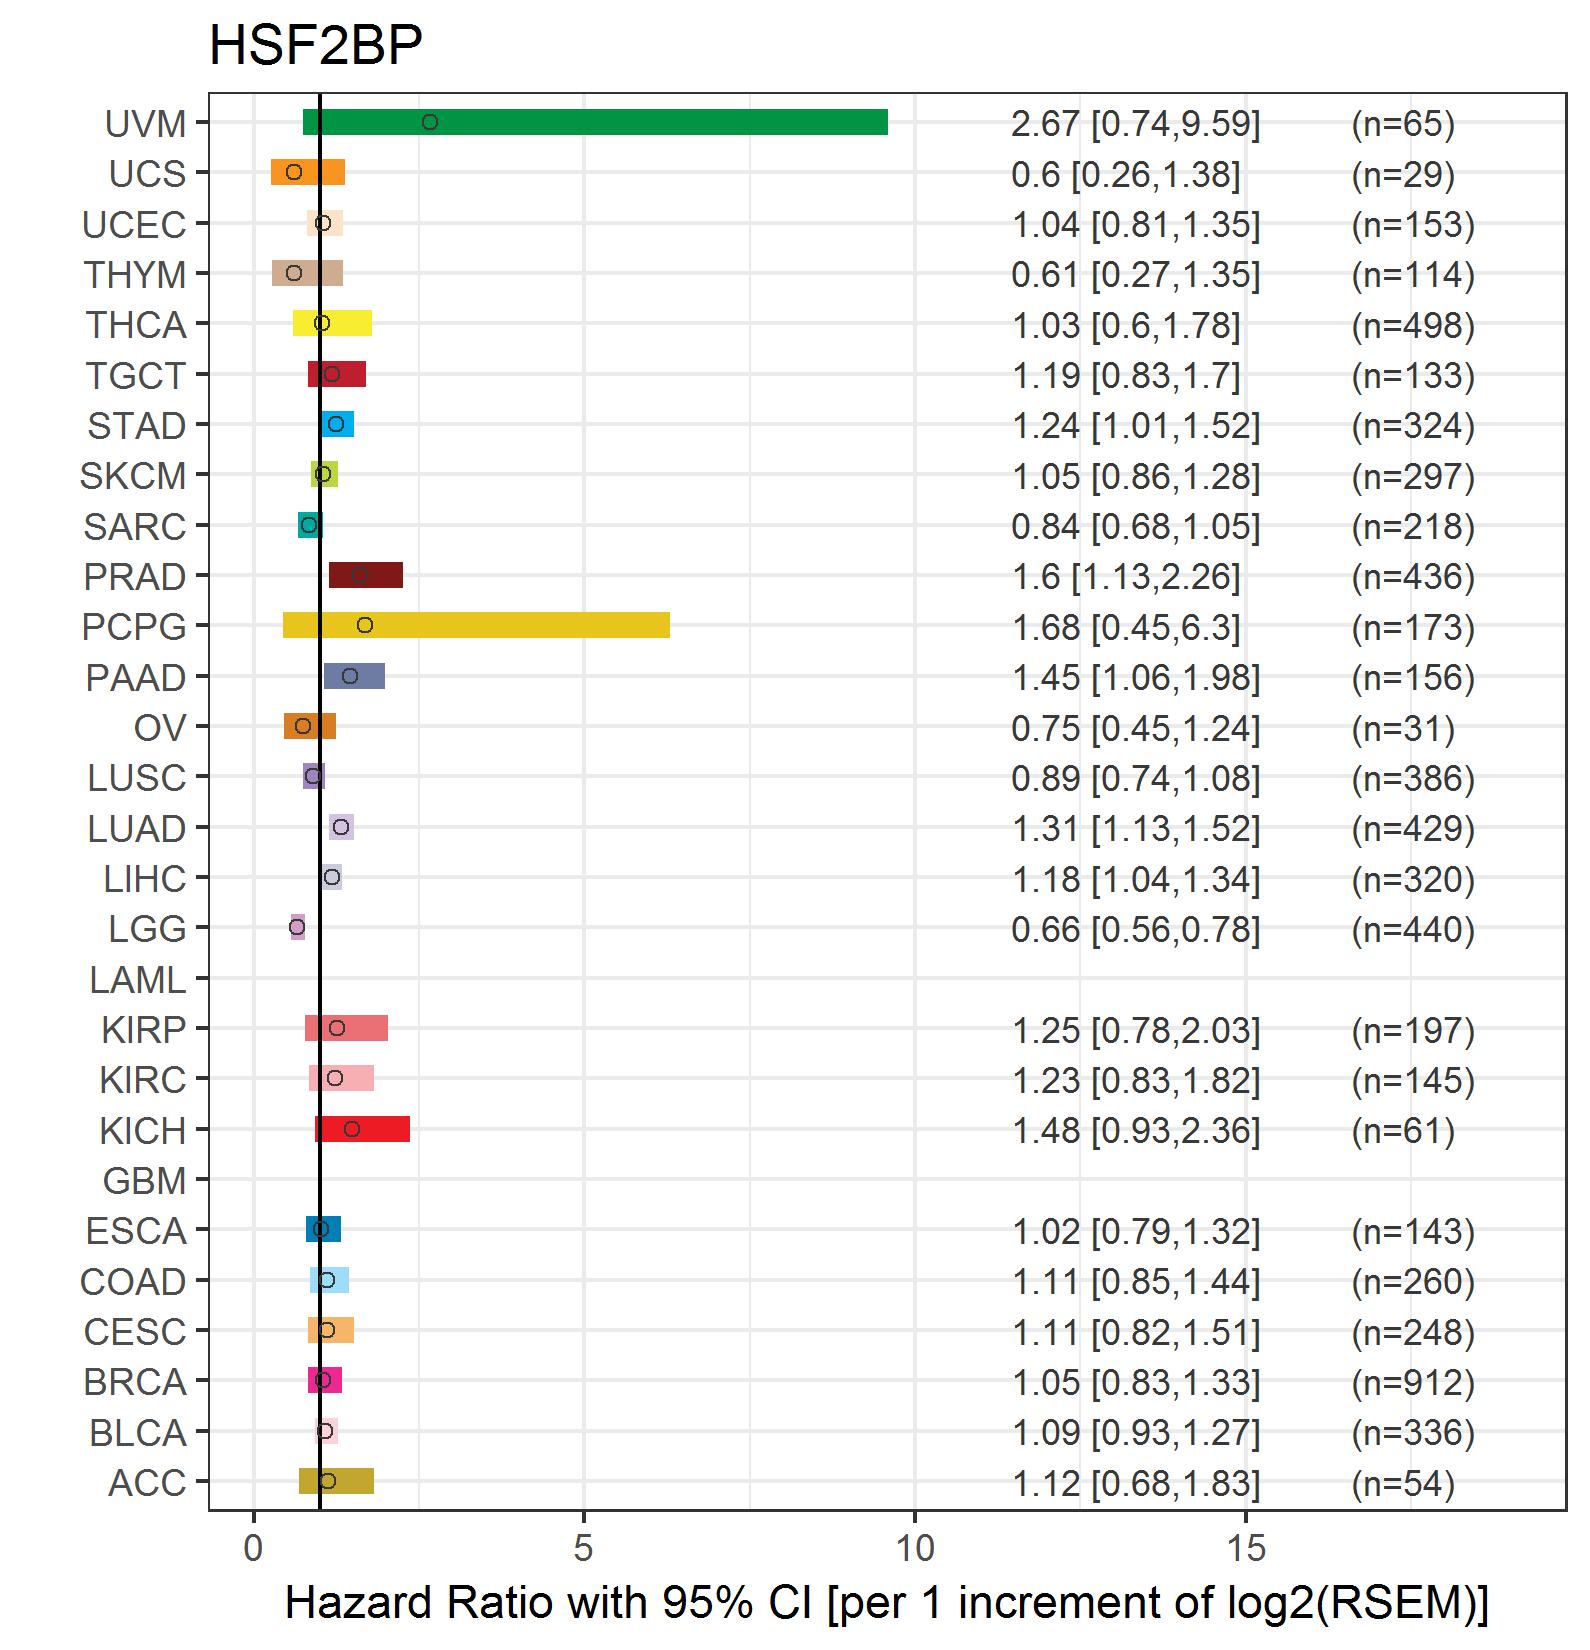
| Forest plot of Cox proportional hazard ratio (HR) and 95% CI of overall survival (OS) using 28 cancer types (TCGA IlluminaHiSeq_RNASeqV2, pan-cancer normalized log2(norm_counts+1) data, version 2016-08-16) (TCGA clinicalMatrix, phenotype data, version 2016-04-27) * Click on the image enlarge it in a new window. |
 |
| Forest plot of Cox proportional hazard ratio (HR) and 95% CI of relapse free survival (RFS) using 28 cancer types (TCGA IlluminaHiSeq_RNASeqV2, pan-cancer normalized log2(norm_counts+1) data, version 2016-08-16) (TCGA clinicalMatrix, phenotype data, version 2016-04-27) * Click on the image enlarge it in a new window. |
 |
| Top |
| TissGeneClin for HSF2BP |
| TissGeneDrug for HSF2BP |
| Drug information targeting TissGene (DrugBank Version 5.0.6, 2017-04-01) |
| DrugBank ID | Drug name | Drug activity | Drug type | Drug status |
| Top |
| TissGeneDisease for HSF2BP |
| Disease information associated with TissGene (DisGeNet, 2016-06-01) |
| Disease ID | Disease name | # pubmeds | Source |
| umls:C0040336 | Tobacco Use Disorder | 1 | GAD |
| umls:C0341106 | Eosinophilic esophagitis | 1 | GWASCAT |
|
Copyright 2016-Present - The University of Texas Health Science Center at Houston (UTHealth) Web File Viewing | How to Report, Fraud, Waste and Abuse | State of Texas | Statewide Search | Texas Homeland Security | Site Policies |