 |
| |
| |
| |
| |
| |
| |
|

| TissGeneSummary for DMC1 |
 Gene summary Gene summary |
| Basic gene information | Gene symbol | DMC1 |
| Gene name | DNA meiotic recombinase 1 | |
| Synonyms | DMC1H|LIM15|dJ199H16.1 | |
| Cytomap | UCSC genome browser: 22q13.1 | |
| Type of gene | protein-coding | |
| RefGenes | NM_001278208.1, NM_007068.3,NR_103474.1, | |
| Description | DMC1 dosage suppressor of mck1 homolog, meiosis-specific homologous recombinationdisrupted meiotic cDNA1, yeast, homolog ofmeiotic recombination protein DMC1/LIM15 homolog | |
| Modification date | 20141207 | |
| dbXrefs | MIM : 602721 | |
| HGNC : HGNC | ||
| Ensembl : ENSG00000100206 | ||
| HPRD : 04099 | ||
| Vega : OTTHUMG00000151088 | ||
| Protein | UniProt: go to UniProt's Cross Reference DB Table | |
| Expression | CleanEX: HS_DMC1 | |
| BioGPS: 11144 | ||
| Pathway | NCI Pathway Interaction Database: DMC1 | |
| KEGG: DMC1 | ||
| REACTOME: DMC1 | ||
| Pathway Commons: DMC1 | ||
| Context | iHOP: DMC1 | |
| ligand binding site mutation search in PubMed: DMC1 | ||
| UCL Cancer Institute: DMC1 | ||
| Assigned class in TissGDB* | C | |
| Included tissue-specific gene expression resources | HPA,GTEx | |
| Specific-tissues in normal samples (assigned by TissGDB using HPA, TiGER, and GTEx) | Testis | |
| Cancer types related to the specific-tissues in cancer samples (assigned by TissGDB using TCGA) | TGCT | |
| Reference showing the relevant tissue of DMC1 | ||
| Description by TissGene annotations | Cancer gene | |
| * Class A consists of genes with literature evidence and is part of the cTissGenes. Class B consists of only cTissGenes without additional evidence. The remaining genes belong to Class C. |
| Gene ontology having evidence of Inferred from Direct Assay (IDA) from Entrez |
| GO ID | GO term | PubMed ID |
| Top |
| TissGeneExp for DMC1 |
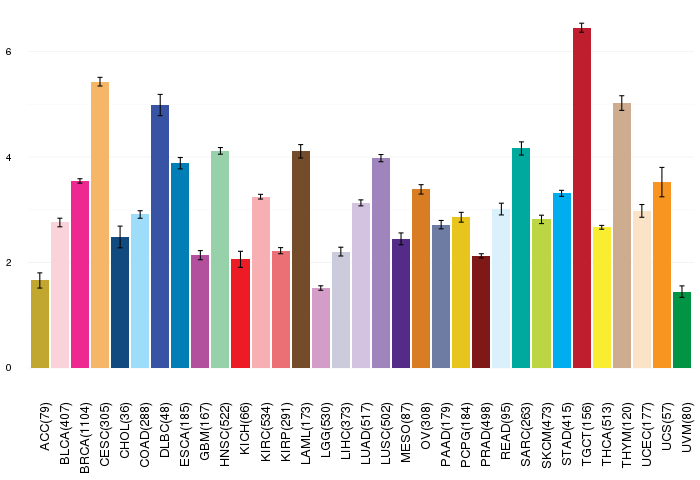
| Gene expressions across 28 cancer types (X-axis: cancer type and Y-axis: log2(norm_counts+1)) (TCGA IlluminaHiSeq_RNASeqV2, pan-cancer normalized log2(norm_counts+1) data, version 2016-08-16) |
 |
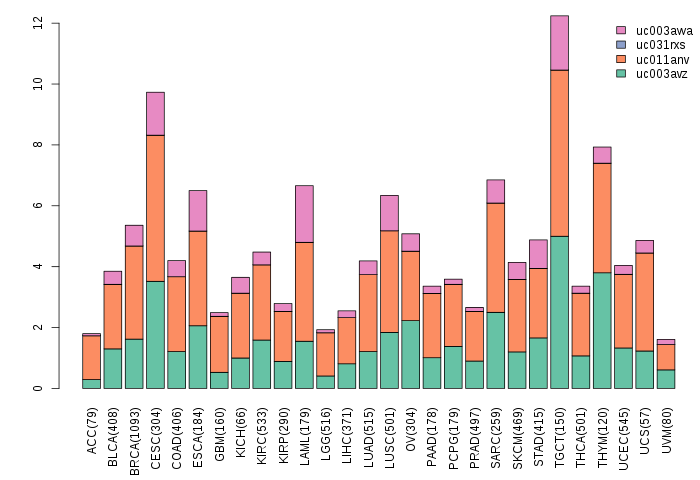
| Gene isoform expressions across 28 cancer types (X-axis: cancer type and Y-axis: log2(norm_counts+1)) (TCGA pan-cancer tcga_rsem_isoform_tpm, version 2016-09-01) |
 |
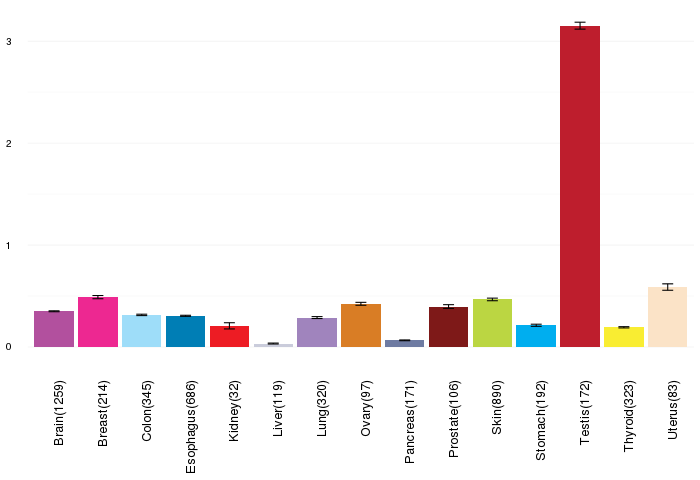
| Gene expressions across normal tissues of GTEx data (GTEx GTEx_Analysis_v6_RNA-seq_RNA-SeQCv1.1.8_gene_rpkm.gct) - Here, we shows the matched tissue types only among our 28 cancer types. |
 |
| Different expressions across 14 cancer types with more than 10 samples between matched tumors and normals (X-axis: cancer type and Y-axis: log2(norm_counts+1)) (TCGA IlluminaHiSeq_RNASeqV2, pan-cancer normalized log2(norm_counts+1) data, version 2016-08-16) |
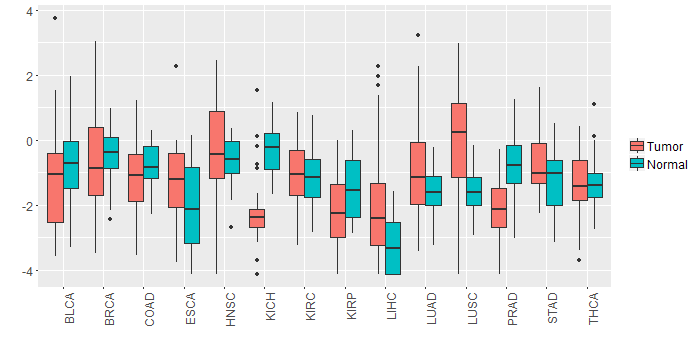 |
| - Significantly differentially expressed cancer types and information. (|Fold change|>1 and FDR<0.05) |
| Cancer type | Mean(exp) in tumor | Mean(exp) in matched normal | Log2FC | P-val. | FDR |
| LIHC | -1.975715101 | -3.258585101 | 1.28287 | 1.73E-05 | 6.94E-05 |
| PRAD | -2.120654024 | -0.760979024 | -1.359675 | 1.16E-12 | 6.19E-11 |
| LUSC | -0.025382003 | -1.603891807 | 1.578509804 | 1.28E-08 | 3.99E-08 |
| KICH | -2.166879101 | -0.281035101 | -1.885844 | 2.38E-07 | 1.01E-06 |
| Top |
| TissGene-miRNA for DMC1 |
| Significantly anti-correlated miRNAs of TissGene across 28 cancer types (Gene-miRNA relations from TargetScanHuman Relsease 7.1, Conserved_Site_Context_Scores.txt.zip, 06.01.2016) (TCGA IlluminaHiSeq_miRNASeq, log2(RPM+1) data, version 2016-11-21) (TCGA IlluminaHiSeq_RNASeqV2, log2(normalized_count+1) data, version 2016-08-16) (Spearman’s Rank Correlation (p-value<0.05 and coefficient<-0.25)) |
| Cancer type | miRNA id | miRNA accession | P-val. | Coeff. | # samples |
| Top |
| TissGeneMut for DMC1 |
| TissGeneSNV for DMC1 |
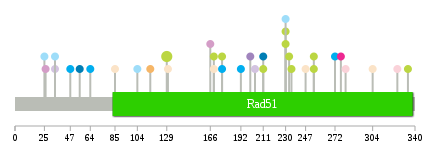
| nsSNV counts per each loci. Different colors of circles represent different cancer types. Circle size denotes number of samples. (TCGA somatic mutation (SNPs and small INDELs) data, version 2016-04-25) * Click on the image to enlarge it in a new window. |
 |
 |
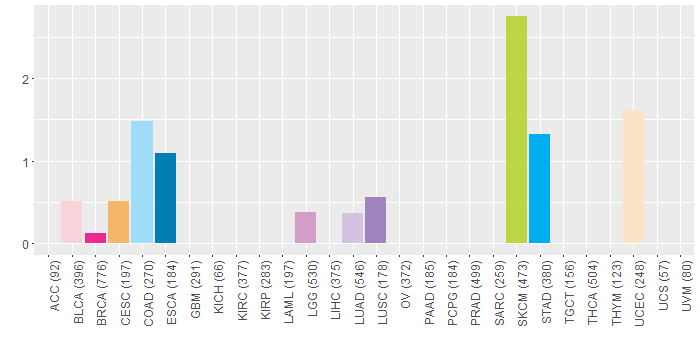
| Somatic nucleotide variants of TissGene across 28 cancer types (X-axis: cancer type and Y-axis: % of mutated samples) The numbers in parentheses are numbers of samples with mutation (nsSNVs). (TCGA somatic mutation (SNPs and small INDELs) data, version 2016-04-25) |
 |
| - nsSNVs sorted by frequency. |
| AAchange | Cancer type | # samples |
| p.R129C | SKCM | 5 |
| p.D160H | HNSC | 1 |
| p.T130I | UCEC | 1 |
| p.R230X | SKCM | 1 |
| p.R169C | UCEC | 1 |
| p.T277I | BRCA | 1 |
| p.Q254X | SKCM | 1 |
| p.G115E | CESC | 1 |
| p.A272V | STAD | 1 |
| p.L26M | LGG | 1 |
| p.V34M | COAD | 1 |
| p.F233Y | SKCM | 1 |
| p.R304* | UCEC | 1 |
| p.D25G | COAD | 1 |
| p.F85L | UCEC | 1 |
| p.G334E | SKCM | 1 |
| p.H211Y | SKCM | 1 |
| p.Q281E | BLCA | 1 |
| p.M200I | LUSC | 1 |
| p.G104R | COAD | 1 |
| p.G64R | STAD | 1 |
| p.R166H | LGG | 1 |
| p.A247V | UCEC | 1 |
| p.G235C | SKCM | 1 |
| p.R192H | STAD | 1 |
| p.R230* | SKCM | 1 |
| p.R169C | SKCM | 1 |
| p.T55I | ESCA | 1 |
| p.H211Q | ESCA | 1 |
| p.R176C | SKCM | 1 |
| p.V34M | LUAD | 1 |
| p.R230X | COAD | 1 |
| p.D204Y | LUAD | 1 |
| p.T47A | STAD | 1 |
| p.E325K | BLCA | 1 |
| p.R176C | STAD | 1 |
| p.Q254* | SKCM | 1 |
| Top |
| TissGeneCNV for DMC1 |
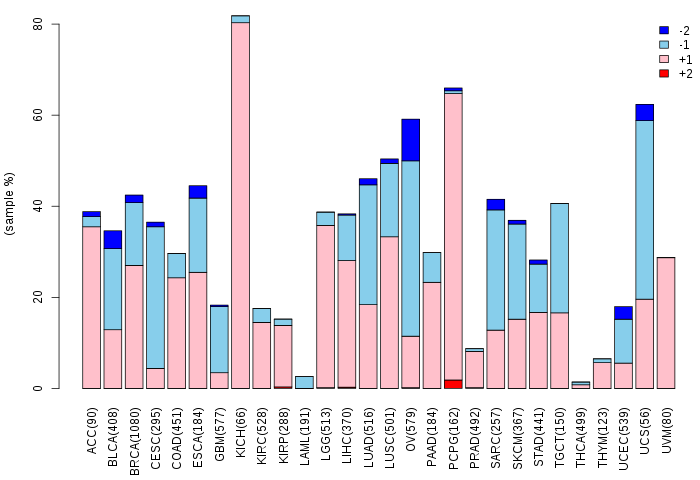
| Copy number variations of TissGene across 28 cancer types (X-axis: cancer type and Y-axis: % of CNV samples) (TCGA Gistic2_CopyNumber_Gistic2_all_data_by_genes, Gistic2 copy number data, version 2016-08-16) |
 |
| Top |
| TissGeneFusions for DMC1 |
| Fusion genes including TissGene (ChimerDB 3.0, 2016-12-01 and TCGA fusion Portal 2015-12-01) |
| Database | Src | Cancer type | Sample | Fusion gene | ORF | 5'-gene BP | 3'-gene BP |
| TCGAfusionPortal | PRADA | BRCA | TCGA-BH-A0BC-01A | DMC1-DNAL4 | In-frame | Chr22:38962595 | Chr22:39177014 |
| Top |
| TissGeneNet for DMC1 |
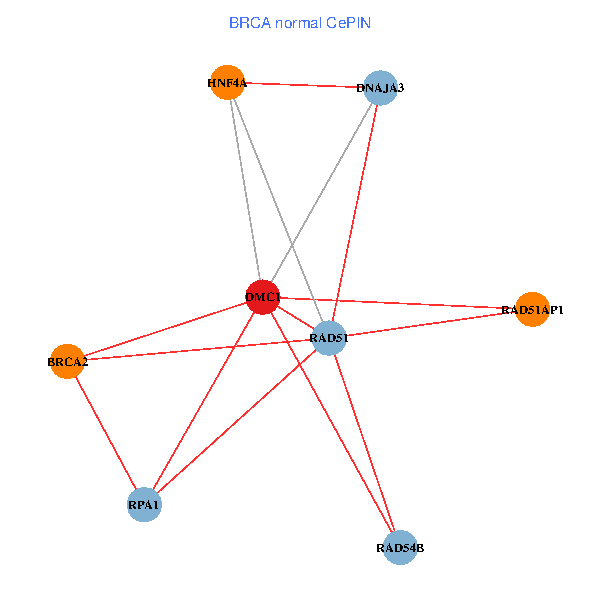
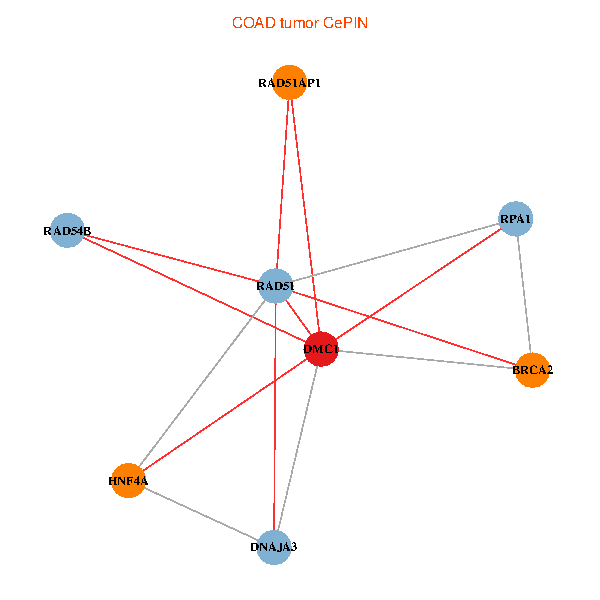
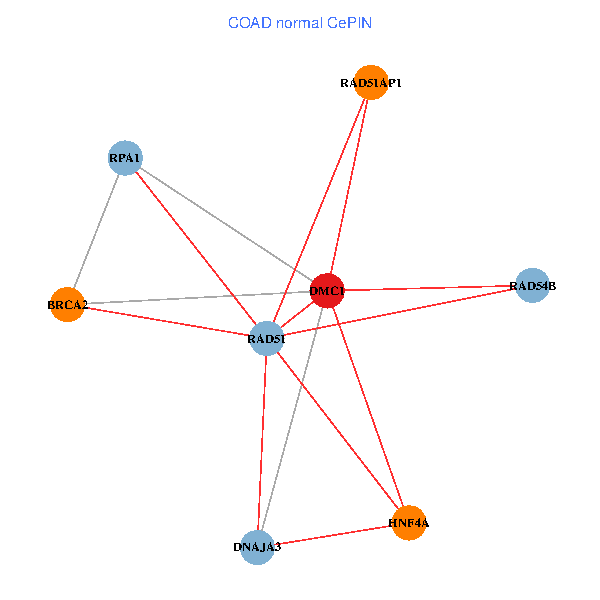
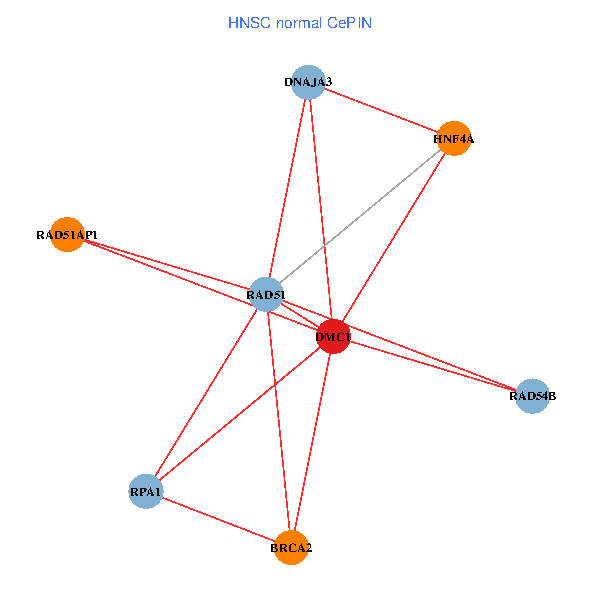
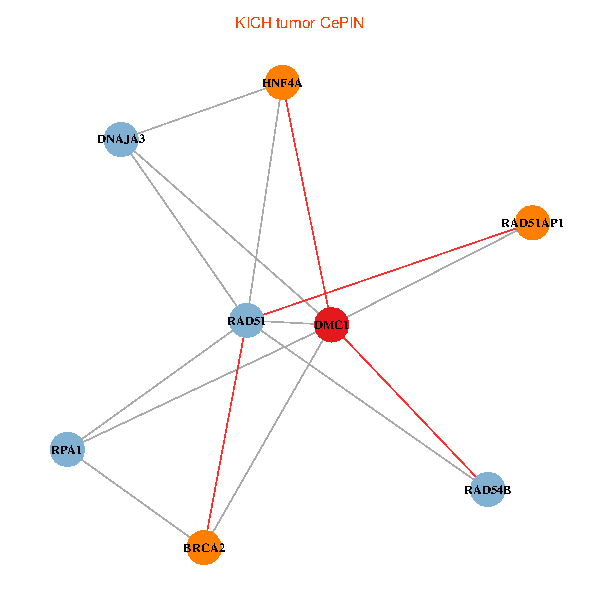
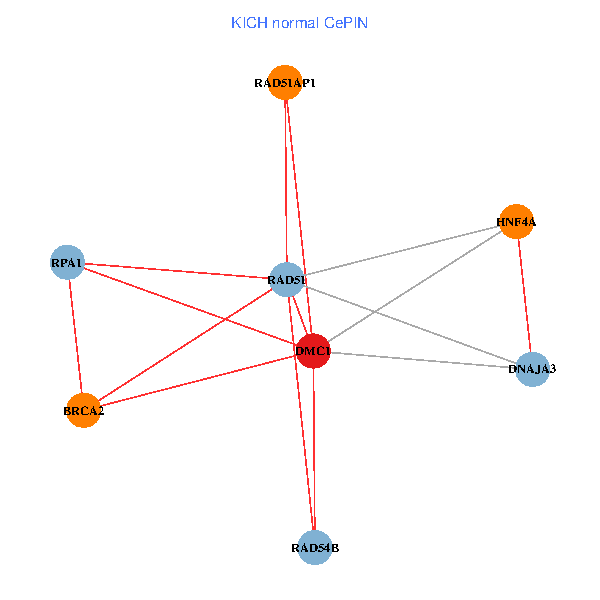
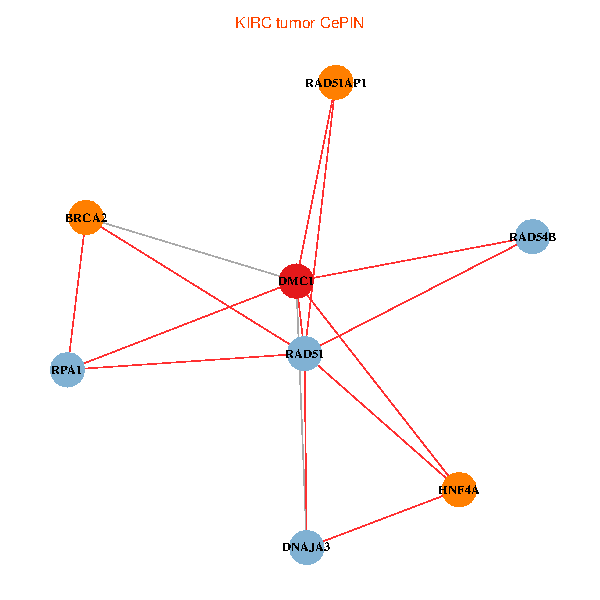
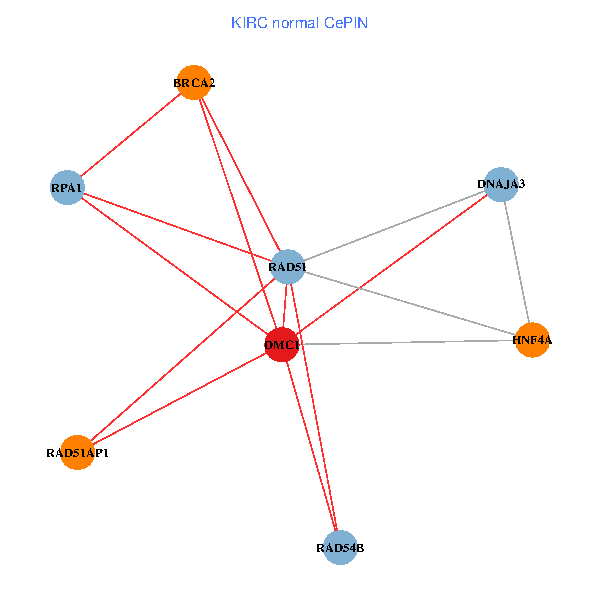
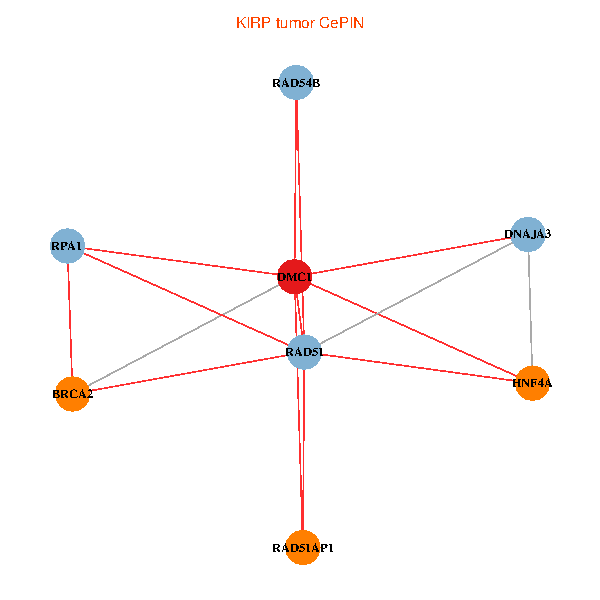
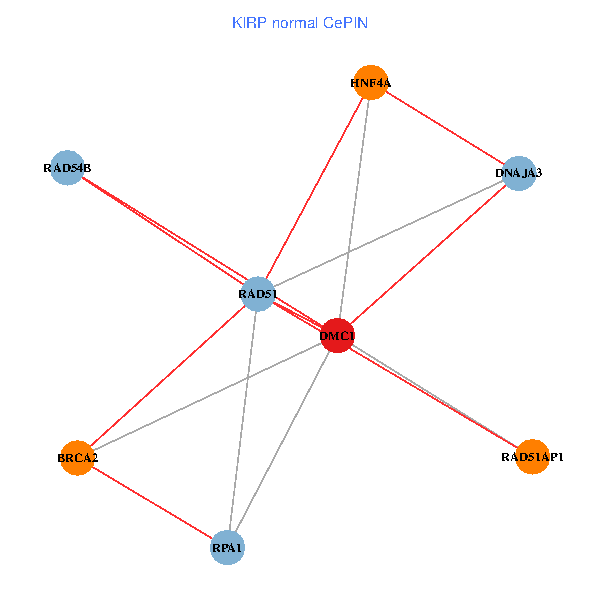
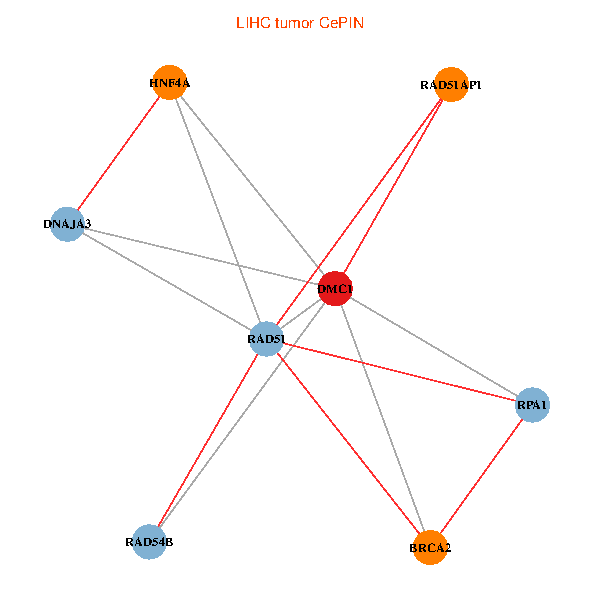
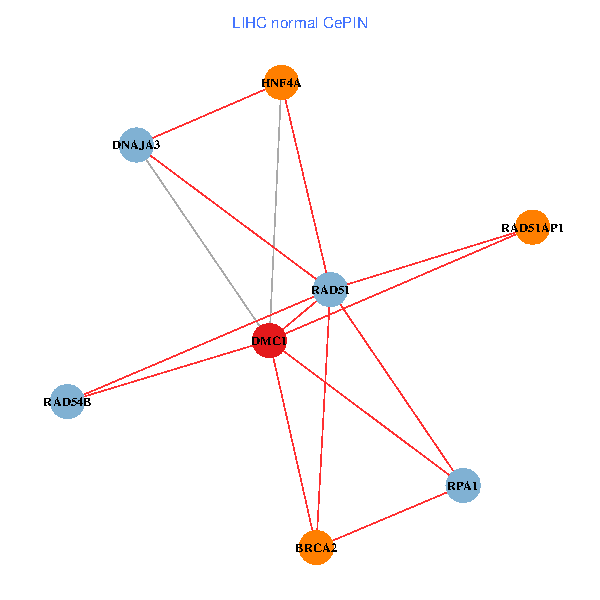
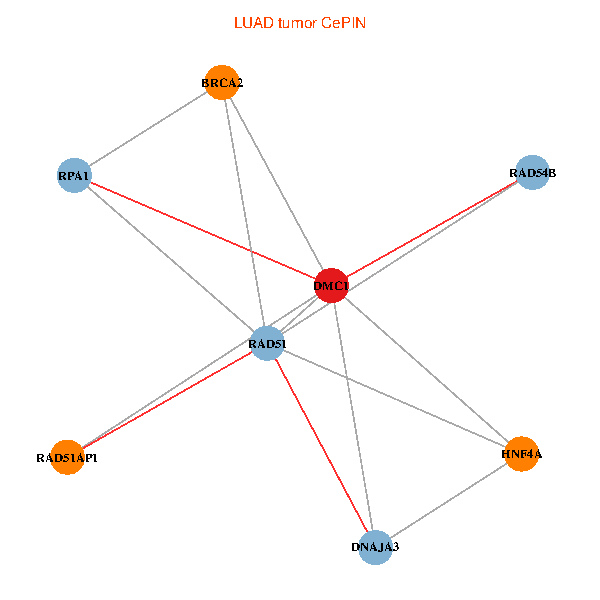
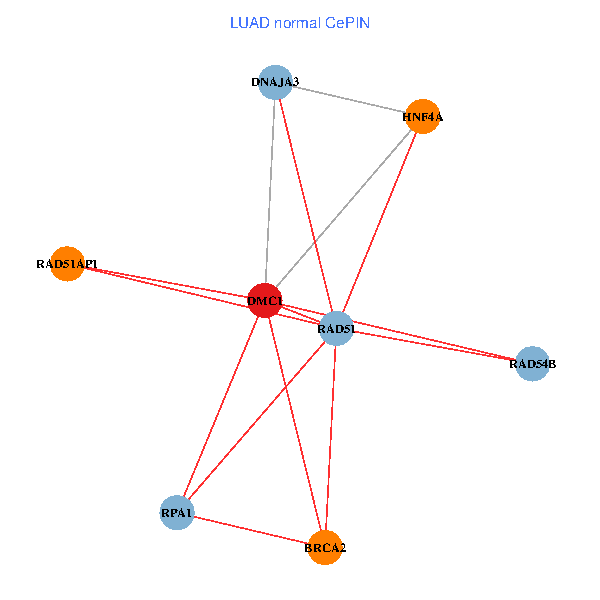
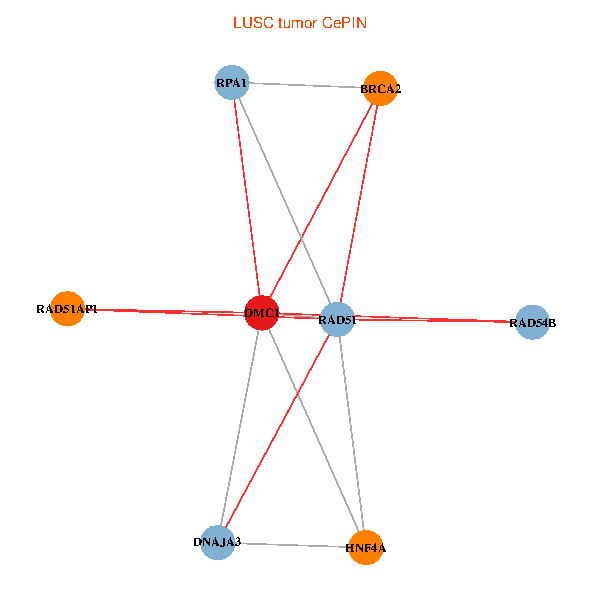
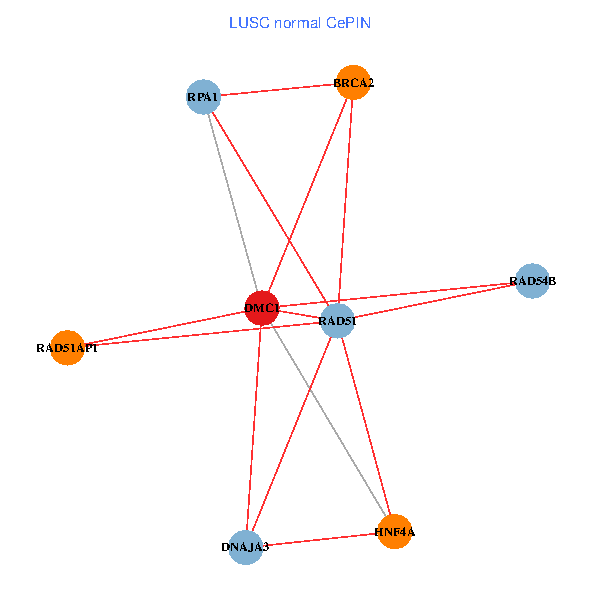
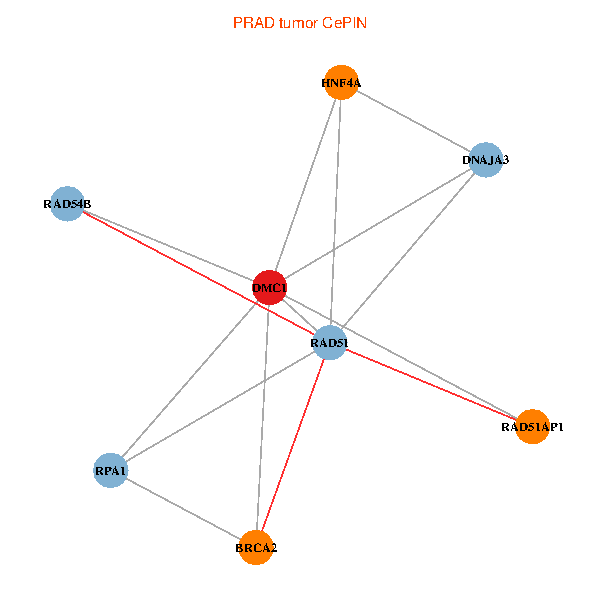
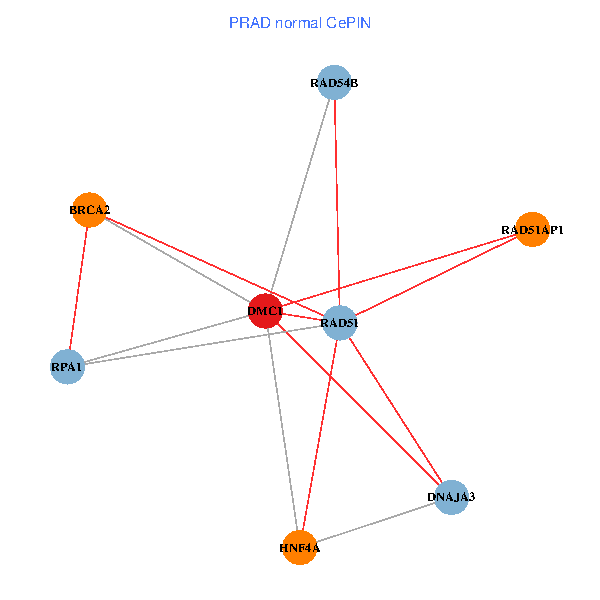
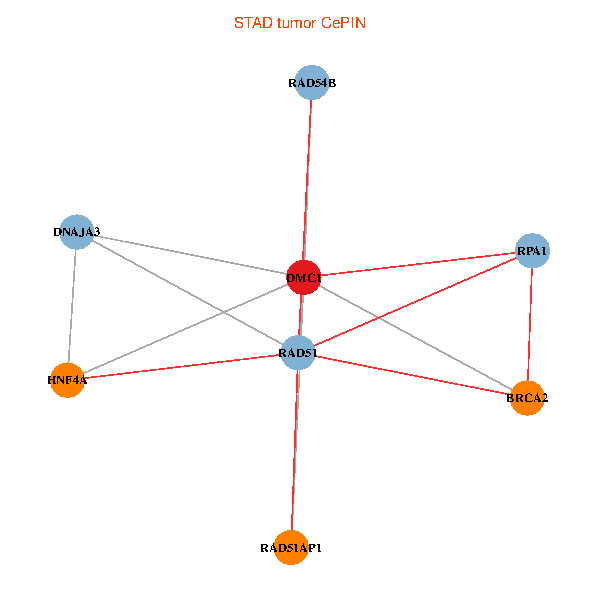
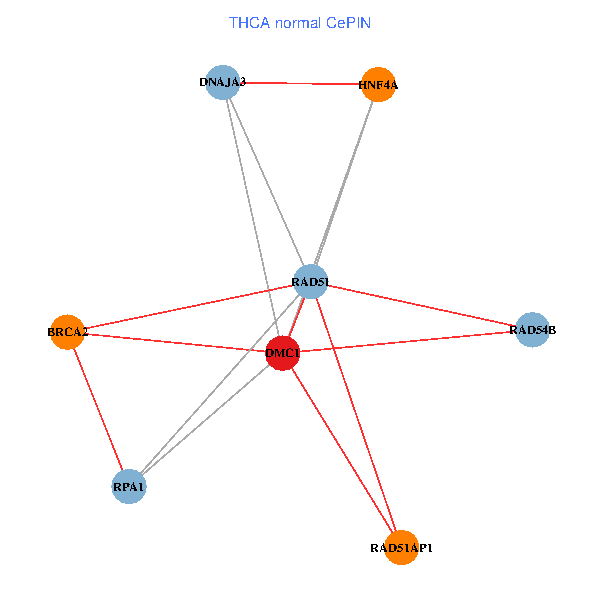
| Co-expressed gene networks based on protein-protein interaction data (CePIN) (TCGA IlluminaHiSeq_RNASeqV2, pan-cancer normalized log2(norm_counts+1) data, version 2016-08-16) (PINA2 ppi data) |
| BRCA (tumor) | BRCA (normal) |
| DMC1, HNF4A, RAD51, RAD54B, RPA1, BRCA2, RAD51AP1, DNAJA3 (tumor) | DMC1, HNF4A, RAD51, RAD54B, RPA1, BRCA2, RAD51AP1, DNAJA3 (normal) |
 |  |
| COAD (tumor) | COAD (normal) |
| DMC1, HNF4A, RAD51, RAD54B, RPA1, BRCA2, RAD51AP1, DNAJA3 (tumor) | DMC1, HNF4A, RAD51, RAD54B, RPA1, BRCA2, RAD51AP1, DNAJA3 (normal) |
 |  |
| HNSC (tumor) | HNSC (normal) |
| DMC1, HNF4A, RAD51, RAD54B, RPA1, BRCA2, RAD51AP1, DNAJA3 (tumor) | DMC1, HNF4A, RAD51, RAD54B, RPA1, BRCA2, RAD51AP1, DNAJA3 (normal) |
 |  |
| KICH (tumor) | KICH (normal) |
| DMC1, HNF4A, RAD51, RAD54B, RPA1, BRCA2, RAD51AP1, DNAJA3 (tumor) | DMC1, HNF4A, RAD51, RAD54B, RPA1, BRCA2, RAD51AP1, DNAJA3 (normal) |
 |  |
| KIRC (tumor) | KIRC (normal) |
| DMC1, HNF4A, RAD51, RAD54B, RPA1, BRCA2, RAD51AP1, DNAJA3 (tumor) | DMC1, HNF4A, RAD51, RAD54B, RPA1, BRCA2, RAD51AP1, DNAJA3 (normal) |
 |  |
| KIRP (tumor) | KIRP (normal) |
| DMC1, HNF4A, RAD51, RAD54B, RPA1, BRCA2, RAD51AP1, DNAJA3 (tumor) | DMC1, HNF4A, RAD51, RAD54B, RPA1, BRCA2, RAD51AP1, DNAJA3 (normal) |
 |  |
| LIHC (tumor) | LIHC (normal) |
| DMC1, HNF4A, RAD51, RAD54B, RPA1, BRCA2, RAD51AP1, DNAJA3 (tumor) | DMC1, HNF4A, RAD51, RAD54B, RPA1, BRCA2, RAD51AP1, DNAJA3 (normal) |
 |  |
| LUAD (tumor) | LUAD (normal) |
| DMC1, HNF4A, RAD51, RAD54B, RPA1, BRCA2, RAD51AP1, DNAJA3 (tumor) | DMC1, HNF4A, RAD51, RAD54B, RPA1, BRCA2, RAD51AP1, DNAJA3 (normal) |
 |  |
| LUSC (tumor) | LUSC (normal) |
| DMC1, HNF4A, RAD51, RAD54B, RPA1, BRCA2, RAD51AP1, DNAJA3 (tumor) | DMC1, HNF4A, RAD51, RAD54B, RPA1, BRCA2, RAD51AP1, DNAJA3 (normal) |
 |  |
| PRAD (tumor) | PRAD (normal) |
| DMC1, HNF4A, RAD51, RAD54B, RPA1, BRCA2, RAD51AP1, DNAJA3 (tumor) | DMC1, HNF4A, RAD51, RAD54B, RPA1, BRCA2, RAD51AP1, DNAJA3 (normal) |
 |  |
| STAD (tumor) | STAD (normal) |
| DMC1, HNF4A, RAD51, RAD54B, RPA1, BRCA2, RAD51AP1, DNAJA3 (tumor) | DMC1, HNF4A, RAD51, RAD54B, RPA1, BRCA2, RAD51AP1, DNAJA3 (normal) |
 |  |
| THCA (tumor) | THCA (normal) |
| DMC1, HNF4A, RAD51, RAD54B, RPA1, BRCA2, RAD51AP1, DNAJA3 (tumor) | DMC1, HNF4A, RAD51, RAD54B, RPA1, BRCA2, RAD51AP1, DNAJA3 (normal) |
 |  |
| Top |
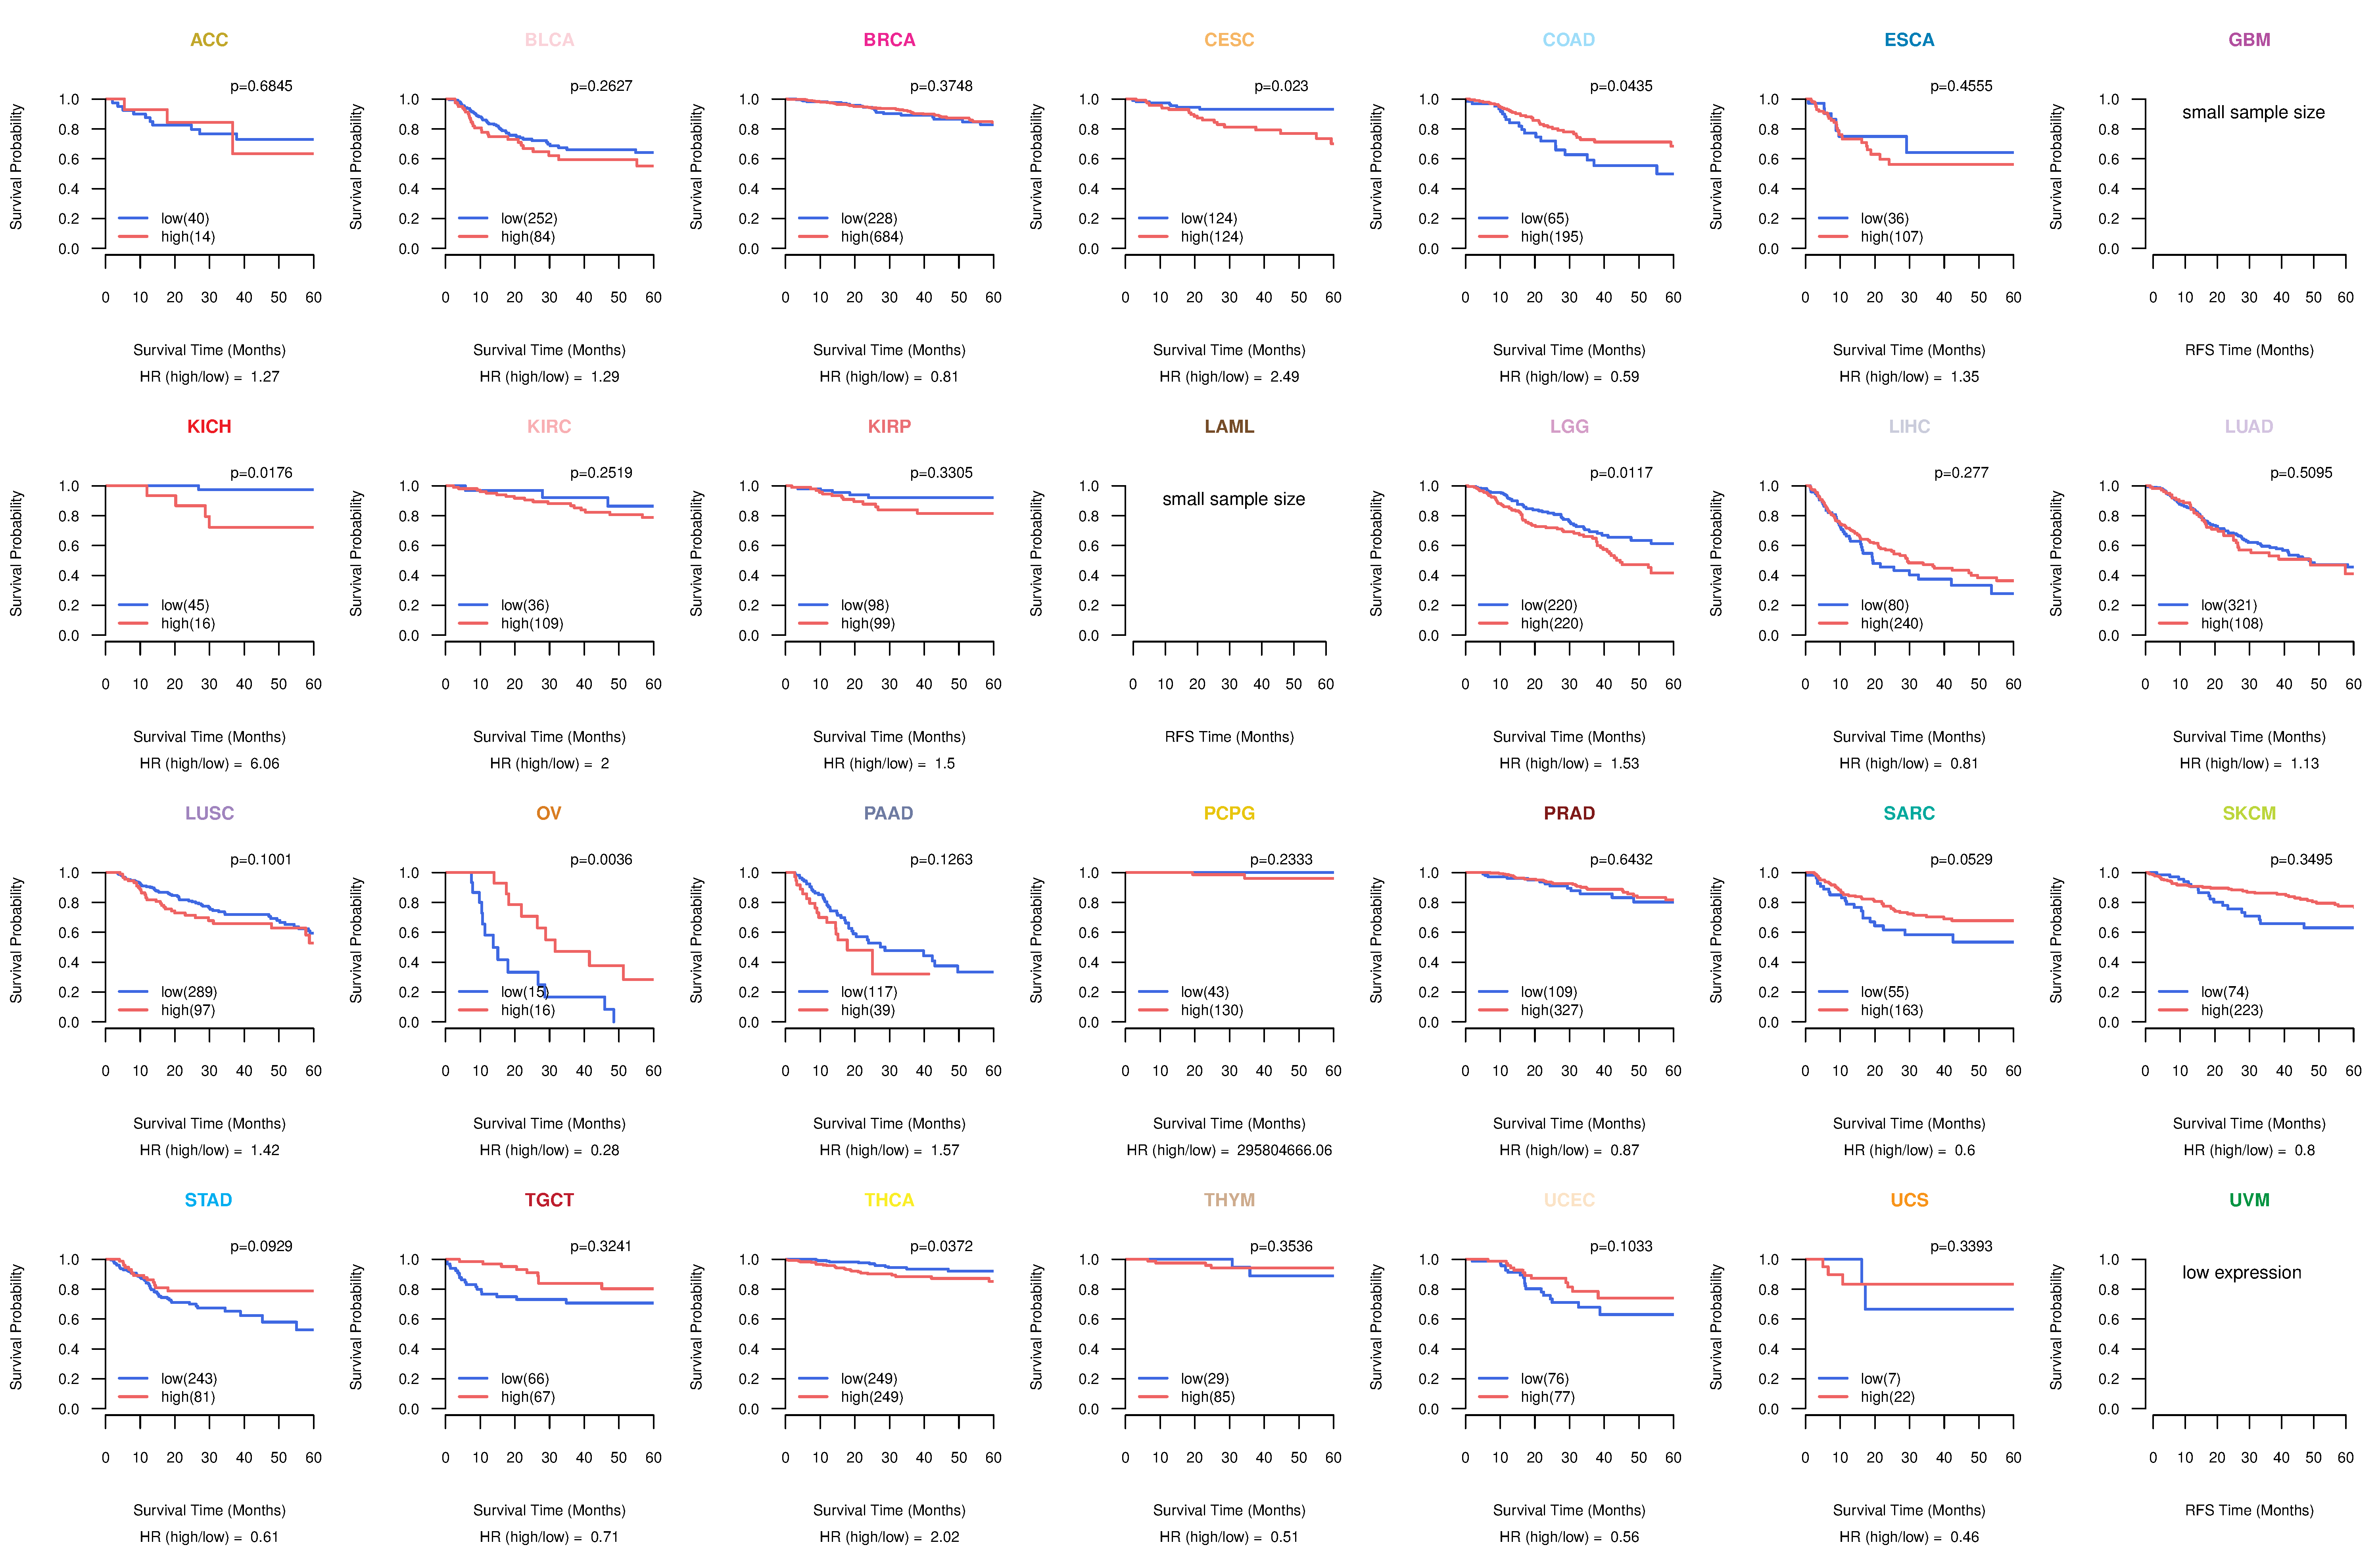
| TissGeneProg for DMC1 |
| Kaplan-Meier plots with logrank tests of overall survival (OS) using 28 cancer types (TCGA IlluminaHiSeq_RNASeqV2, pan-cancer normalized log2(norm_counts+1) data, version 2016-08-16) (TCGA clinicalMatrix, phenotype data, version 2016-04-27) * Click on the image to enlarge it in a new window. |
 |
| Kaplan-Meier plots with logrank test of relapse free survival (RFS) using 28 cancer types (TCGA IlluminaHiSeq_RNASeqV2, pan-cancer normalized log2(norm_counts+1) data, version 2016-08-16) (TCGA clinicalMatrix, phenotype data, version 2016-04-27) * Click on the image enlarge it in a new window. |
 |
| Forest plot of Cox proportional hazard ratio (HR) and 95% CI of overall survival (OS) using 28 cancer types (TCGA IlluminaHiSeq_RNASeqV2, pan-cancer normalized log2(norm_counts+1) data, version 2016-08-16) (TCGA clinicalMatrix, phenotype data, version 2016-04-27) * Click on the image enlarge it in a new window. |
 |
| Forest plot of Cox proportional hazard ratio (HR) and 95% CI of relapse free survival (RFS) using 28 cancer types (TCGA IlluminaHiSeq_RNASeqV2, pan-cancer normalized log2(norm_counts+1) data, version 2016-08-16) (TCGA clinicalMatrix, phenotype data, version 2016-04-27) * Click on the image enlarge it in a new window. |
 |
| Top |
| TissGeneClin for DMC1 |
| TissGeneDrug for DMC1 |
| Drug information targeting TissGene (DrugBank Version 5.0.6, 2017-04-01) |
| DrugBank ID | Drug name | Drug activity | Drug type | Drug status |
| Top |
| TissGeneDisease for DMC1 |
| Disease information associated with TissGene (DisGeNet, 2016-06-01) |
| Disease ID | Disease name | # pubmeds | Source |
| umls:C0006142 | Malignant neoplasm of breast | 2 | BeFree,GAD |
| umls:C0085215 | Ovarian Failure, Premature | 2 | BeFree,GAD,LHGDN |
| umls:C0004509 | Azoospermia | 1 | GAD |
| umls:C0025322 | Premature Menopause | 1 | BeFree |
| umls:C0028960 | Oligospermia | 1 | GAD |
| umls:C0342510 | Ovarian dysgenesis | 1 | BeFree |
| umls:C0678222 | Breast Carcinoma | 1 | BeFree |
|
Copyright 2016-Present - The University of Texas Health Science Center at Houston (UTHealth) Web File Viewing | How to Report, Fraud, Waste and Abuse | State of Texas | Statewide Search | Texas Homeland Security | Site Policies |