 |
| |
| |
| |
| |
| |
| |
|

| TissGeneSummary for INMT |
 Gene summary Gene summary |
| Basic gene information | Gene symbol | INMT |
| Gene name | indolethylamine N-methyltransferase | |
| Synonyms | TEMT | |
| Cytomap | UCSC genome browser: 7p14.3 | |
| Type of gene | protein-coding | |
| RefGenes | NM_001199219.1, NM_006774.4, | |
| Description | amine N-methyltransferasearomatic alkylamine N-methyltransferasearylamine N-methyltransferaseindolamine N-methyltransferasenicotine N-methyltransferasethioether S-methyltransferase | |
| Modification date | 20141207 | |
| dbXrefs | MIM : 604854 | |
| HGNC : HGNC | ||
| Ensembl : ENSG00000241644 | ||
| HPRD : 06890 | ||
| Vega : OTTHUMG00000167163 | ||
| Protein | UniProt: go to UniProt's Cross Reference DB Table | |
| Expression | CleanEX: HS_INMT | |
| BioGPS: 11185 | ||
| Pathway | NCI Pathway Interaction Database: INMT | |
| KEGG: INMT | ||
| REACTOME: INMT | ||
| Pathway Commons: INMT | ||
| Context | iHOP: INMT | |
| ligand binding site mutation search in PubMed: INMT | ||
| UCL Cancer Institute: INMT | ||
| Assigned class in TissGDB* | C | |
| Included tissue-specific gene expression resources | TiGER,GTEx | |
| Specific-tissues in normal samples (assigned by TissGDB using HPA, TiGER, and GTEx) | LungSoft tissue | |
| Cancer types related to the specific-tissues in cancer samples (assigned by TissGDB using TCGA) | LUAD,LUSCSARC | |
| Reference showing the relevant tissue of INMT | ||
| Description by TissGene annotations | ||
| * Class A consists of genes with literature evidence and is part of the cTissGenes. Class B consists of only cTissGenes without additional evidence. The remaining genes belong to Class C. |
| Gene ontology having evidence of Inferred from Direct Assay (IDA) from Entrez |
| GO ID | GO term | PubMed ID | GO:0009308 | amine metabolic process | 10552930 | GO:0032259 | methylation | 10552930 | GO:0009308 | amine metabolic process | 10552930 | GO:0032259 | methylation | 10552930 |
| Top |
| TissGeneExp for INMT |
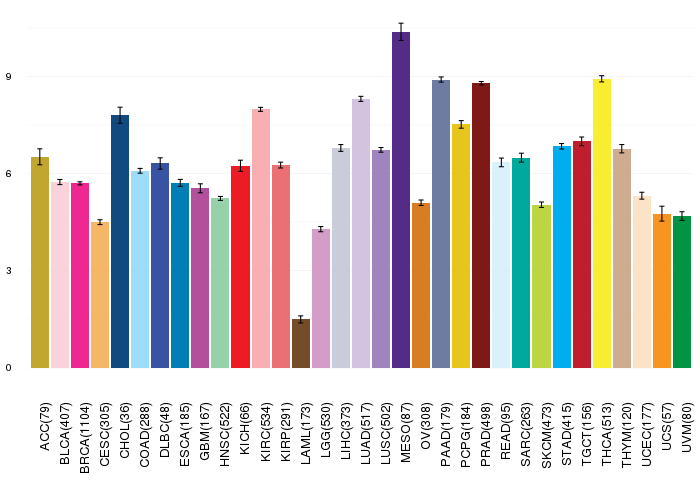
| Gene expressions across 28 cancer types (X-axis: cancer type and Y-axis: log2(norm_counts+1)) (TCGA IlluminaHiSeq_RNASeqV2, pan-cancer normalized log2(norm_counts+1) data, version 2016-08-16) |
 |
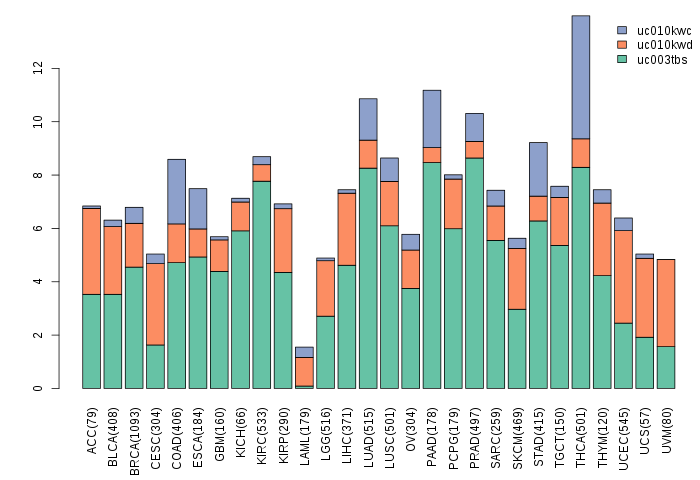
| Gene isoform expressions across 28 cancer types (X-axis: cancer type and Y-axis: log2(norm_counts+1)) (TCGA pan-cancer tcga_rsem_isoform_tpm, version 2016-09-01) |
 |
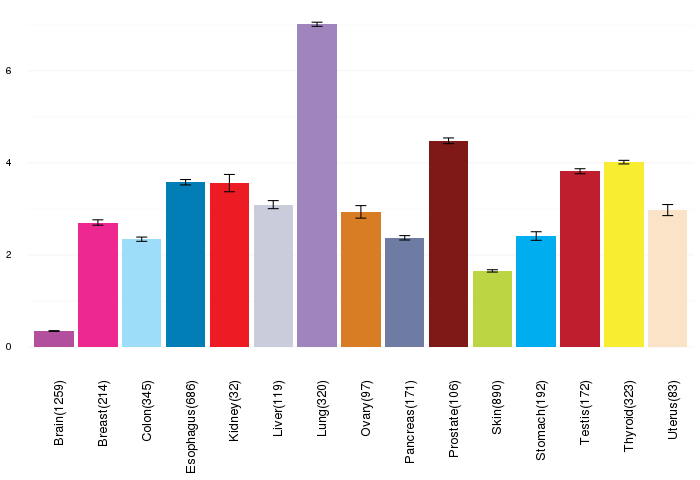
| Gene expressions across normal tissues of GTEx data (GTEx GTEx_Analysis_v6_RNA-seq_RNA-SeQCv1.1.8_gene_rpkm.gct) - Here, we shows the matched tissue types only among our 28 cancer types. |
 |
| Different expressions across 14 cancer types with more than 10 samples between matched tumors and normals (X-axis: cancer type and Y-axis: log2(norm_counts+1)) (TCGA IlluminaHiSeq_RNASeqV2, pan-cancer normalized log2(norm_counts+1) data, version 2016-08-16) |
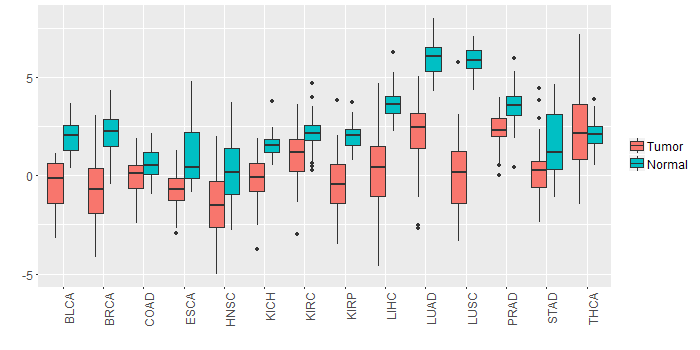 |
| - Significantly differentially expressed cancer types and information. (|Fold change|>1 and FDR<0.05) |
| Cancer type | Mean(exp) in tumor | Mean(exp) in matched normal | Log2FC | P-val. | FDR |
| KIRC | 1.119271825 | 2.148809325 | -1.0295375 | 3.15E-08 | 9.11E-08 |
| LUSC | 0.136515207 | 5.836825011 | -5.700309804 | 1.57E-29 | 6.20E-28 |
| LIHC | 0.207159325 | 3.646109325 | -3.43895 | 1.19E-15 | 4.13E-14 |
| KIRP | -0.360903175 | 2.014878075 | -2.37578125 | 4.61E-09 | 3.77E-08 |
| BRCA | -0.73436085 | 2.159627746 | -2.893988596 | 1.13E-40 | 3.59E-39 |
| HNSC | -1.414632535 | 0.355713976 | -1.770346512 | 4.06E-06 | 2.60E-05 |
| KICH | -0.207446675 | 1.565425325 | -1.772872 | 6.08E-07 | 2.37E-06 |
| BLCA | -0.443969622 | 1.928040904 | -2.372010526 | 4.60E-07 | 1.83E-05 |
| LUAD | 2.05679898 | 5.963371394 | -3.906572414 | 2.74E-28 | 1.81E-26 |
| PRAD | 2.290697787 | 3.507632402 | -1.216934615 | 8.04E-10 | 1.32E-08 |
| STAD | 0.216840575 | 1.603628075 | -1.3867875 | 0.00207 | 0.009385948 |
| Top |
| TissGene-miRNA for INMT |
| Significantly anti-correlated miRNAs of TissGene across 28 cancer types (Gene-miRNA relations from TargetScanHuman Relsease 7.1, Conserved_Site_Context_Scores.txt.zip, 06.01.2016) (TCGA IlluminaHiSeq_miRNASeq, log2(RPM+1) data, version 2016-11-21) (TCGA IlluminaHiSeq_RNASeqV2, log2(normalized_count+1) data, version 2016-08-16) (Spearman’s Rank Correlation (p-value<0.05 and coefficient<-0.25)) |
| Cancer type | miRNA id | miRNA accession | P-val. | Coeff. | # samples |
| Top |
| TissGeneMut for INMT |
| TissGeneSNV for INMT |
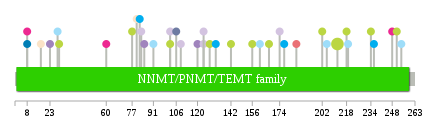
| nsSNV counts per each loci. Different colors of circles represent different cancer types. Circle size denotes number of samples. (TCGA somatic mutation (SNPs and small INDELs) data, version 2016-04-25) * Click on the image to enlarge it in a new window. |
 |
 |
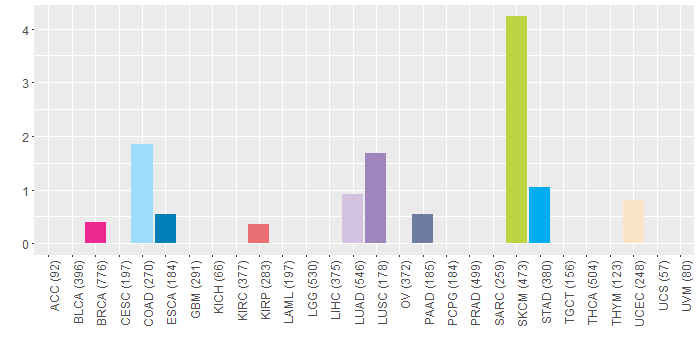
| Somatic nucleotide variants of TissGene across 28 cancer types (X-axis: cancer type and Y-axis: % of mutated samples) The numbers in parentheses are numbers of samples with mutation (nsSNVs). (TCGA somatic mutation (SNPs and small INDELs) data, version 2016-04-25) |
 |
| - nsSNVs sorted by frequency. |
| AAchange | Cancer type | # samples |
| p.S212F | SKCM | 10 |
| p.W124L | LUAD | 1 |
| p.P17S | UCEC | 1 |
| p.G8V | ESCA | 1 |
| p.P202L | SKCM | 1 |
| p.G29S | SKCM | 1 |
| p.Q234K | SKCM | 1 |
| p.I60F | BRCA | 1 |
| p.L156F | SKCM | 1 |
| p.P102L | SKCM | 1 |
| p.D85E | LUSC | 1 |
| p.E128K | SKCM | 1 |
| p.D106E | PAAD | 1 |
| p.N120K | LUSC | 1 |
| p.D80Y | UCEC | 1 |
| p.L236I | STAD | 1 |
| p.G251R | SKCM | 1 |
| p.R132Q | STAD | 1 |
| p.F254C | COAD | 1 |
| p.A114T | DLBC | 1 |
| p.S77F | SKCM | 1 |
| p.D28N | COAD | 1 |
| p.P102Q | LUAD | 1 |
| p.T82A | STAD | 1 |
| p.W124C | LUAD | 1 |
| p.D142N | SKCM | 1 |
| p.G8D | BRCA | 1 |
| p.A248D | BRCA | 1 |
| p.R91W | COAD | 1 |
| p.D174H | LUAD | 1 |
| p.M205V | COAD | 1 |
| p.T23A | LUSC | 1 |
| p.L161F | COAD | 1 |
| p.E167K | SKCM | 1 |
| p.R177C | STAD | 1 |
| p.S185A | KIRP | 1 |
| p.E219G | COAD | 1 |
| p.L83V | LUAD | 1 |
| p.P109T | LUAD | 1 |
| p.K218* | SKCM | 1 |
| Top |
| TissGeneCNV for INMT |
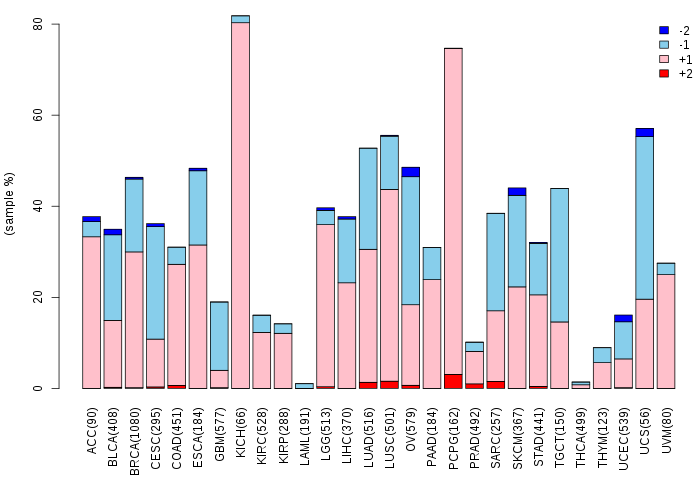
| Copy number variations of TissGene across 28 cancer types (X-axis: cancer type and Y-axis: % of CNV samples) (TCGA Gistic2_CopyNumber_Gistic2_all_data_by_genes, Gistic2 copy number data, version 2016-08-16) |
 |
| Top |
| TissGeneFusions for INMT |
| Fusion genes including TissGene (ChimerDB 3.0, 2016-12-01 and TCGA fusion Portal 2015-12-01) |
| Database | Src | Cancer type | Sample | Fusion gene | ORF | 5'-gene BP | 3'-gene BP |
| Top |
| TissGeneNet for INMT |
| Co-expressed gene networks based on protein-protein interaction data (CePIN) (TCGA IlluminaHiSeq_RNASeqV2, pan-cancer normalized log2(norm_counts+1) data, version 2016-08-16) (PINA2 ppi data) |
| Top |
| TissGeneProg for INMT |
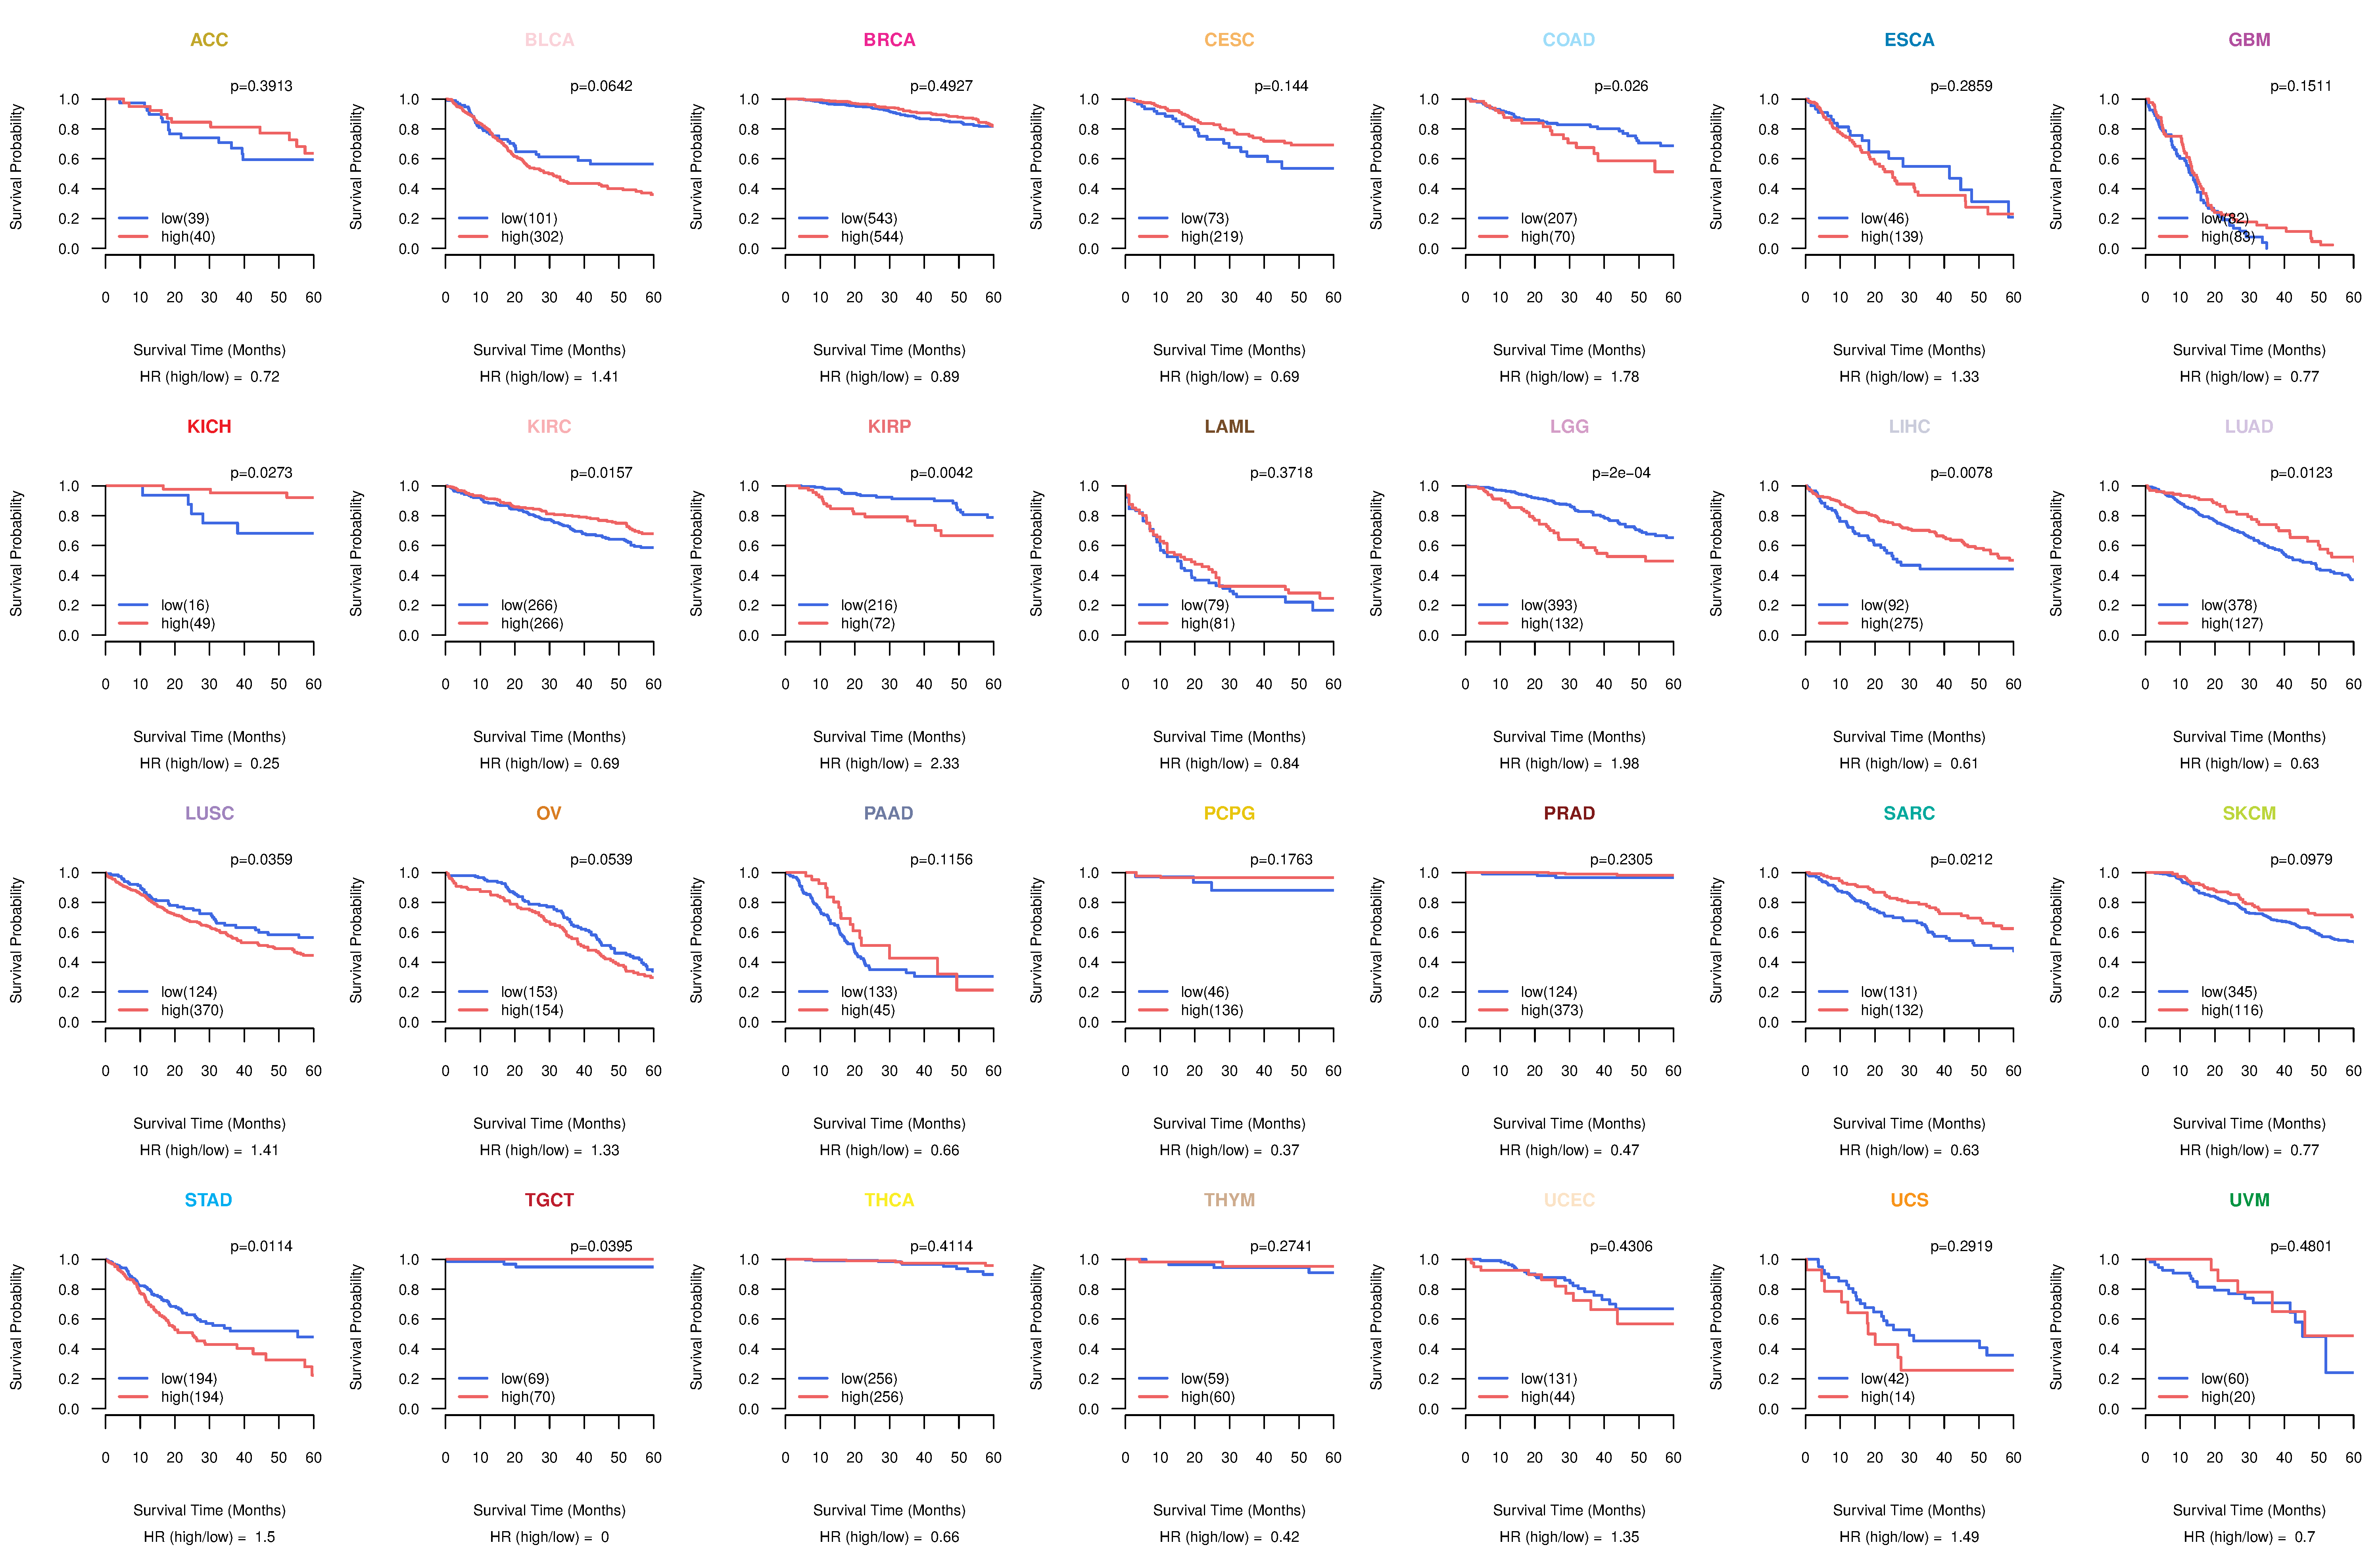
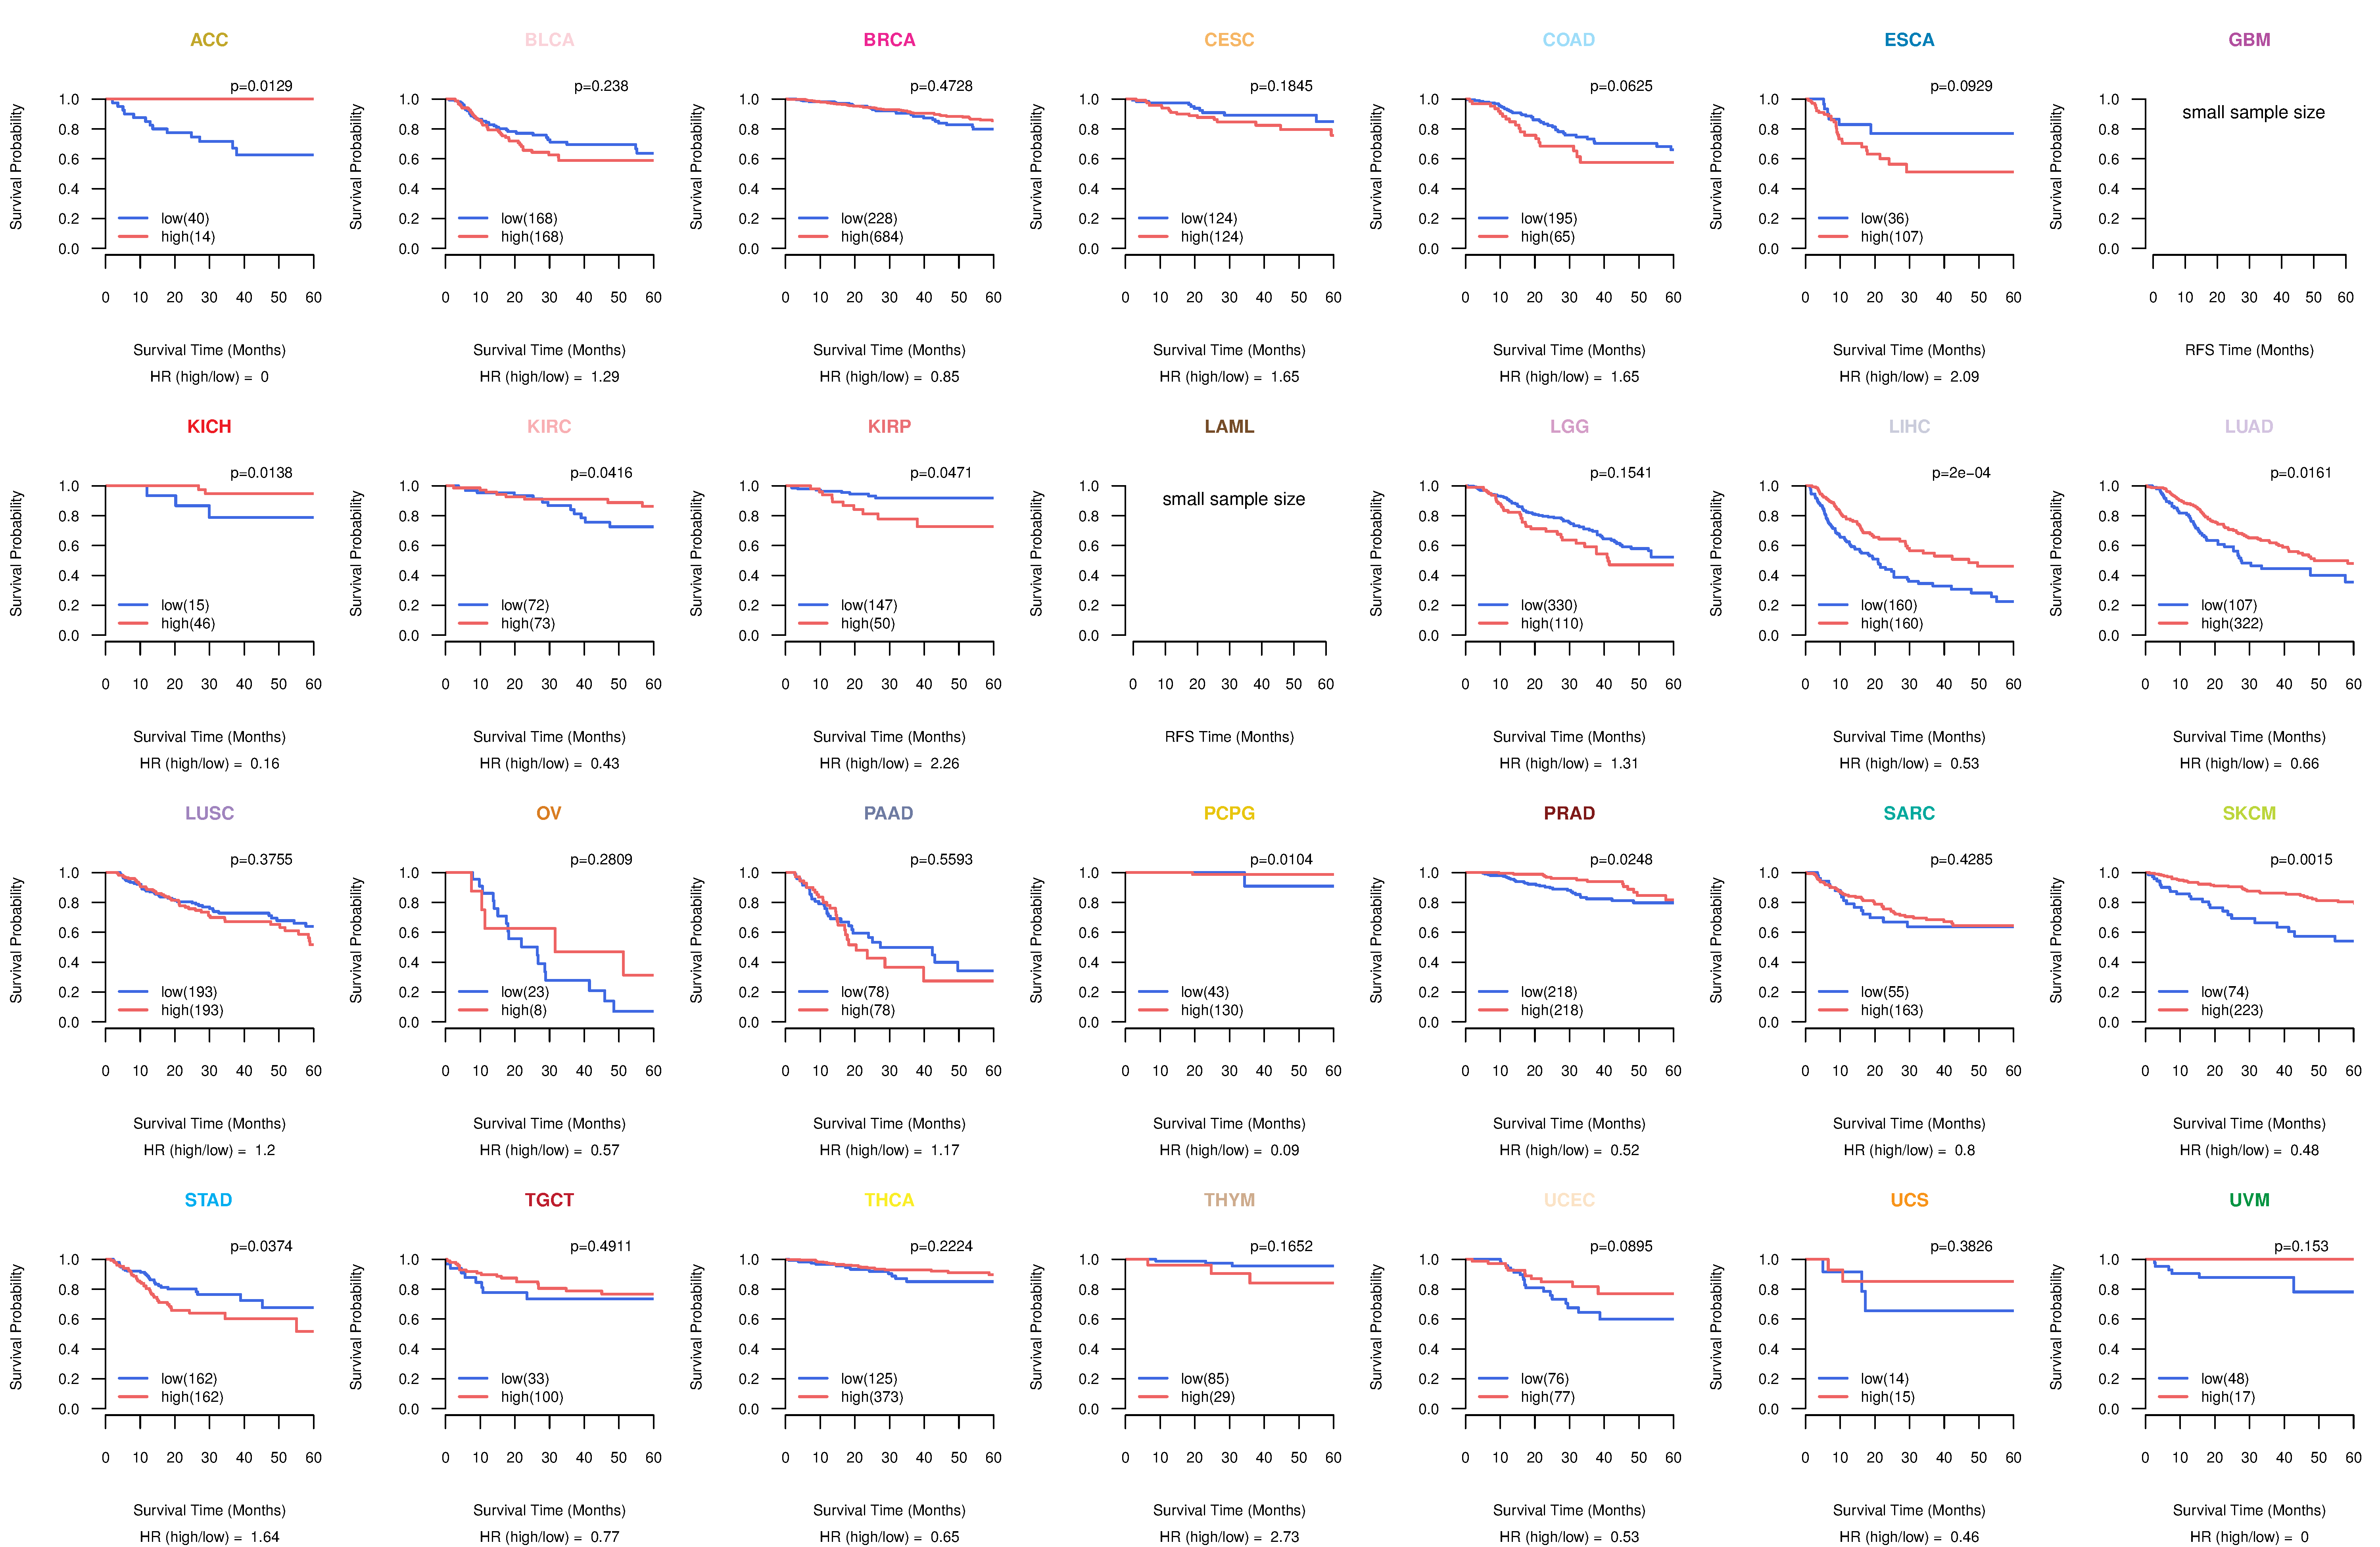
| Kaplan-Meier plots with logrank tests of overall survival (OS) using 28 cancer types (TCGA IlluminaHiSeq_RNASeqV2, pan-cancer normalized log2(norm_counts+1) data, version 2016-08-16) (TCGA clinicalMatrix, phenotype data, version 2016-04-27) * Click on the image to enlarge it in a new window. |
 |
| Kaplan-Meier plots with logrank test of relapse free survival (RFS) using 28 cancer types (TCGA IlluminaHiSeq_RNASeqV2, pan-cancer normalized log2(norm_counts+1) data, version 2016-08-16) (TCGA clinicalMatrix, phenotype data, version 2016-04-27) * Click on the image enlarge it in a new window. |
 |
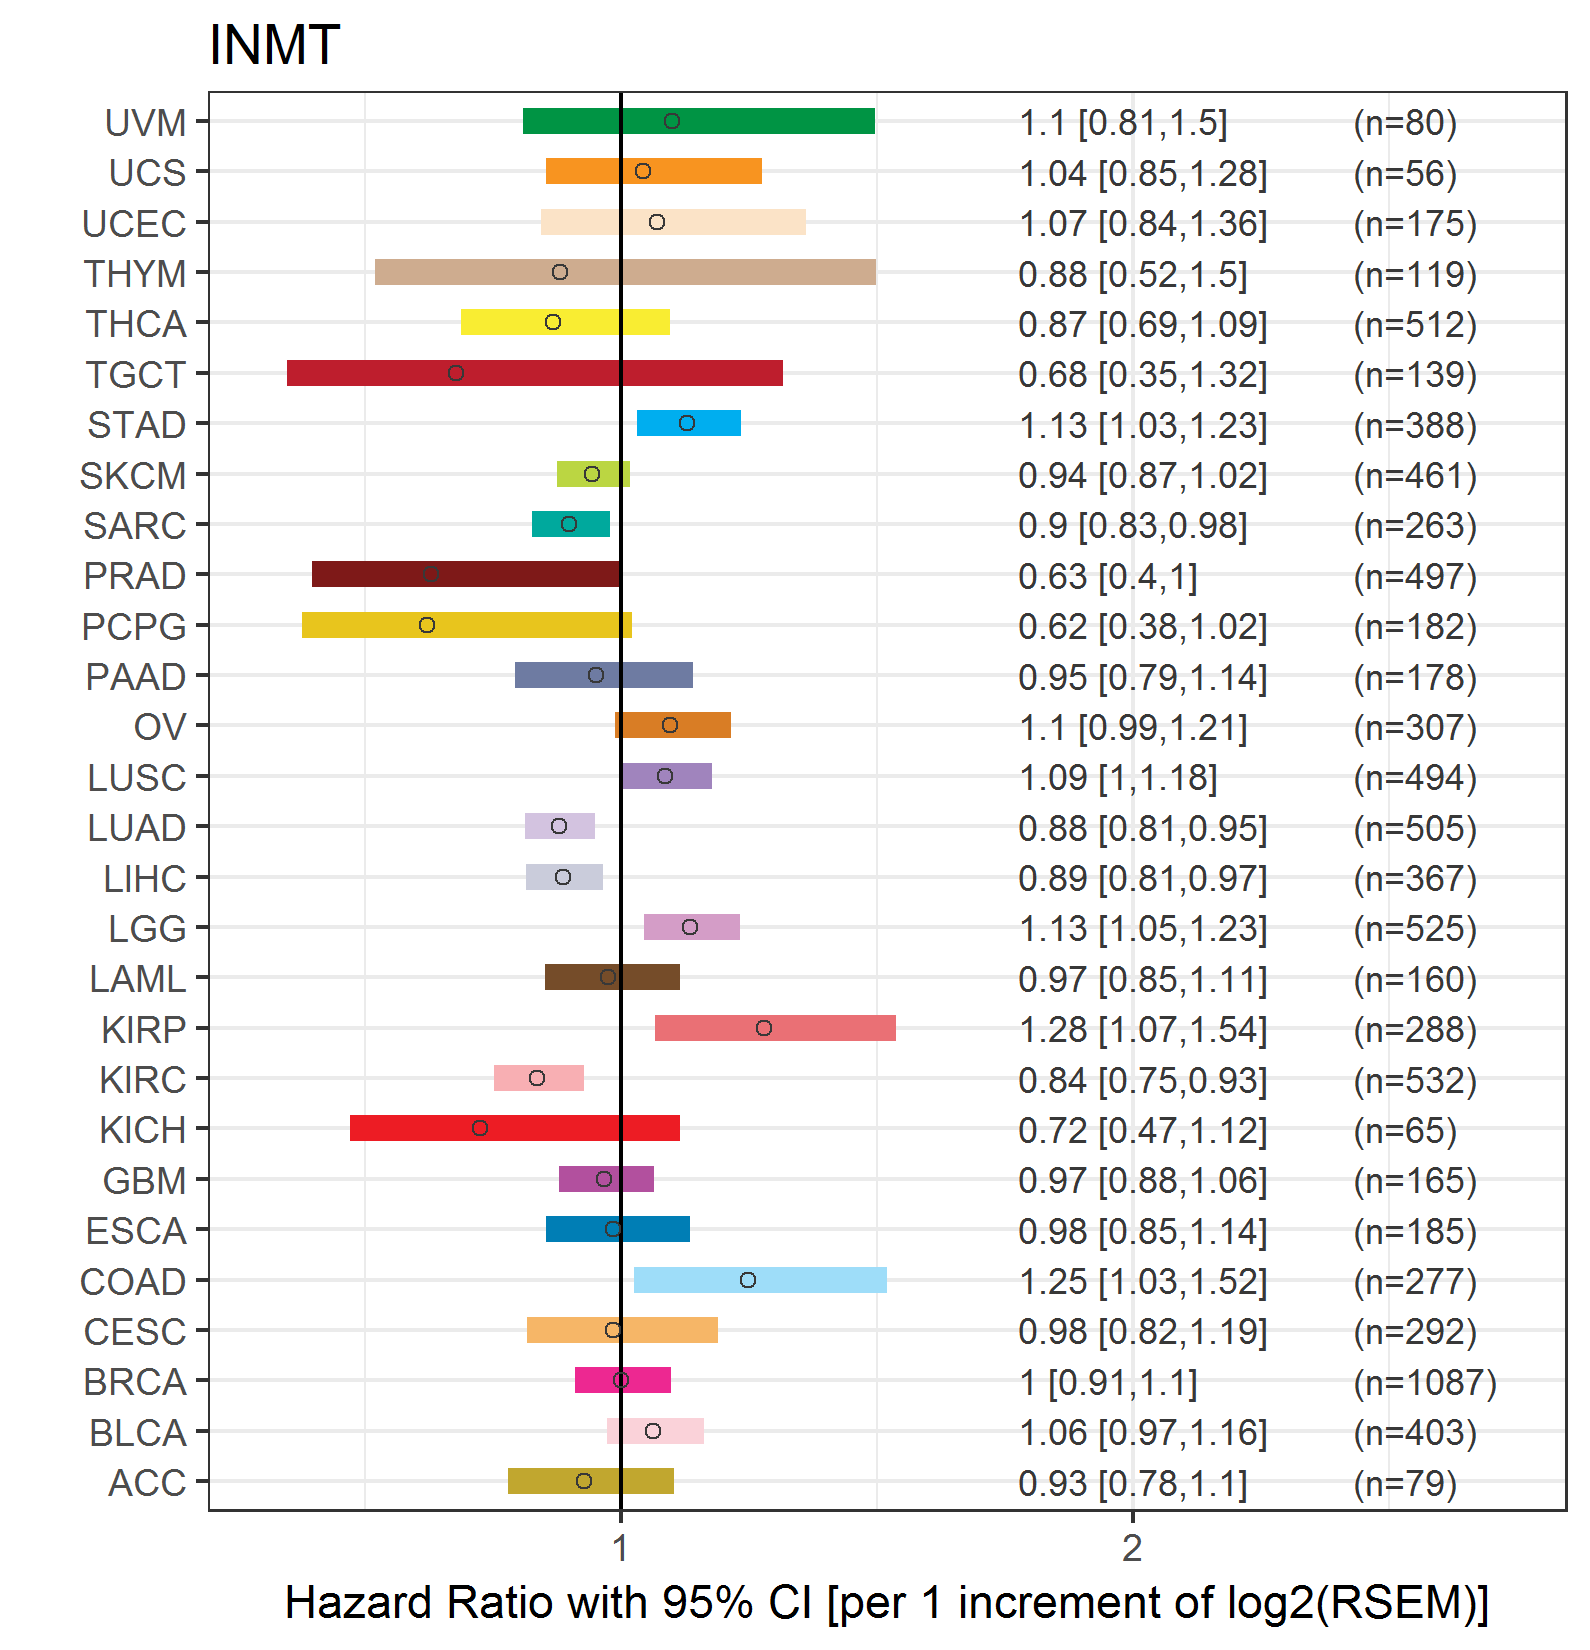
| Forest plot of Cox proportional hazard ratio (HR) and 95% CI of overall survival (OS) using 28 cancer types (TCGA IlluminaHiSeq_RNASeqV2, pan-cancer normalized log2(norm_counts+1) data, version 2016-08-16) (TCGA clinicalMatrix, phenotype data, version 2016-04-27) * Click on the image enlarge it in a new window. |
 |
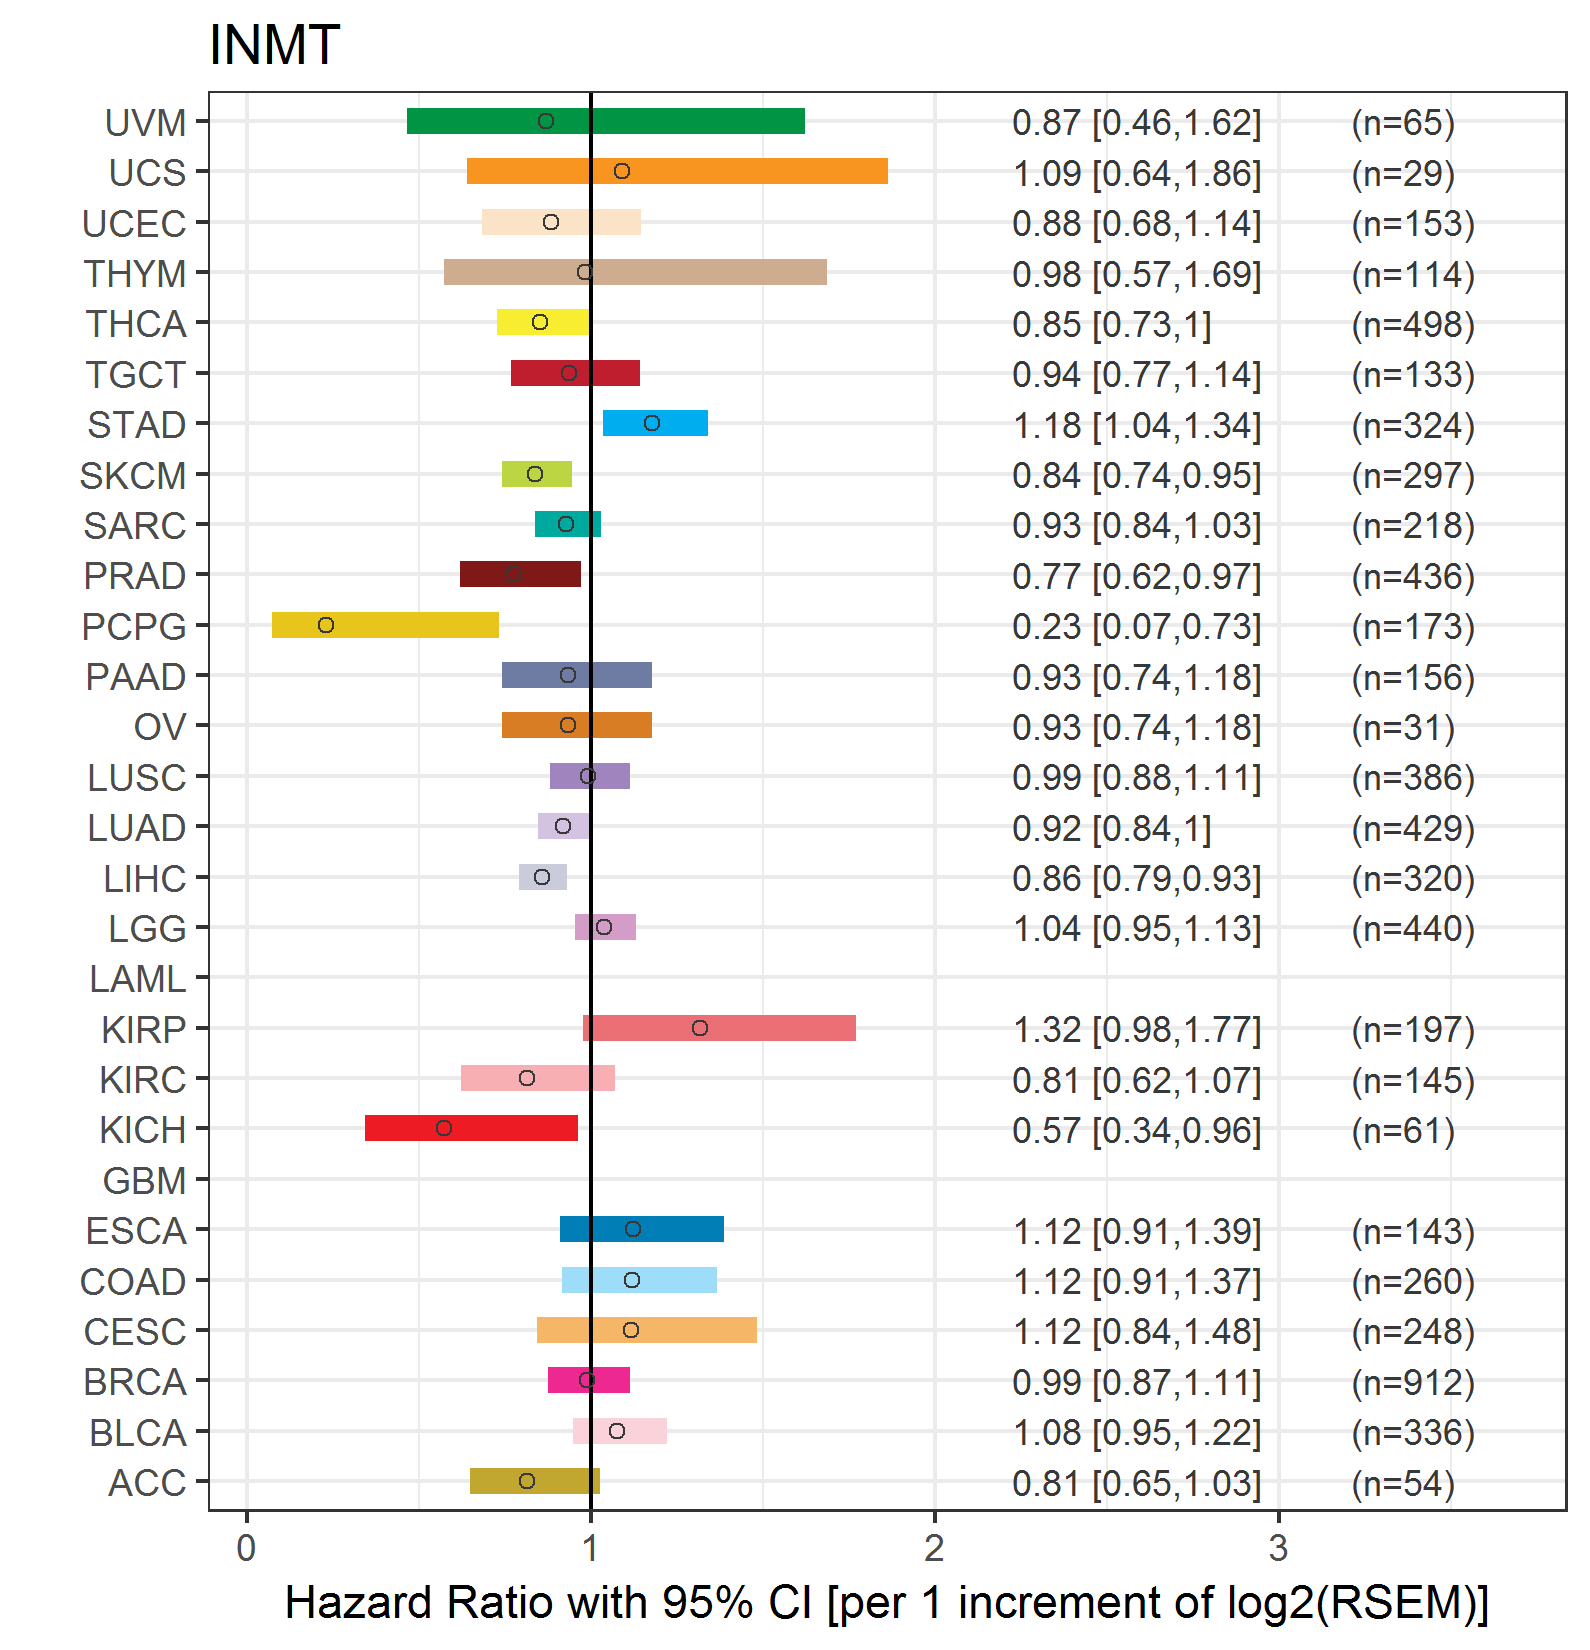
| Forest plot of Cox proportional hazard ratio (HR) and 95% CI of relapse free survival (RFS) using 28 cancer types (TCGA IlluminaHiSeq_RNASeqV2, pan-cancer normalized log2(norm_counts+1) data, version 2016-08-16) (TCGA clinicalMatrix, phenotype data, version 2016-04-27) * Click on the image enlarge it in a new window. |
 |
| Top |
| TissGeneClin for INMT |
| TissGeneDrug for INMT |
| Drug information targeting TissGene (DrugBank Version 5.0.6, 2017-04-01) |
| DrugBank ID | Drug name | Drug activity | Drug type | Drug status |
| Top |
| TissGeneDisease for INMT |
| Disease information associated with TissGene (DisGeNet, 2016-06-01) |
| Disease ID | Disease name | # pubmeds | Source |
|
Copyright 2016-Present - The University of Texas Health Science Center at Houston (UTHealth) Web File Viewing | How to Report, Fraud, Waste and Abuse | State of Texas | Statewide Search | Texas Homeland Security | Site Policies |