 |
| |
| |
| |
| |
| |
| |
|

| TissGeneSummary for TUBA3E |
 Gene summary Gene summary |
| Basic gene information | Gene symbol | TUBA3E |
| Gene name | tubulin, alpha 3e | |
| Synonyms | - | |
| Cytomap | UCSC genome browser: 2q21.1 | |
| Type of gene | protein-coding | |
| RefGenes | NM_207312.2, | |
| Description | alpha-tubulin 3Etubulin alpha-3E chain | |
| Modification date | 20141207 | |
| dbXrefs | HGNC : HGNC | |
| Ensembl : ENSG00000152086 | ||
| HPRD : 17288 | ||
| Vega : OTTHUMG00000131626 | ||
| Protein | UniProt: go to UniProt's Cross Reference DB Table | |
| Expression | CleanEX: HS_TUBA3E | |
| BioGPS: 112714 | ||
| Pathway | NCI Pathway Interaction Database: TUBA3E | |
| KEGG: TUBA3E | ||
| REACTOME: TUBA3E | ||
| Pathway Commons: TUBA3E | ||
| Context | iHOP: TUBA3E | |
| ligand binding site mutation search in PubMed: TUBA3E | ||
| UCL Cancer Institute: TUBA3E | ||
| Assigned class in TissGDB* | B | |
| Included tissue-specific gene expression resources | HPA,TiGER,GTEx | |
| Specific-tissues in normal samples (assigned by TissGDB using HPA, TiGER, and GTEx) | Testis | |
| Cancer types related to the specific-tissues in cancer samples (assigned by TissGDB using TCGA) | TGCT | |
| Reference showing the relevant tissue of TUBA3E | ||
| Description by TissGene annotations | ||
| * Class A consists of genes with literature evidence and is part of the cTissGenes. Class B consists of only cTissGenes without additional evidence. The remaining genes belong to Class C. |
| Gene ontology having evidence of Inferred from Direct Assay (IDA) from Entrez |
| GO ID | GO term | PubMed ID |
| Top |
| TissGeneExp for TUBA3E |
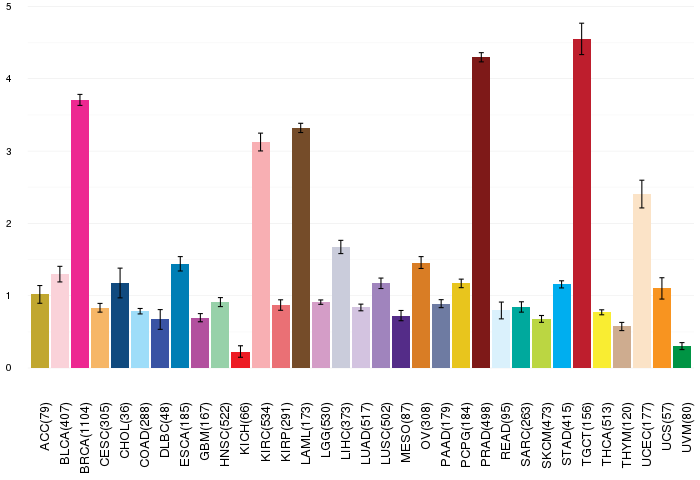
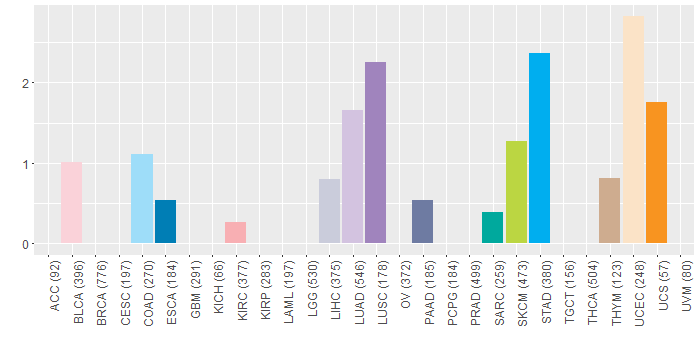
| Gene expressions across 28 cancer types (X-axis: cancer type and Y-axis: log2(norm_counts+1)) (TCGA IlluminaHiSeq_RNASeqV2, pan-cancer normalized log2(norm_counts+1) data, version 2016-08-16) |
 |
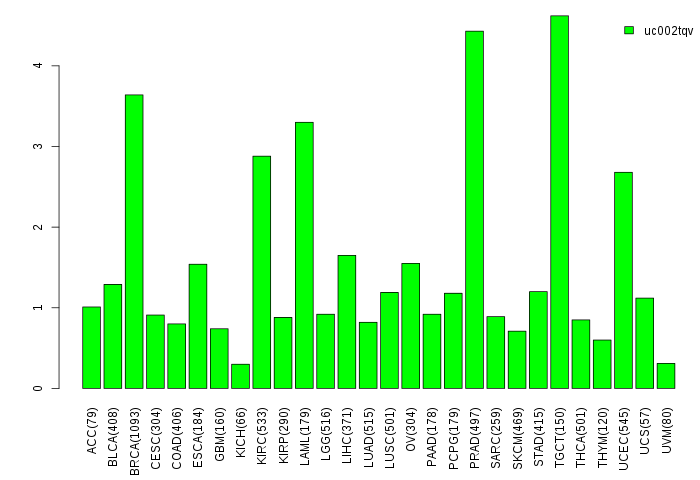
| Gene isoform expressions across 28 cancer types (X-axis: cancer type and Y-axis: log2(norm_counts+1)) (TCGA pan-cancer tcga_rsem_isoform_tpm, version 2016-09-01) |
 |
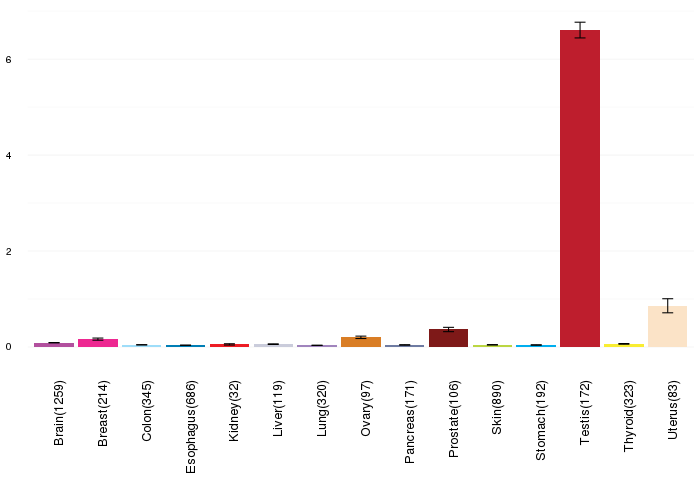
| Gene expressions across normal tissues of GTEx data (GTEx GTEx_Analysis_v6_RNA-seq_RNA-SeQCv1.1.8_gene_rpkm.gct) - Here, we shows the matched tissue types only among our 28 cancer types. |
 |
| Different expressions across 14 cancer types with more than 10 samples between matched tumors and normals (X-axis: cancer type and Y-axis: log2(norm_counts+1)) (TCGA IlluminaHiSeq_RNASeqV2, pan-cancer normalized log2(norm_counts+1) data, version 2016-08-16) |
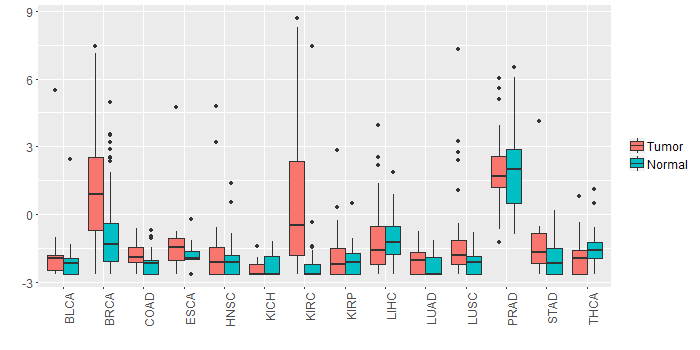 |
| - Significantly differentially expressed cancer types and information. (|Fold change|>1 and FDR<0.05) |
| Cancer type | Mean(exp) in tumor | Mean(exp) in matched normal | Log2FC | P-val. | FDR |
| KIRC | 0.702450923 | -2.228997688 | 2.931448611 | 1.17E-10 | 4.13E-10 |
| BRCA | 1.062386084 | -0.966246372 | 2.028632456 | 7.46E-13 | 3.39E-12 |
| Top |
| TissGene-miRNA for TUBA3E |
| Significantly anti-correlated miRNAs of TissGene across 28 cancer types (Gene-miRNA relations from TargetScanHuman Relsease 7.1, Conserved_Site_Context_Scores.txt.zip, 06.01.2016) (TCGA IlluminaHiSeq_miRNASeq, log2(RPM+1) data, version 2016-11-21) (TCGA IlluminaHiSeq_RNASeqV2, log2(normalized_count+1) data, version 2016-08-16) (Spearman’s Rank Correlation (p-value<0.05 and coefficient<-0.25)) |
| Cancer type | miRNA id | miRNA accession | P-val. | Coeff. | # samples |
| Top |
| TissGeneMut for TUBA3E |
| TissGeneSNV for TUBA3E |
| nsSNV counts per each loci. Different colors of circles represent different cancer types. Circle size denotes number of samples. (TCGA somatic mutation (SNPs and small INDELs) data, version 2016-04-25) * Click on the image to enlarge it in a new window. |
 |
 |
| Somatic nucleotide variants of TissGene across 28 cancer types (X-axis: cancer type and Y-axis: % of mutated samples) The numbers in parentheses are numbers of samples with mutation (nsSNVs). (TCGA somatic mutation (SNPs and small INDELs) data, version 2016-04-25) |
 |
| - nsSNVs sorted by frequency. |
| AAchange | Cancer type | # samples |
| p.R339H | STAD | 2 |
| p.S277X | LIHC | 1 |
| p.T109N | LUAD | 1 |
| p.G142R | SKCM | 1 |
| p.R373Q | PAAD | 1 |
| p.R243Q | READ | 1 |
| p.N216S | SKCM | 1 |
| p.D47N | UCEC | 1 |
| p.A333T | STAD | 1 |
| p.F267S | STAD | 1 |
| p.E22K | SKCM | 1 |
| p.T82S | LUAD | 1 |
| p.E411K | LUSC | 1 |
| p.R123H | UCEC | 1 |
| p.E196K | SARC | 1 |
| p.W346C | LUAD | 1 |
| p.S187F | LUSC | 1 |
| p.E297K | SKCM | 1 |
| p.R229H | PAAD | 1 |
| p.E448X | THYM | 1 |
| p.R243Q | UCEC | 1 |
| p.E297K | UCS | 1 |
| p.P307H | STAD | 1 |
| p.E448K | UCEC | 1 |
| p.T239R | LUAD | 1 |
| p.T361P | LUAD | 1 |
| p.A383T | HNSC | 1 |
| p.E207Q | BLCA | 1 |
| p.T223K | LUAD | 1 |
| p.R422C | COAD | 1 |
| p.A385V | STAD | 1 |
| p.E220* | UCEC | 1 |
| p.D205N | BLCA | 1 |
| p.G95R | BLCA | 1 |
| p.L217M | LUAD | 1 |
| p.F169I | STAD | 1 |
| p.E441K | LUSC | 1 |
| p.R390H | COAD | 1 |
| p.R243X | STAD | 1 |
| p.I110M | BLCA | 1 |
| p.A170S | LUAD | 1 |
| p.I335M | LUAD | 1 |
| p.A247T | LUSC | 1 |
| p.V323A | LIHC | 1 |
| p.R84K | SKCM | 1 |
| p.E417* | UCEC | 1 |
| p.A273T | HNSC | 1 |
| p.G144S | LUSC | 1 |
| p.E297K | UCEC | 1 |
| p.G106D | UCEC | 1 |
| p.R243L | ESCA | 1 |
| p.L425Q | KIRC | 1 |
| p.G143S | UCEC | 1 |
| p.R243* | STAD | 1 |
| p.R229H | STAD | 1 |
| p.W346L | UCEC | 1 |
| p.V440M | COAD | 1 |
| p.A333T | SKCM | 1 |
| p.V182M | HNSC | 1 |
| p.L157I | LIHC | 1 |
| Top |
| TissGeneCNV for TUBA3E |
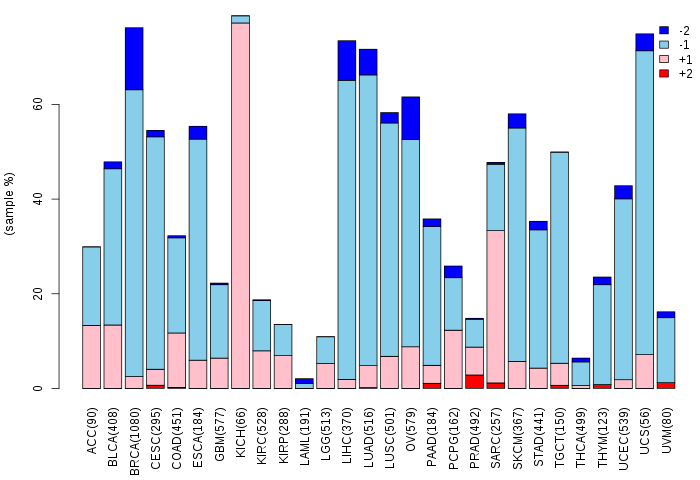
| Copy number variations of TissGene across 28 cancer types (X-axis: cancer type and Y-axis: % of CNV samples) (TCGA Gistic2_CopyNumber_Gistic2_all_data_by_genes, Gistic2 copy number data, version 2016-08-16) |
 |
| Top |
| TissGeneFusions for TUBA3E |
| Fusion genes including TissGene (ChimerDB 3.0, 2016-12-01 and TCGA fusion Portal 2015-12-01) |
| Database | Src | Cancer type | Sample | Fusion gene | ORF | 5'-gene BP | 3'-gene BP |
| Top |
| TissGeneNet for TUBA3E |
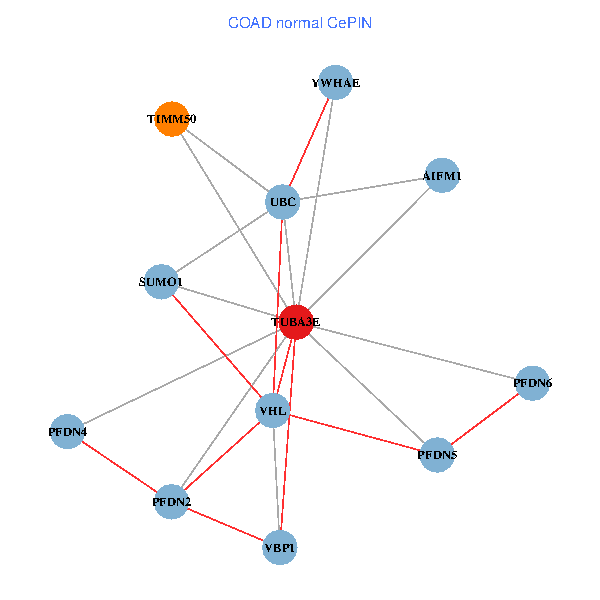
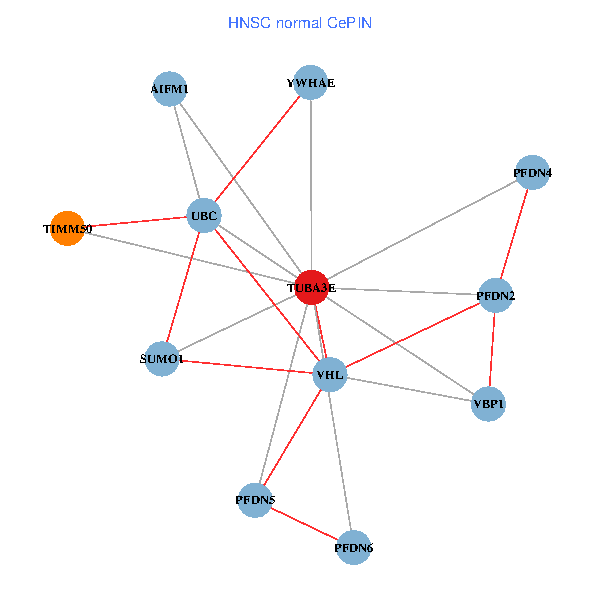
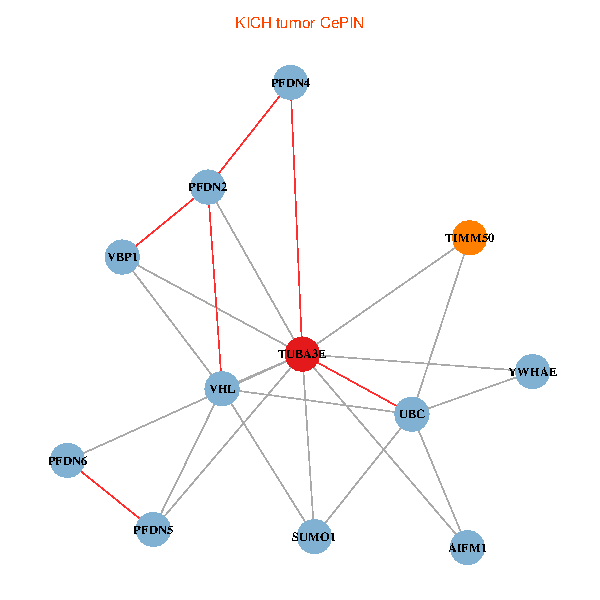
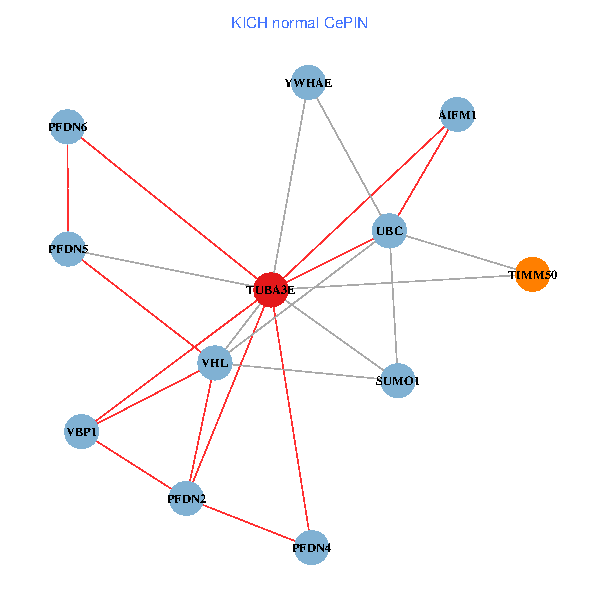
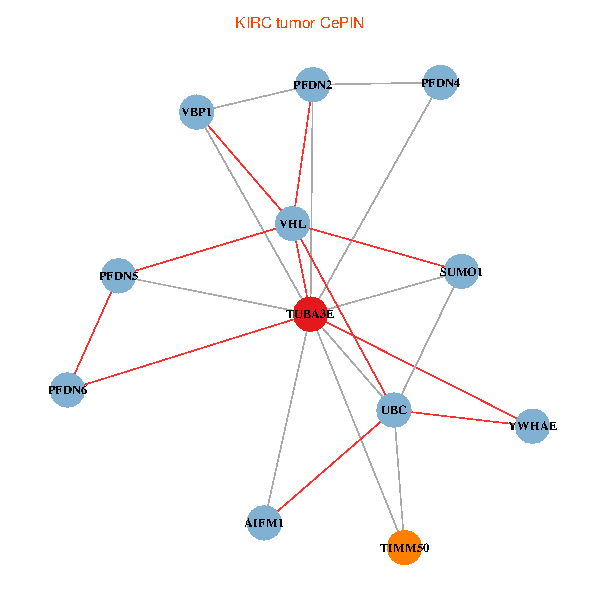
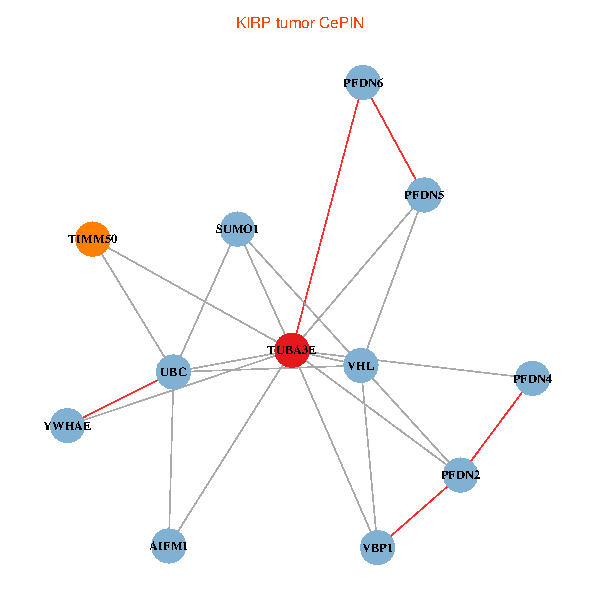
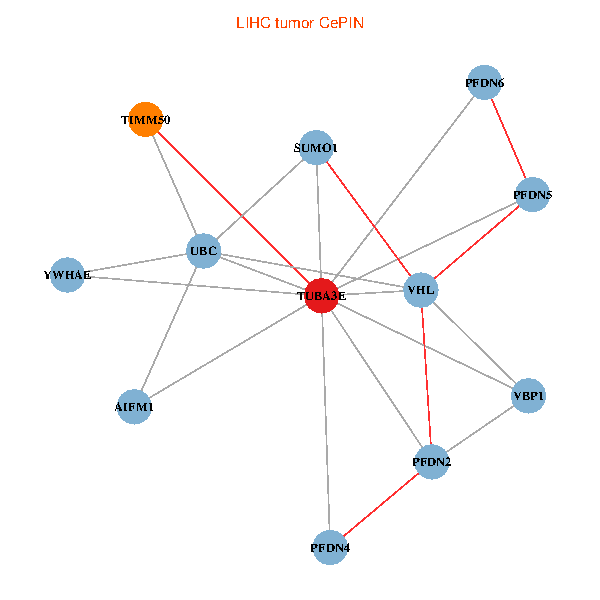
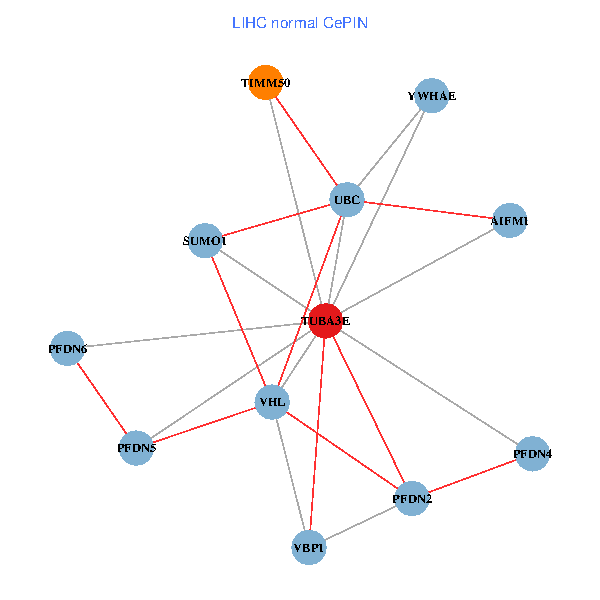
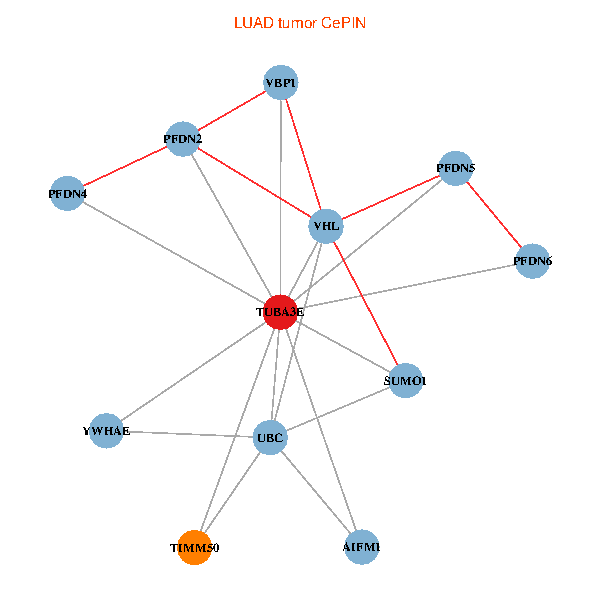
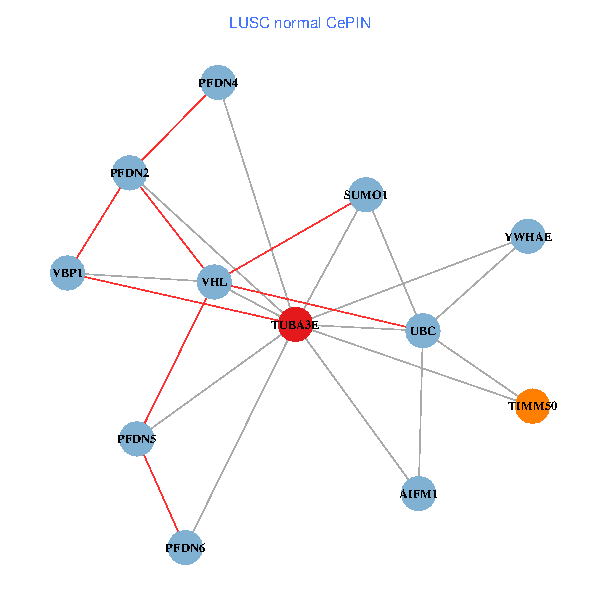
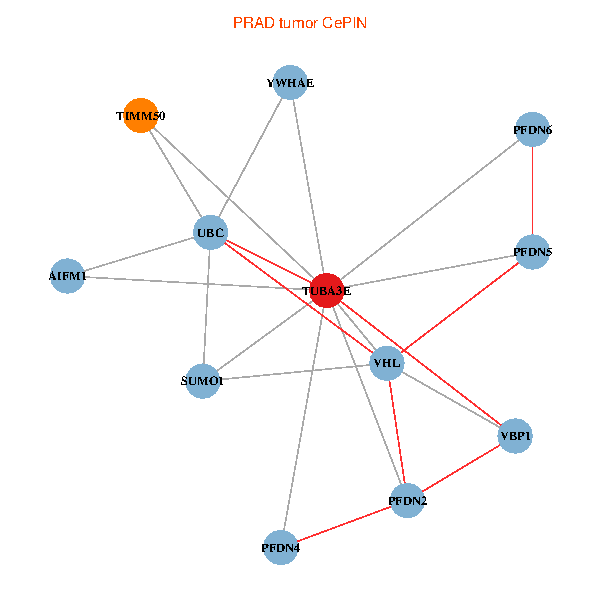
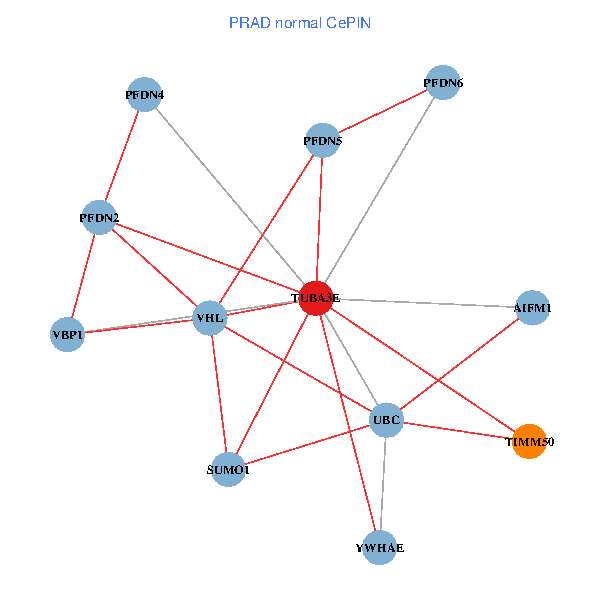
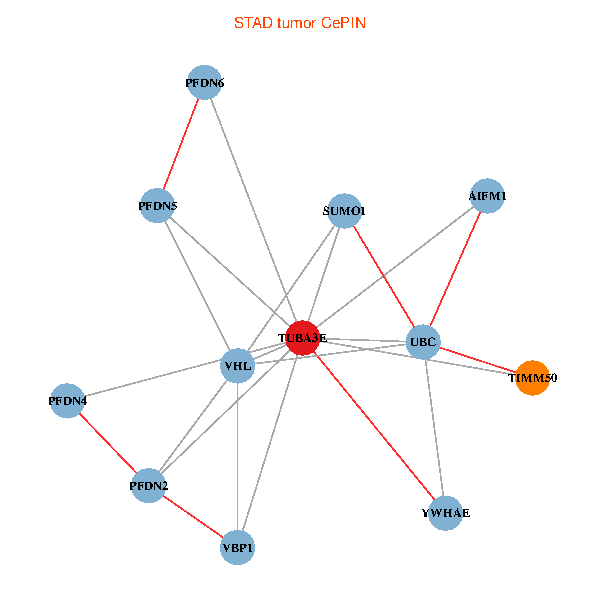
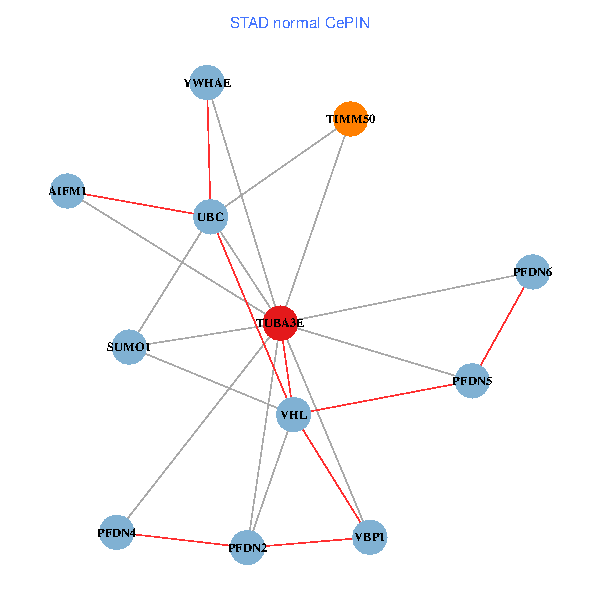
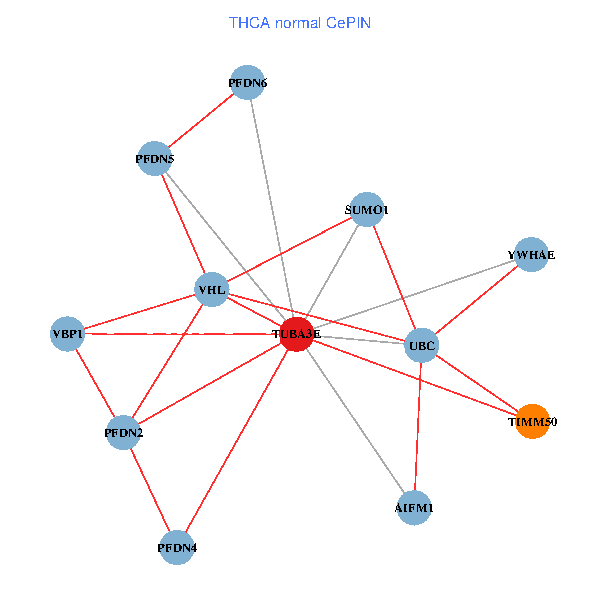
| Co-expressed gene networks based on protein-protein interaction data (CePIN) (TCGA IlluminaHiSeq_RNASeqV2, pan-cancer normalized log2(norm_counts+1) data, version 2016-08-16) (PINA2 ppi data) |
| BRCA (tumor) | BRCA (normal) |
| TUBA3E, UBC, VHL, SUMO1, TIMM50, YWHAE, PFDN4, AIFM1, PFDN2, PFDN5, VBP1, PFDN6 (tumor) | TUBA3E, UBC, VHL, SUMO1, TIMM50, YWHAE, PFDN4, AIFM1, PFDN2, PFDN5, VBP1, PFDN6 (normal) |
 |  |
| COAD (tumor) | COAD (normal) |
| TUBA3E, UBC, VHL, SUMO1, TIMM50, YWHAE, PFDN4, AIFM1, PFDN2, PFDN5, VBP1, PFDN6 (tumor) | TUBA3E, UBC, VHL, SUMO1, TIMM50, YWHAE, PFDN4, AIFM1, PFDN2, PFDN5, VBP1, PFDN6 (normal) |
 |  |
| HNSC (tumor) | HNSC (normal) |
| TUBA3E, UBC, VHL, SUMO1, TIMM50, YWHAE, PFDN4, AIFM1, PFDN2, PFDN5, VBP1, PFDN6 (tumor) | TUBA3E, UBC, VHL, SUMO1, TIMM50, YWHAE, PFDN4, AIFM1, PFDN2, PFDN5, VBP1, PFDN6 (normal) |
 |  |
| KICH (tumor) | KICH (normal) |
| TUBA3E, UBC, VHL, SUMO1, TIMM50, YWHAE, PFDN4, AIFM1, PFDN2, PFDN5, VBP1, PFDN6 (tumor) | TUBA3E, UBC, VHL, SUMO1, TIMM50, YWHAE, PFDN4, AIFM1, PFDN2, PFDN5, VBP1, PFDN6 (normal) |
 |  |
| KIRC (tumor) | KIRC (normal) |
| TUBA3E, UBC, VHL, SUMO1, TIMM50, YWHAE, PFDN4, AIFM1, PFDN2, PFDN5, VBP1, PFDN6 (tumor) | TUBA3E, UBC, VHL, SUMO1, TIMM50, YWHAE, PFDN4, AIFM1, PFDN2, PFDN5, VBP1, PFDN6 (normal) |
 |  |
| KIRP (tumor) | KIRP (normal) |
| TUBA3E, UBC, VHL, SUMO1, TIMM50, YWHAE, PFDN4, AIFM1, PFDN2, PFDN5, VBP1, PFDN6 (tumor) | TUBA3E, UBC, VHL, SUMO1, TIMM50, YWHAE, PFDN4, AIFM1, PFDN2, PFDN5, VBP1, PFDN6 (normal) |
 |  |
| LIHC (tumor) | LIHC (normal) |
| TUBA3E, UBC, VHL, SUMO1, TIMM50, YWHAE, PFDN4, AIFM1, PFDN2, PFDN5, VBP1, PFDN6 (tumor) | TUBA3E, UBC, VHL, SUMO1, TIMM50, YWHAE, PFDN4, AIFM1, PFDN2, PFDN5, VBP1, PFDN6 (normal) |
 |  |
| LUAD (tumor) | LUAD (normal) |
| TUBA3E, UBC, VHL, SUMO1, TIMM50, YWHAE, PFDN4, AIFM1, PFDN2, PFDN5, VBP1, PFDN6 (tumor) | TUBA3E, UBC, VHL, SUMO1, TIMM50, YWHAE, PFDN4, AIFM1, PFDN2, PFDN5, VBP1, PFDN6 (normal) |
 |  |
| LUSC (tumor) | LUSC (normal) |
| TUBA3E, UBC, VHL, SUMO1, TIMM50, YWHAE, PFDN4, AIFM1, PFDN2, PFDN5, VBP1, PFDN6 (tumor) | TUBA3E, UBC, VHL, SUMO1, TIMM50, YWHAE, PFDN4, AIFM1, PFDN2, PFDN5, VBP1, PFDN6 (normal) |
 |  |
| PRAD (tumor) | PRAD (normal) |
| TUBA3E, UBC, VHL, SUMO1, TIMM50, YWHAE, PFDN4, AIFM1, PFDN2, PFDN5, VBP1, PFDN6 (tumor) | TUBA3E, UBC, VHL, SUMO1, TIMM50, YWHAE, PFDN4, AIFM1, PFDN2, PFDN5, VBP1, PFDN6 (normal) |
 |  |
| STAD (tumor) | STAD (normal) |
| TUBA3E, UBC, VHL, SUMO1, TIMM50, YWHAE, PFDN4, AIFM1, PFDN2, PFDN5, VBP1, PFDN6 (tumor) | TUBA3E, UBC, VHL, SUMO1, TIMM50, YWHAE, PFDN4, AIFM1, PFDN2, PFDN5, VBP1, PFDN6 (normal) |
 |  |
| THCA (tumor) | THCA (normal) |
| TUBA3E, UBC, VHL, SUMO1, TIMM50, YWHAE, PFDN4, AIFM1, PFDN2, PFDN5, VBP1, PFDN6 (tumor) | TUBA3E, UBC, VHL, SUMO1, TIMM50, YWHAE, PFDN4, AIFM1, PFDN2, PFDN5, VBP1, PFDN6 (normal) |
 |  |
| Top |
| TissGeneProg for TUBA3E |
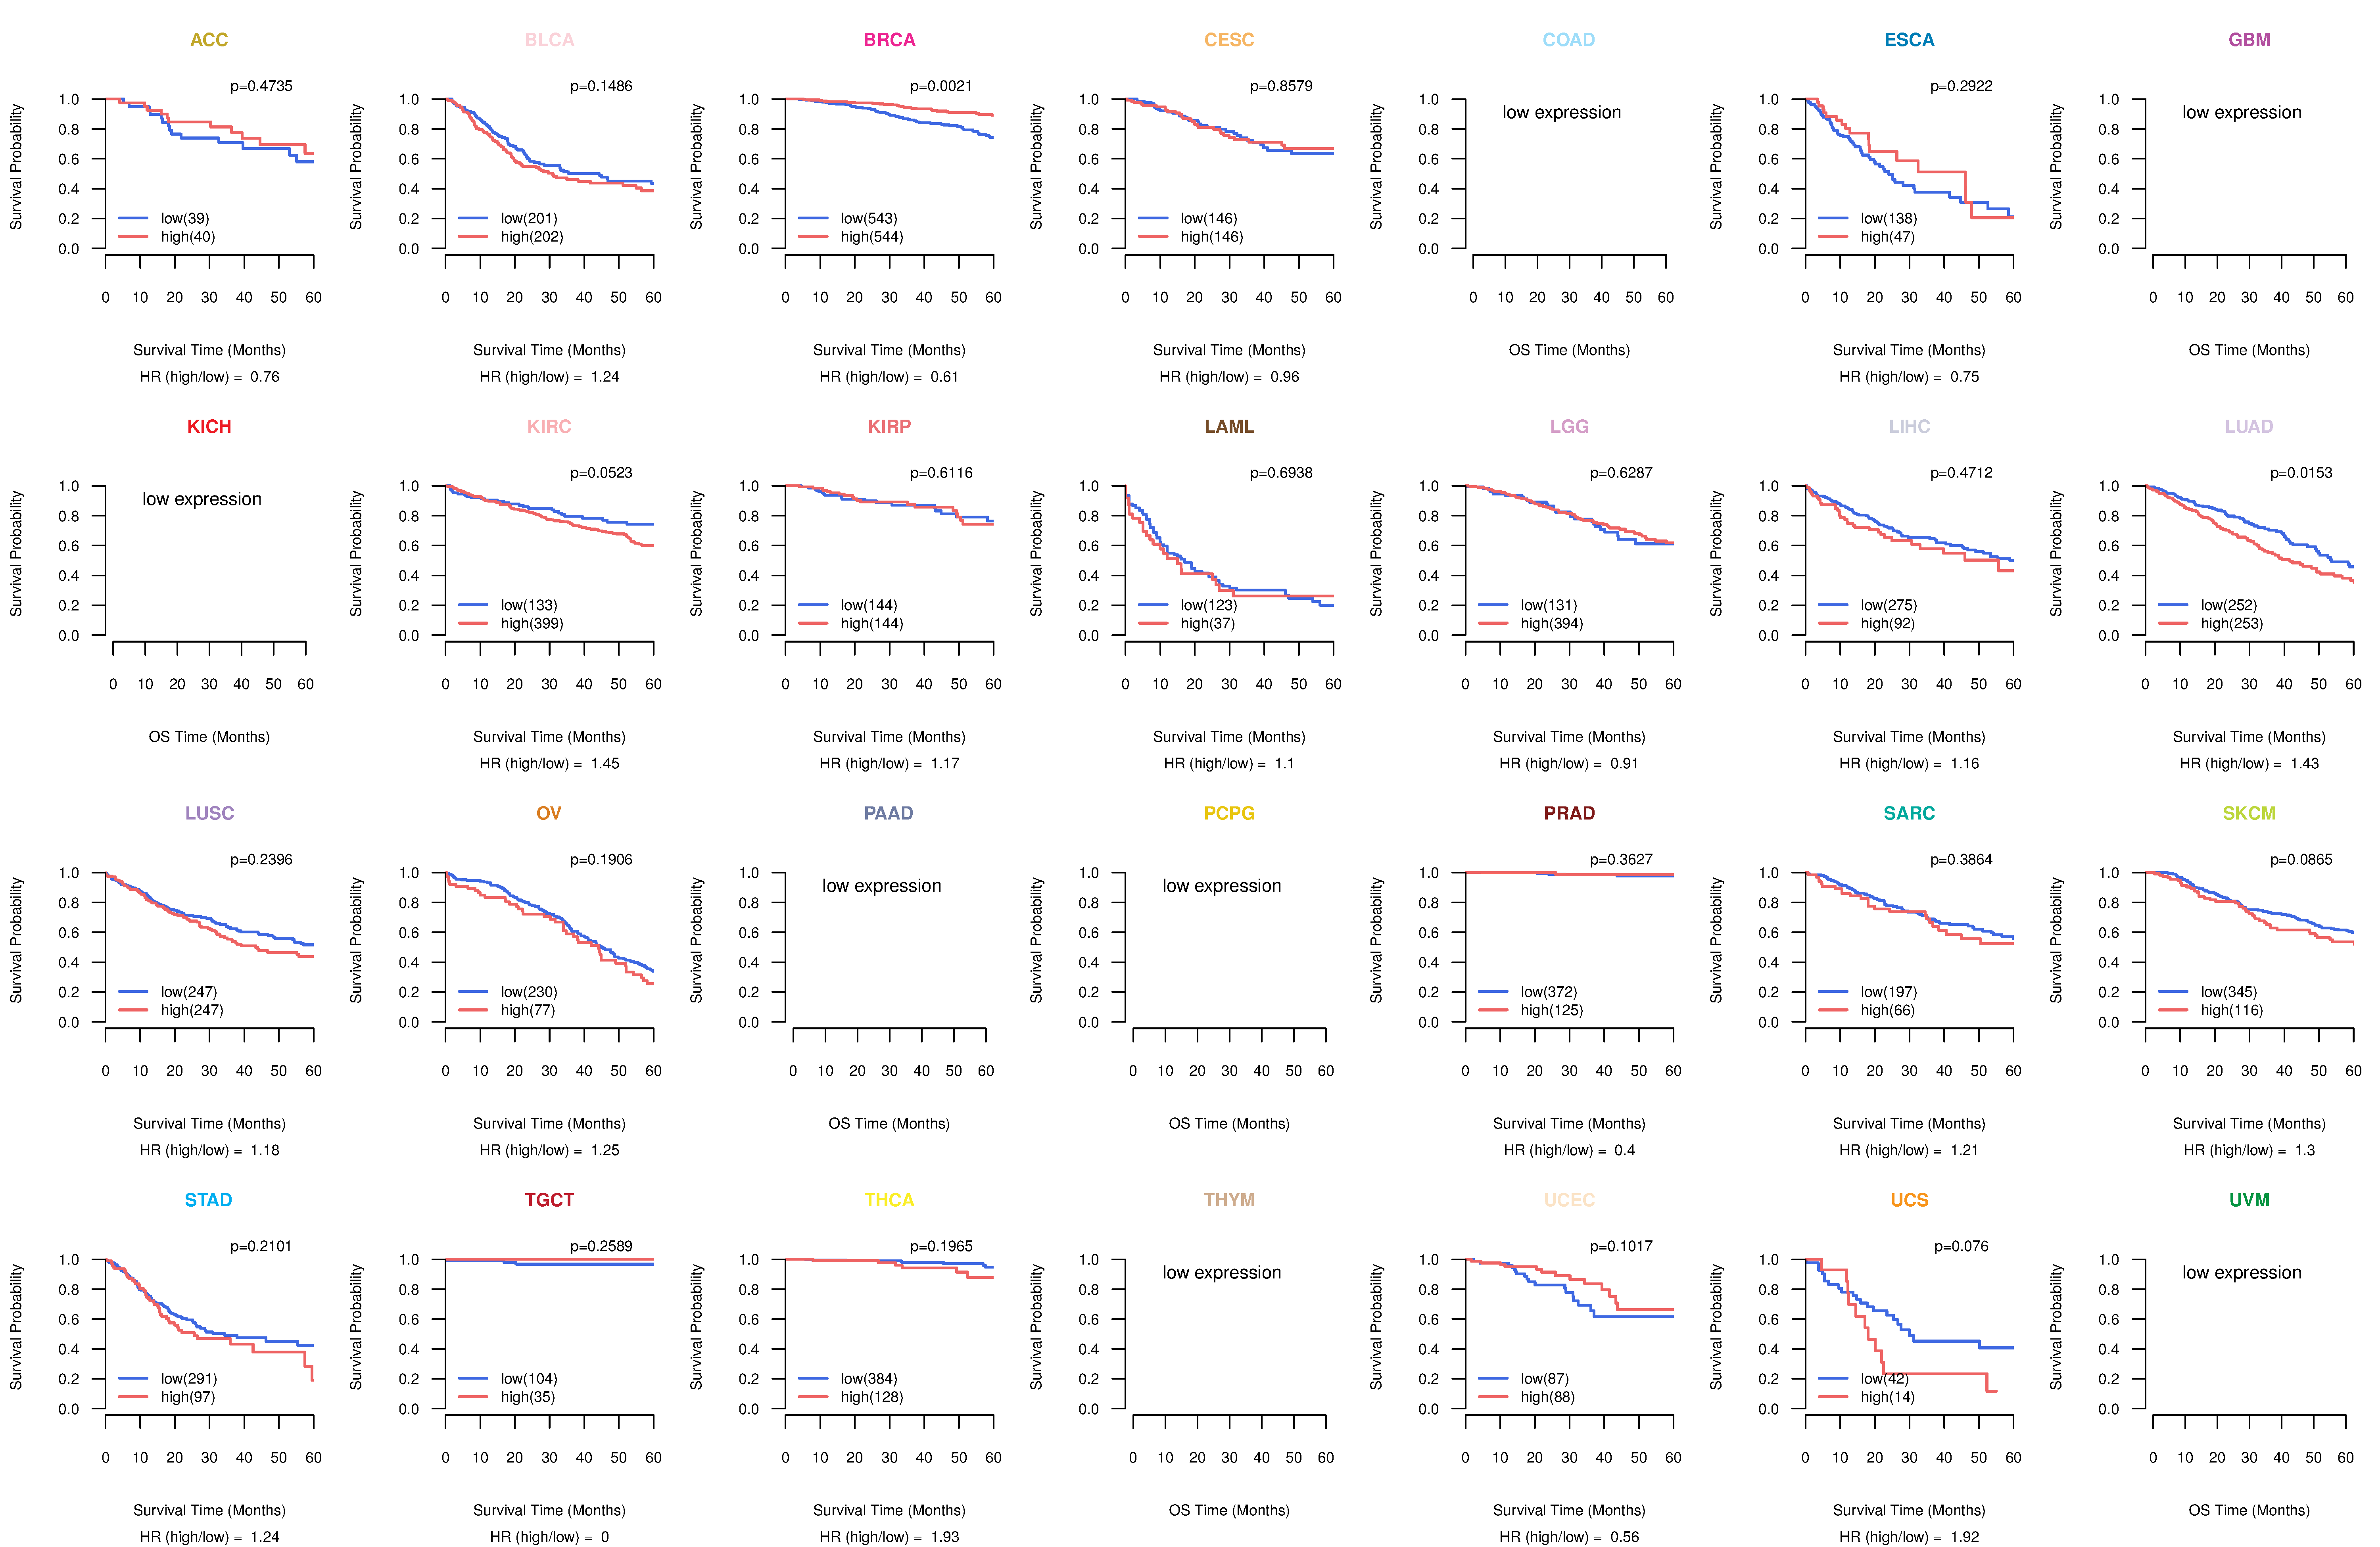
| Kaplan-Meier plots with logrank tests of overall survival (OS) using 28 cancer types (TCGA IlluminaHiSeq_RNASeqV2, pan-cancer normalized log2(norm_counts+1) data, version 2016-08-16) (TCGA clinicalMatrix, phenotype data, version 2016-04-27) * Click on the image to enlarge it in a new window. |
 |
| Kaplan-Meier plots with logrank test of relapse free survival (RFS) using 28 cancer types (TCGA IlluminaHiSeq_RNASeqV2, pan-cancer normalized log2(norm_counts+1) data, version 2016-08-16) (TCGA clinicalMatrix, phenotype data, version 2016-04-27) * Click on the image enlarge it in a new window. |
 |
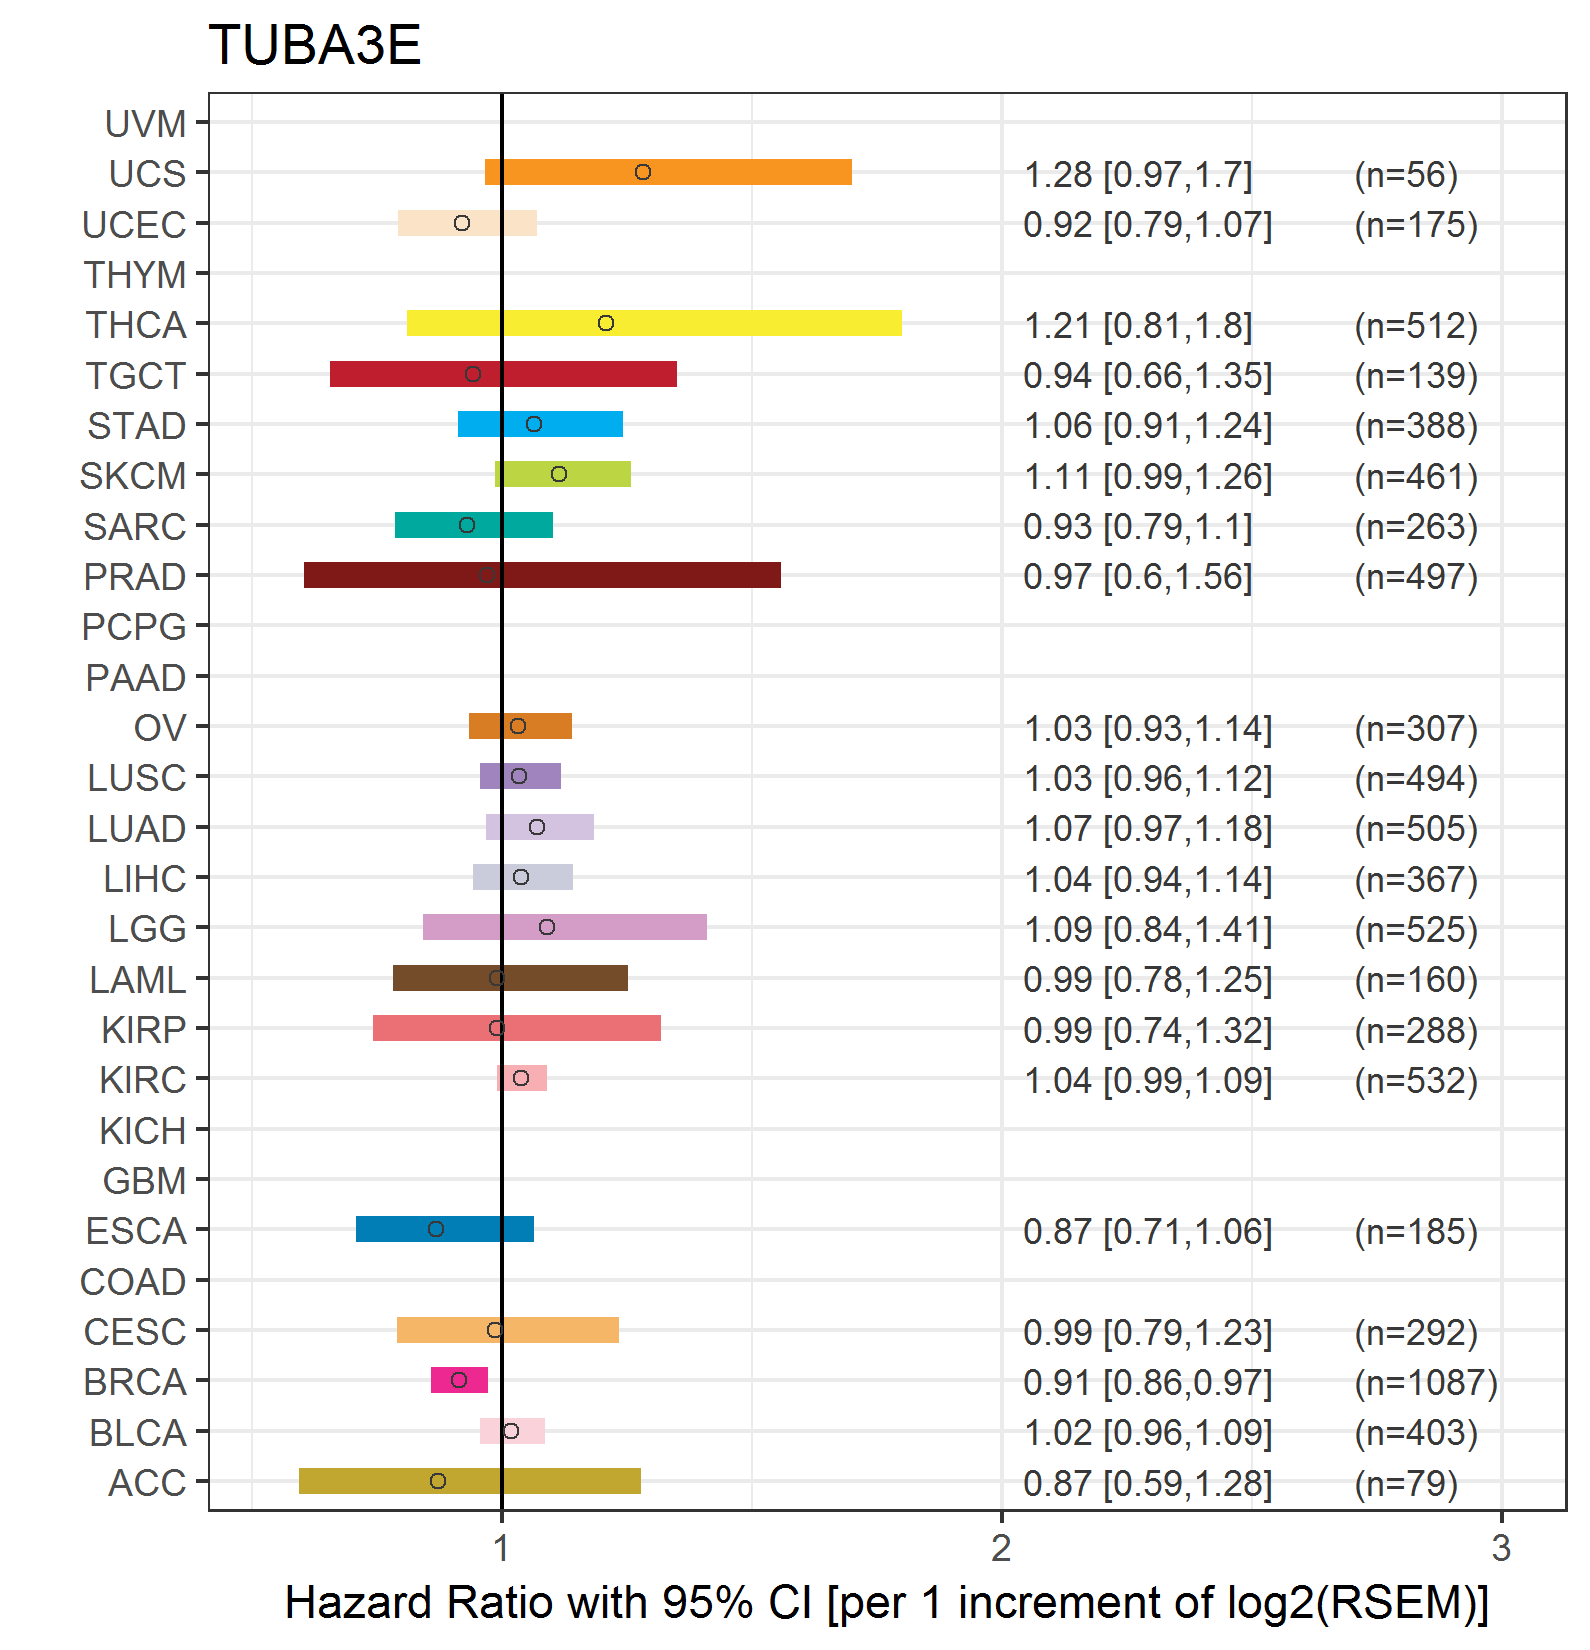
| Forest plot of Cox proportional hazard ratio (HR) and 95% CI of overall survival (OS) using 28 cancer types (TCGA IlluminaHiSeq_RNASeqV2, pan-cancer normalized log2(norm_counts+1) data, version 2016-08-16) (TCGA clinicalMatrix, phenotype data, version 2016-04-27) * Click on the image enlarge it in a new window. |
 |
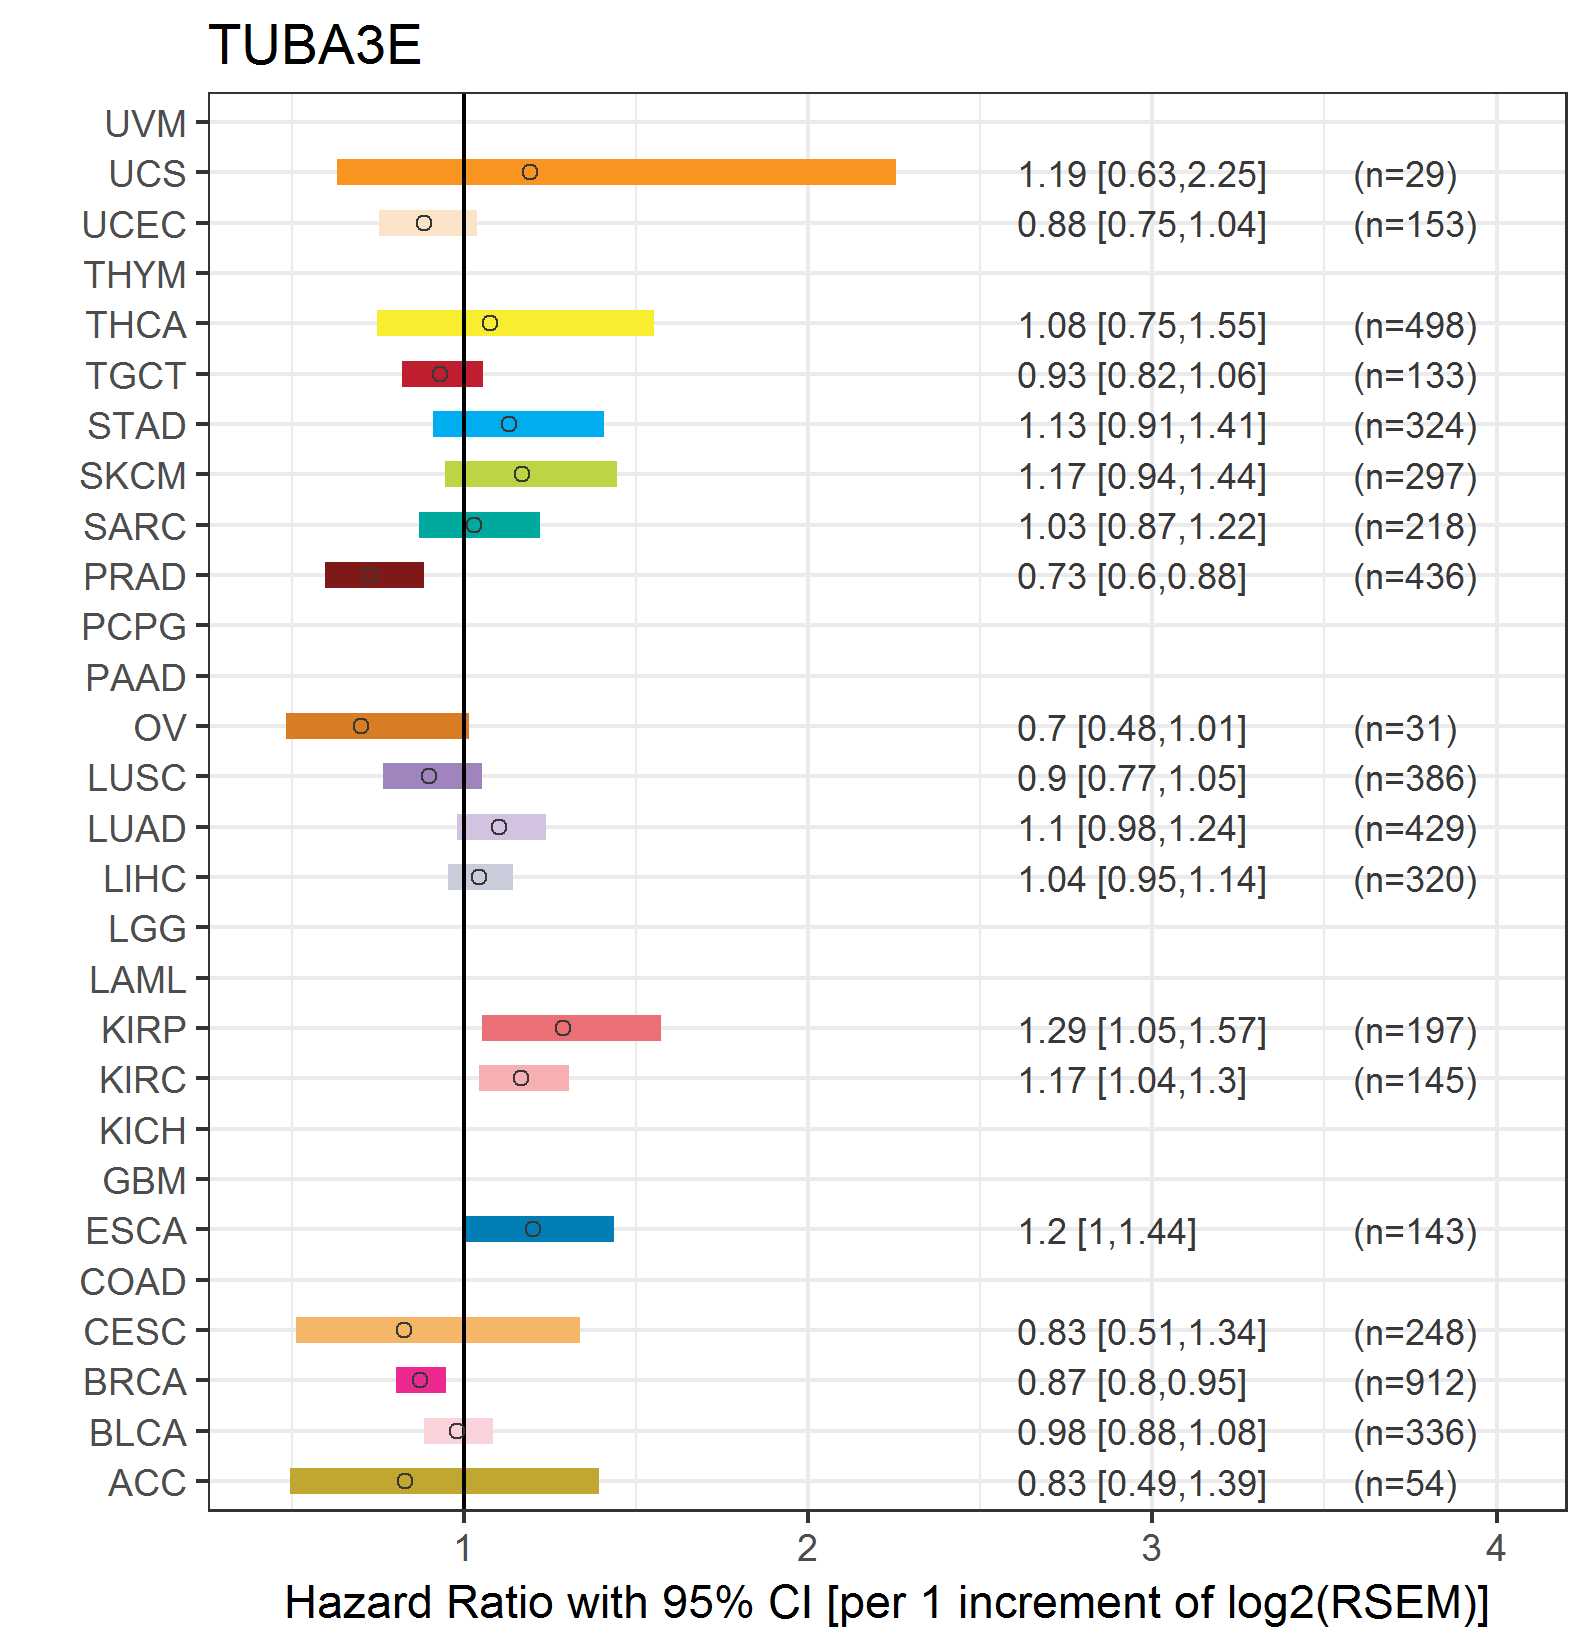
| Forest plot of Cox proportional hazard ratio (HR) and 95% CI of relapse free survival (RFS) using 28 cancer types (TCGA IlluminaHiSeq_RNASeqV2, pan-cancer normalized log2(norm_counts+1) data, version 2016-08-16) (TCGA clinicalMatrix, phenotype data, version 2016-04-27) * Click on the image enlarge it in a new window. |
 |
| Top |
| TissGeneClin for TUBA3E |
| TissGeneDrug for TUBA3E |
| Drug information targeting TissGene (DrugBank Version 5.0.6, 2017-04-01) |
| DrugBank ID | Drug name | Drug activity | Drug type | Drug status |
| Top |
| TissGeneDisease for TUBA3E |
| Disease information associated with TissGene (DisGeNet, 2016-06-01) |
| Disease ID | Disease name | # pubmeds | Source |
|
Copyright 2016-Present - The University of Texas Health Science Center at Houston (UTHealth) Web File Viewing | How to Report, Fraud, Waste and Abuse | State of Texas | Statewide Search | Texas Homeland Security | Site Policies |