 |
| |
| |
| |
| |
| |
| |
|

| TissGeneSummary for OIP5 |
 Gene summary Gene summary |
| Basic gene information | Gene symbol | OIP5 |
| Gene name | Opa interacting protein 5 | |
| Synonyms | 5730547N13Rik|CT86|LINT-25|MIS18B|MIS18beta|hMIS18beta | |
| Cytomap | UCSC genome browser: 15q15.1 | |
| Type of gene | protein-coding | |
| RefGenes | NM_007280.1, | |
| Description | LAP2alpha interactor-25MIS18 kinetochore protein homolog BOIP-5cancer/testis antigen 86opa-interacting protein 5protein Mis18-beta | |
| Modification date | 20141207 | |
| dbXrefs | MIM : 606020 | |
| HGNC : HGNC | ||
| Ensembl : ENSG00000104147 | ||
| HPRD : 09352 | ||
| Vega : OTTHUMG00000130251 | ||
| Protein | UniProt: go to UniProt's Cross Reference DB Table | |
| Expression | CleanEX: HS_OIP5 | |
| BioGPS: 11339 | ||
| Pathway | NCI Pathway Interaction Database: OIP5 | |
| KEGG: OIP5 | ||
| REACTOME: OIP5 | ||
| Pathway Commons: OIP5 | ||
| Context | iHOP: OIP5 | |
| ligand binding site mutation search in PubMed: OIP5 | ||
| UCL Cancer Institute: OIP5 | ||
| Assigned class in TissGDB* | C | |
| Included tissue-specific gene expression resources | HPA,GTEx | |
| Specific-tissues in normal samples (assigned by TissGDB using HPA, TiGER, and GTEx) | Testis | |
| Cancer types related to the specific-tissues in cancer samples (assigned by TissGDB using TCGA) | TGCT | |
| Reference showing the relevant tissue of OIP5 | ||
| Description by TissGene annotations | Have significant anti-correlated miRNA | |
| * Class A consists of genes with literature evidence and is part of the cTissGenes. Class B consists of only cTissGenes without additional evidence. The remaining genes belong to Class C. |
| Gene ontology having evidence of Inferred from Direct Assay (IDA) from Entrez |
| GO ID | GO term | PubMed ID |
| Top |
| TissGeneExp for OIP5 |
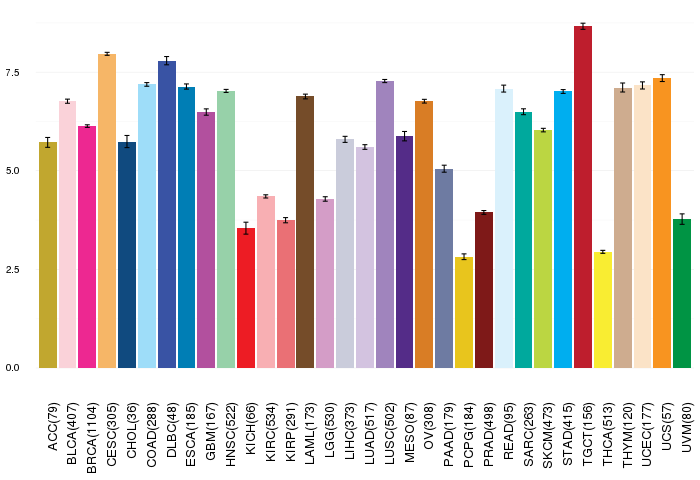
| Gene expressions across 28 cancer types (X-axis: cancer type and Y-axis: log2(norm_counts+1)) (TCGA IlluminaHiSeq_RNASeqV2, pan-cancer normalized log2(norm_counts+1) data, version 2016-08-16) |
 |
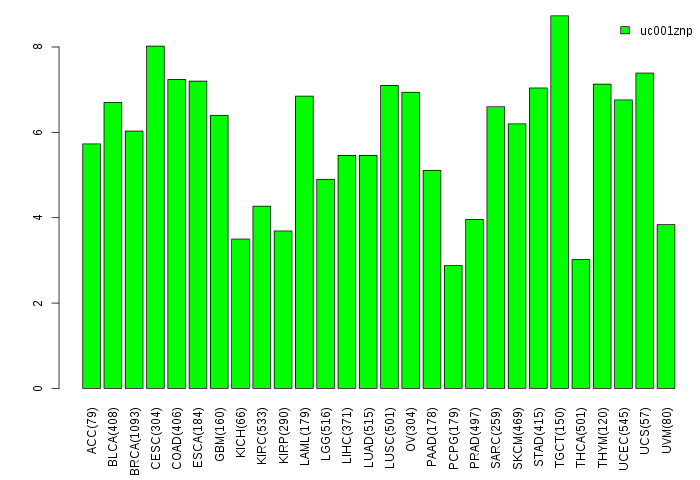
| Gene isoform expressions across 28 cancer types (X-axis: cancer type and Y-axis: log2(norm_counts+1)) (TCGA pan-cancer tcga_rsem_isoform_tpm, version 2016-09-01) |
 |
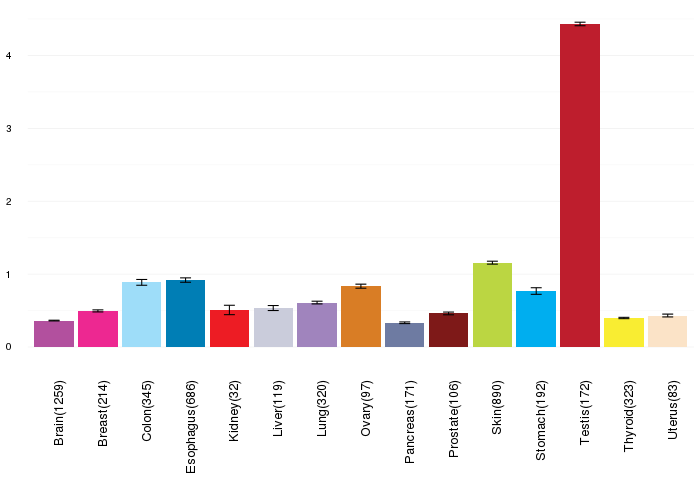
| Gene expressions across normal tissues of GTEx data (GTEx GTEx_Analysis_v6_RNA-seq_RNA-SeQCv1.1.8_gene_rpkm.gct) - Here, we shows the matched tissue types only among our 28 cancer types. |
 |
| Different expressions across 14 cancer types with more than 10 samples between matched tumors and normals (X-axis: cancer type and Y-axis: log2(norm_counts+1)) (TCGA IlluminaHiSeq_RNASeqV2, pan-cancer normalized log2(norm_counts+1) data, version 2016-08-16) |
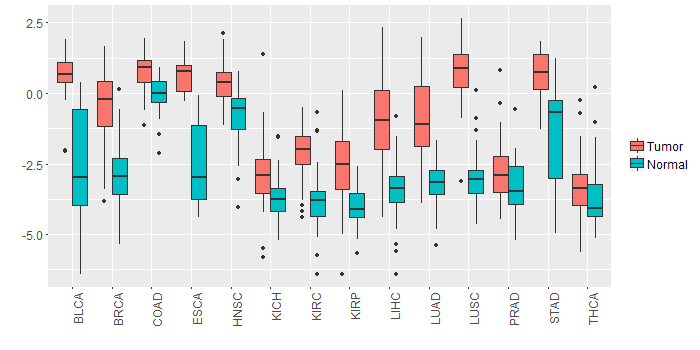 |
| - Significantly differentially expressed cancer types and information. (|Fold change|>1 and FDR<0.05) |
| Cancer type | Mean(exp) in tumor | Mean(exp) in matched normal | Log2FC | P-val. | FDR |
| BLCA | 0.482152503 | -2.545889602 | 3.028042105 | 3.97E-06 | 9.76E-05 |
| HNSC | 0.349901708 | -0.79773085 | 1.147632558 | 7.02E-09 | 8.97E-08 |
| STAD | 0.653396911 | -1.385531214 | 2.038928125 | 4.59E-07 | 8.82E-06 |
| KIRP | -2.558362464 | -4.064146839 | 1.505784375 | 1.57E-06 | 7.64E-06 |
| LUSC | 0.796841152 | -3.024090221 | 3.820931373 | 2.20E-36 | 4.13E-34 |
| LIHC | -1.000954339 | -3.452194339 | 2.45124 | 9.80E-15 | 2.83E-13 |
| LUAD | -0.868008477 | -3.166660201 | 2.298651724 | 1.91E-18 | 2.78E-17 |
| BRCA | -0.344597497 | -2.939506268 | 2.594908772 | 2.39E-47 | 1.28E-45 |
| KIRC | -2.039744061 | -3.859617672 | 1.819873611 | 1.07E-23 | 1.14E-22 |
| ESCA | 0.619688389 | -2.418975248 | 3.038663636 | 5.01E-05 | 0.002025862 |
| Top |
| TissGene-miRNA for OIP5 |
| Significantly anti-correlated miRNAs of TissGene across 28 cancer types (Gene-miRNA relations from TargetScanHuman Relsease 7.1, Conserved_Site_Context_Scores.txt.zip, 06.01.2016) (TCGA IlluminaHiSeq_miRNASeq, log2(RPM+1) data, version 2016-11-21) (TCGA IlluminaHiSeq_RNASeqV2, log2(normalized_count+1) data, version 2016-08-16) (Spearman’s Rank Correlation (p-value<0.05 and coefficient<-0.25)) |
| Cancer type | miRNA id | miRNA accession | P-val. | Coeff. | # samples |
| LUAD | hsa-miR-107 | MIMAT0000104 | 0.0012 | -0.41 | 60 |
| Top |
| TissGeneMut for OIP5 |
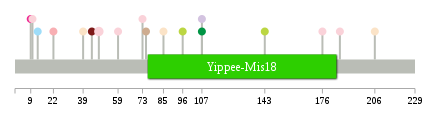
| TissGeneSNV for OIP5 |
| nsSNV counts per each loci. Different colors of circles represent different cancer types. Circle size denotes number of samples. (TCGA somatic mutation (SNPs and small INDELs) data, version 2016-04-25) * Click on the image to enlarge it in a new window. |
 |
 |
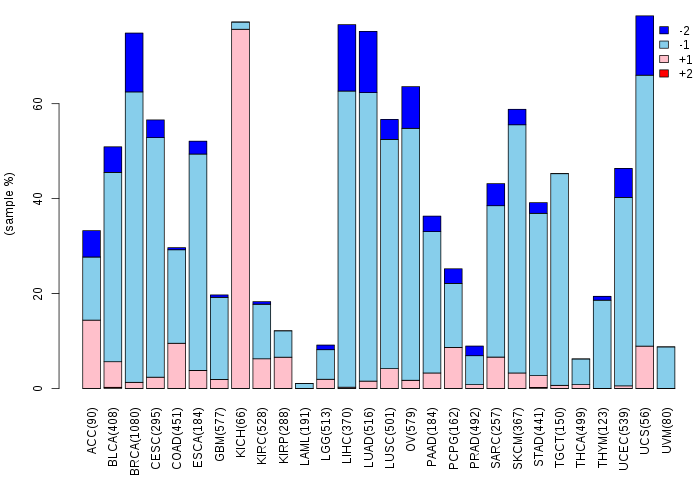
| Somatic nucleotide variants of TissGene across 28 cancer types (X-axis: cancer type and Y-axis: % of mutated samples) The numbers in parentheses are numbers of samples with mutation (nsSNVs). (TCGA somatic mutation (SNPs and small INDELs) data, version 2016-04-25) |
 |
| - nsSNVs sorted by frequency. |
| AAchange | Cancer type | # samples |
| p.S48L | BLCA | 2 |
| p.E73D | BLCA | 1 |
| p.E59K | BLCA | 1 |
| p.T176A | BLCA | 1 |
| p.A85V | UCEC | 1 |
| p.W39* | UCEC | 1 |
| p.G22V | KIRC | 1 |
| p.V44M | PRAD | 1 |
| p.D96N | SKCM | 1 |
| p.S212L | HNSC | 1 |
| p.C75* | THYM | 1 |
| p.S107F | LUAD | 1 |
| p.D186N | BLCA | 1 |
| p.T206M | UCEC | 1 |
| p.A13T | COAD | 1 |
| p.R9G | BRCA | 1 |
| p.S10* | BLCA | 1 |
| p.S107C | UVM | 1 |
| p.P143S | SKCM | 1 |
| Top |
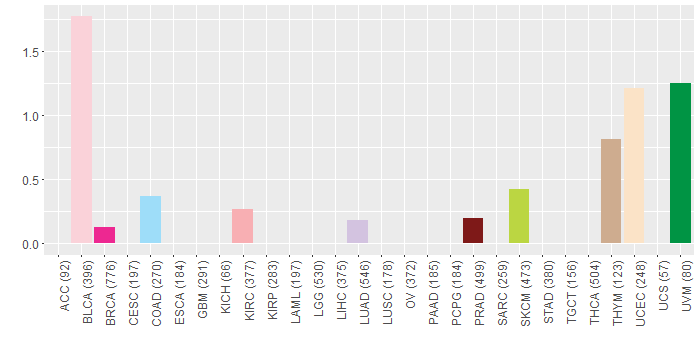
| TissGeneCNV for OIP5 |
| Copy number variations of TissGene across 28 cancer types (X-axis: cancer type and Y-axis: % of CNV samples) (TCGA Gistic2_CopyNumber_Gistic2_all_data_by_genes, Gistic2 copy number data, version 2016-08-16) |
 |
| Top |
| TissGeneFusions for OIP5 |
| Fusion genes including TissGene (ChimerDB 3.0, 2016-12-01 and TCGA fusion Portal 2015-12-01) |
| Database | Src | Cancer type | Sample | Fusion gene | ORF | 5'-gene BP | 3'-gene BP |
| Chimerdb3.0 | ChiTaRs | NA | BE080901 | PCNP-OIP5 | chr3:101307542 | chr15:41614146 | |
| TCGAfusionPortal | PRADA | BRCA | TCGA-AN-A0AM-01A | OIP5-NUSAP1 | Out-of-frame | Chr15:41611856 | Chr15:41657600 |
| TCGAfusionPortal | PRADA | BRCA | TCGA-JL-A3YX-01A | MYO5A-OIP5 | In-frame | Chr15:52689398 | Chr15:41611978 |
| Top |
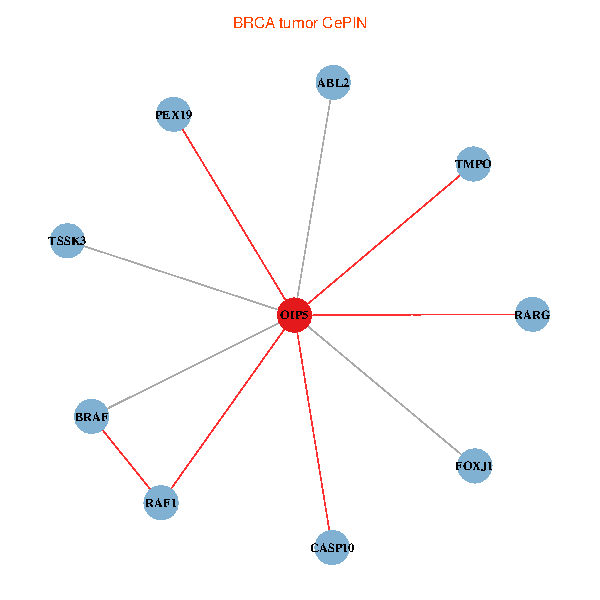
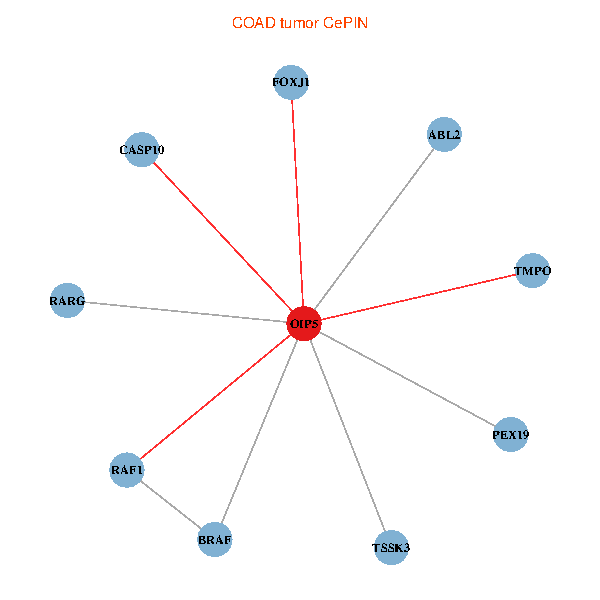
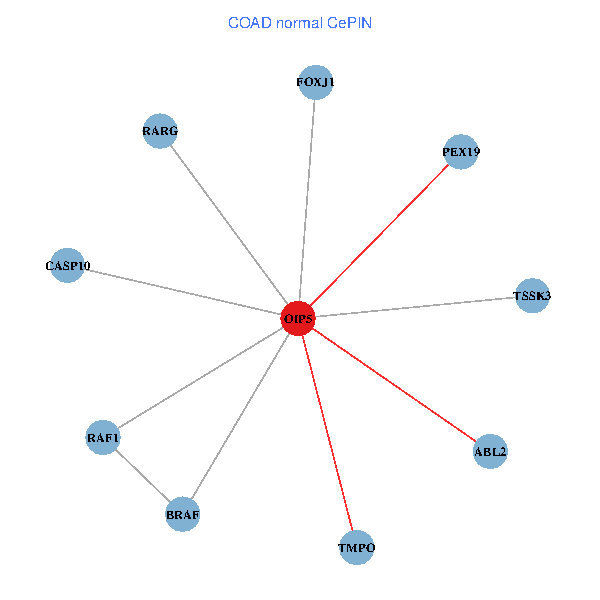
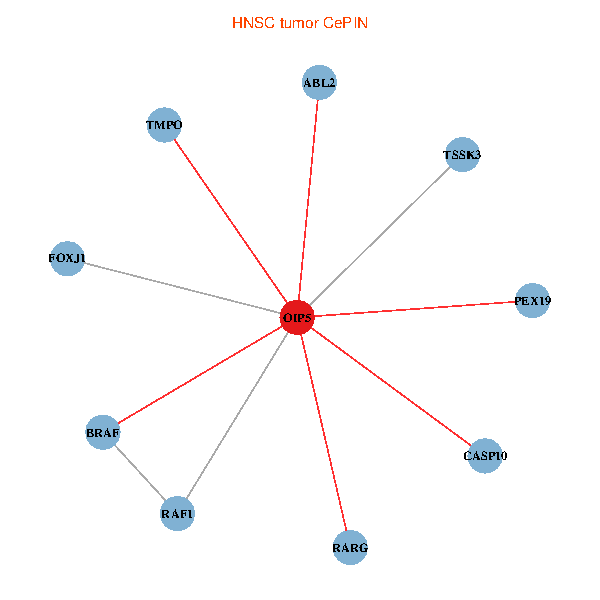
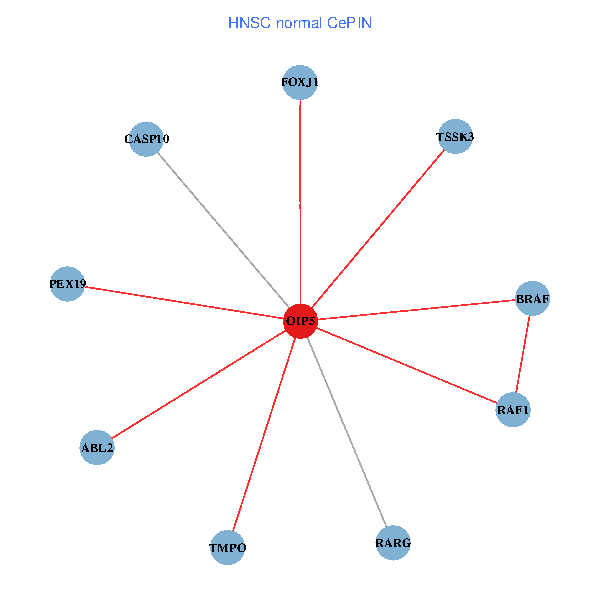
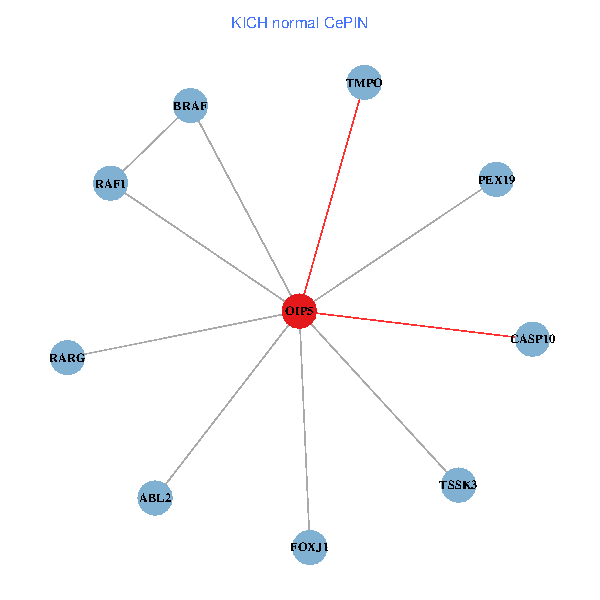
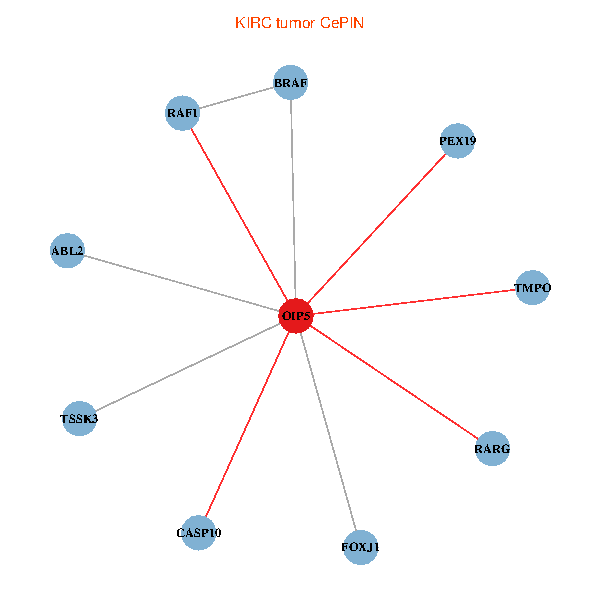
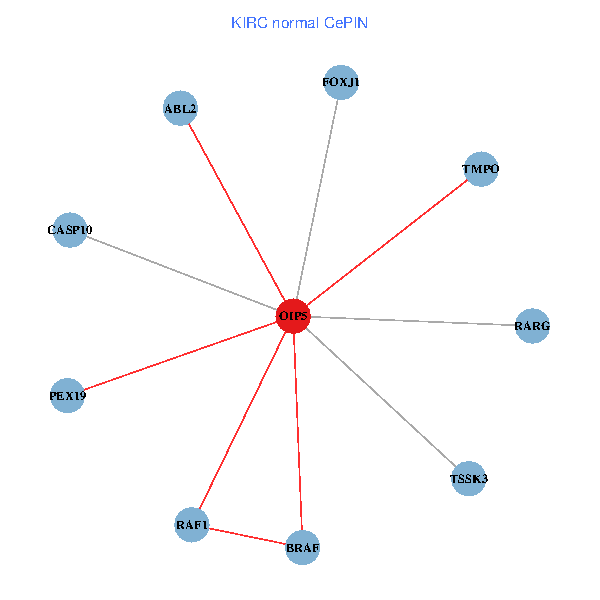
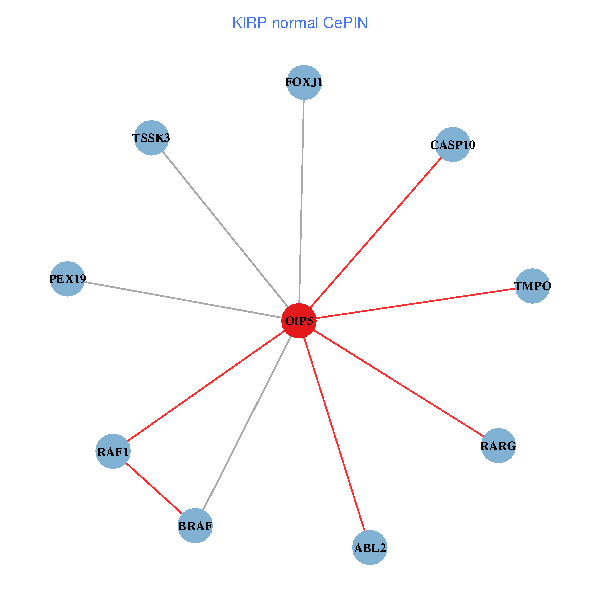
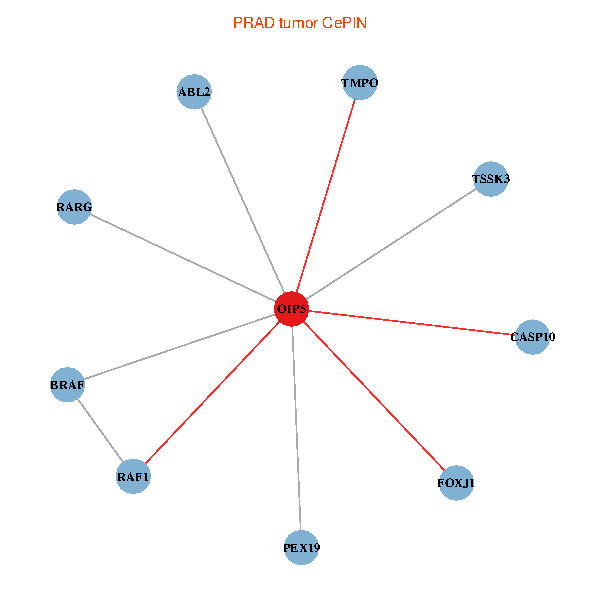
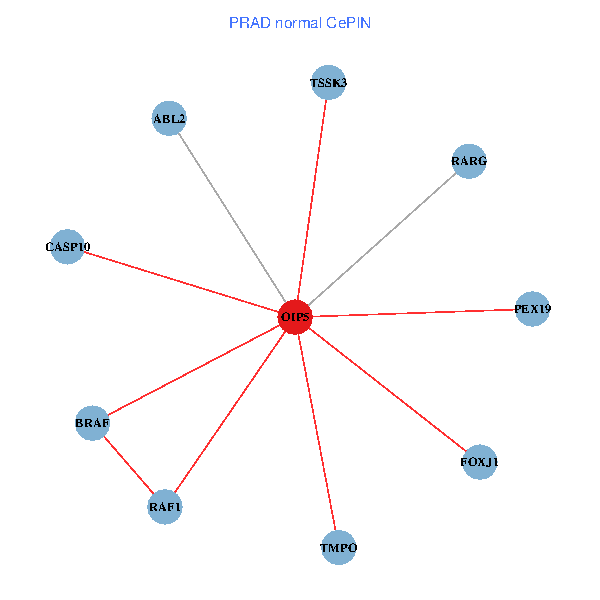
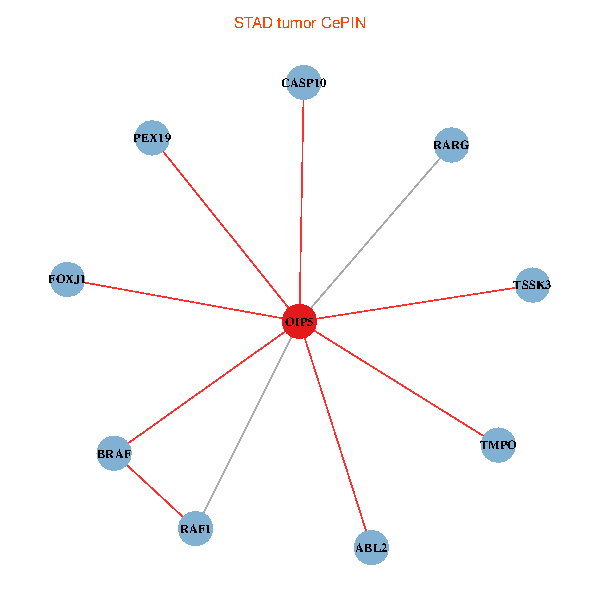
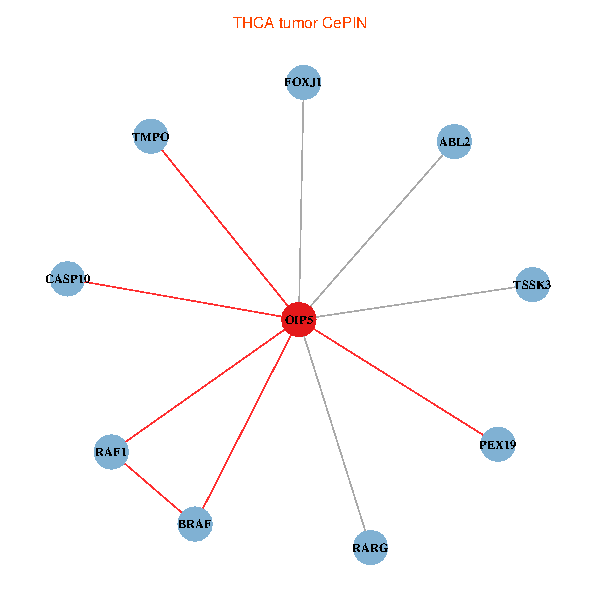
| TissGeneNet for OIP5 |
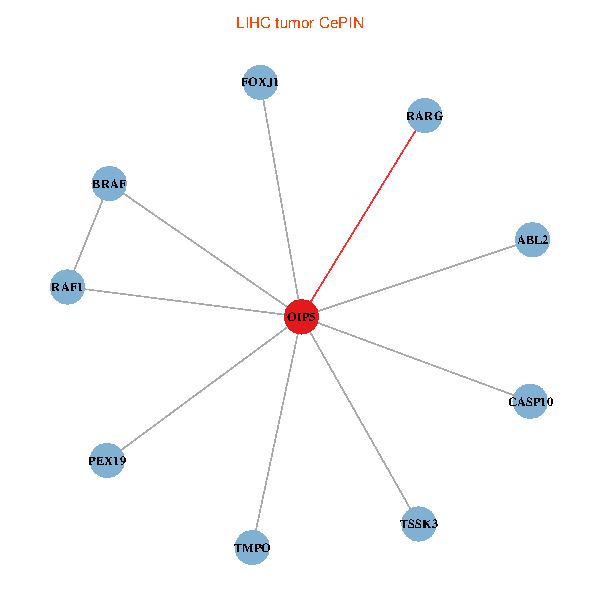
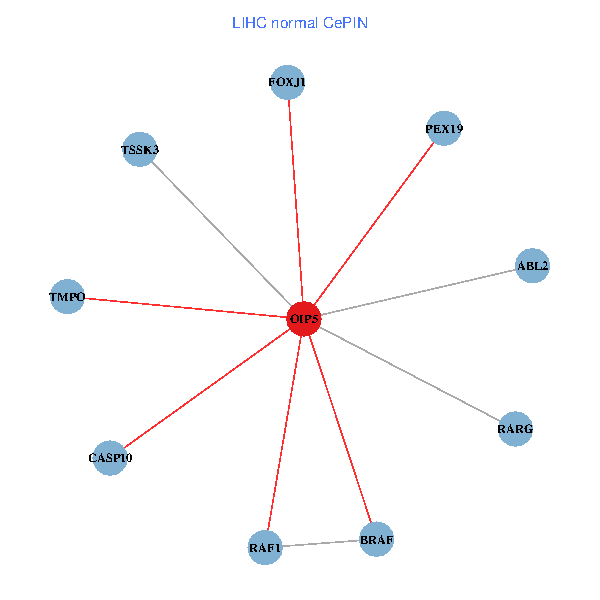
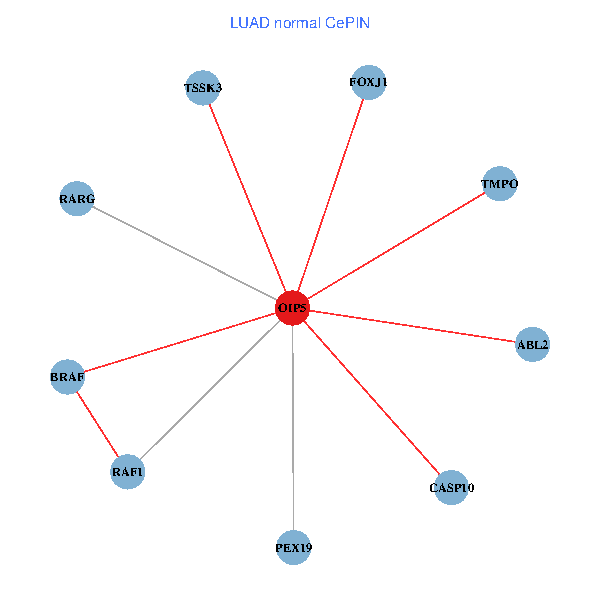
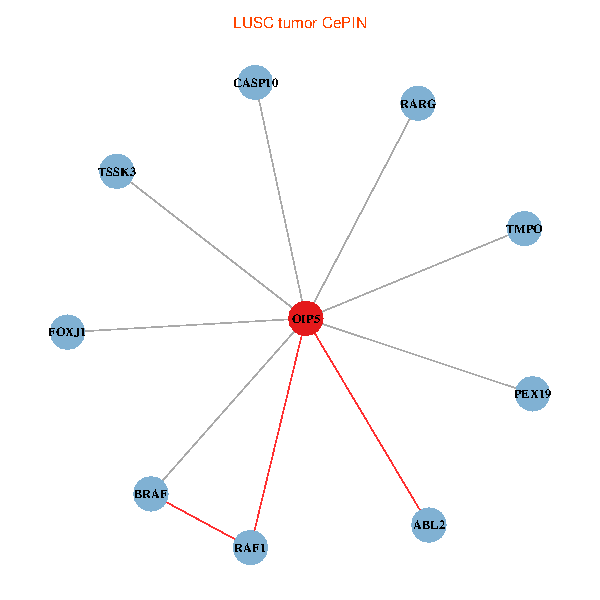
| Co-expressed gene networks based on protein-protein interaction data (CePIN) (TCGA IlluminaHiSeq_RNASeqV2, pan-cancer normalized log2(norm_counts+1) data, version 2016-08-16) (PINA2 ppi data) |
| BRCA (tumor) | BRCA (normal) |
| OIP5, CASP10, RAF1, PEX19, BRAF, RARG, TMPO, FOXJ1, ABL2, TSSK3 (tumor) | OIP5, CASP10, RAF1, PEX19, BRAF, RARG, TMPO, FOXJ1, ABL2, TSSK3 (normal) |
 |  |
| COAD (tumor) | COAD (normal) |
| OIP5, CASP10, RAF1, PEX19, BRAF, RARG, TMPO, FOXJ1, ABL2, TSSK3 (tumor) | OIP5, CASP10, RAF1, PEX19, BRAF, RARG, TMPO, FOXJ1, ABL2, TSSK3 (normal) |
 |  |
| HNSC (tumor) | HNSC (normal) |
| OIP5, CASP10, RAF1, PEX19, BRAF, RARG, TMPO, FOXJ1, ABL2, TSSK3 (tumor) | OIP5, CASP10, RAF1, PEX19, BRAF, RARG, TMPO, FOXJ1, ABL2, TSSK3 (normal) |
 |  |
| KICH (tumor) | KICH (normal) |
| OIP5, CASP10, RAF1, PEX19, BRAF, RARG, TMPO, FOXJ1, ABL2, TSSK3 (tumor) | OIP5, CASP10, RAF1, PEX19, BRAF, RARG, TMPO, FOXJ1, ABL2, TSSK3 (normal) |
 |  |
| KIRC (tumor) | KIRC (normal) |
| OIP5, CASP10, RAF1, PEX19, BRAF, RARG, TMPO, FOXJ1, ABL2, TSSK3 (tumor) | OIP5, CASP10, RAF1, PEX19, BRAF, RARG, TMPO, FOXJ1, ABL2, TSSK3 (normal) |
 |  |
| KIRP (tumor) | KIRP (normal) |
| OIP5, CASP10, RAF1, PEX19, BRAF, RARG, TMPO, FOXJ1, ABL2, TSSK3 (tumor) | OIP5, CASP10, RAF1, PEX19, BRAF, RARG, TMPO, FOXJ1, ABL2, TSSK3 (normal) |
 |  |
| LIHC (tumor) | LIHC (normal) |
| OIP5, CASP10, RAF1, PEX19, BRAF, RARG, TMPO, FOXJ1, ABL2, TSSK3 (tumor) | OIP5, CASP10, RAF1, PEX19, BRAF, RARG, TMPO, FOXJ1, ABL2, TSSK3 (normal) |
 |  |
| LUAD (tumor) | LUAD (normal) |
| OIP5, CASP10, RAF1, PEX19, BRAF, RARG, TMPO, FOXJ1, ABL2, TSSK3 (tumor) | OIP5, CASP10, RAF1, PEX19, BRAF, RARG, TMPO, FOXJ1, ABL2, TSSK3 (normal) |
 |  |
| LUSC (tumor) | LUSC (normal) |
| OIP5, CASP10, RAF1, PEX19, BRAF, RARG, TMPO, FOXJ1, ABL2, TSSK3 (tumor) | OIP5, CASP10, RAF1, PEX19, BRAF, RARG, TMPO, FOXJ1, ABL2, TSSK3 (normal) |
 |  |
| PRAD (tumor) | PRAD (normal) |
| OIP5, CASP10, RAF1, PEX19, BRAF, RARG, TMPO, FOXJ1, ABL2, TSSK3 (tumor) | OIP5, CASP10, RAF1, PEX19, BRAF, RARG, TMPO, FOXJ1, ABL2, TSSK3 (normal) |
 |  |
| STAD (tumor) | STAD (normal) |
| OIP5, CASP10, RAF1, PEX19, BRAF, RARG, TMPO, FOXJ1, ABL2, TSSK3 (tumor) | OIP5, CASP10, RAF1, PEX19, BRAF, RARG, TMPO, FOXJ1, ABL2, TSSK3 (normal) |
 |  |
| THCA (tumor) | THCA (normal) |
| OIP5, CASP10, RAF1, PEX19, BRAF, RARG, TMPO, FOXJ1, ABL2, TSSK3 (tumor) | OIP5, CASP10, RAF1, PEX19, BRAF, RARG, TMPO, FOXJ1, ABL2, TSSK3 (normal) |
 |  |
| Top |
| TissGeneProg for OIP5 |
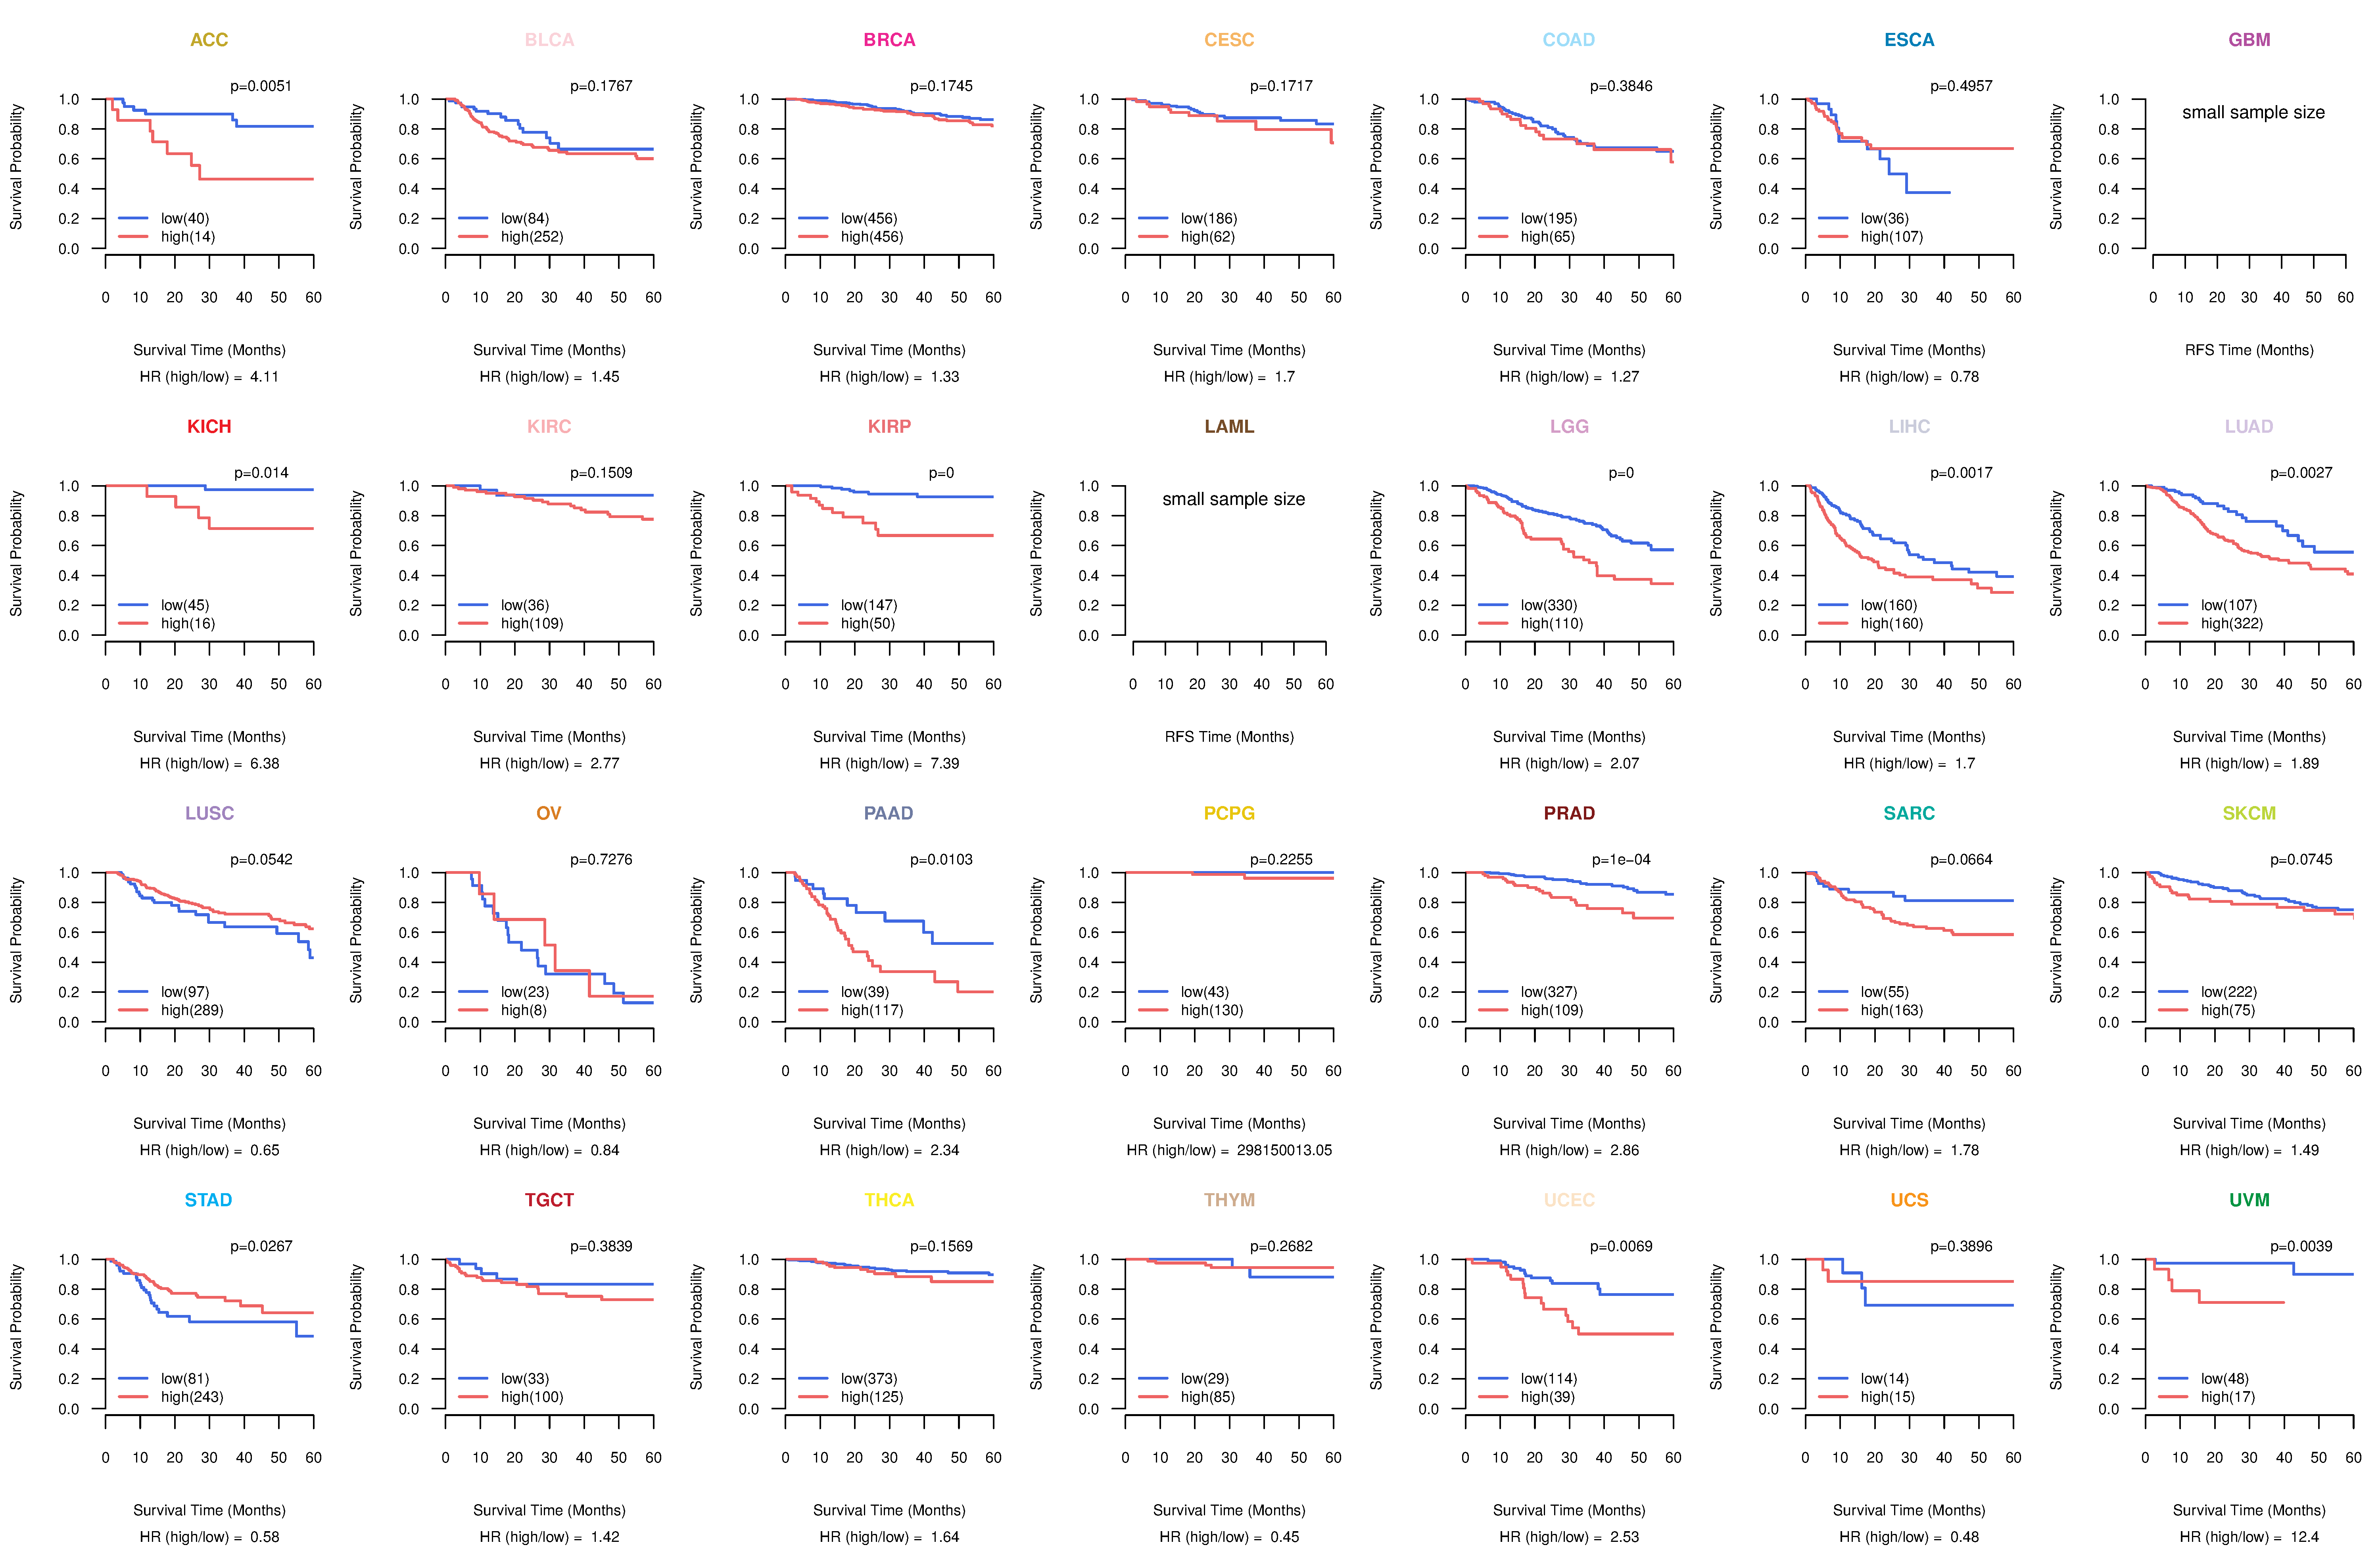
| Kaplan-Meier plots with logrank tests of overall survival (OS) using 28 cancer types (TCGA IlluminaHiSeq_RNASeqV2, pan-cancer normalized log2(norm_counts+1) data, version 2016-08-16) (TCGA clinicalMatrix, phenotype data, version 2016-04-27) * Click on the image to enlarge it in a new window. |
 |
| Kaplan-Meier plots with logrank test of relapse free survival (RFS) using 28 cancer types (TCGA IlluminaHiSeq_RNASeqV2, pan-cancer normalized log2(norm_counts+1) data, version 2016-08-16) (TCGA clinicalMatrix, phenotype data, version 2016-04-27) * Click on the image enlarge it in a new window. |
 |
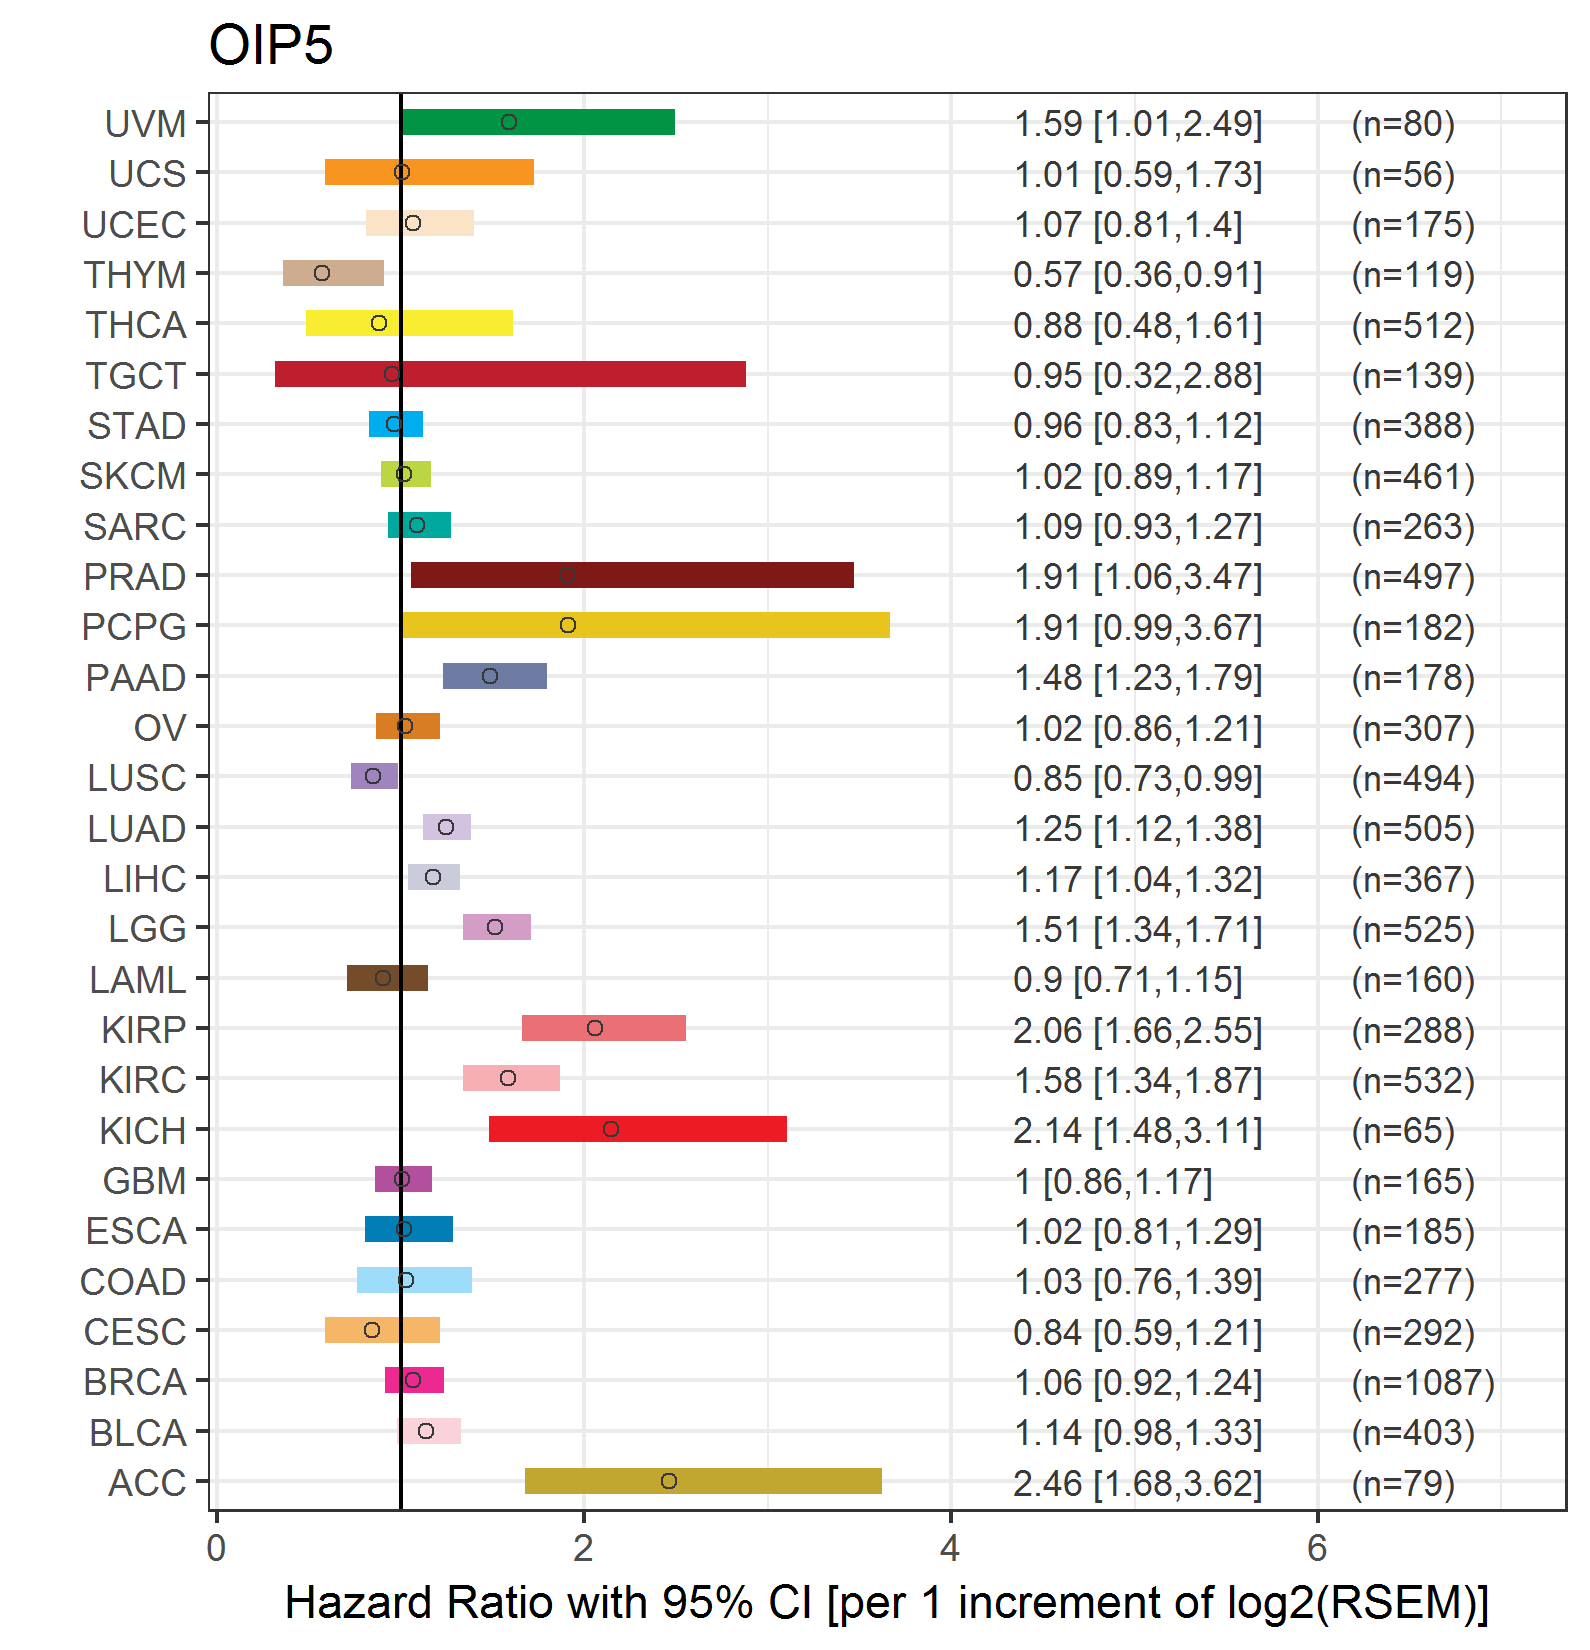
| Forest plot of Cox proportional hazard ratio (HR) and 95% CI of overall survival (OS) using 28 cancer types (TCGA IlluminaHiSeq_RNASeqV2, pan-cancer normalized log2(norm_counts+1) data, version 2016-08-16) (TCGA clinicalMatrix, phenotype data, version 2016-04-27) * Click on the image enlarge it in a new window. |
 |
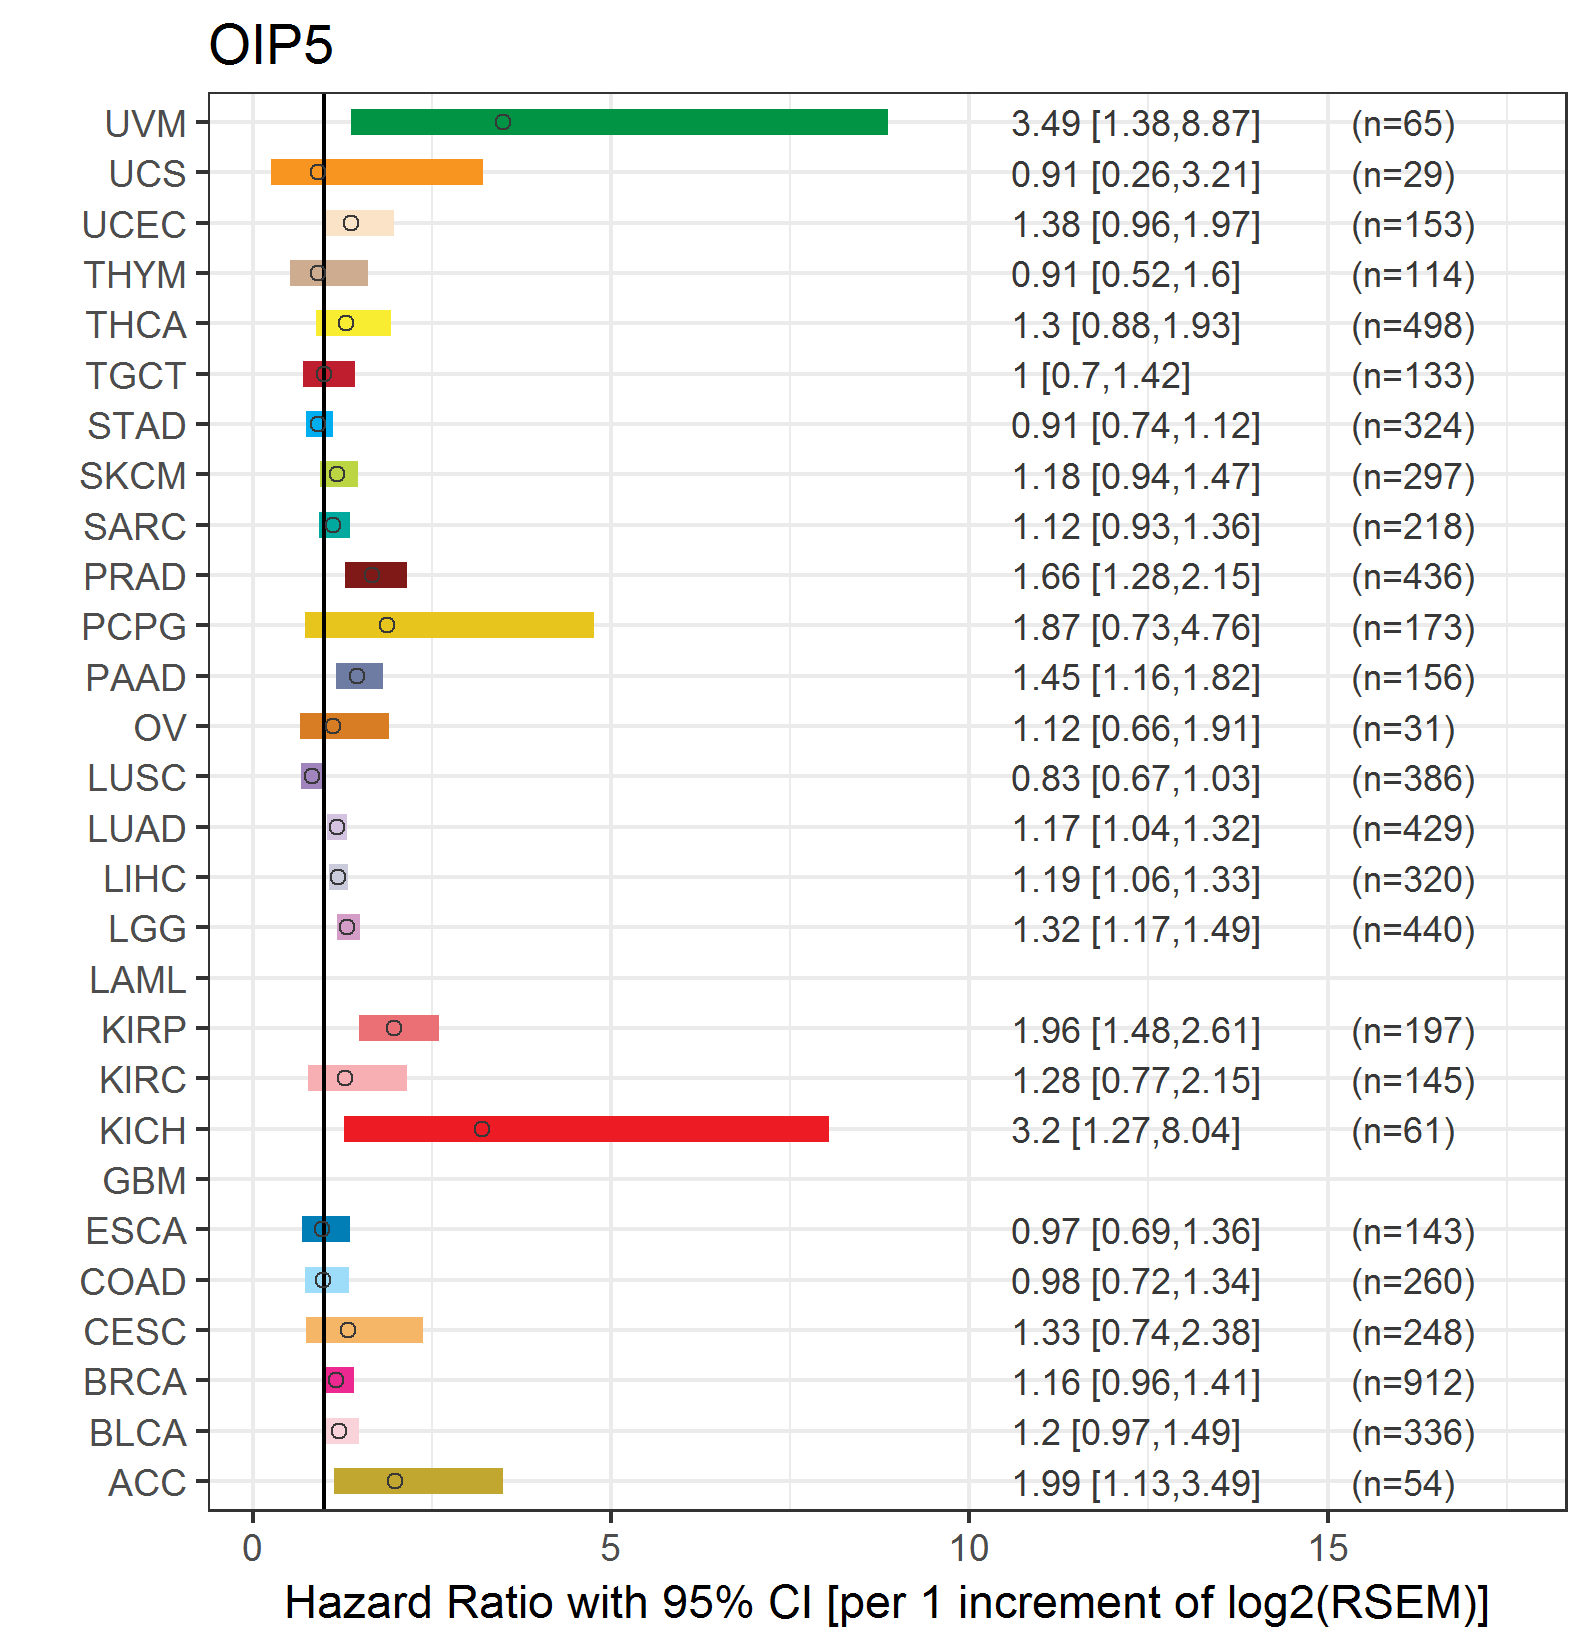
| Forest plot of Cox proportional hazard ratio (HR) and 95% CI of relapse free survival (RFS) using 28 cancer types (TCGA IlluminaHiSeq_RNASeqV2, pan-cancer normalized log2(norm_counts+1) data, version 2016-08-16) (TCGA clinicalMatrix, phenotype data, version 2016-04-27) * Click on the image enlarge it in a new window. |
 |
| Top |
| TissGeneClin for OIP5 |
| TissGeneDrug for OIP5 |
| Drug information targeting TissGene (DrugBank Version 5.0.6, 2017-04-01) |
| DrugBank ID | Drug name | Drug activity | Drug type | Drug status |
| Top |
| TissGeneDisease for OIP5 |
| Disease information associated with TissGene (DisGeNet, 2016-06-01) |
| Disease ID | Disease name | # pubmeds | Source |
| umls:C0596263 | Carcinogenesis | 3 | BeFree |
| umls:C0024623 | Malignant neoplasm of stomach | 2 | BeFree |
| umls:C0699791 | Stomach Carcinoma | 2 | BeFree |
| umls:C0007137 | Squamous cell carcinoma | 1 | BeFree |
| umls:C0014859 | Esophageal Neoplasms | 1 | BeFree |
| umls:C0017661 | IGA Glomerulonephritis | 1 | CTD_human |
| umls:C0028754 | Obesity | 1 | BeFree |
| umls:C0152018 | Esophageal carcinoma | 1 | BeFree |
| umls:C0242379 | Malignant neoplasm of lung | 1 | BeFree |
| umls:C0546837 | Malignant neoplasm of esophagus | 1 | BeFree |
|
Copyright 2016-Present - The University of Texas Health Science Center at Houston (UTHealth) Web File Viewing | How to Report, Fraud, Waste and Abuse | State of Texas | Statewide Search | Texas Homeland Security | Site Policies |